
- The average of S&P 500 for February 2022 was 4436 (5% down from December 2021 average) and is still 1896 points higher than the corresponding long-term trend value of 2540.
- A reversal to the long-trend would entail a 43% decline, possibly over a short period aggravated by the imminent S&P500 death cross.
- The Shiller CAPE-ratio is at a level of 35.9 (down 7.2% from its recent peak of 38.7). That is 41% higher than its 35-year moving average (MA35), currently at 25.5.
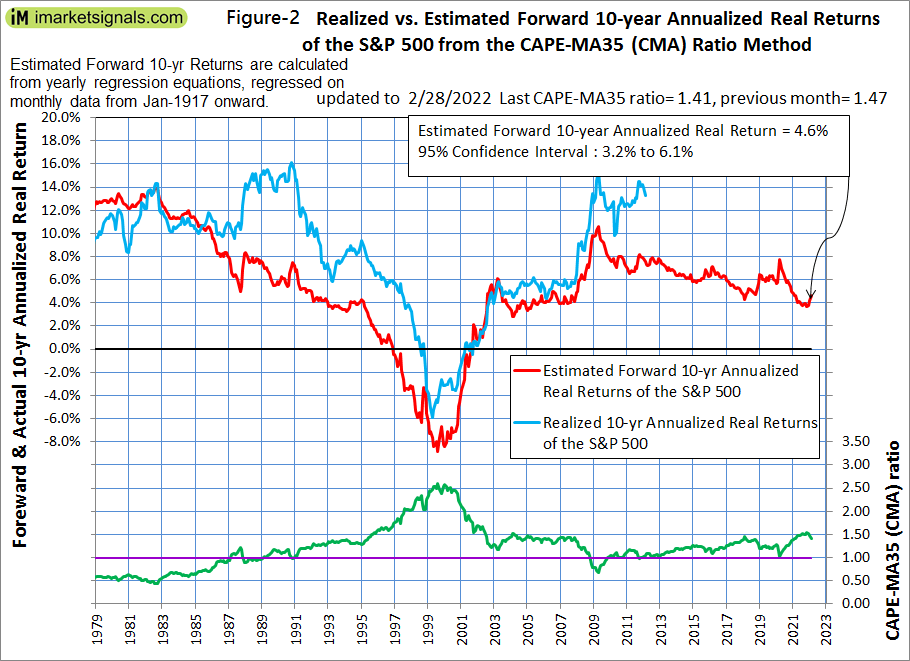
- The CAPE-MA35 ratio is 1.41 (down from the end of December 2021 level of 1.51), forecasting a 10-year annualized real return of about 4.6%.
- The historic long-term trend indicates a 10-year forward real annualized return of only 0.8% (up from the end of December 2021 forecast of 0.2%).
This is an update to our series of articles started in 2012 assessing market valuation and estimating forward stock market returns. The most recent previous update was for end of December 2021.
The projections here are partly based on Estimating Forward 10-Year Stock Market Returns using the Shiller CAPE Ratio and its 35-Year Moving Average, which is referred to as the “referenced article” further down.
What short-term stock market returns can be expected?
Nobody knows, and the best one can do is to use the historic data (which is from Shiller’s S&P series) to guide us to make estimates for the future. From the real price of the S&P-Composite with dividends re-invested (S&P-real) one finds that the best-fit line from 1871 onward is a straight line when plotted to a semi-log scale. There is no reason to believe that this long-term trend of S&P-real will be interrupted. S&P-real, updated to end of February 2022 and the best fit line together with its 95% prediction band are shown in Figure-1. (See appendix for the equation.)
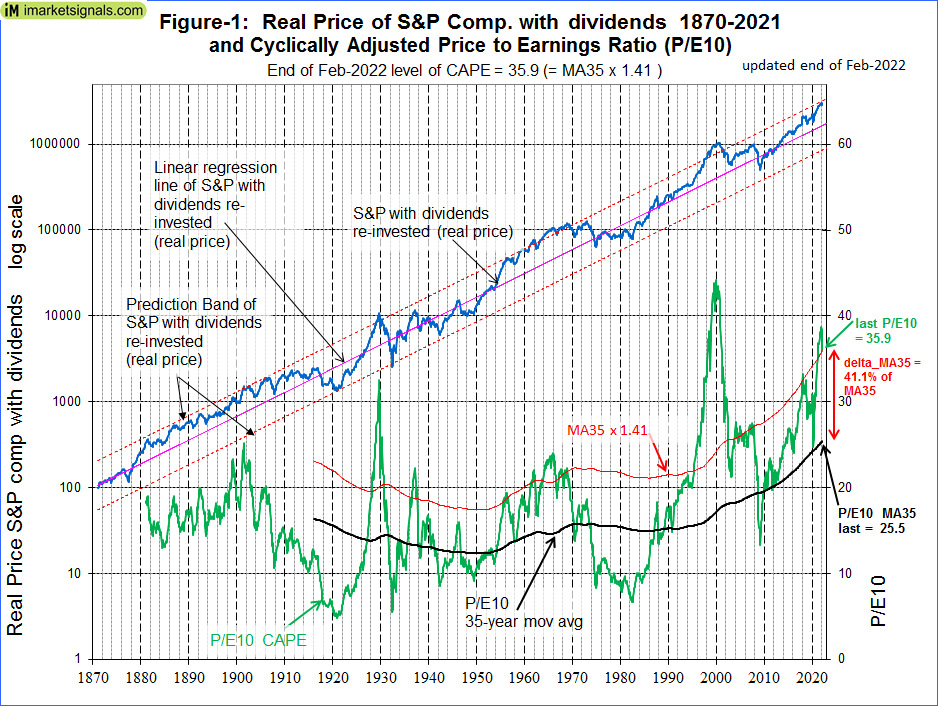
The current level of the S&P-real is 75% above the long-term trend line. A reversal to the mean trend would entail a 43% decline, possibly over a short period.
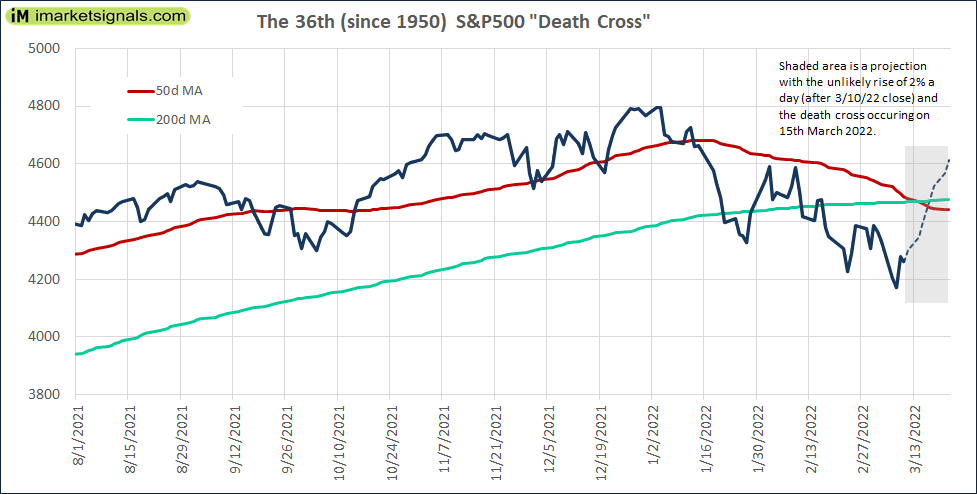
S&P 500 Death Cross for the Ides of March.
In our article The S&P 500 Death Cross – Time To Panic?, we analyzed the markets after a death cross, that is when the 50-day moving average of the S&P 500 crosses its 200-day moving average. We now face the 36th Death Cross either on 3/14/22 or 3/ 15/2022.
Asset Allocation after a Death Cross
Based on past history of the performance of the S&P 500, there is no need to panic. A Death Cross does not always result in major market losses, as can be seen from the analysis. However, it would appear that one should avoid being invested in the stock market during the first two months after a death cross, as there were many losses during this period, whereas the historic maximum gain was only about 13% in this period after any of the 34 death crosses.
Forecasting stock market returns with the CAPE-MA35 Ratio
Also shown in Figure-1 are the CAPE (which is the S&P-real divided by the average of the real earnings over the preceding 10 years) and its 35-year moving average (MA35), having end of February 2022 values of 35.9 and 25.5, respectively. Thus the falling CAPE is 41% above the MA35 and the S&P-real is now not as close to the upper prediction band line as it was end of December 2021.
As shown in the referenced article, a superior method to the standard use of the Shiller CAPE-ratio is to predict 10-year real returns using the CAPE-MA35 ratio as a valuation measure. It is simply the value of the Shiller CAPE-ratio divided by the corresponding value of its 35-year moving average (35.9 / 25.5 = 1.41).
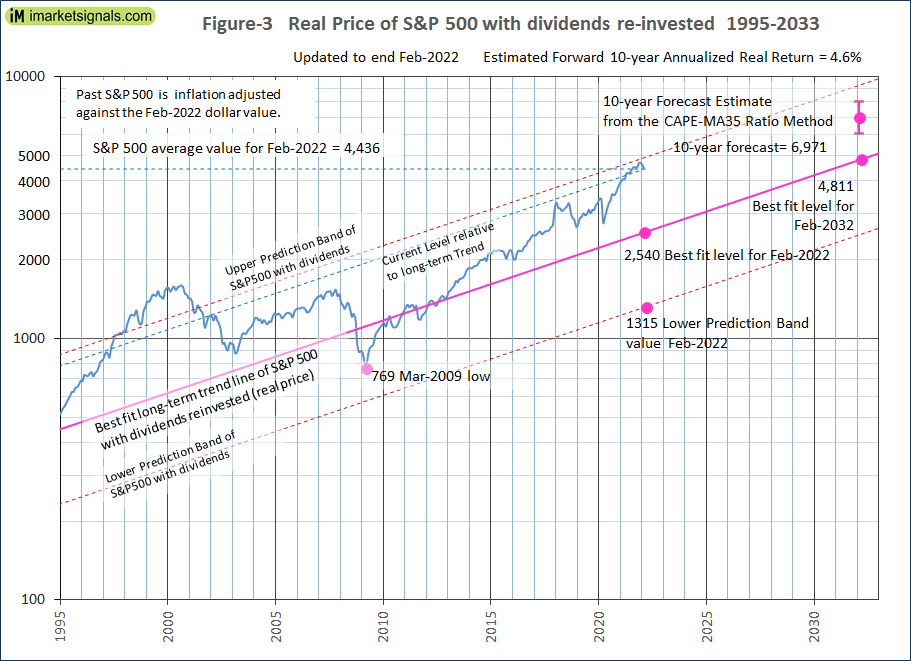
Currently the CAPE-MA35 ratio of 1.41 forecasts a probable 10-year annualized real return of about 4.6% to February 2032. Based on the current S&P 500 value this would indicate an end of February 2032 value of 6971 for S&P-real, with upper and lower confidence values of 8020 and 6050, respectively, all as shown in Figures-2 and -3.
Also in Figure-3 the current level of the S&P 500 relative to the long-term trend is indicated by the line parallel to the long-term trend line. Note that since mid-2001 this relative level has never been greater than what it is now.
Forecasting returns to 2032 with the long-term trend
When extending the best fit line and the prediction bands (Figure-3), then the S&P-real end of February 2032 value would be 4811.
Thus the historic trend forecasts a probable total gain of only about 8% (or an annualized return of 0.8%) for S&P-real from its current level of 4436 to the end of February 2032 best fit level of 4811.
Conclusion
- The current elevated level of the S&P 500 relative to the current long-term trend level warns that stocks are overvalued; and
- The current CAPE-MA35 ratio of 1.41 forecasts only a 4.6% real 10-year forward return for the S&P 500, while the long-term trend indicates a forward return of only 0.8%; and
- The current condition of overvaluation suggests the possibility of a major downturn for equities.
- Algorithmic selling may drive prices further into negative territory after the death cross on 14th or 15th March 2022.
Updates of the estimated 10-year forward returns of the S&P 500 (Figure-2) are posted monthly at imarketsignals.com.
Appendix
The best fit line and prediction band were calculated from monthly data from Jan-1871 to July-2012. The SP-real values for the period after July-2012 are “out of sample” and were not included in the regression analysis.
The equation of the best fit line is y = 10(ax+b)
y = is the dependent variable of the best fit line.
x = are the number of months from January 1871 onwards.
a = 0.0023112648
b = 2.02423522
Leave a Reply
You must be logged in to post a comment.