
- Reliance on a single market timer is risky. The risk can be reduced by a multi-model market timer whose many components use different and uncorrelated financial and economic data.
- This model seeks to determine reliable risk-on and risk-off periods for the stock market. When there is no definite signal for risk-on or risk-off then the investment is considered risk-neutral.
- From 2000 to 2022, switching between ETFs RSP, VGT, SH, TIP, BIV and IEF would have produced an annualized return of 34.2% versus 7.0% for buy and hold SPY.
- The model is not a binary indicator between risk-on and risk-off and does not rely on leveraged ETFs to produce such high returns.
Six previously described market timing models which are periodically updated at our website iMarketSignals are used in the rules. They are:
- Consumer Sentiment (published Oct. 8, 2021): Investment in equities is signaled when the 15-week return of the discretionary sector outperforms the 15-week return of the staples sector.
- Cyclically Adjusted_RiskPremium (Jul. 10, 2021): An alternative measure of risk is the Cyclically Adjusted Risk Premium (CARP), defined as the inverse of the Shiller CAPE Ratio (CAPE) in percent minus the 10-year note yield. The value of the CARP and directional trend of the CAPE can be used to profitably time investments in risk-on and risk-off assets.
- Model Sum Timer (Jan. 29, 2021): Five models with low correlation to each other are considered, each designed to hold SPY during up-market conditions. Equity investment is indicated when the sum of the weights of the models holding SPY exceeds 3.
- Composite Market Timer (Oct. 01, 2016): An entry for the stock market is signaled when the combined weight of the six component models is equal to, or greater than 50%.
- Super_Timer (Mar. 14, 2019): A weekly Stock Market Confidence Level (SMC level) is obtained by considering the percentage allocated to each of the 15 component timer model and their weight in the system. Positive stock market investment climates are indicated by SMC levels >50%.
- Inflation Trend Lower (Feb. 15, 2017): Normally equities should perform well when the inflation rate becomes less than its 6-month moving average minus 0.20%.
The above six timers are incorporated with various combinations into two conditions which seek to determine good risk-on and risk-off investment signals for the stock market. A valid signal is obtained when both conditions return the same risk signal (either risk-on or risk-off), otherwise when they differ the risk situation is considered to be risk-neutral. Thus, this model is not a binary timer.
Holdings for various risk conditions:
- Risk-on: ETFs (RSP) and (VGT)
- Risk-off: ETF (SH)
- Risk-neutral: ETFs (TIP) and (BIV), or (IEF)
Note the model never holds any leveraged ETFs.
For the model, from January 2000 to January 2022, the percentage of time a particular risk situation existed was:
- Risk-on: 72%
- Risk-off: 20%
- Risk-neutral: 8%
Performance of the iM-Multi-Model Market Timer
The model was backtested using the online portfolio simulation platform Portfolio 123, which also provides extended price data for ETFs prior to their inception dates calculated from their proxies. A minimum holding period of two weeks, closing prices and trading costs of about 0.025% of each trade amount were assumed in the backtest.
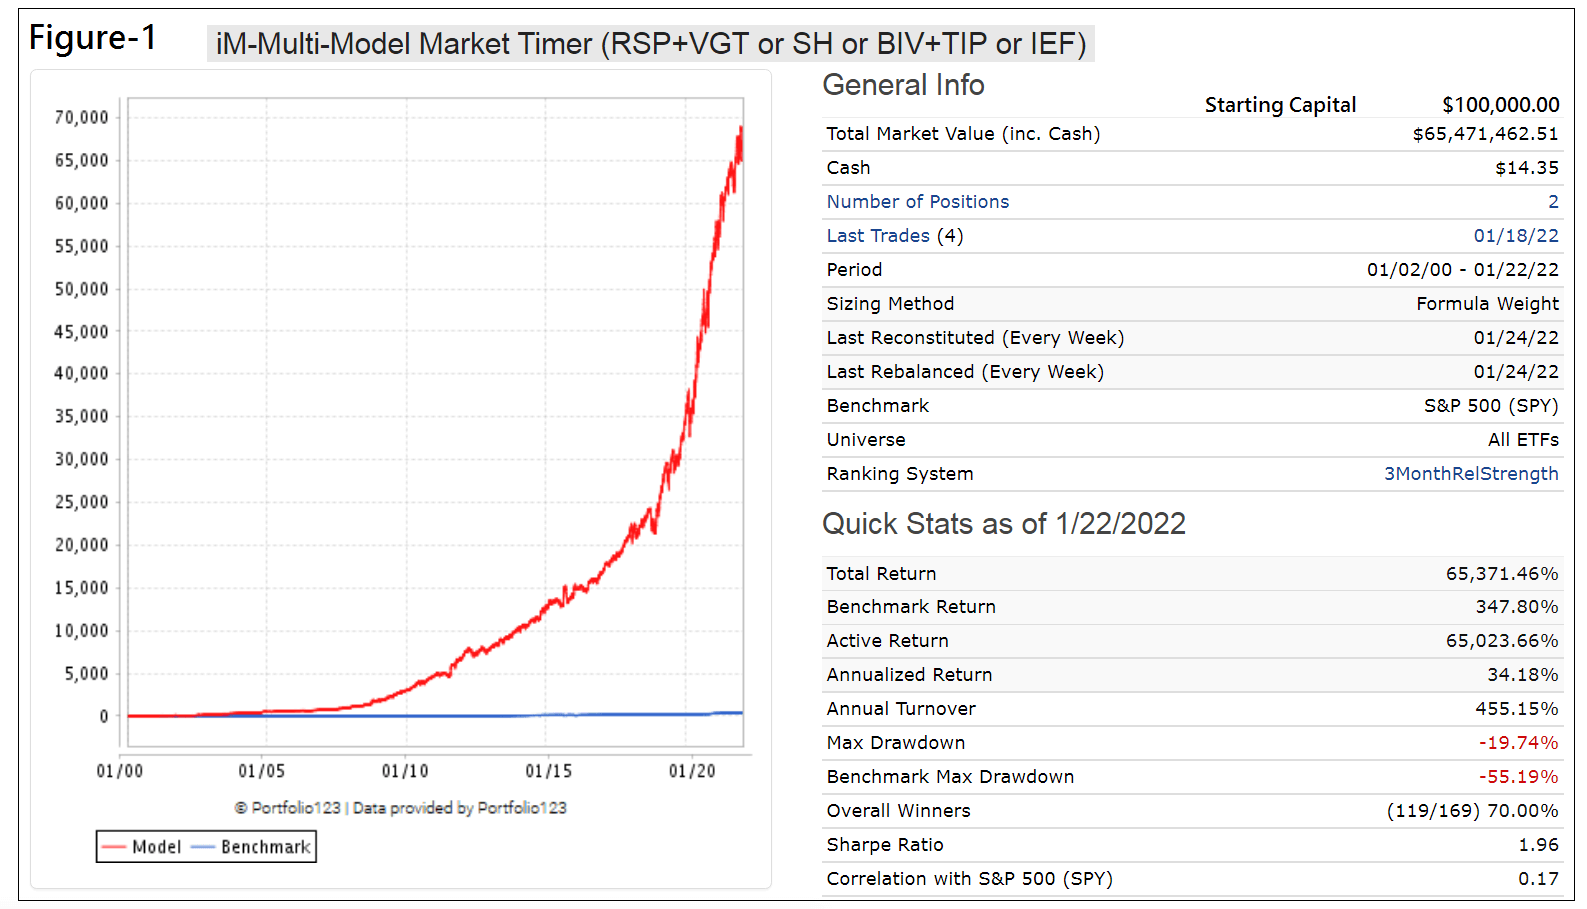
The simulated performance of the model is shown in Figure-1 below. The red graph represents the performance of the model from January 2000 to January 2022 (22 years) and the blue graph which resembles a horizontal line shows the performance of benchmark SPY.
The simulation shows an annualized return of 34.2% with a maximum drawdown of -19.7% with only 169 trades; an initial investment of $100,000 would have grown to $65.5-million if one could have followed this model from January 2000 onward. Total trading costs were $440,000. A listing of realized trades is in the Appendix.
Without ETF (SH) the annualized return would have been 23.0% with a maximum drawdown of -14.4%, and 143 trades; an initial investment of $100,000 would have grown to $9.7-million.
Risk Measurements
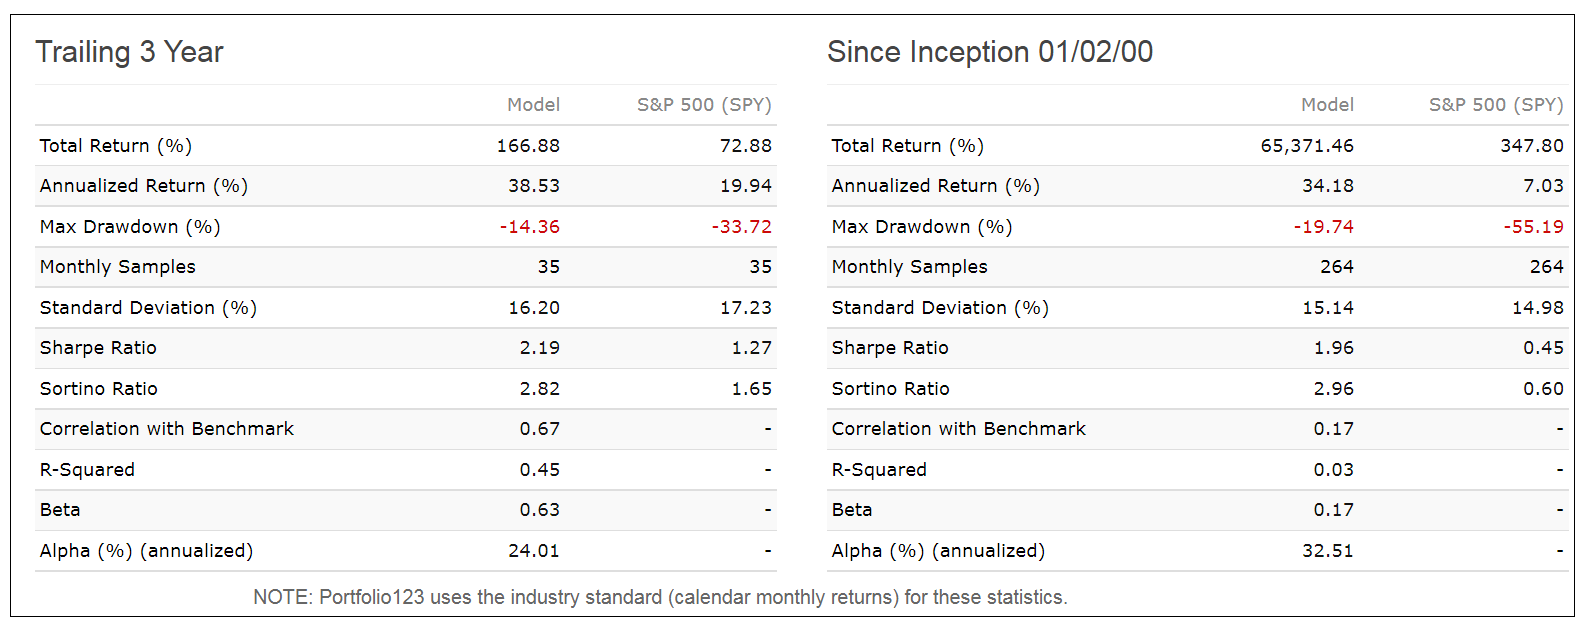
In the table below are the risk statistics for the model relative to the benchmark ETF (SPY). The model’s positive alpha indicates that this strategy would have outperformed its risk-adjusted benchmark return on average by 32.5% per year since January 2000 and 24.0% for the trailing 3 years. Additionally, the Standard Deviation for this model’s monthly returns is similar to that of SPY, indicating similar volatility and demonstrating that the model’s investment strategy should be a better alternative to buy-and-hold SPY over the longer term.
Conclusion
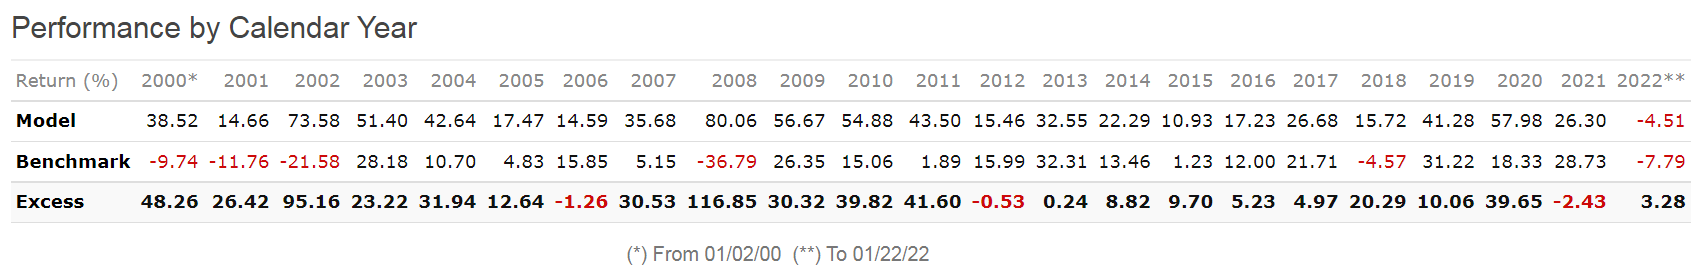
From the analysis it would appear that the iM-Multi-Model Market Timer could profitably be used to switch between the specified ETFs depending on the signaled risk situation. This model’s calendar year returns ranged from a minimum of 11% in 2015 to a maximum of 80% in 2008, and there would never have been a year with negative returns.
At iMarketSignals we will report weekly the status of this timer. The last trade, switching from risk-on to risk-neutral occurred on 1/18/2022, with current holdings being TIP and BIV.
Although this model performed extremely well over 22 years, there is no guarantee that it will perform well in the future.
Appendix
| Trading History | |||
| Symbol | Open | Close | Pct Return |
| BIV | 1/18/2022 | holding | |
| TIP | 1/18/2022 | holding | |
| RSP | 9/7/2021 | 1/18/2022 | 2.20% |
| VGT | 9/7/2021 | 1/18/2022 | -1.50% |
| TIP | 8/23/2021 | 9/7/2021 | -0.60% |
| BIV | 8/23/2021 | 9/7/2021 | -0.70% |
| VGT | 6/28/2021 | 8/23/2021 | 6.20% |
| RSP | 6/28/2021 | 8/23/2021 | 2.60% |
| TIP | 6/14/2021 | 6/28/2021 | 0.10% |
| BIV | 6/14/2021 | 6/28/2021 | -0.10% |
| VGT | 4/20/2020 | 6/14/2021 | 66.80% |
| RSP | 4/20/2020 | 6/14/2021 | 66.50% |
| BIV | 3/30/2020 | 4/20/2020 | 2.20% |
| TIP | 3/30/2020 | 4/20/2020 | 1.60% |
| IEF | 3/2/2020 | 3/30/2020 | 3.60% |
| VGT | 1/14/2019 | 3/2/2020 | 45.70% |
| RSP | 1/7/2019 | 3/2/2020 | 14.70% |
| SH | 12/31/2018 | 1/14/2019 | -2.90% |
| IEF | 12/24/2018 | 12/31/2018 | 0.70% |
| SH | 12/10/2018 | 12/24/2018 | 11.90% |
| VGT | 4/10/2017 | 12/10/2018 | 30.70% |
| RSP | 4/10/2017 | 12/10/2018 | 7.10% |
| BIV | 3/27/2017 | 4/10/2017 | 0.00% |
| TIP | 3/27/2017 | 4/10/2017 | -0.30% |
| VGT | 8/1/2016 | 3/27/2017 | 16.00% |
| RSP | 8/1/2016 | 3/27/2017 | 7.50% |
| BIV | 7/18/2016 | 8/1/2016 | 0.40% |
| TIP | 7/18/2016 | 8/1/2016 | -0.50% |
| VGT | 7/5/2016 | 7/18/2016 | 5.50% |
| RSP | 7/5/2016 | 7/18/2016 | 4.50% |
| TIP | 6/20/2016 | 7/5/2016 | 1.90% |
| BIV | 6/20/2016 | 7/5/2016 | 1.60% |
| RSP | 5/31/2016 | 6/20/2016 | -0.30% |
| VGT | 5/31/2016 | 6/20/2016 | -1.80% |
| BIV | 5/16/2016 | 5/31/2016 | -0.60% |
| TIP | 5/16/2016 | 5/31/2016 | -0.90% |
| RSP | 4/25/2016 | 5/16/2016 | -1.20% |
| VGT | 4/25/2016 | 5/16/2016 | -2.00% |
| TIP | 3/28/2016 | 4/25/2016 | 0.30% |
| BIV | 3/28/2016 | 4/25/2016 | 0.30% |
| VGT | 3/14/2016 | 3/28/2016 | 1.30% |
| RSP | 3/14/2016 | 3/28/2016 | 0.10% |
| TIP | 2/1/2016 | 3/14/2016 | 0.60% |
| BIV | 2/1/2016 | 3/14/2016 | 0.60% |
| SH | 12/7/2015 | 2/1/2016 | 6.30% |
| VGT | 11/16/2015 | 12/7/2015 | 3.00% |
| RSP | 11/16/2015 | 12/7/2015 | 0.70% |
| BIV | 11/2/2015 | 11/16/2015 | -0.50% |
| TIP | 11/2/2015 | 11/16/2015 | -1.10% |
| RSP | 10/12/2015 | 11/2/2015 | 2.80% |
| VGT | 10/5/2015 | 11/2/2015 | 7.60% |
| SH | 9/28/2015 | 10/12/2015 | -7.00% |
| VGT | 8/24/2015 | 9/28/2015 | 1.70% |
| RSP | 8/24/2015 | 9/28/2015 | -1.90% |
| SH | 7/6/2015 | 8/24/2015 | 8.40% |
| VGT | 1/5/2015 | 7/6/2015 | 3.90% |
| RSP | 1/5/2015 | 7/6/2015 | 1.80% |
| TIP | 12/22/2014 | 1/5/2015 | 0.30% |
| BIV | 12/22/2014 | 1/5/2015 | -0.20% |
| VGT | 10/20/2014 | 12/22/2014 | 12.00% |
| RSP | 10/20/2014 | 12/22/2014 | 9.40% |
| BIV | 10/6/2014 | 10/20/2014 | 1.40% |
| TIP | 10/6/2014 | 10/20/2014 | 1.30% |
| RSP | 11/28/2011 | 10/6/2014 | 70.30% |
| VGT | 11/28/2011 | 10/6/2014 | 64.20% |
| TIP | 11/14/2011 | 11/28/2011 | -0.10% |
| BIV | 11/14/2011 | 11/28/2011 | -0.50% |
| RSP | 9/26/2011 | 11/14/2011 | 9.00% |
| VGT | 9/26/2011 | 11/14/2011 | 8.00% |
| BIV | 8/29/2011 | 9/26/2011 | 0.40% |
| TIP | 8/22/2011 | 9/26/2011 | -1.20% |
| IEF | 8/15/2011 | 8/29/2011 | 0.40% |
| RSP | 8/8/2011 | 8/15/2011 | 8.80% |
| VGT | 8/8/2011 | 8/15/2011 | 7.70% |
| SH | 6/20/2011 | 8/8/2011 | 12.50% |
| RSP | 6/6/2011 | 6/20/2011 | -0.80% |
| VGT | 6/6/2011 | 6/20/2011 | -3.50% |
| BIV | 5/23/2011 | 6/6/2011 | 0.60% |
| TIP | 5/23/2011 | 6/6/2011 | 0.20% |
| RSP | 6/14/2010 | 5/23/2011 | 24.90% |
| VGT | 6/14/2010 | 5/23/2011 | 20.30% |
| IEF | 6/7/2010 | 6/14/2010 | -0.70% |
| SH | 5/3/2010 | 6/7/2010 | 12.90% |
| RSP | 1/25/2010 | 5/3/2010 | 13.20% |
| VGT | 1/25/2010 | 5/3/2010 | 10.50% |
| SH | 1/4/2010 | 1/25/2010 | 3.00% |
| RSP | 3/23/2009 | 1/4/2010 | 56.60% |
| VGT | 3/23/2009 | 1/4/2010 | 56.60% |
| IEF | 3/9/2009 | 3/23/2009 | 2.10% |
| BIV | 2/9/2009 | 3/9/2009 | -2.00% |
| TIP | 2/9/2009 | 3/9/2009 | -3.40% |
| VGT | 12/22/2008 | 2/9/2009 | 8.20% |
| RSP | 12/22/2008 | 2/9/2009 | 2.00% |
| BIV | 11/3/2008 | 12/22/2008 | 11.40% |
| TIP | 11/3/2008 | 12/22/2008 | 8.10% |
| SH | 9/2/2008 | 11/3/2008 | 21.60% |
| BIV | 8/4/2008 | 9/2/2008 | 0.90% |
| TIP | 8/4/2008 | 9/2/2008 | -0.20% |
| SH | 6/9/2008 | 8/4/2008 | 8.40% |
| BIV | 5/27/2008 | 6/9/2008 | -1.10% |
| TIP | 5/27/2008 | 6/9/2008 | -1.50% |
| VGT | 4/7/2008 | 5/27/2008 | 8.10% |
| RSP | 4/7/2008 | 5/27/2008 | 2.10% |
| TIP | 3/17/2008 | 4/7/2008 | -1.10% |
| BIV | 3/17/2008 | 4/7/2008 | -1.10% |
| SH | 10/15/2007 | 3/17/2008 | 20.00% |
| VGT | 10/22/2007 | 11/5/2007 | 3.10% |
| VGT | 9/10/2007 | 10/15/2007 | 7.60% |
| RSP | 9/10/2007 | 10/15/2007 | 5.90% |
| SH | 7/23/2007 | 9/10/2007 | 6.40% |
| VGT | 10/2/2006 | 7/23/2007 | 22.70% |
| RSP | 10/2/2006 | 7/23/2007 | 17.20% |
| SH | 9/5/2006 | 10/2/2006 | -0.80% |
| VGT | 8/14/2006 | 9/5/2006 | 8.00% |
| RSP | 8/14/2006 | 9/5/2006 | 4.20% |
| TIP | 7/31/2006 | 8/14/2006 | 0.00% |
| BIV | 7/31/2006 | 8/14/2006 | -0.10% |
| VGT | 7/17/2006 | 7/31/2006 | 2.80% |
| RSP | 7/17/2006 | 7/31/2006 | 2.70% |
| TIP | 7/3/2006 | 7/17/2006 | 0.80% |
| BIV | 7/3/2006 | 7/17/2006 | 0.40% |
| SH | 5/30/2006 | 7/3/2006 | -1.30% |
| RSP | 4/18/2005 | 5/30/2006 | 16.50% |
| VGT | 4/18/2005 | 5/30/2006 | 14.00% |
| SH | 2/28/2005 | 4/18/2005 | 4.70% |
| TIP | 1/10/2005 | 2/28/2005 | 0.20% |
| BIV | 1/10/2005 | 2/28/2005 | -0.20% |
| RSP | 10/25/2004 | 1/10/2005 | 9.40% |
| VGT | 10/25/2004 | 1/10/2005 | 5.90% |
| SH | 9/13/2004 | 10/25/2004 | 2.50% |
| RSP | 8/9/2004 | 9/13/2004 | 6.40% |
| VGT | 8/9/2004 | 9/13/2004 | 5.60% |
| SH | 6/28/2004 | 8/9/2004 | 5.90% |
| RSP | 7/6/2004 | 7/19/2004 | -1.60% |
| BIV | 6/7/2004 | 6/28/2004 | 0.20% |
| TIP | 6/7/2004 | 6/28/2004 | -0.60% |
| RSP | 5/17/2004 | 6/7/2004 | 6.60% |
| VGT | 5/24/2004 | 6/7/2004 | 4.70% |
| SH | 5/10/2004 | 5/24/2004 | -1.10% |
| VGT | 5/3/2004 | 5/17/2004 | -2.20% |
| RSP | 4/26/2004 | 5/10/2004 | -5.90% |
| SH | 4/19/2004 | 5/3/2004 | 1.30% |
| TIP | 4/5/2004 | 4/19/2004 | -0.80% |
| BIV | 4/5/2004 | 4/19/2004 | -0.90% |
| RSP | 3/31/2003 | 4/5/2004 | 54.20% |
| VGT | 2/2/2004 | 4/5/2004 | -2.40% |
| BIV | 3/3/2003 | 3/31/2003 | -0.50% |
| TIP | 3/3/2003 | 3/31/2003 | -1.60% |
| SH | 11/25/2002 | 3/3/2003 | 10.10% |
| RSP | 11/18/2002 | 12/2/2002 | 6.90% |
| BIV | 11/4/2002 | 11/18/2002 | 0.90% |
| TIP | 11/4/2002 | 11/18/2002 | 0.10% |
| RSP | 10/14/2002 | 11/4/2002 | 11.80% |
| IEF | 10/7/2002 | 10/14/2002 | -1.10% |
| SH | 9/9/2002 | 10/7/2002 | 12.40% |
| RSP | 9/3/2002 | 9/16/2002 | 0.60% |
| SH | 3/25/2002 | 9/3/2002 | 23.60% |
| RSP | 3/11/2002 | 3/25/2002 | -2.60% |
| SH | 3/4/2002 | 3/18/2002 | -1.30% |
| RSP | 12/24/2001 | 3/4/2002 | 4.20% |
| SH | 8/13/2001 | 12/24/2001 | 0.60% |
| RSP | 8/6/2001 | 8/20/2001 | -2.20% |
| SH | 4/30/2001 | 8/6/2001 | 4.70% |
| RSP | 4/23/2001 | 5/7/2001 | 3.30% |
| SH | 11/6/2000 | 4/23/2001 | 15.00% |
| RSP | 10/2/2000 | 11/6/2000 | 2.60% |
| SH | 6/19/2000 | 10/2/2000 | 4.00% |
| RSP | 2/22/2000 | 6/19/2000 | 12.10% |
| SH | 1/3/2000 | 2/22/2000 | 7.10% |
Which plan would I need to be able to use this markettimer?
How can I find the IM Multi Model Timer on the website? What tabs it under? And, is it under the gold or silver plan?
It will be in GOLD starting end of January.
Hi,
It’s 1st of February and I still cannot find this model on the website. How can I find this model on the website?
Same question.
The Sunday signal email did contain the information that nothing changed, and the holdings can now also be viewed on the homepage subject to Gold subscription or for the first month after registering with iMarketSignals.
Thank you for the update.
George can you comment on the ETFs you chose. Was it due to cost, net performance after fees, breadth of holdings/sectors/indices within the ETF,???????
Secondly as the great return due to the timing “calls” or the ETFs chosen?
Finally if the timing calls are so good, would the timing be equally effective if used with other models such as the Dividend Growth or Capital Strength Models?
Thanks
We chose RSP (equal weight SP500) and not SPY because the heavy weights of SPY are the Tech stocks and we did not want to duplicate Tech because of Tech ETF VGT.
With MDY instead of RSP the model’s annualized return is 33% with max D/D= -20%.
This is an ETF model. The algorithm cannot directly be used for stock models.
We have not checked it for stock models such as the Dividend Growth or Capital Strength Models.
Georg,
Really something to pull all these pieces together.
I note there is a minimum holding period of 2 weeks. On the list of trades I saw there are situations where a new/different signal is shown one week after the previous signal. I also saw that the previous signal is closed 2 weeks after it is initiated. So just to confirm, the new trade is initiated after that position is closed, not as of the “Open” date noted in the “Trading History”. Correct?
It is correct that the model may trigger on a few occasions just one of the two buys before the other. That has to do with the reconstitution period being every week and the minimum holding period of a position being 2 weeks and the specification that the model’s max number of positions is 2.
So for example, the model may be in single position SH. 7 days after SH was bought the model wants to switch to risk-on again, but SH will be held for another week as specified. Then the model can only buy one of the risk-on ETFs with whatever money is available and the second is bought one week later when SH can be sold because it was held for two weeks. The ranking system decides which of the two ETFs to buy first and the rebalancing rule brings the two positions to equal weight.
The “Open” dates noted in the “Trading History” are correct, directly downloaded from the P123 realized trades history.
I think I understand. Maybe explaining this one will help me… TIP and BIV are both sold on 4/19/2004; then SH is purchased on 4/19/04 (presumably with the proceeds from the sale of both positions) and then sold on 5/3/2004; but somehow RSP is purchase on 4/26/2004 and sold on 5/10/04.
Perhaps the two week holding period only applies to one position in a case like this.
I guess because there are two owned positions at any one time, there are essentially two tracks for buys and sells. That would explain how you can own SH from 6/28/2004 through 8/9/2004 but also have a position in RSP from 7/6/2004 through 7/19/2004.
Georg,
I have two questions,
1) during what time period did you have the MaxDD of 19.74%?
2) when you came up with this model, was it mostly top down (manipulating the steering criteria) or mostly bottom up (look at end results and adjusting to avoid bad periods)?
1) Feb-7-2002
2) None of the criteria you listed.
we just used a combination of our six market timer models for conditions A and B in the P123 buy rules below.
[Buy1] SetVar(@riskON,ticker(“VGT,RSP,IEF”))
[Buy2] SetVar(@riskOFF,ticker(“SH”))
[Buy3] SetVar(@riskNEUTRAL,ticker(“TIP,BIV”))
[Buy4] eval($ConditionA, @riskON,@riskOFF) | eval($ConditionA & $ConditionB, @riskNEUTRAL,0)
[Buy5] eval($ConditionB, @riskOFF,eval($ConditionA, @riskON,@riskOFF)) | eval($ConditionA & $ConditionB,@riskNEUTRAL,0)
Hi Georg,
great work, as usual !
I like the approach, that this model is not binary (all in – all out)but rather identifies different risk levels.
Now, since I am living in Germany, I cannot buy these ETFs, they are not offered here.
Can this model be adjusted to use a portfolio of – let’s say – 10 individual STOCKS (not ETFs).
I think this should be possible. Any plans ?
One can use 4 of the component market timing models in this Multi-Model Timer for stock models, but only to go to cash, there is no neutral situation possible.
The component models are:
$Super_Timer | $Composite | $CycAdjust_RiskPremium | $InflLower
A simulation shows that these timers would make the model go to cash 10.6% of the total trading days since 1/2/1999, or 618 trading days.
A 12 position model using a modified Russell 3000 universe of about 1,800 stocks produces an annualized return of about 40% with a max D/D of -24% when these timers are applied in the buy rules. Obviously you need a good ranking system as well.
We will soon launch this stock model “Robust12 from the Russell 3000 with iM-Multi-Model Timer”
Initial Investment $100,000.00
Total Market Value (inc. Cash) $214,643,073.67
Number of Positions 12
Period 01/02/99 – 01/29/22
Benchmark S&P 500 (SPY)
Universe Russell3000-Special
Ranking System Multi-Factor – plus2
Quick Stats as of 1/29/2022
Total Return 214,543.07%
Benchmark Return 443.99%
Active Return 214,099.09%
Annualized Return 39.44%
Annual Turnover 650.52%
Max Drawdown -23.83%
Benchmark Max Drawdown -55.19%
Overall Winners (1065/1736) 61.00%
Sharpe Ratio 1.65
Correlation with S&P 500 (SPY) 0.62
Hi Georg,
thanks for the quick reply.
Impressive work!
Nice to hear that this model can be adapted to individual stocks.
Lookig forward to the upcoming new model.
When will the Multi-Model data be added to the in and out of sample summary data?
Really nice model. If you were to go 2x L/S with
Bull: SSO ROM
Neutral: BND
Short: SDS
I’m thinking this would boost returns to > 50% and still keep drawdown under 40%?
Tom C
We have a model with 1.5 leverage.
Shows annualized return of 46% with max D/D= -30%.
Where can the model with 1.5 leverage be found? TY.
We have not launched it yet.
Is allocations is 50-50?
Allocation is equal weight.
Hi Georg,
I do not see “The iM-Multi-Model Market Timer” in Gold.
The pricing table in the Home Page was old.
Thanks!
Same problem here.