
- Prior to a recession the yield curve becomes inverted, as indicated by the Forward Rate Ratio between the 2-year and 10-year U.S. Treasury yields (FRR2-10) being less than 1.00.
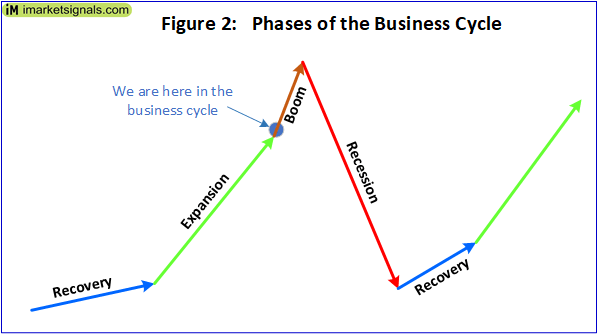
- The FRR2-10 crossed 1.00 downward signifying that US economic activity is in the boom phase of the business cycle and nearing the next recession.
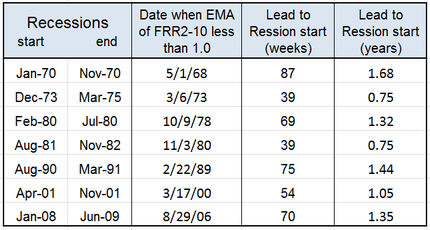
- The average lead time after FRR2-10 becomes less than 1.00 to the subsequent recession start was 14 months for the seven of the eight last recessions.
It is well known that an interest rate environment in which long-term debt instruments have a lower yield than short-term debt instruments of the same credit quality is considered to be a predictor of recessions. It is reasonable to assume that a similar pattern will prevail in advance of future contractions of the economy.
This model uses the 2-year and 10-year U.S. Treasury yields as measures of short-term and long-term rates, respectively, and calculates the Forward Rate Ratio (FRR2-10) between the two rates.
FRR2-10 is the rate at which one can lock in borrowing for the eight year period starting two years from now, divided by the ten-year rate itself. A FRR2-10 greater than 1.00 indicates a positively sloped yield curve (ten-year note yields are higher than two-year note yields); a FRR2-10 less than 1.00 indicates an inversion of the yield curve (two-year note yields are higher than ten-year note yields). For the formula to calculate the Forward Rate Ratio see the Appendix.
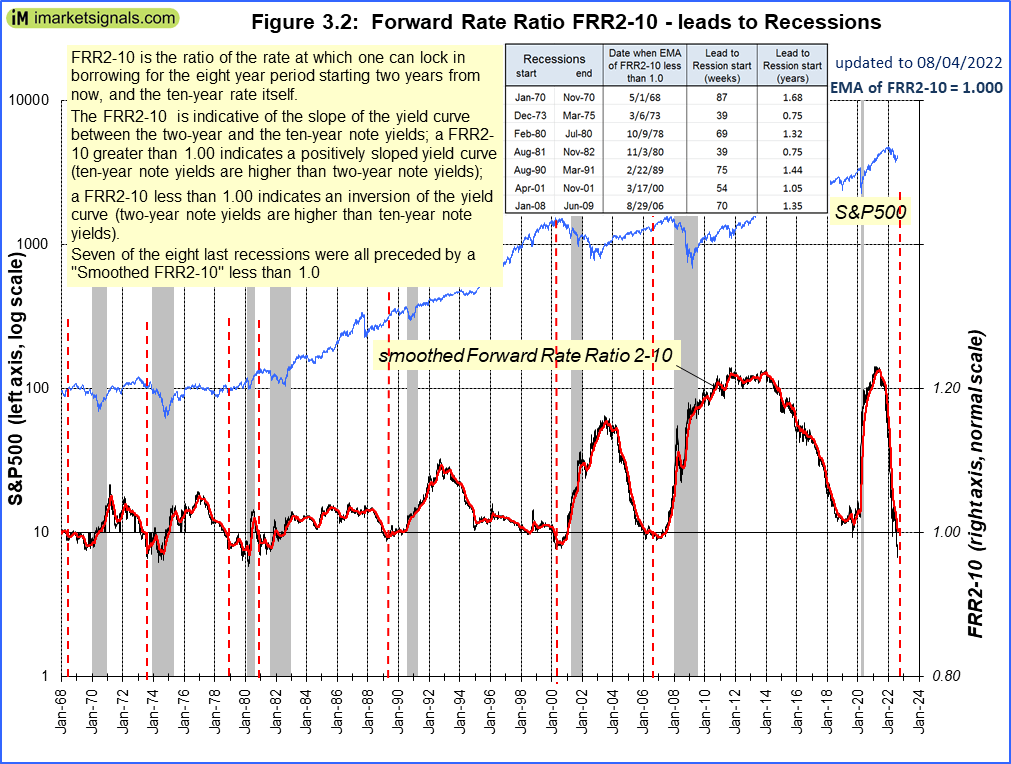
In Figure 1 the smoothed FRR2-10 shown is the exponential moving average of FRR2-10 (daily values) with a constant smoothing factor equal to 0.030. One can see that the yield curve was inverted prior to the last seven recessions (indicated by the Forward Rate Ratio between the 2- and 10-year yields being less than 1.00). Currently (August 5, 2022) the yield curve is inverted with a FRR2-10 at 1.00 indicating that we are entering the boom phase of the business cycle, and nearing the next recession, as shown in Figure 2.
The vertical dashed red lines indicate when the smoothed FRR2-10 became less than 1.00. The dates and lead time to the subsequent recessions are shown in the table below. The minimum lead time was 39 weeks to the 1973 and 1981 recessions, with the average being 62 weeks or 14 months.
It is also apparent that the stock market showed gains for a few months after FRR2-10 became less than 1.00, synonymous with the boom phase of the business cycle.
Appendix
Forward Rate Ratio
The FRR is described in an article by Howard L. Simons in Stocks, Futures and Option Magazine, March 2007 and can be calculated for any two rates on the yield curve.
FRR2-10 is the rate at which one can lock in borrowing for the eight year period starting two years from now, divided by the ten-year rate itself.
The formula for calculating FRR2-10 is: FRR2-10 = { [(1 + i10)10 / (1 + i2)2 ]1/8 -1} / i10
where i10 and i2 are the 10 year and 2 year U.S. Treasury Note yields respectively.
Neglecting compound interest: FRR2-10 = (5 i10 – i2 ) / 4 i10
Leave a Reply
You must be logged in to post a comment.