
- Investment risk can be reduced by a multi-model market timer whose many components use different and uncorrelated financial and economic data, including inflation.
- This model seeks to determine effective asset allocation for risk-on and risk-off periods for equities considering the effect of inflation.
- Four risk scenarios are possible: risk-on & normal-inflation, risk-on & high-inflation, risk-off & normal-inflation, and risk-off & high-inflation. Different ETF groups apply to each risk scenario.
- From 2000 to 2022, switching accordingly between risk-related ETF groups would have produced an annualized return of about 39% versus 6.5% for buy and hold SPY.
Basic risk-on and risk-off signals for equities
Previously described market timing models (listed in Appendix-1) are used to determine the basic risk-on and risk-off periods for equities, similarly to what was described in the iM-Multi-Model Market Timer article.
For this model signals for basic risk-on situations arise when either
- the Inflation Lower Timer plus the Consumer Sentiment Timer, or
- the Cyclically Adjusted Risk Premium Timer, or
- the SuperTimer indicate this, otherwise
if none of the above three options are true basic risk-off periods are indicated.
Inflation considerations
During risk-on and risk-off periods for equities one should consider inflation risk as well. Rising inflation means that interest rates are increasing and the discounted value of future cash flows from stocks is driven down, lowering equity prices.
Higher inflation, or an inverted yield curve signal a higher risk environment for equities.
We define rising inflation with data from the University of Michigan Inflation Expectation© series (MICH) and the 6-month moving average of the inflation rate as discussed in Evaluating Popular Asset Classes For Inflation Protection.
Typically, the Federal Funds Rate is near a high when the yield curve inverts, indicating the Federal Reserve’s activity in combating high inflation. An inverted yield curve signifies that economic activity is near the end of the expansion phase of a business cycle and that a high probability of an oncoming recession exists.
For this model “high-inflation” is defined when the value of MICH is greater than 3.1% and the 6-month moving average of the inflation rate is greater than 2.9%, or the yield curve is near inversion or inverted as indicated by the Yield Curve Timer, all data point-in-time. When “high-inflation” is not present then “normal-inflation” is assumed.
Risk environments and risk-related asset allocation
The following ETFs were used:
- Invesco S&P 500 Equal Weight ETF (RSP)
- Vanguard Information Technology Index Fund (VGT)
- Vanguard Real Estate Index Fund (VNQ)
- Invesco Dynamic Energy Exploration & Production ETF (PXE)
- ProShares Short Russell2000 (RWM)
- iShares 20+ Year Treasury Bond ETF (TLT)
- ProShares Short S&P500 (SH)
- ProShares Short QQQ (PSQ)
- Vanguard Mid-Cap Value Index Fund (VOE) and Invesco DB Commodity Index Tracking Fund (DBC) as proxies for VGT and PXE prior to their inception dates, respectively.
The four possible risk environments and corresponding risk-related ETF groups are:
- risk-on & normal-inflation: RSP & VGT
- risk-on & high-inflation: VNQ & PXE
- risk-off & normal-inflation: RWM & TLT
- risk-off & high-inflation: SH & PSQ
Note that the model never holds any leveraged ETFs.
Performance of the Inflation Attuned Multi-Model Market Timer
The model was backtested using the online portfolio simulation platform Portfolio 123, which also provides extended price data for ETFs prior to their inception dates calculated from their proxies. Closing prices and trading costs of 0.05% of each trade amount were assumed in the backtest.
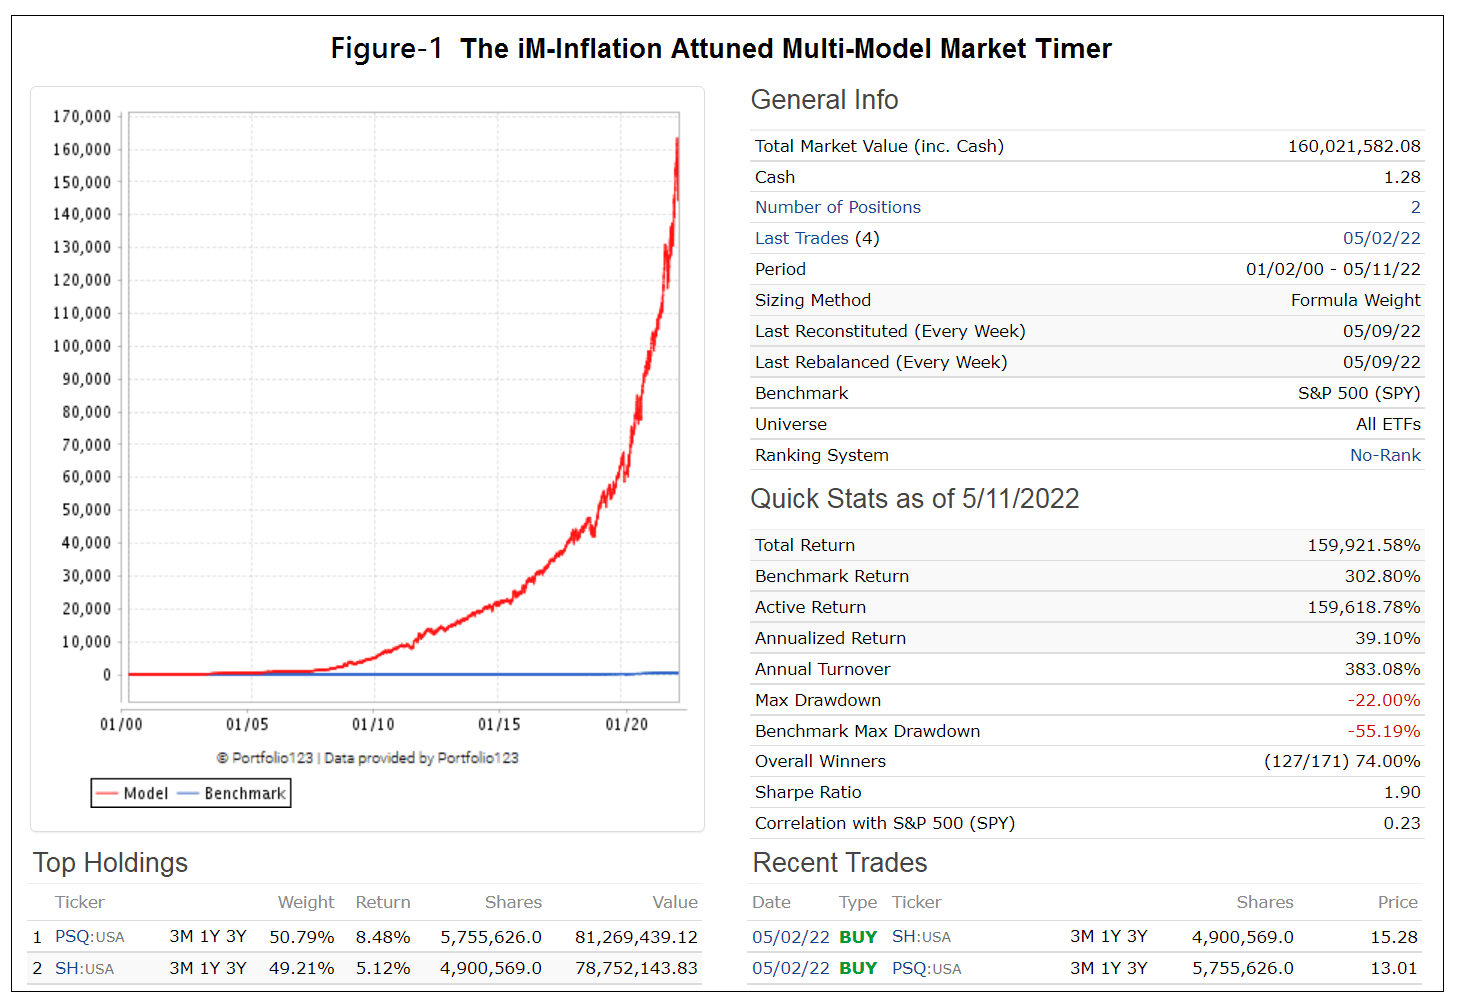
The simulated performance of the model is shown in Figure-1 below. The red graph represents the performance of the model from Jan 3, 2000 to May 11, 2022 (22+ years) and the blue graph, which resembles a horizontal line, shows the performance of benchmark SPY.
The simulation shows an annualized return of 39% with a maximum drawdown of -22% and only 169 realized trades (a listing of realized trades is in the Appendix-2). An initial investment of $100,000 would have grown to $160-million if one could have followed this model from January 2000 onwards. Total trading costs would have been $850,000.
Risk Measurements
The risk statistics for the model relative to the benchmark ETF (SPY) show a positive alpha of 36%, indicating that this strategy would have outperformed its risk-adjusted benchmark return on average by 36% per year since January 2000. Additionally, the Standard Deviation for this model’s monthly returns is similar to that of SPY, indicating similar volatility and demonstrating that the model’s investment strategy should be a better alternative to buy-and-hold SPY over the longer term.
Conclusion
From the analysis it would appear that the Inflation Attuned Multi-Model Market Timer could profitably be used to switch between the specified ETF groups according to the signaled risk situation. This model’s calendar year returns ranged from a minimum of 11% in 2018 to a maximum of 152% in 2008. The model shows excess returns over benchmark SPY for each year, and there would never have been a year with negative returns.
From Jan 3 to May 11, 2022 the model shows a gain of 26% versus a loss of 17% for SPY.
At iMarketSignals we will report weekly the status of this timer. Gold subscription would be required. The last trade, switching from risk-on & high-inflation to risk-off & high-inflation occurred on 5/2/2022, and current holdings are therefore SH and PSQ since then.
Although this model performed extremely well over 22 years, there is no guarantee that it will perform well in the future.
Appendix-1
Market timing models used:
- Consumer Sentiment Timer : Investment in equities is signaled when the 15-week return of the discretionary sector outperforms the 15-week return of the staples sector.
- Cyclically Adjusted_RiskPremium Timer : An alternative measure of risk is the Cyclically Adjusted Risk Premium (CARP), defined as the inverse of the Shiller CAPE Ratio (CAPE) in percent minus the 10-year note yield. The value of the CARP and directional trend of the CAPE can be used to profitably time investments in risk-on and risk-off assets.
- Composite Market Timer : An entry for the stock market is signaled when the combined weight of its six component models is equal to, or greater than 50%. This model has the greatest weight in the SuperTimer.
- SuperTimer : A weekly Stock Market Confidence Level (SMC level) is obtained by considering the percentage allocated to each of its 15 component timer model and their weight in the system. Positive stock market investment climates are indicated by SMC levels greater than 50%.
- Inflation Lower Timer : Normally equities perform better when inflation is lower.
- Yield Curve Timer: The timing rules are based on the state of yield curve and on the trend of the Effective Federal Funds Rate.
Appendix-2
Realized trades:
| Trade # | Symbol | Open | Close | Days | Pct Return |
| 169 | PXE | 9/7/2021 | 5/2/2022 | 237 | 68.90% |
| 168 | VNQ | 9/7/2021 | 5/2/2022 | 237 | -7.60% |
| 167 | VGT | 4/13/2020 | 9/7/2021 | 512 | 90.10% |
| 166 | RSP | 4/13/2020 | 9/7/2021 | 512 | 72.20% |
| 165 | VGT | 9/23/2019 | 3/2/2020 | 161 | 14.20% |
| 164 | RSP | 9/23/2019 | 3/2/2020 | 161 | -1.10% |
| 163 | PXE | 9/9/2019 | 9/23/2019 | 14 | 2.20% |
| 162 | VNQ | 9/9/2019 | 9/23/2019 | 14 | 0.50% |
| 161 | VGT | 1/7/2019 | 9/9/2019 | 245 | 29.40% |
| 160 | RSP | 1/7/2019 | 9/9/2019 | 245 | 15.50% |
| 159 | TLT | 12/10/2018 | 1/7/2019 | 28 | 1.20% |
| 158 | RWM | 12/31/2018 | 1/7/2019 | 7 | -4.30% |
| 157 | RWM | 12/10/2018 | 12/24/2018 | 14 | 13.20% |
| 156 | VGT | 2/1/2016 | 12/10/2018 | 1043 | 72.00% |
| 155 | RSP | 2/1/2016 | 12/10/2018 | 1043 | 34.20% |
| 154 | RWM | 12/7/2015 | 2/1/2016 | 56 | 11.40% |
| 153 | TLT | 12/7/2015 | 2/1/2016 | 56 | 3.90% |
| 152 | VGT | 10/5/2015 | 12/7/2015 | 63 | 8.30% |
| 151 | RSP | 10/5/2015 | 12/7/2015 | 63 | 2.50% |
| 150 | TLT | 9/28/2015 | 10/5/2015 | 7 | -0.70% |
| 149 | RWM | 9/28/2015 | 10/5/2015 | 7 | -4.60% |
| 148 | VGT | 8/24/2015 | 9/28/2015 | 35 | 1.60% |
| 147 | RSP | 8/24/2015 | 9/28/2015 | 35 | -2.00% |
| 146 | RWM | 7/6/2015 | 8/24/2015 | 49 | 11.20% |
| 145 | TLT | 7/6/2015 | 8/24/2015 | 49 | 6.80% |
| 144 | RSP | 7/2/2012 | 7/6/2015 | 1099 | 60.80% |
| 143 | VGT | 7/2/2012 | 7/6/2015 | 1099 | 54.10% |
| 142 | VNQ | 3/5/2012 | 7/2/2012 | 119 | 6.80% |
| 141 | PXE | 3/5/2012 | 7/2/2012 | 119 | -9.80% |
| 140 | VGT | 2/6/2012 | 3/5/2012 | 28 | 3.00% |
| 139 | RSP | 2/6/2012 | 3/5/2012 | 28 | 0.40% |
| 138 | PXE | 10/3/2011 | 2/6/2012 | 126 | 39.40% |
| 137 | VNQ | 10/3/2011 | 2/6/2012 | 126 | 30.10% |
| 136 | VGT | 9/6/2011 | 10/3/2011 | 27 | -2.70% |
| 135 | RSP | 9/6/2011 | 10/3/2011 | 27 | -8.30% |
| 134 | RSP | 8/8/2011 | 8/15/2011 | 7 | 8.80% |
| 133 | VGT | 8/8/2011 | 8/15/2011 | 7 | 7.70% |
| 132 | RWM | 6/13/2011 | 8/8/2011 | 56 | 16.30% |
| 131 | TLT | 6/13/2011 | 8/8/2011 | 56 | 9.10% |
| 130 | RSP | 6/14/2010 | 6/13/2011 | 364 | 19.60% |
| 129 | VGT | 6/14/2010 | 6/13/2011 | 364 | 15.10% |
| 128 | RWM | 5/3/2010 | 6/7/2010 | 35 | 15.90% |
| 127 | TLT | 5/3/2010 | 6/7/2010 | 35 | 7.40% |
| 126 | RSP | 2/8/2010 | 5/3/2010 | 84 | 17.50% |
| 125 | VGT | 2/8/2010 | 5/3/2010 | 84 | 15.20% |
| 124 | RWM | 1/4/2010 | 2/8/2010 | 35 | 8.40% |
| 123 | TLT | 1/4/2010 | 2/8/2010 | 35 | 2.40% |
| 122 | RSP | 3/23/2009 | 1/4/2010 | 287 | 56.60% |
| 121 | VGT | 3/23/2009 | 1/4/2010 | 287 | 56.50% |
| 120 | VGT | 1/5/2009 | 2/23/2009 | 49 | -12.20% |
| 119 | RSP | 1/5/2009 | 2/23/2009 | 49 | -21.40% |
| 118 | PXE | 12/15/2008 | 1/5/2009 | 21 | 16.30% |
| 117 | VNQ | 12/15/2008 | 1/5/2009 | 21 | 5.10% |
| 116 | VNQ | 12/1/2008 | 12/8/2008 | 7 | 40.50% |
| 115 | PXE | 12/1/2008 | 12/8/2008 | 7 | -0.10% |
| 114 | PSQ | 9/2/2008 | 11/3/2008 | 62 | 27.00% |
| 113 | SH | 9/2/2008 | 11/3/2008 | 62 | 21.50% |
| 112 | VNQ | 8/4/2008 | 9/2/2008 | 29 | 4.40% |
| 111 | PXE | 8/4/2008 | 9/2/2008 | 29 | -1.00% |
| 110 | SH | 6/2/2008 | 8/4/2008 | 63 | 9.90% |
| 109 | PSQ | 6/2/2008 | 8/4/2008 | 63 | 9.80% |
| 108 | PXE | 3/17/2008 | 6/2/2008 | 77 | 28.40% |
| 107 | VNQ | 3/17/2008 | 6/2/2008 | 77 | 9.60% |
| 106 | SH | 2/4/2008 | 3/17/2008 | 42 | 7.30% |
| 105 | PSQ | 2/4/2008 | 3/17/2008 | 42 | 7.10% |
| 104 | TLT | 10/15/2007 | 2/4/2008 | 112 | 2.00% |
| 103 | RWM | 1/28/2008 | 2/4/2008 | 7 | -3.10% |
| 102 | RWM | 10/15/2007 | 1/22/2008 | 99 | 22.40% |
| 101 | VGT | 9/10/2007 | 10/15/2007 | 35 | 7.60% |
| 100 | RSP | 9/10/2007 | 10/15/2007 | 35 | 5.90% |
| 99 | RWM | 7/23/2007 | 9/10/2007 | 49 | 8.70% |
| 98 | TLT | 7/23/2007 | 9/10/2007 | 49 | 5.90% |
| 97 | VGT | 6/4/2007 | 7/23/2007 | 49 | 4.90% |
| 96 | RSP | 6/4/2007 | 7/23/2007 | 49 | -1.40% |
| 95 | PXE | 5/14/2007 | 6/4/2007 | 21 | 8.20% |
| 94 | VNQ | 5/14/2007 | 6/4/2007 | 21 | 0.60% |
| 93 | VGT | 2/5/2007 | 5/14/2007 | 98 | 5.10% |
| 92 | RSP | 2/5/2007 | 5/14/2007 | 98 | 4.70% |
| 91 | VNQ | 12/26/2006 | 2/5/2007 | 41 | 11.00% |
| 90 | PXE | 12/26/2006 | 2/5/2007 | 41 | 0.80% |
| 89 | RSP | 12/11/2006 | 12/26/2006 | 15 | -0.70% |
| 88 | VGT | 12/11/2006 | 12/26/2006 | 15 | -1.50% |
| 87 | PXE | 10/9/2006 | 12/11/2006 | 63 | 15.90% |
| 86 | VNQ | 10/9/2006 | 12/11/2006 | 63 | 7.80% |
| 85 | SH | 9/5/2006 | 10/9/2006 | 34 | -2.30% |
| 84 | PSQ | 9/5/2006 | 10/9/2006 | 34 | -4.90% |
| 83 | VNQ | 7/3/2006 | 9/5/2006 | 64 | 5.90% |
| 82 | PXE | 7/3/2006 | 9/5/2006 | 64 | 0.50% |
| 81 | PSQ | 6/26/2006 | 7/3/2006 | 7 | -1.80% |
| 80 | SH | 6/5/2006 | 7/3/2006 | 28 | -0.80% |
| 79 | TLT | 5/22/2006 | 6/5/2006 | 14 | 0.00% |
| 78 | RWM | 5/22/2006 | 6/5/2006 | 14 | -0.50% |
| 77 | RSP | 2/6/2006 | 5/22/2006 | 105 | -0.40% |
| 76 | VGT | 2/6/2006 | 5/22/2006 | 105 | -4.60% |
| 75 | PXE | 11/7/2005 | 2/6/2006 | 91 | 19.00% |
| 74 | VNQ | 11/7/2005 | 2/6/2006 | 91 | 10.10% |
| 73 | VGT | 9/6/2005 | 11/7/2005 | 62 | 1.60% |
| 72 | RSP | 9/6/2005 | 11/7/2005 | 62 | -1.50% |
| 71 | DBC | 5/2/2005 | 9/6/2005 | 127 | 23.00% |
| 70 | VNQ | 5/2/2005 | 9/6/2005 | 127 | 13.10% |
| 69 | VGT | 4/18/2005 | 5/2/2005 | 14 | 1.40% |
| 68 | RSP | 4/18/2005 | 5/2/2005 | 14 | 1.10% |
| 67 | RWM | 2/28/2005 | 4/18/2005 | 49 | 16.20% |
| 66 | TLT | 2/28/2005 | 4/18/2005 | 49 | 1.00% |
| 65 | RSP | 10/25/2004 | 2/28/2005 | 126 | 11.90% |
| 64 | VGT | 10/25/2004 | 2/28/2005 | 126 | 4.30% |
| 63 | TLT | 9/13/2004 | 10/25/2004 | 42 | 2.70% |
| 62 | RWM | 9/13/2004 | 10/25/2004 | 42 | -0.60% |
| 61 | RSP | 8/9/2004 | 9/13/2004 | 35 | 6.30% |
| 60 | VGT | 8/9/2004 | 9/13/2004 | 35 | 5.80% |
| 59 | RWM | 6/28/2004 | 8/9/2004 | 42 | 25.00% |
| 58 | TLT | 6/28/2004 | 8/9/2004 | 42 | 4.60% |
| 57 | RSP | 5/24/2004 | 6/28/2004 | 35 | 4.60% |
| 56 | VGT | 5/24/2004 | 6/28/2004 | 35 | 4.10% |
| 55 | RWM | 4/19/2004 | 5/24/2004 | 35 | 11.50% |
| 54 | TLT | 4/19/2004 | 5/24/2004 | 35 | -2.90% |
| 53 | RSP | 9/22/2003 | 4/19/2004 | 210 | 15.60% |
| 52 | VGT | 2/2/2004 | 4/19/2004 | 77 | -7.30% |
| 51 | VOE | 9/22/2003 | 2/2/2004 | 133 | 12.20% |
| 50 | TLT | 9/2/2003 | 9/22/2003 | 20 | 3.40% |
| 49 | RWM | 9/2/2003 | 9/22/2003 | 20 | -3.00% |
| 48 | RSP | 3/3/2003 | 9/2/2003 | 183 | 33.20% |
| 47 | VOE | 3/3/2003 | 9/2/2003 | 183 | 30.20% |
| 46 | RWM | 11/25/2002 | 3/3/2003 | 98 | 22.30% |
| 45 | TLT | 11/25/2002 | 3/3/2003 | 98 | 5.00% |
| 44 | RSP | 10/14/2002 | 11/25/2002 | 42 | 18.20% |
| 43 | VOE | 10/14/2002 | 11/25/2002 | 42 | 10.20% |
| 42 | TLT | 4/1/2002 | 10/7/2002 | 189 | 13.40% |
| 41 | RWM | 8/12/2002 | 9/23/2002 | 42 | 13.40% |
| 40 | RWM | 4/1/2002 | 7/15/2002 | 105 | 45.50% |
| 39 | VOE | 3/18/2002 | 4/1/2002 | 14 | -0.20% |
| 38 | RSP | 3/18/2002 | 4/1/2002 | 14 | -0.50% |
| 37 | TLT | 3/4/2002 | 3/18/2002 | 14 | -2.50% |
| 36 | RWM | 3/4/2002 | 3/18/2002 | 14 | -6.10% |
| 35 | VOE | 12/24/2001 | 3/4/2002 | 70 | 5.10% |
| 34 | RSP | 12/24/2001 | 3/4/2002 | 70 | 4.40% |
| 33 | RWM | 10/8/2001 | 12/24/2001 | 77 | -30.20% |
| 32 | TLT | 8/20/2001 | 12/24/2001 | 126 | -1.20% |
| 31 | RWM | 9/17/2001 | 9/24/2001 | 7 | 11.00% |
| 30 | RWM | 8/20/2001 | 9/10/2001 | 21 | 17.30% |
| 29 | VOE | 8/6/2001 | 8/20/2001 | 14 | -1.80% |
| 28 | RSP | 8/6/2001 | 8/20/2001 | 14 | -2.00% |
| 27 | SH | 7/2/2001 | 8/6/2001 | 35 | 2.70% |
| 26 | TLT | 5/7/2001 | 7/2/2001 | 56 | 0.10% |
| 25 | RWM | 5/7/2001 | 7/2/2001 | 56 | -5.10% |
| 24 | VOE | 4/23/2001 | 5/7/2001 | 14 | 5.40% |
| 23 | RSP | 4/23/2001 | 5/7/2001 | 14 | 3.40% |
| 22 | RWM | 4/2/2001 | 4/23/2001 | 21 | -10.60% |
| 21 | TLT | 1/16/2001 | 4/23/2001 | 97 | -1.80% |
| 20 | RWM | 1/16/2001 | 3/19/2001 | 62 | 17.10% |
| 19 | SH | 11/27/2000 | 1/16/2001 | 50 | 1.10% |
| 18 | RWM | 11/6/2000 | 11/27/2000 | 21 | 12.80% |
| 17 | TLT | 11/6/2000 | 11/27/2000 | 21 | 2.60% |
| 16 | SH | 10/30/2000 | 11/6/2000 | 7 | -2.40% |
| 15 | TLT | 10/16/2000 | 10/30/2000 | 14 | 0.90% |
| 14 | RWM | 10/16/2000 | 10/30/2000 | 14 | -1.10% |
| 13 | SH | 10/2/2000 | 10/16/2000 | 14 | 4.30% |
| 12 | RWM | 9/18/2000 | 10/2/2000 | 14 | 1.40% |
| 11 | TLT | 9/18/2000 | 10/2/2000 | 14 | 0.40% |
| 10 | SH | 8/28/2000 | 9/18/2000 | 21 | 4.90% |
| 9 | TLT | 7/3/2000 | 8/28/2000 | 56 | 2.80% |
| 8 | RWM | 7/3/2000 | 8/28/2000 | 56 | -2.00% |
| 7 | SH | 6/19/2000 | 7/3/2000 | 14 | 1.10% |
| 6 | VNQ | 6/5/2000 | 6/19/2000 | 14 | 3.10% |
| 5 | DBC | 6/5/2000 | 6/19/2000 | 14 | 0.00% |
| 4 | VOE | 4/17/2000 | 6/5/2000 | 49 | 11.20% |
| 3 | RSP | 4/17/2000 | 6/5/2000 | 49 | 7.60% |
| 2 | TLT | 1/3/2000 | 4/17/2000 | 105 | 8.50% |
| 1 | RWM | 1/3/2000 | 4/17/2000 | 105 | 6.90% |
Note that Pct Return does not include dividends.
Fascinating, thank you. I’ll be tuning in weekly.
Another aspect that jumps out is that there are only three trades of 169 in 22+ years that would trigger a -10% stop loss safeguard.
Hi, you reported -22% as max drawdown but trades 33/38 show greater losses.
By the way do you mind adding yearly returns as you always did before.
Thank you.
As I understand it trade 33 (and all the trades) are only 50% of the portfolio in general, so 22% drawdown seems reasonable.
Tom C
Return (%) *** Model *** Benchmark *** Excess
2000 *** 43.43 *** -9.74 *** 53.17
2001 *** 17.65 *** -11.76 *** 29.41
2002 *** 69.12 *** -21.58 *** 90.7
2003 *** 56.35 *** 28.18 *** 28.17
2004 *** 50.14 *** 10.7 *** 39.44
2005 *** 33.98 *** 4.83 *** 29.15
2006 *** 17.76 *** 15.85 *** 1.91
2007 *** 45.78 *** 5.15 *** 40.64
2008 *** 151.9 *** -36.79 *** 188.69
2009 *** 32.18 *** 26.35 *** 5.83
2010 *** 64.63 *** 15.06 *** 49.57
2011 *** 43.14 *** 1.89 *** 41.24
2012 *** 17.42 *** 15.99 *** 1.43
2013 *** 32.86 *** 32.31 *** 0.55
2014 *** 15.58 *** 13.46 *** 2.12
2015 *** 14.79 *** 1.23 *** 13.56
2016 *** 29.39 *** 12 *** 17.39
2017 *** 27.26 *** 21.71 *** 5.55
2018 *** 10.95 *** -4.57 *** 15.52
2019 *** 38.33 *** 31.22 *** 7.11
2020 *** 46.02 *** 18.33 *** 27.69
2021 *** 37.45 *** 28.73 *** 8.72
2022 *** 27.62 *** -19.33 *** 46.95
to 06/30/22
Hi,
Perhaps I’m mistaken but it appears that the model sometimes goes to a partial cash position.
For instance trades 155-159:
– Trades 156 & 156 close on 12/10/2018 and open into trades 157 & 159.
– Trade 157 appears to close on 12/24, but doesn’t open into Trade 158 until 12/31/2018.
– Trades 158 & 159 close on 1/7/2019
So there was a period from 12/24 -> 12/31 with a %50 cash allocation.
12/24/2018 was an early close, so trading should have been possible.
I also have this same question. The most glaring spot to me is between trades 164 and 165 (which were closed on 3/2/20) and 166 and 167 (which were opened on 4/13/20). Right in the middle of the COVID meltdown and start of the bounce back.
The model can only be in Risk-On when the drawdown over 25 days of benchmark SPY is better than -12% x (a moving average factor). So there are a few periods when it is out of Risk-On.
why not consider GOLD etf as one of the asset allocation?
Although perceived as such, GOLD is not a particularly good inflation hedge.
After reading this article, would you consider an updated version?
https://www.investors.com/etfs-and-funds/sectors/sp500-wells-fargo-heres-the-best-asset-to-own-during-inflation/
The article from Wells Fargo: Here’s The Best Asset To Own When Inflation Strikes lists Oil (USO) and Emerging Markets (VWO) as the two best performers during periods of inflation post 2000.
We found that for risk-on periods during inflationary times the Dynamic Energy Exploration & Production ETF (PXE) does better than USO and the Real Estate ETF (VNQ) also is also a better choice than VWO.
When will this model be available?
is this model live now?
It appears to be live.
The chart states that the model is “rebalanced every week”. Does that mean that the 2 positions are balanced on a dollar basis when the ETF’s do not change?
This model sets Min Rebalance Transaction to 50.00% which eliminates all rebalancing transactions.
Thus the weights are set only at the time when new buys occur (equal weight). Weighting for a position can become higher or lower than 50% depending on the relative performance of the two ETFs over time.
How come sometimes there are no positions for a while?
An an example, we can see that on 02/23/2008 we sell RSP/VGT and we buy them again only on 3/23/2008. Is there a reason to explain why we were 1 month without any position? Is there a rule to sell and stay cash?
Thank you.
The model can only be in Risk-On when the drawdown over 25 days of benchmark SPY is better than -12% x (moving average factor). So there are a few periods when it is out of Risk-On.
Thanks, Anton, this strategy is a significant improvement over it’s predecessor for high inflation environments like now. From my calculation, the previous strategy lost -5% from September to now, when the market went into reverse, whereas this strategy gained 30%, the difference being due to including the energy and property ETFs. From UK, I don’t have access to these ETFS so I use equivalents, which seems to work as well.
Hi Ted,
I was just wondering which UK equivalent ETFs you use? I am also based in the UK and I can’t seem to find an equivalent of some of the above ETFs (e.g. PSQ).
Any help would be appreciated.
Cheers
Sorry for the delay, apparently no e-mail notifications here. I use XSPS.L, XSPS.L risk-off, high inflation; XSD2.L, VVUKLD risk-off, low inflation; ENCG.L, ENCG.L risk-on, high inflation; iGUS.L, EQQQ.L risk-on, low inflation.
Has any one had their questions answered, especially regarding missing dates? As a paying customer, I expect better service and at least some type of response.
Sorry about the delay, there was a glitch that the comments were not automatically emailed to the author.
I`m new to this website so maybe some members can explain the current holdings in the Multi-Model.
On 5-2-22 SH was bought then 50% of that position was sold on the same date.Also on 5-2 PSQ was bought.
So, are the current holdings 25% cash, 25% SH and 50 % PSQ ?. If this is correct was the 50% SH position held for 2 weeks and then reduced to a 25% position per the holding rule ?
Anyone that can help with this is much appreciated
Current holdings are:
PSQ 50%
SH 50%
On 5/2/2022 the model sold PXE and VNQ.
On 5/2/2022 the model bought PSQ and SH, each having a weight of 50%.
Our report states that on 5/2/2022:
Buy SH and sell 50% SH = Buy 50% SH
Buy 50% PSQ
Thank You for the clarification
Hi Georg and Anton, I just want to check if this model here is different from the model that was recently added to P123 named: 12 Russell 3000 stocks – Inflation Attuned?
Thank you.
Yes, it is totally different.
The model on P123 is a 12-stock model hedged with SH.
The Inflation Attuned Market Timer is an ETF model, it never holds individual stocks.
Hi Georg and Anton,
Just checking when this model will be tracked weekly with detailed performance metrics (such as recent trades and performance charts) like the other models
Thanks
James
@James, The detailed performance can now be viewed weekly, thanks for the reminder.
For non-retirement account, What can I substitute PXE with? DO not like owning Real estate investments, due to delayed tax reporting complications
I meant to avoid VNQ, not PXE
You could use Health Care Select Sector SPDR Fund XLV instead of VNQ.
bonjour quelle est la différence de rendement si on utilise XLV au lieu de VNQ?
merci
Hi Georg and Anton
It it possible to please backtest this model in a 50/50 split with the QQQ model to show all the normal performance and risk management stats
Thanks again for your help
Much appreciated
James
Don’t understand the question, this model does not hold QQQ, PSQ shorts QQQ (meaning QQQ is expected to fall)
Hi, I’m asking for a backtest on a portfolio that holds 50% of this inflation strategy, and 50% of the separate iM QQQ strategy
Thanks
James
jdog007
Backtest from 2016 for this combination 50:50
Period 01/01/16 – 01/05/23
Benchmark S&P 500 (SPY:USA)
Quick Stats as of 1/5/2023
Total Return 514.76%
Benchmark Return 111.06%
Active Return 403.70%
Annualized Return 29.54%
Max Drawdown -21.58%
Benchmark Max Drawdown -33.72%
Sharpe Ratio 1.68
Correlation with S&P 500 (SPY:USA) 0.80
Performance by Calendar Year
Return (%) … Model … SPY
2016 … 25.83 … 12
2017 … 36.19 … 21.71
2018 … 5.02 … -4.57
2019 … 59.87 … 31.22
2020 … 47.29 … 18.33
2021 … 45.99 … 28.73
2022 … 0.01 … -18.18
Hi Georg and Anton,
Having read the model description carefully, I’m not understanding why the model is currently in ‘risk-on’, based on the PXE/VNQ holdings.
iM-SMC = 50% (Down-Market)
CARP is “Risk OFF”:
“For this model signals for basic risk-on situations arise when either
the Inflation Lower Timer plus the Consumer Sentiment Timer, or
the Cyclically Adjusted Risk Premium Timer, or
the SuperTimer indicate this, otherwise
if none of the above three options are true basic risk-off periods are indicated.”
Both, the Inflation Lower Timer and the Consumer Sentiment Timer are signalling “risk-on”. That is why the model is currently holding PXE and VNQ.
Got it. Thank you. I was reading the description incorrectly. Makes sense now.
loving your site and models, but if im building on it… and u suddenly stop?,,, then what i will do with my portfolio, mybe you consider to automate it all so people chould forever use your models and buy them ?
We could run them as subscription models on Portfolio 123. They are currently rethinking their membership tiers and pricing to attract more people to easily use the site. Let’s see how this develops.
I would be very interested in this. Like @babi1983, I have the same concerns about the long-term of this site.
Additionally, while I am interested in this particular model, it is very difficult to justify $800/yr subscription given the current size of my portfolio available to dedicate to this particular strategy. The other aspects of the gold subscription are of no interest to me at this time.
Hi George. Any update on potential of running subs through Portfolio 123?
same here, the models seems amazing but we need also to run backtest ourselfs, and the site here is very outdates, this super importent work must be more “out there” and more accssible, whould pay for sure also 1000$ a month for this type of automations and models which are accssble to back test
cant we automate it into a model who give signal ? as what will happen if god forbid you will close the service due to some reason?
Why pxe/vnq vs dbc or gnr or gld? The high inflation growth quadrant has multiple options; is there analysis to prove non curve fit data against pxe/vnq for other options?
Do you have an updated out-of-sample chart of Figure 1 since 5/9/22?
Having followed this signal since it was originally posted it seems like another case of curve fitting… where in sample it looks amazing, and out of sample is fairly close to random or worse. I’d love to see a market timing signal that hasn’t been interrogated so heavily in sample that it fails to produce any meaningful output out of sample. Heck even a really simple signal with worse performance in sample but at least was on par out of sample would be fine…
Can you explain the current ETF selection by the model? On Dec 23rd it bought TLT and RWM (risk off and normal inflation) but then on April 7th the model said to tell RWM and buy TLT, so then now TLT is the only ETF owned. I thought this model only bought ETFs in pairs of two?
On a number of occasions, when the S&P 500 shows a significant drawdown over 25 days then the model adjust the weight of RWM to 0% and increases the weight of TLT to 100%.
Georg,
Can you give the trades from 5/2/2022 (in your article) to current.
Thanks,
T.
Symbol ** Open ** Close
VGT ** 6/23/2025 **
RSP ** 6/23/2025 **
RWM ** 4/14/2025 ** 6/23/2025
TLT ** 4/7/2025 ** 6/23/2025
RWM ** 12/30/2024 ** 4/7/2025
VGT ** 9/3/2024 ** 12/30/2024
RSP ** 9/3/2024 ** 12/30/2024
VNQ ** 8/26/2024 ** 9/3/2024
PXE ** 8/26/2024 ** 9/3/2024
SH ** 8/12/2024 ** 8/26/2024
PSQ ** 8/12/2024 ** 8/26/2024
VNQ ** 7/15/2024 ** 8/12/2024
PXE ** 7/15/2024 ** 8/12/2024
SH ** 7/1/2024 ** 7/15/2024
PSQ ** 7/1/2024 ** 7/15/2024
TLT ** 4/29/2024 ** 7/1/2024
RWM ** 4/29/2024 ** 7/1/2024
RSP ** 3/4/2024 ** 4/29/2024
VGT ** 3/4/2024 ** 4/29/2024
VNQ ** 11/27/2023 ** 3/4/2024
PXE ** 11/27/2023 ** 3/4/2024
SH ** 10/23/2023 ** 11/27/2023
PSQ ** 10/23/2023 ** 11/27/2023
PXE ** 6/5/2023 ** 10/23/2023
VNQ ** 6/5/2023 ** 10/23/2023
SH ** 5/22/2023 ** 6/5/2023
PSQ ** 5/22/2023 ** 6/5/2023
VNQ ** 1/17/2023 ** 5/22/2023
PXE ** 1/17/2023 ** 5/22/2023
SH ** 1/3/2023 ** 1/17/2023
PSQ ** 1/3/2023 ** 1/17/2023
VNQ ** 12/19/2022 ** 1/3/2023
PXE ** 12/19/2022 ** 1/3/2023
PSQ ** 12/5/2022 ** 12/19/2022
SH ** 12/5/2022 ** 12/19/2022
VNQ ** 11/21/2022 ** 12/5/2022
PXE ** 11/21/2022 ** 12/5/2022
SH ** 11/7/2022 ** 11/21/2022
PSQ ** 11/7/2022 ** 11/21/2022
PXE ** 10/31/2022 ** 11/7/2022
VNQ ** 10/31/2022 ** 11/7/2022
PSQ ** 8/29/2022 ** 10/31/2022
SH ** 8/29/2022 ** 10/31/2022
PXE ** 8/15/2022 ** 8/29/2022
VNQ ** 8/15/2022 ** 8/29/2022
SH ** 5/2/2022 ** 8/15/2022
PSQ ** 5/2/2022 ** 8/15/2022
The homepage holdings for this model shows TLT and RWM, while the out of sample figures show VGT and RSP. Why the discrepancy and what is the actual current holding?
Thanks Georg. Performance fell off after the article: CAGR 12.4%, sharpe 0.6 (coincidently, SPY was also CAGR 12.4%, sharpe 0.6).
Thank you for pointing this out. We omitted to update the home page, but correctly reported the signal in our weekly update. The site has been corrected to show the VGT and RSP trade on 6/23/2025.
Thanks for fixing that. Note that this model is also missing from the CAGR table shown on the home page / out of sample performance summary table (it’s included in the simple returns table, but not the CAGR table).