- Reliance on a single market timer could be risky. The risk can be reduced with a composite timer who’s component timers use different, uncorrelated, financial and economic data.
- From 2001 to 2016 switching between bonds and stocks using a composite timer would have produced an average annual return of 19.7% versus only 5.2% for buy & hold stocks.

Blog Archives
Composite Market Timing Increases Returns And Reduces Drawdown.
Profitable Market Timing with the Unemployment Rate, Backtested to 1974.
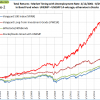
- If the unemployment rate is higher than three months ago the model exits the stock market and enters the bond market, and re-enters the market when the unemployment rate is equal or lower than where it was three months ago.
- From 2001 to 2016 switching between bonds and stocks provided significant benefits. This strategy would have produced an average annual return of 13.0% versus only 5.2% for buy&hold stocks.
- Using long-term data from 1973 to 2016 for stocks and bonds confirms the unemployment rate (UNEMP) as a profitable stock market timer.
Components for the iM Composite Timer
Instead of relying on just one market timer, many uncorrelated market timing strategies can be designed from the comprehensive and diverse financial data that is readily available, and then combining them in a robust composite market timing model. We designed six such component timers using following:
- Unemployment Rate (UNEMP),
- Performance of the Hi-Beta and Lo-Beta stocks of the S&P 500,
- TED Spread,
- Market Climate Score,
- iM Standard Timer,
- CBOE Volatility Index VIX.
Posted in blogs
Improving on Target Date Funds: 14.5% Return from the iM Best4 MC-Score Vanguard ETF Investor System
- An investor who is able to assess stock market climate, and able to adjust asset allocation accordingly, will have an advantage in the market.
- Four different approaches are used to assess market climate which are based on economic, momentum and sentiment indicators. This results in five different market climate segments.
- During up-markets the system is invested in long equity ETFs and then switches progressively to fixed-income ETFs when neutral or negative stock market climates exist.
- This system invests simultaneously in four Vanguard ETFs (or their corresponding mutual funds), appropriately selected for the prevailing market climate, and typically holds them for longer than a year.
- A backtest of the model from Jan-2000 to Aug-2016 shows an average annual return of 15% with a maximum drawdown of -12.6% and a low average annual turnover of 82%.
ETF Investing According to Market Climate: With the iM Best2 MC-Score System
- This system provides investment selections according to stock market climate. During up-markets it is long equity ETFs and switches to bond- and gold ETFs during neutral and negative markets.
- It invests periodically in only two ETFs, appropriately selected for the prevailing market climate.
- A backtest from Jan-2000 to Jul-2016 shows an average annual return of 16% with a maximum drawdown of -17% and only 61 realized trades during this 16.5 year long period.
Trading the High-Yield, Low-Volatility Stocks of the S&P500 With the iM HiD-LoV-7 System
- The system screens for S&P 500 stocks which yield significantly more than the average yield of the index and which also have a low 3-yr beta (low volatility).
- It is shown that holding continuously all the screen-selected high-yielding, low-volatility stocks of the S&P500 would have provided an average annualized return of about 14% from Jan-2000 to Jun-2016.
- Holding only the highest ranked seven stocks of this group and periodically rebalancing would have produced a higher annualized return of about 22% with a maximum drawdown of -34%.
- The iM HiD-LoV-7 System shows much higher returns and less risk than the S&P 500 Low Volatility High Dividend Index.
Franco-Nevada Better Than Gold: Evaluating Royalty Companies With iMarketSignals’ Fund Rating System
- Royalty companies receive a stream, which is an agreed-upon amount of gold, silver, or other precious metal that a mining company is obligated to deliver in exchange for up-front cash.
- From 2008 to 2016, Franco-Nevada produced the best returns of all royalty companies, and better returns than GLD or SPY.
- When compared to GLD as the benchmark, the iM-Rating for FNV is A(A), indicating that the most recent one- and five-year Rolling Returns for the company were higher than for
- Additionally, the one- and five-year rolling return graphs for FNV are sloping upwards near the end, indicating possible further excess gains over the benchmark ETFs, GLD and SPY.
The Unemployment Rate is Not Signaling a Recession: Update June 3, 2016
A reliable source for recession forecasting is the unemployment rate, which can provide signals for the beginnings and ends of recessions. The unemployment rate model (article link), updated with the May figure of 5%, does not signal a recession now.
Read more >
TIAA-CREF Actively Managed Equity Funds Did Not Add Value For Investors!
The iM Fund Rating System rates a fund’s return relative to a benchmark fund by comparing the terminal values from periodic $1.00 monthly contributions to both funds over the same period. Ratings can range from a grossly underperforming ‘E’ to a good outperforming ‘A’. The ratings are derived from the most recent past 1-yr and 5-yr Rolling Performances, shown as ‘1yr(5yr)’ e.g. A((B)).
Read more >
Posted in blogs
The Dynamic Linearly Detrended Enhanced Aggregate Spread: A Long Leading Recession Indicator
- The DAGS, short for Dynamic Linearly Detrended Enhanced Aggregate Spread, is a derivative of the Enhanced Aggregate Spread (EAS) recession indicator which comes from Robert Dieli.
- The DAGS can signal, as much as nine months ahead when a cycle peak (recession start) is likely to take place.
- Armed with that information, investors can make appropriate plans. As of writing (May 2016), it signals, at least to the end of January 2017, a continuation of the expansion phase of this business cycle.
With reference to Section 202(a)(11)(D) of the Investment Advisers Act:
We are Engineers and not Investment Advisers,
read more ...
By the mere act of reading this page and navigating this site you acknowledge, agree to, and abide by the
Terms of Use / Disclaimer