
- A reliable source for recession forecasting is the unemployment rate (UER), which can provide signals for the beginnings and ends of recessions.
- Recently Gundlach warned if the UER moves up a couple of tenths in the next couple of months, “we will be on recession watch.”
- The latest UER (March 2016) is at 5.0%, signifying that no recession is imminent. However, should the UER increase to 5.3% then a recession will be signaled.
- Investors should carefully monitor the unemployment rate, because if it moves up a few tenths of a percent from where it is now, then high recession probabilities prevail.
The following indicators are used to signal recession starts:
- A short 12-period and a long 60-period exponential moving average (EMA) of the unemployment rate (UER),
- The 8-month smoothed annualized growth rate of the UER (UERg).
- The 19-week rate of change of the UER.
The criteria for the model to signal the start of recessions are given in the original article (Apr-2012 article link) and repeated in the Appendix.
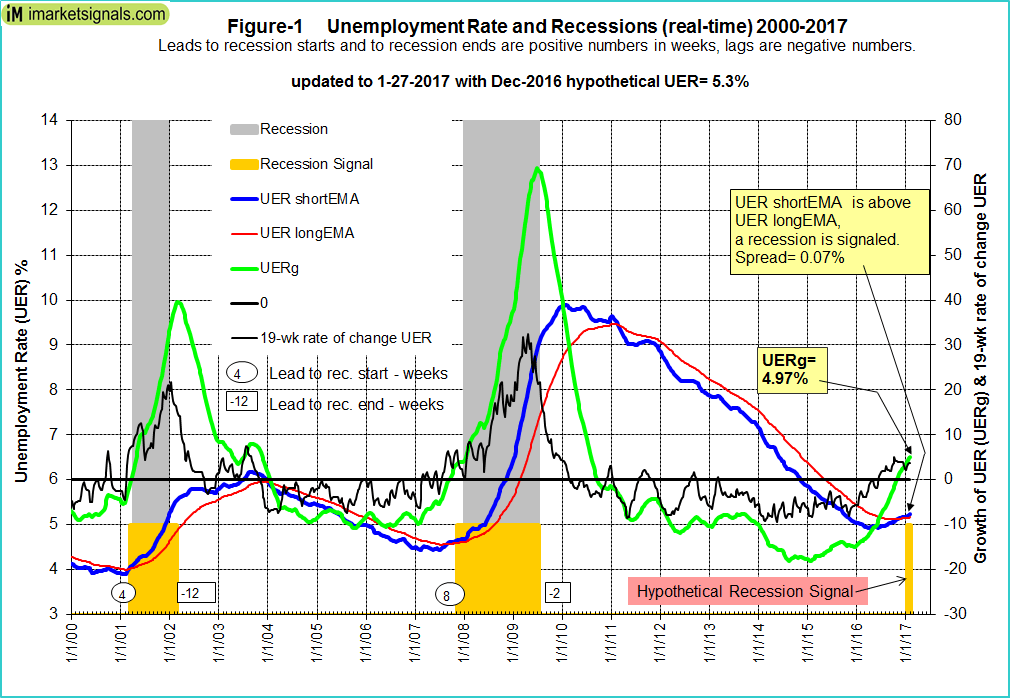
We have made a hypothetical forecast for the UER to increase to 5.3% by the end of 2016 (Apr 4.9%, May-Jun 5.0%, Jul-Aug 5.1%, Sep-Nov 5.2%, Dec 5.3%), and updated our model accordingly. For a recession signal, the short EMA of the UER would have to form a trough and then cross its long EMA to the upside. Alternatively, the UERg graph would have to turn upwards and rise above zero, or the 19-week rate of change of the UER would have to be above 8%.
Referring to Figure-1 (with hypothetical UER data from April to December 2016), and looking at the end portion of it, one can see that two of the conditions for a recession signal would then be met.
- The UER formed a trough and its short EMA is above its long EMA – the blue and red graphs, respectively, the spread being = 0.07%.
- UERg is above zero, +5.0%, the green graph.
Historic patterns of the unemployment rate indicators prior to recessions
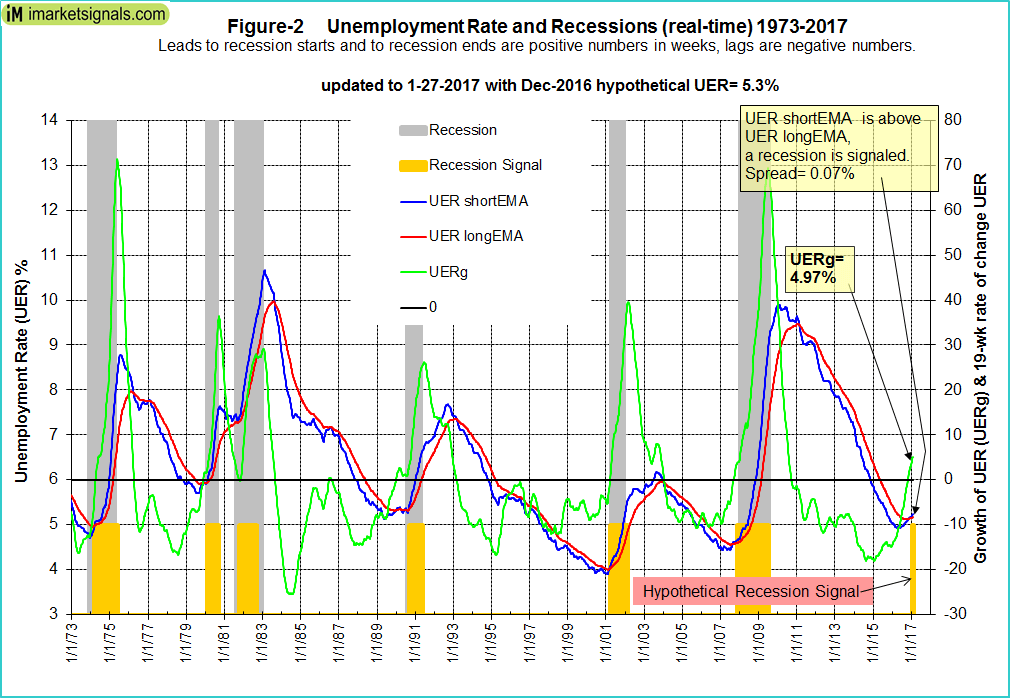
Monthly unemployment data is listed at FRED from 1948 onward, a data set that spans 11 recessions and covers a much longer period than the historical data for most other indicators. Figure-2 shows the period 1973 to 2017, with hypothetical UER data from April to December 2016. One can see that the patterns of the indicators are always similar before and after recessions.
Others have also observed this. For example, Gundlach in recent webcasts has been following a new metric – the U.S. unemployment versus its 12-month moving average; when the former drops below the latter, it is indicative of an oncoming recession. For the past eight months, unemployment has been between 4.9% and 5.1%, and Gundlach said if it moves up a couple of tenths in the next couple of months, “we will be on recession watch.”
Gundlach’s “new metric” is similar to our model’s “old metric”, namely the short 12-period and long 60-period exponential moving average cross-over condition (the blue and red graphs in Figure-2) which was published four years ago, with monthly updates since then.
Why investors should monitor the UER model
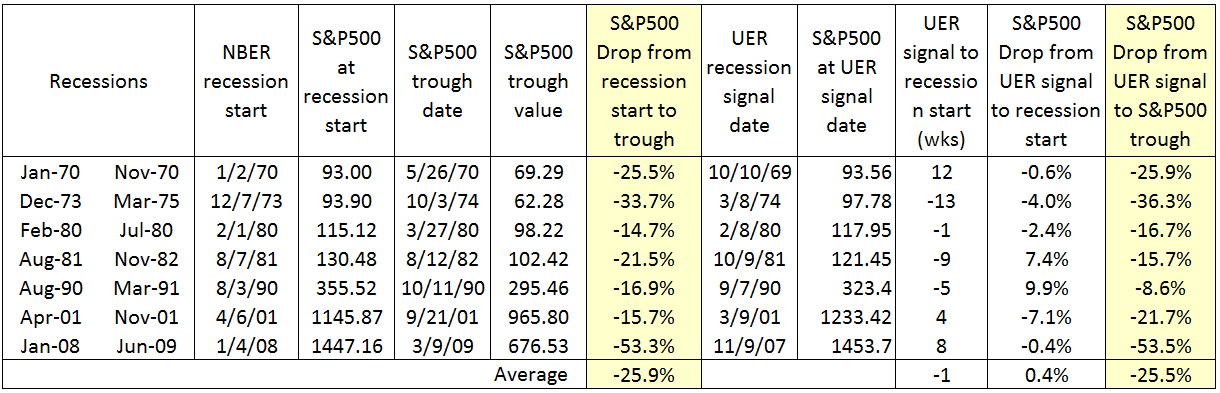
Exiting the stock market prior to, or at the beginning of recessions is an effective strategy to avoid losses in the stock market. For the last seven recessions the average loss of the S&P500 from recession start to the S&P500 trough was about 26%, as can be seen from the table below.
From the table it is apparent that the Unemployment Rate can be used as coincident recession indicator. The model signaled the start of recessions on average one week late. Investors in an S&P500 index fund would on average have avoided drawdowns of about 26%, and 54% during the last recession.
Currently the UER (March 2016) is at 5.0%, signifying that no recession is imminent. However, according to the model, should the UER increase to 5.3% in the future, then the probability for the beginning of a new recession becomes extremely high.
Investors can follow the UER model on our website iMarketSignals.com where it is updated monthly after the latest UER figure becomes available.
Appendix
The model signals the start of a recession when any one of the following three conditions occurs:
- The short exponential moving average (EMA) of the unemployment rate (UER) rises and crosses the long EMA to the upside, and the difference between the two EMAs is at least 0.07.
- The unemployment rate growth rate (UERg) rises above zero, while the long EMA of the unemployment rate has a positive slope, and the difference between the long EMA at that time and the long EMA 10 weeks before is greater than 0.025.
- The 19-week rate of change of the UER is greater than 8.0%, while simultaneously the long EMA of the UER has a positive slope and the difference between the long EMA at the time and the long EMA 10 weeks earlier is greater than 0.015.
Leave a Reply
You must be logged in to post a comment.