
- Royalty companies receive a stream, which is an agreed-upon amount of gold, silver, or other precious metal that a mining company is obligated to deliver in exchange for up-front cash.
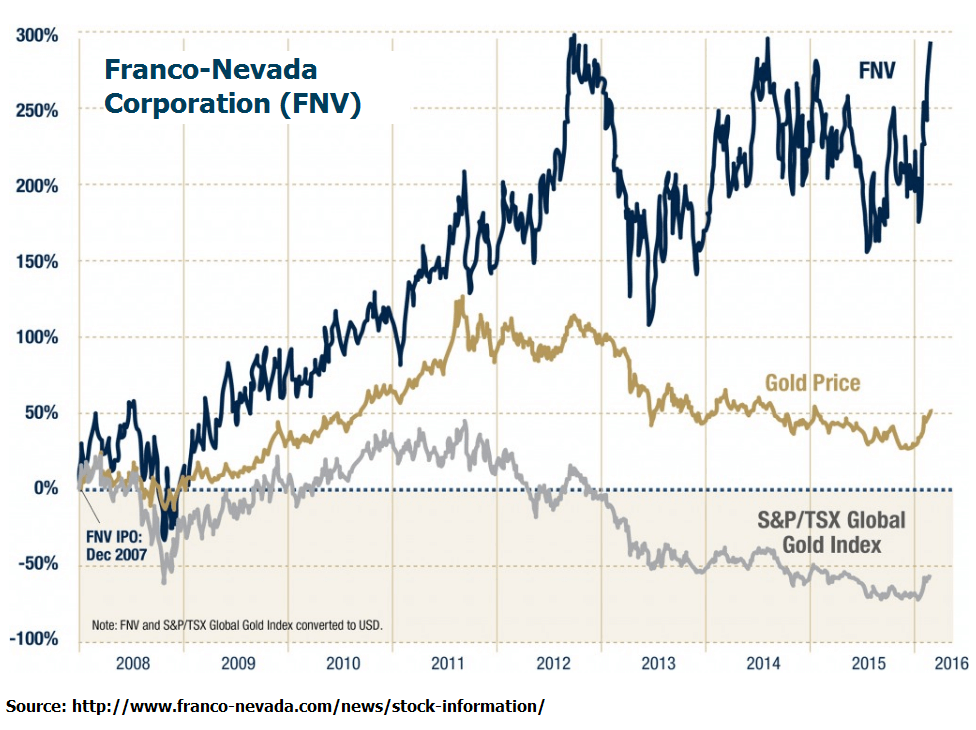
- From 2008 to 2016, Franco-Nevada produced the best returns of all royalty companies, and better returns than GLD or SPY.
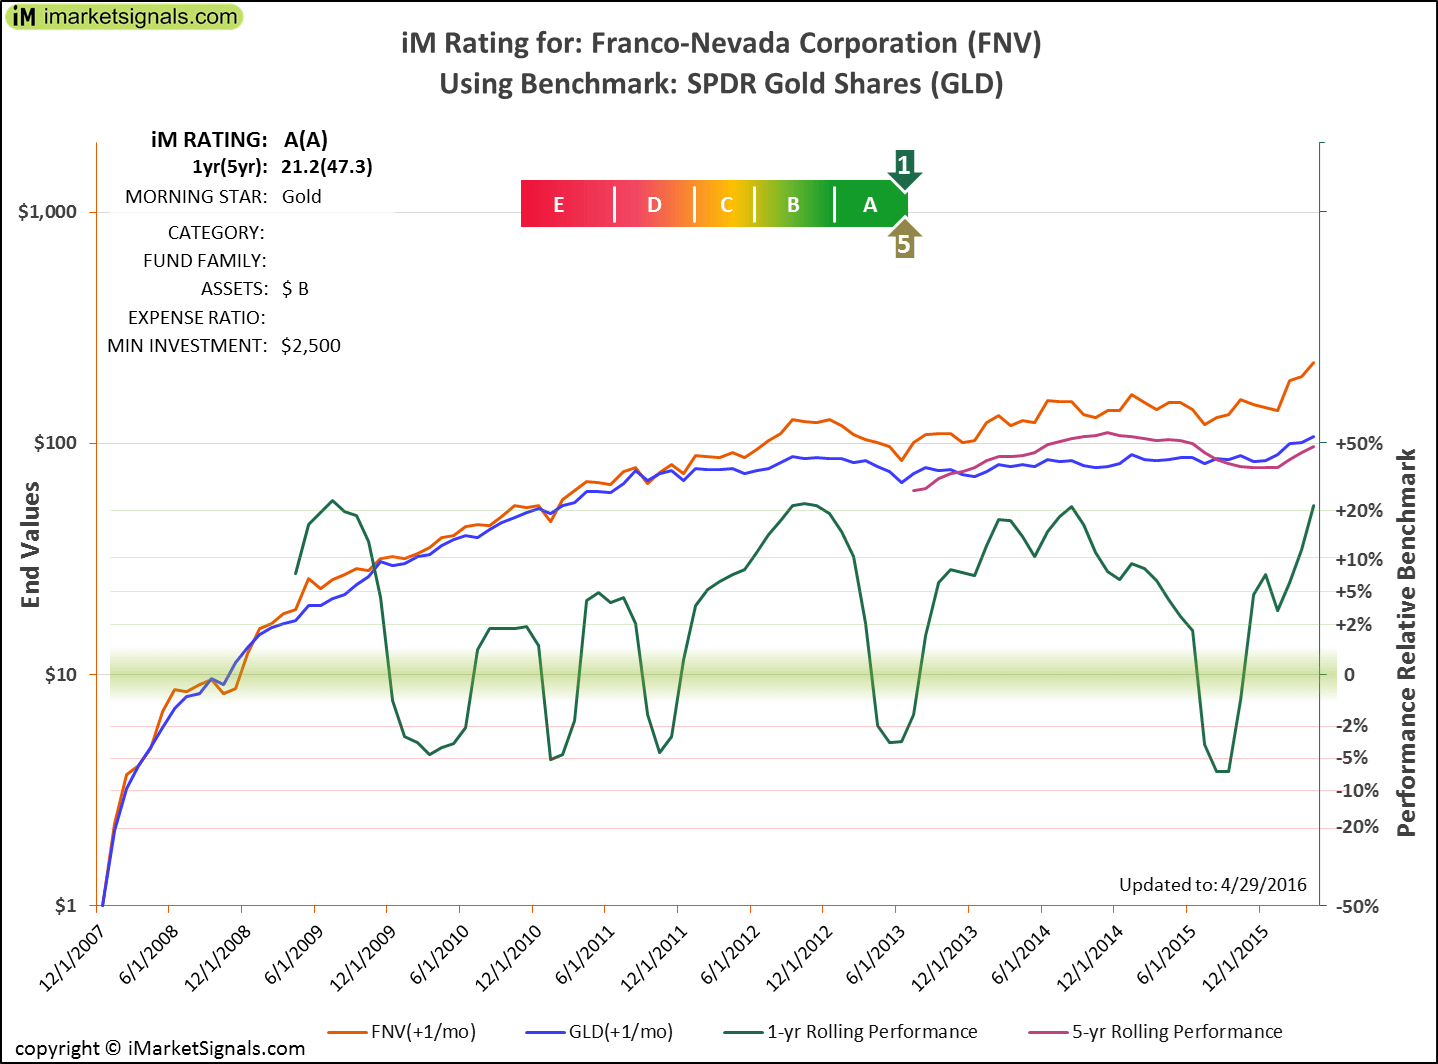
- When compared to GLD as the benchmark, the iM-Rating for FNV is A(A), indicating that the most recent one- and five-year Rolling Returns for the company were higher than for
- Additionally, the one- and five-year rolling return graphs for FNV are sloping upwards near the end, indicating possible further excess gains over the benchmark ETFs, GLD and SPY.
The gold price declined from 2011 onward; however, over the same period, the trend of the Franco-Nevada Corporation (FNV) stock price was positive, as seen from the chart below:
We calculated returns and risk measurements for FNV, as well as for other royalty companies, related ETFs and SPY. These are tabulated in Table 1 for:
- Royalty companies Franco-Nevada, Silver Wheaton (SLW), and Royal Gold (RGLD);
- Gold Miners ETF (GDX) and Vanguard Precious Metal and Mining Fund (VGPMX);
- SPDR Gold Shares ETF (GLD) and SPDR S&P 500 ETF (SPY).
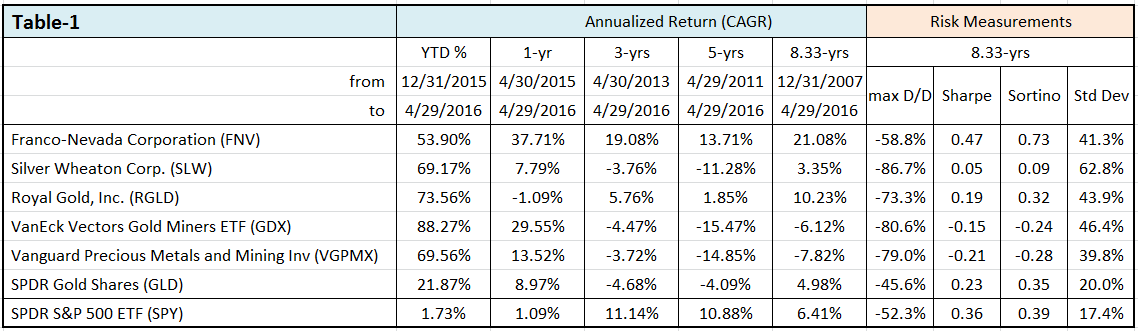
It is apparent from this table that FNV was the best-performing investment of all, with the lowest relative risk.
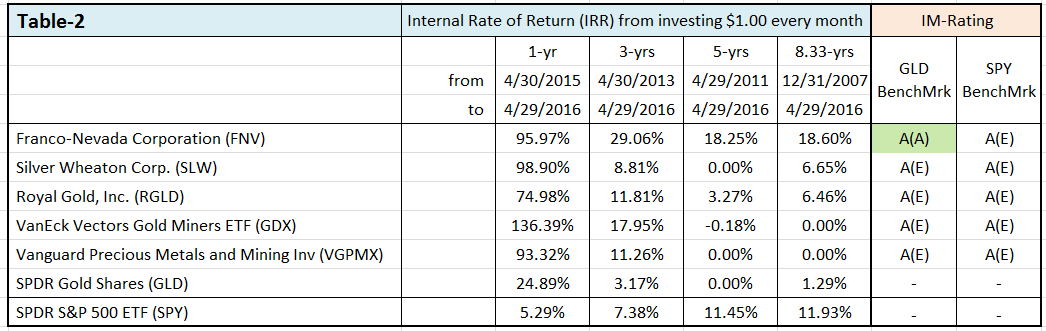
Table 2 lists for the same stocks/funds the internal rate of return from investing $1.00 every month for various periods to Apr-2016. Again, FNV produced exceptionally high returns for savers making periodic monthly investments. Royalty companies and gold miners did exceptionally well over the most recent one-year period, but FNV outperformed all others over longer investment periods. The iM-Rating of A(A) for FNV relative to GLD confirms this performance.
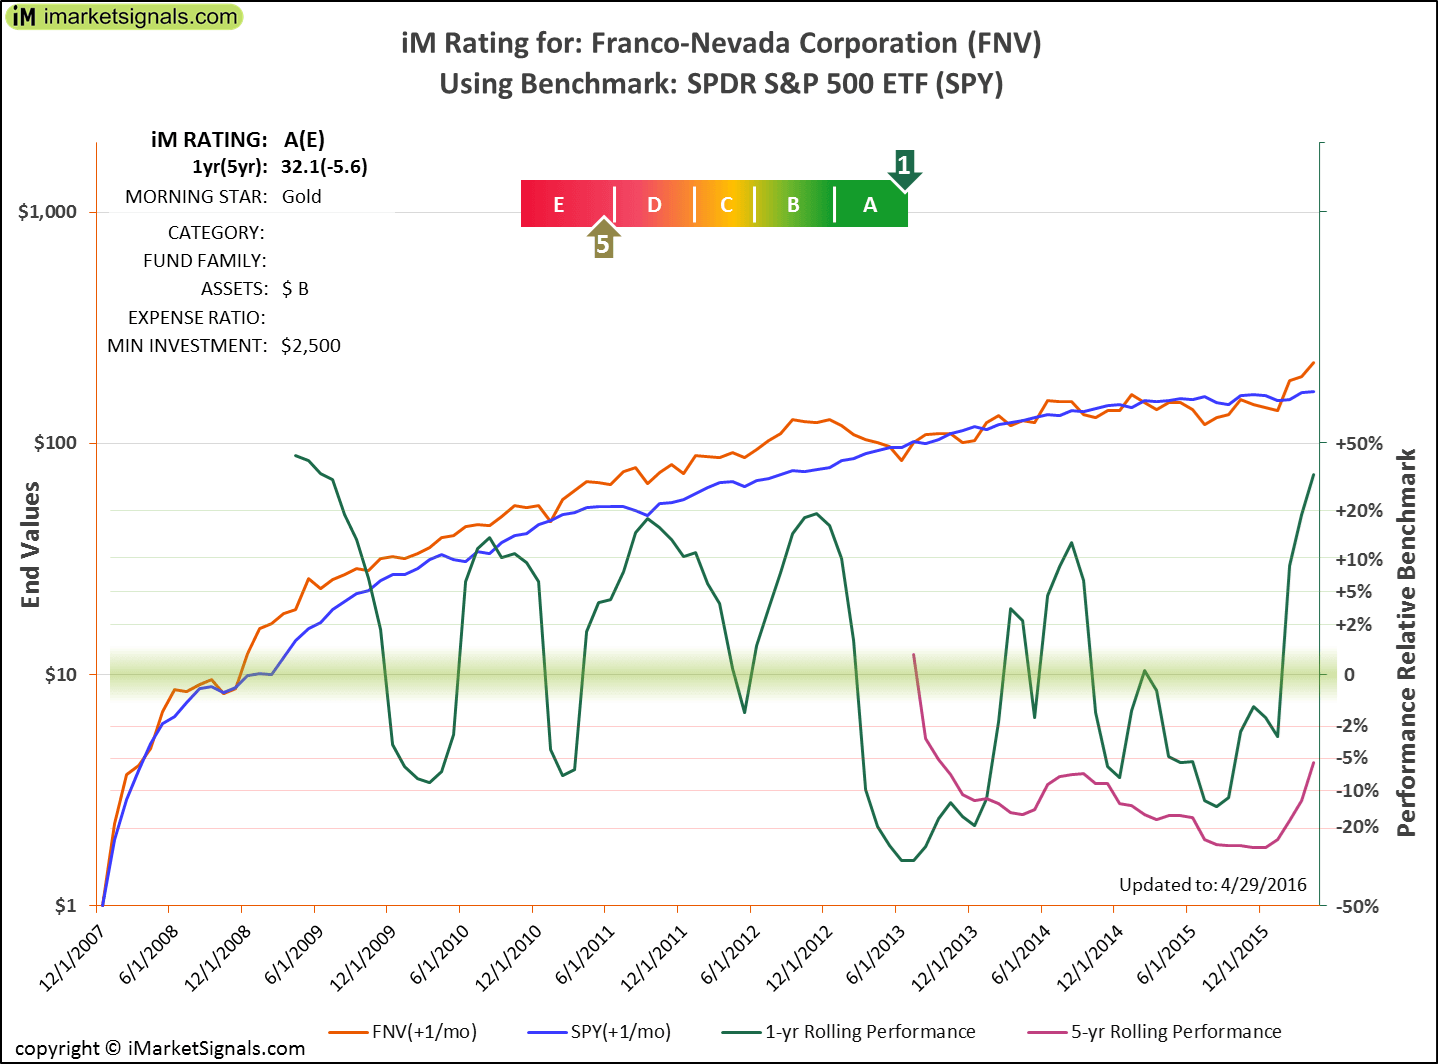
Interpreting the iM-Rating System charts for Franco-Nevada
The upper two graphs in the charts show the actual terminal values obtained from investing $1.00 every month in FNV and the benchmark SPY. These are the sums of all contributions including all gains and losses to the end of April 2016, and indicate the total savings over time. A desirable fund/stock would continuously have produced a higher terminal value than the benchmark.
The lower two graphs in the charts are the one- and five-year Rolling Performances. The five-year Rolling Performance should preferably be continuously positive, which would indicate that an investor would always have done better investing in the stock than in the benchmark over a five-year period.
For future stock performance to be better than the benchmark would require the one- and five-year Rolling Performance graphs near the end to be positive and to have upward (positive) slopes as well. Positive one- and five-year Rolling Performances show that a stock performed better than the benchmark over the last year and the last five years, respectively. Upward slopes of the Rolling Performance graphs would indicate that fund performance had constantly gained over the benchmark while the slopes were positive, and should possibly also signal further excess gains for the stock over the benchmark if the slopes are positive near the end.
FNV Vs. GLD
- Five-year Rolling Performance was always positive.
- One-year Rolling Performance is positive.
- Terminal Value is greater than for benchmark since 2011.
- FNV IRR from 12/31/2007 = 18.70%
- GLD IRR from 12/31/2007 = 1.51%
FNV Vs. SPY
- Five-year Rolling Performance is negative, but recently rising.
- One-year Rolling Performance is recently positive.
- Terminal Value is greater than for benchmark.
- FNV IRR from 12/31/2007 = 18.70%
- SPY IRR from 12/31/2007 = 12.07%
Disclosure
I/we are long in FNV
Hello,
You’ve put Table 1 two times, instead of Table 1, then Table 2. Thanks for correcting.
Thanks Pascal.