
- Holding continuously the so called “Vice” stocks of the S&P500 would have been very profitable; it would have provided an average annualized return of about 20% from Jan-2000 to Oct-2015.
- The iM-BESTOGA-3, named after the first few letters of: beer, spirits, tobacco, and gambling, holds three stocks from the GICS sub-industries: Distillers & Vintners, Brewers, Tobacco, and Casinos & Gaming.
- Backtesting the model from Jan-2000 to Oct-2015 produced a simulated annualized return of about 24.3% with a maximum drawdown of only -18%, and low annual turnover of about 130%.
Historic Performance of the S&P500 BESTOGA Stock Universe
The number of BESTOGA stocks in the S&P500 varied from a minimum of six to a maximum of ten over the backtest period Jan-2000 to Oct-2015, all as shown in the #Pos bar-chart of Figure 1.
Figure 1 shows the performance of an equal weighted investment in all available BESTOGA stocks of the S&P500 from beginning of January 2000 to October 2015, when rebalanced to equal weight every three months. The annualized return was a high 19.6% with a maximum drawdown of -35.9%. This is considerably better than the 3.9% return of SPY (the ETF tracking the S&P500 adjusted for dividends) with a -55.2% drawdown. Thus continuously only holding the BESTOGA group of the S&P500 would have been a very good investment. Currently there are only seven stocks in this group.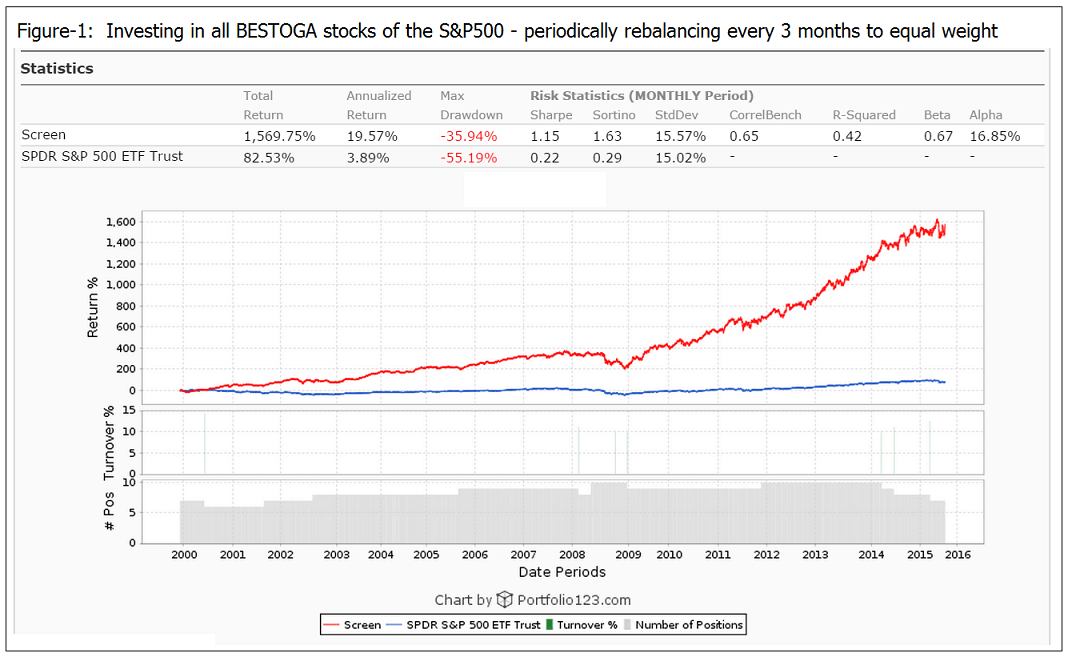
| BESTOGA Stocks of the -S&P500 October 2015 | |||
| Ticker | Name | IndCode | Yield |
| TAP | Molson Coors Brewing Co | BEVERAGE | 1.95 |
| PM | Philip Morris International Inc | TOBACCO | 4.99 |
| MO | Altria Group Inc | TOBACCO | 4.06 |
| RAI | Reynolds American Inc | TOBACCO | 3.21 |
| WYNN | Wynn Resorts Ltd | HOSPITALITY | 3.08 |
| STZ | Constellation Brands Inc | BEVERAGE | 0.94 |
| BF.B | Brown-Forman Corp | BEVERAGE | 1.22 |
Historic Performance of the 3 highest ranked S&P500 BESTOGA Stocks
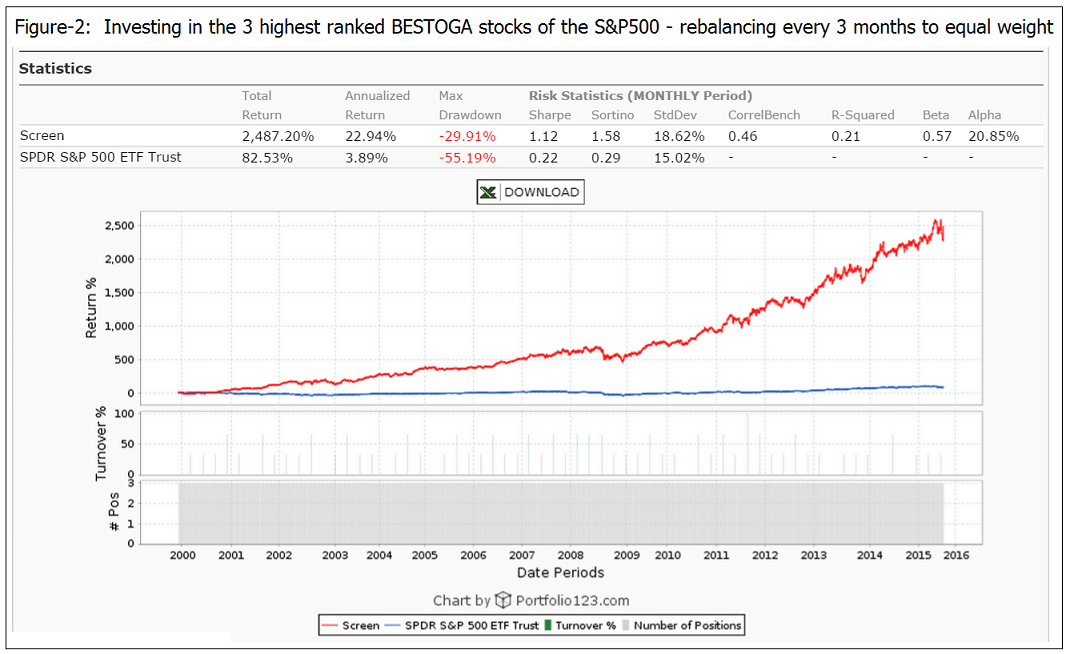
Figure 2 shows the performance of an equal weighted investment in three BESTOGA stocks (selected by a ranking system) from January 2000 to October 2015, when rebalanced to equal weight every three months. The annualized return would have been 22.9% with a maximum drawdown of -29.9%.
The iM-BESTOGA-3 System
Models with ranking systems should provide higher returns with lower drawdowns than an investment in all the available stocks. The BESTOGA-3 system selects periodically three of the highest ranked stocks from the S&P500 BESTOGA universe. The model was backtested using the on-line portfolio simulation platform Portfolio 123.
Ranking System
The models use the ranking system of our Best8(S&P500 Min-Volatility) system.
Trading Rules
Stocks are bought and sold at the next day’s closing price after a signal is generated. Variable slippage of about 0.12% of a trade amount was applied to provide for transaction slippage and brokerage fees. Market-timing, based on moving average crossovers of SPY, is contained only in the buy rules. Position weight is kept approximately equal by applying a sell rule to effect this.
No Hedging
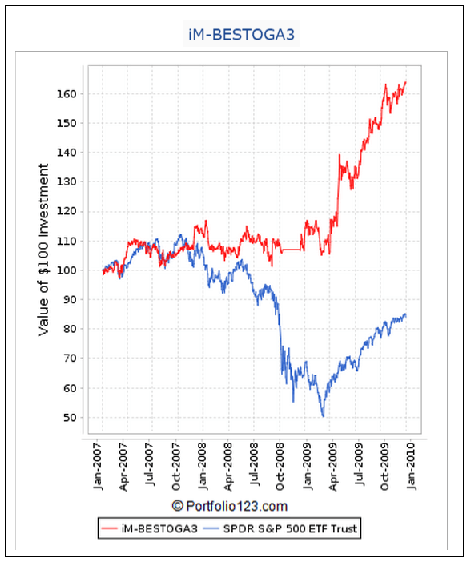
This model does not require hedging during adverse market conditions because of its good performance during down-market periods, as shown in the figures below for the periods Jan-2000 to Dec-2003, and Jan-2007 to Dec-2009. 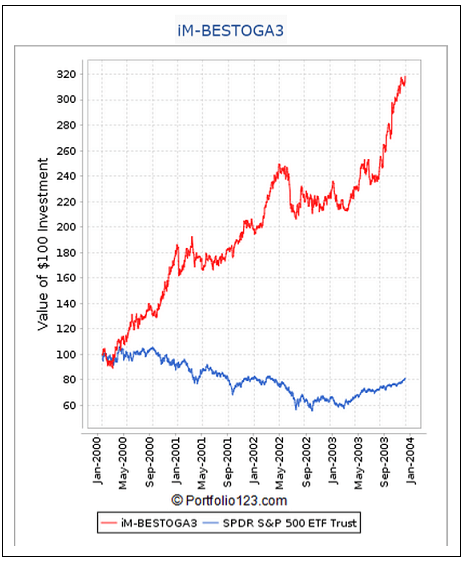
Realized Trades Analysis
An analysis of all the realized trades is shown in Table 1. There were 40 winning trades out of 68, resulting in a win rate of 59%. The average yearly turnover was about 130%. On average a position was held for 246 days. There were 10 winners held longer than one year, resulting in a Tax Efficiency of 51% for this model 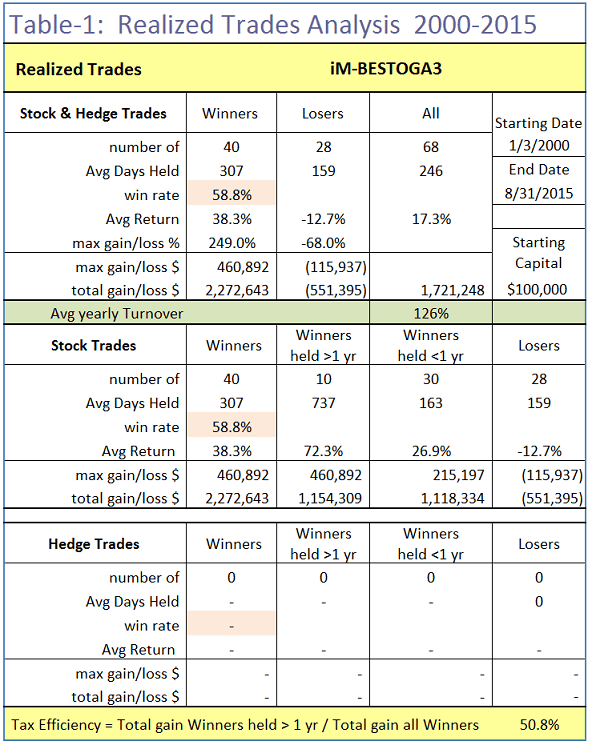
Performance Results
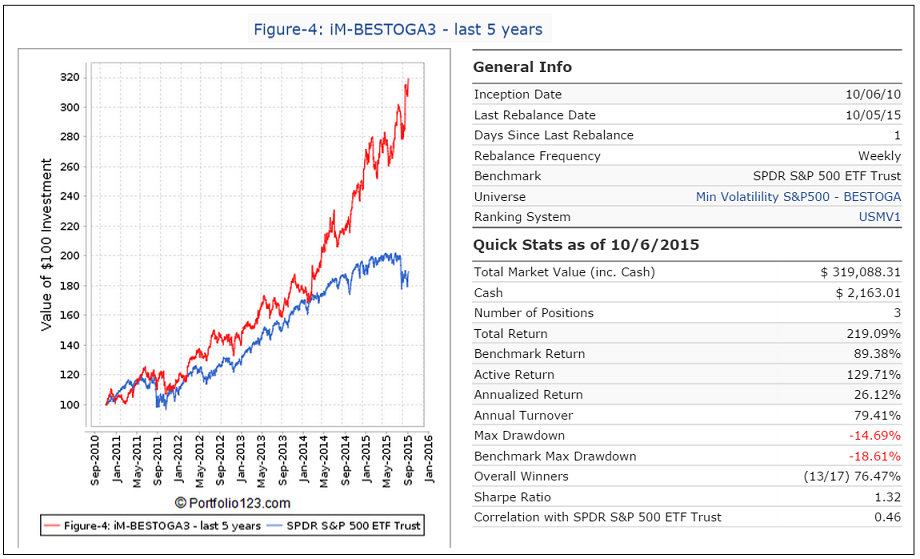
In the Figures 3 and 4 below the red graph represents the model and the blue graph shows the performance of benchmark SPY.
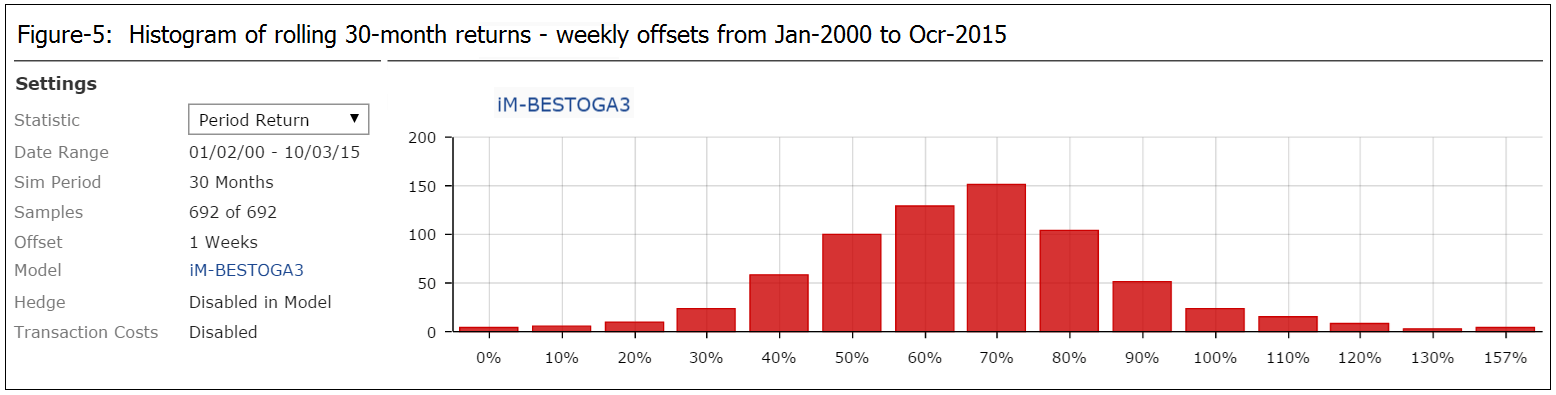
Figure 3: Performance 2000-2015: Annualized Return= 24.5%, Max DD= -17.2%. The backtest period was from Jan-2000 to Oct-2015. Figure 4: Performance last 5 years: Annualized Return= 26.1%, Max DD= -14.7%. Recently this model did not follow the market lower. From the May 2015 market high SPY lost about 6%, while BESTOGA-3 gained about 15%. Figure 5: The histogram of 30-month returns with weekly displaced start dates shows that for all 692 samples the period return ranged from 0% to 157%, with the average return being 61%. The histogram follows a normal distribution with 73% of the samples’ period returns being within 1 standard deviation away from the mean.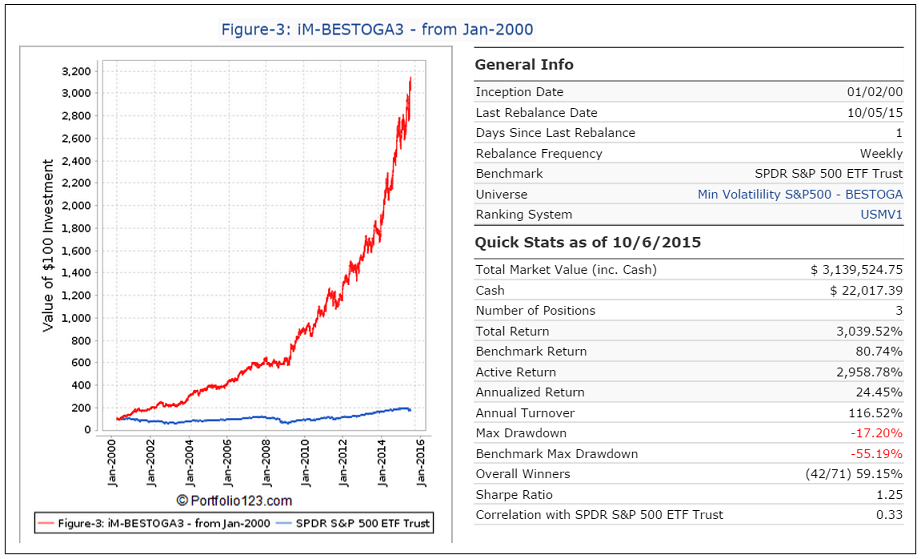
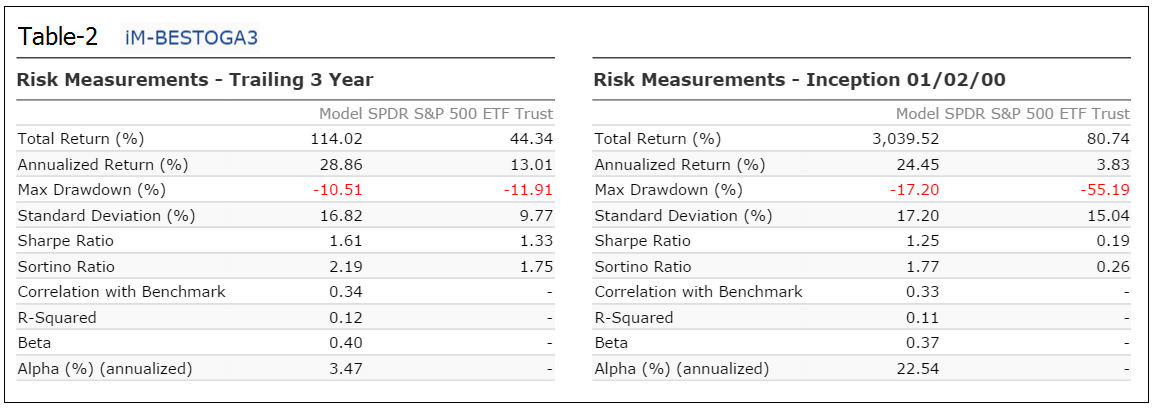
Risk Measurements
Table 2 lists the annualized returns, maximum drawdown, and various risk measurements for the trailing three years and for the full backtest period.
Liquidity
Currently this model holds TAP, PM, and MO, all large-cap stocks with ample liquidity for the normal investor.
Following the Model
This model can be followed live at iMarketSignals, where it will be updated weekly together with our other trading models.
Disclaimer
One should be aware that all results shown for the BESTOGA-3 system are from a simulation and not from actual trading. All results are presented for informational and educational purposes only and shall not be construed as advice to invest in any assets. Out-of-sample performance may be much different. Backtesting results should be interpreted in light of differences between simulated performance and actual trading, and an understanding that past performance is no guarantee of future results. All investors should make investment choices based upon their own analysis of the asset, its expected returns and risks, or consult a financial adviser. The designer of this model is not a registered investment adviser.
Could you provide (a link to) the daily value of the simulation over the period from 2000 to 2015. Would like to run some annual statistics.
Would you also provide me a link for the daily value of the simulation as well. Thanks.
Al
Sorry, we don’t have this data link available.
Georg –
During the 2001-2002 period AND 2007-2008 period, did this model BESTOGA-3 remain in cash?
RV
During those periods the model reduced its stock holdings. It was in cash from 4/2/2001 to 4/12/2001, and from 10/13/2008 to 12/12/2008.
Trading Rules for BESTOGA-3:
“Market-timing, based on moving average crossovers of SPY, is contained only in the buy rules. Position weight is kept approximately equal by applying a sell rule to effect this.”
Can you please elaborate on this and provide some detail? Thanks.
Sorry, these rules are propitiatory information.
How come the drawdown of the screened was -29.91% (Fig 2) but the drawdown of the system was only -17.2% (Fig 3)? The re-balance period – 3 months vs weekly?
In the screen the stocks are rebalanced every 3 months, and also there are no buy or sell rules. The System has different rules and holding periods.
Hi Anton and Georg
I’ve been using this Bestoga3 profitably for a while. It’s a great strategy. Any thoughts about incorporating a hedge to make it even better?
Thanks
Jim V
Jim, there is a market-timing rule in the buy rules which prevented big draw-downs durin major market declines. However, our backtests show that performance of this model does improve from a CAGR of 25% to 30% when hedged short 35% SSO during periods indicated by our Standard Market Timer. That is for the period Jan-2000 to Jul-2016.
We will have another look at it when hedging with a new market timer which we will soon have at iM which is based on momentum and economic indicators.
Georg
Understood; many thanks.
Jim
Anton and Georg,
Just so i understand there are at the most 3 positions or 9? ( 3 in each subset)
thanks
This model only holds three positions at any time.
Hi Georg
Referring back to your July 11, 2016 reply to a question I had about hedging…….Have you run any backtests using the new market timer. Very anxious to see results.
Many thanks
Vman
One can use an alternative market timer based on the Market Climate Score (MCS). Enter hedge short 35% SSO when MCS > 2, exit hedge when MCS < 3. This would have increased the return to 27.5% with the same max D/D.
Great; many thanks
Vman