“Studies have shown that your asset allocation has a bigger impact on your long-term returns than any specific fund you pick. So why not pick a Vanguard LifeStrategy Fund that has asset allocation built in?” This is the opening statement on a Vanguard web-page, which also lists other potential benefits of investing in such a fund. The historic performance of the LifeStrategy Moderate Growth Fund was analyzed from Jan-2000 onward, and it is very clear from the analysis that this was a high risk investment with low returns. An alternative investment model with Vanguard funds is proposed which would have produced much higher returns with less risk.

Blog Archives
iM’s Improved Floor-Leverage Rule with Put Option Insurance: A Low-Risk Investment Strategy with a 5.7% Safe Withdrawal Rate
iM’s Improved Floor-Leverage Rule, a low-risk investment strategy for retirement with a high 5.7% withdrawal rate, uses market timing to avoid large losses of the Surplus Portfolio, and additionally uses a strategy to guard the Surplus Portfolio against black swan events, e.g. the 1987 stock market crash, by buying put options.
More Retirement Income with iM’s Improved Floor-Leverage Rule: 6.5% Safe Withdrawal Rate
The original Floor-Leverage Rule for Retirement, as proposed by Scott and Watson, calls for two parallel investments. The first one is to establish a low risk Spending Floor Portfolio with 85% of one’s funds. The second, the Surplus Portfolio, is an investment of the remaining 15% in equities with 3× leverage. If the Surplus Portfolio exceeds 15% of the total portfolio value at annual rebalancing when withdrawals are made, it is adjusted to 15% of the total portfolio value with the excess being transferred to the Spending Floor Portfolio. The problem is that 3× leveraged stock portfolios can lose most of their value. For example, they lost 94% from 2000 to 2008, which would have wiped out almost 15% of retirement capital if one had followed the Original Floor-Leverage Rule. A better approach, and one that could avoid such losses, is to time one’s exposure to equities as put forward by our Improved Floor-Leverage Rule, which is a low-risk spending and investment strategy for retirees.
Read more >
Estimating Stock Market Returns to 2020 and Beyond: Update July 2014
July 7, 2014 About two years ago evidence was presented that a major bull market may have commenced in 2009. Additionally, a statistical analysis of the historic data of the S&P Composite presented in an Aug-2012 article and Jan-2014 update thereto supported this finding. Since August 2012 the S&P500 has now gained a real 40% to the end of June 2014. So what further gains can we expect, if any?
Minimum Volatility Stocks: Better Tax Efficient Returns also during Rising Markets
Minimum volatility ETFs should provide exposure to stocks with potentially less risk. They track indexes that try to capture the broad equity market with a reduced amount of volatility, seeking to benefit from what is known as low-volatility anomaly. Consequently they should show reduced losses during declining markets, but also reduced gains during rising markets. However, better returns with simultaneous tax efficiency can be obtained also during rising markets by selecting a number of the highest ranked stocks of a minimum volatility ETF and holding those positions for at least one year before new trades are initiated.
Read more >
Best10 June 9, 2014
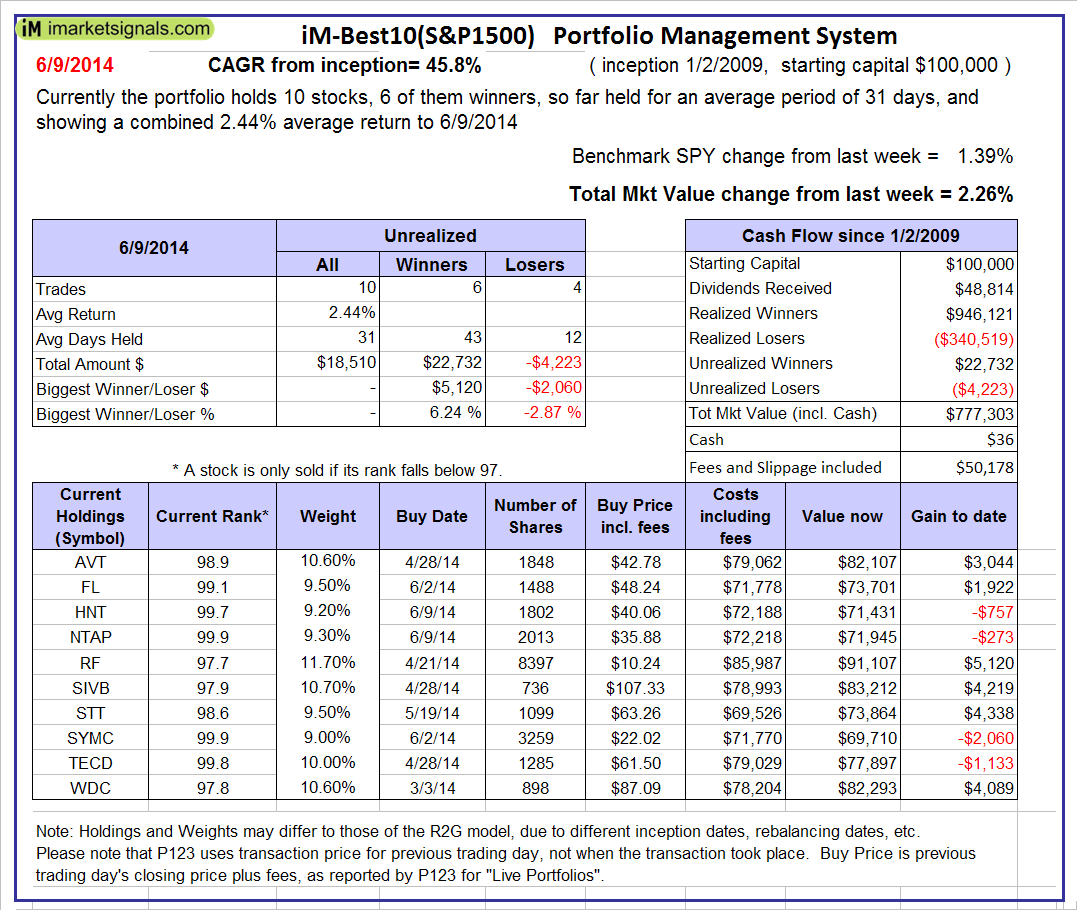 Currently the portfolio holds 10 stocks, 6 of them winners, so far held for an average period of 31 days, and showing combined 2.44% average return to 6/9/2014
Read more >
Posted in reg bestx
Best10 June 2, 2014
 Currently the portfolio holds 10 stocks, 7 of them winners, so far held for an average period of 27 days, and showing combined 0.42% average return to 6/2/2014
Read more >
Posted in reg bestx
Backtesting the MAC-System – How Long is Long Enough?
Most of us entrust our savings to financial organizations in the belief that this will provide us with better investment results than we could have achieved ourselves. These companies advocate a buy-and-hold strategy of bond- and stock funds, charge fees, and usually perform poorly. A convenient way to improve on buy-and-hold and to do better than financial organizations is to periodically switch one’s investment from stocks to bonds and vice versa as indicated by the Moving Average Crossover MAC-system.
With reference to Section 202(a)(11)(D) of the Investment Advisers Act:
We are Engineers and not Investment Advisers,
read more ...
By the mere act of reading this page and navigating this site you acknowledge, agree to, and abide by the
Terms of Use / Disclaimer