
- The accepted thinking is that the additional risk inherent in stocks is reflected by a “Risk Premium”, being the difference of S&P expected earnings yield and the 10-year note yield.
- An alternative measure of risk is the Cyclically Adjusted Risk Premium (CARP), defined as the inverse of the Shiller CAPE Ratio (CAPE) in percent minus the 10-year note yield.
- The value of the CARP and directional trend of the CAPE can be used to profitably time investments in risk-off and risk-on assets and avoid major stock market losses.
- Prior to the Financial Crisis of 2007-2008 the CARP indicated a “risk-off” asset allocation, in contrast to the S&P Risk Premium which signaled that stocks were undervalued.
- More recently, at end of February 2021, the CARP has signaled the end of embracing risk-on assets and a switch to risk-off assets.
The S&P Risk Premium and below statement comes from Portfolio 123:
The premise is that if the expected earnings yield of the market is equal to or lower than what one can earn risk-free on a 10Y note, then it does not pay to hold stocks. Conversely if the S&P expected earnings yield is higher than the 10Y note yield, then investors are receiving a “Risk Premium” for taking the additional risk inherent in stocks.
Typically stocks are considered undervalued when the S&P Risk Premium is greater than 2%. However, the S&P Risk Premium is not a good indicator of market risk. For example, from the end of 2007 onward to now it has been higher than 2%, signaling that stocks have been undervalued since then. At the onset of the “Financial Crisis” in January 2008 the S&P Risk Premium was 4.0%, giving no warning that the S&P was about to lose 55% over the next 15 months.
A better indicator of stock market risk, although not a perfect one, is the Cyclically Adjusted Risk Premium (CARP). It is the inverse of the Shiller Cyclically Adjusted Price to Earnings Ratio (CAPE) expressed in percent minus the yield of the 10-year Treasury note. In January 2008 the CARP value was -0.3%, indicating risk-off asset allocation then, while the S&P Risk Premium signaled risk-on.
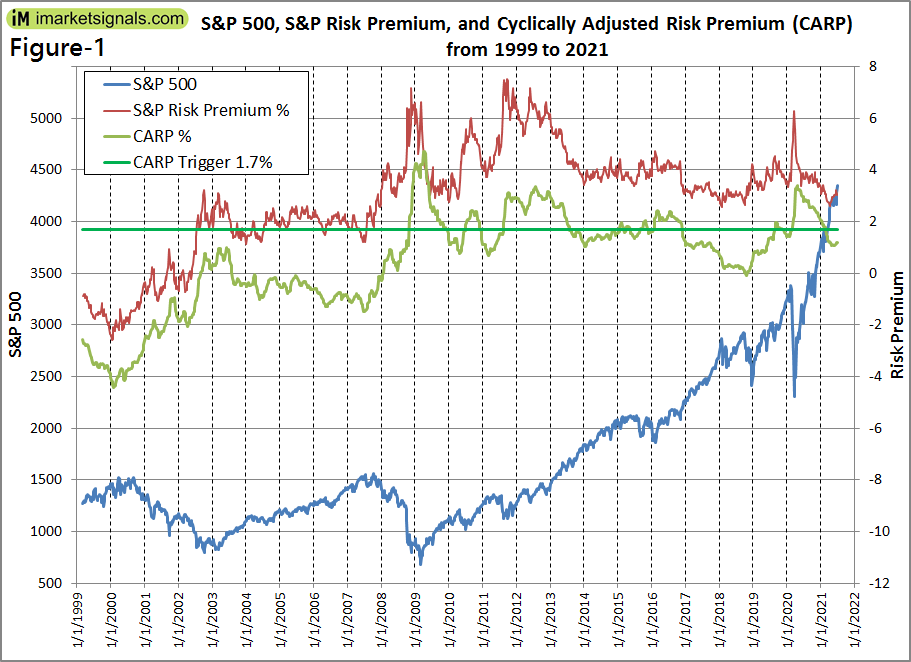
Figure-1 plots from 1999 to 2021 the S&P500, the S&P Risk Premium, and the Cyclically Adjusted Risk Premium. The CARP is on average 2.3% lower than the S&P Risk Premium, signifying that the CARP is a more realistic measure of risk. (Note that the historic data of the S&P Risk Premium comes from Portfolio 123 and the CAPE values can be downloaded from here.)
Currently the S&P Risk Premium of 3.1% signals that stocks are undervalued (risk-on), while the Cyclically Adjusted Risk Premium of 1.2% indicates that stocks are overvalued (risk-off).
The Cyclically Adjusted Risk Premium
Since the CAPE is referenced to the current Consumer Price Index the inverse of the CAPE (earnings divided by price) is also expressed in today’s dollars and thus represents a current value.
Some minor smoothing is employed to calculate the value of the CARP by using the average of the two most recent monthly values of the CAPE and the median value over one month of the 10-year Treasury Yield.
By optimization it was found that risk-off investment for a falling CAPE (more than 10% over six months) is signaled when the CARP becomes less than 0.5%, otherwise it is signaled when the CARP becomes less than 1.7%, and vice-versa for risk-on.
From Figure-1 it is evident that from March 1999 to November 2008 the CARP was always lower than 1.7%, indicating a risk-off situation. The validity of this signal is confirmed by the historic performance of the 7-10 Year Treasury Bond ETF (IEF) which showed a total return of 76% over this period, versus a loss of -11% for the S&P 500 ETF (SPY).
The CARP-Strategy
Since the CARP on its own is not a very accurate market timer it is prudent to include stock- and bond ETFs in one’s investment assets. For this analysis the risk-off and risk-on assets consist of 50% equity- and 50% bond ETFs of different risk categories. The following ETFs were used:
- Risk-off assets: 50% VIG + 50% TLT
- Risk-on assets: 50% XLK + 50% JNK
(Note that this model uses HYG prior to the inception of JNK.)
Performance
The model was back-tested on the on-line simulation platform Portfolio123 which provides historical economic and financial data from January 1999 onward, as well as extended price data for many ETFs before their inception dates. Transaction costs of 0.05% of each trade amount were taken into account to determine the performance.
Transactions were specified to only occur on the first trading day of the first week of a month. There were only 52 completed trades; the minimum and average holding period for a position would have been 1 and 9 months, respectively. A table of the historic risk-off and risk-on periods since 1999 is in the appendix.
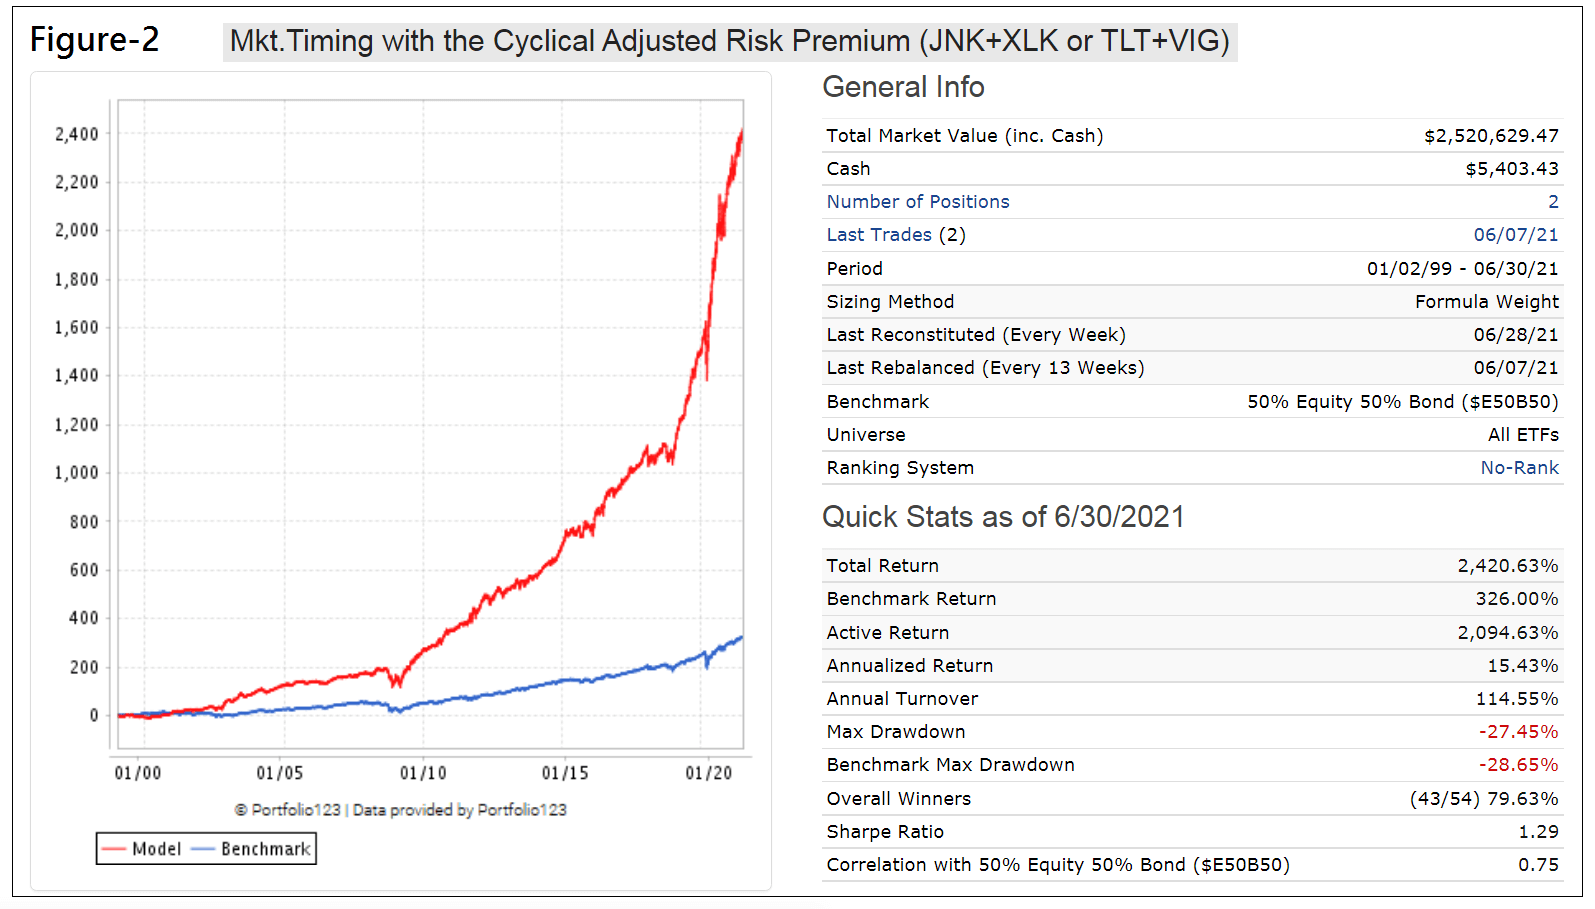
For the period 1/2/1999 to 6/30/2021 (Figure-2) the annualized return of this strategy would have been 15.4% with a maximum drawdown of -27%, versus 6.7% and drawdown of -29% for the benchmark ( 50% SPY + 50% BND)
Backtesting the CARP-Strategy from 1974 to 2021
To see whether the CARP-Strategy would have worked prior to 1999 a simulation was performed in excel with the historic data of the Vanguard Long-Term Investment-Grade Fund (VWESX) and the S&P 500 Total Return index (SP500TR).
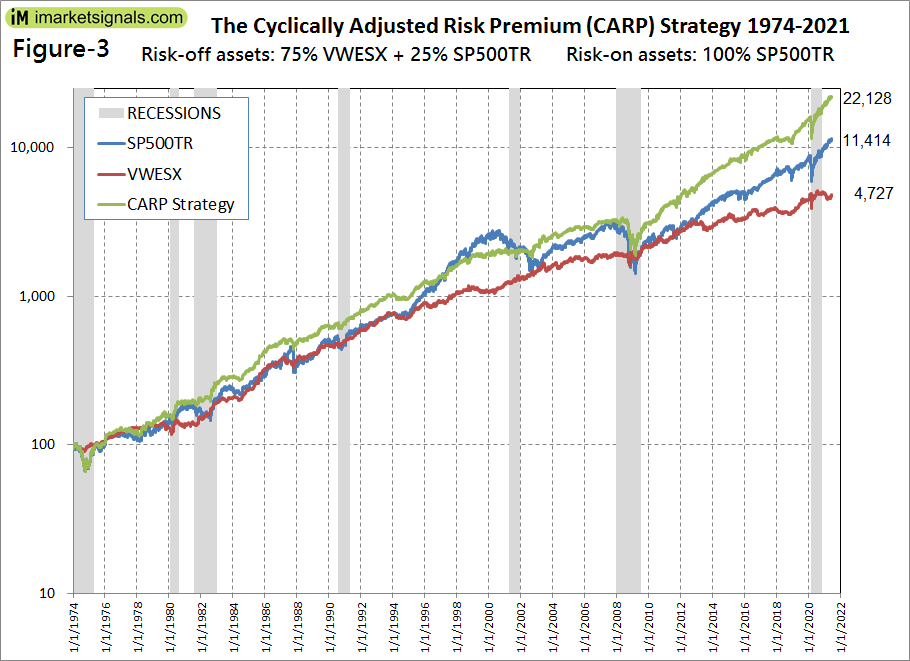
- Risk-off assets: 75% VWESX + 25% SP500TR
- Risk-on assets: 100% SP500TR
Figure-3 shows the performance of the CARP-Strategy from 1974 to 2021. Over this period the strategy produced an annualized return of 12.04%, versus 10.49% for SP500TR, and 8.45% for VWESX.
Conclusion
The long backtests from 1974 to 2021 confirms that over longer periods the CARP-Strategy would significantly outperform buy-and-hold the S&P 500 Total Return and also that of bonds. For a balanced model one has to decide on the composition of risk-off and risk-on assets, both of which should contain bond- and stock funds.
At iMarketSignals we will report weekly the current risk situation provided by this model.
Appendix
Risk-off / Risk-on Periods January 1999 to June 2021 |
||
| from | to | |
| Risk-off | 3/1/2021 | |
| Risk-on | 4/6/2020 | 3/1/2021 |
| Risk-off | 12/2/2019 | 4/6/2020 |
| Risk-on | 9/3/2019 | 12/2/2019 |
| Risk-off | 3/4/2019 | 9/3/2019 |
| Risk-on | 1/7/2019 | 3/4/2019 |
| Risk-off | 12/5/2016 | 1/7/2019 |
| Risk-on | 2/1/2016 | 12/5/2016 |
| Risk-off | 12/7/2015 | 2/1/2016 |
| Risk-on | 10/5/2015 | 12/7/2015 |
| Risk-off | 6/1/2015 | 10/5/2015 |
| Risk-on | 2/2/2015 | 6/1/2015 |
| Risk-off | 8/5/2013 | 2/2/2015 |
| Risk-on | 9/6/2011 | 8/5/2013 |
| Risk-off | 1/3/2011 | 9/6/2011 |
| Risk-on | 7/6/2010 | 1/3/2011 |
| Risk-off | 1/4/2010 | 7/6/2010 |
| Risk-on | 11/3/2008 | 1/4/2010 |
| Risk-off | 9/2/2008 | 11/3/2008 |
| Risk-on | 8/4/2008 | 9/2/2008 |
| Risk-off | 6/2/2008 | 8/4/2008 |
| Risk-on | 4/7/2008 | 6/2/2008 |
| Risk-off | 4/7/2003 | 4/7/2008 |
| Risk-on | 3/3/2003 | 4/7/2003 |
| Risk-off | 12/2/2002 | 3/3/2003 |
| Risk-on | 10/7/2002 | 12/2/2002 |
| Risk-off | 1/4/1999 | 10/7/2002 |
Disclaimer
Note: All performance results are hypothetical and the result of backtesting over the period 1974 to 2021. Since performance is dependent on market-timing rules, the future out-of-sample performance may be significantly less if those rules are not as effective as they were during the backtest period.
Anton,
1) Did you perform a test to make the On/Off change on the 1st trading day of the week after the signal occurs rather than the 1st trading day in the following month? The results?
2) Did you look at any other percentage of stocks vs. bonds such as 80%/20% vs. 20%/80%? The results?
1) Results are very much the same. Using 1st trading day in the following month reduces number of trades and is more convenient to follow.
2) 20%JNK+80%XLK or 80%TLT+20%VIG performance is better (19.4% annualized return and max D/D= -24%):
Period 01/02/00 – 07/11/21
Benchmark 50% Equity 50% Bond ($E50B50)
Ranking System No-Rank
Quick Stats as of 7/11/2021
Total Return 4,478.04%
Benchmark Return 289.54%
Active Return 4,188.49%
Annualized Return 19.44%
Annual Turnover 147.75%
Max Drawdown -23.77%
Benchmark Max Drawdown -28.65%
Overall Winners (42/54) 77.78%
Sharpe Ratio 1.51
Correlation with 50% Equity 50% Bond ($E50B50) 0.56
Hey guys,
I like this one. What was the CAGR / DD when you run this on pure SPY-IEF risk-on/risk-off. I’m guessing the raw returns are still good, and this would work well as part of an ensemble with inflation timer, yield curve timer, etc.
Tom C
Tom, you have guessed correctly. The CARP is intended to be part of an ensemble of market timers. We will soon launch such a model that always holds some stocks and bonds; not a binary model of equity or fixed income.
Results for the SPY-IEF model:
Period 01/02/00 – 07/11/21
Benchmark 50% Equity 50% Bond ($E50B50)
Quick Stats as of 7/11/2021
Total Return 2,268.09%
Benchmark Return 289.54%
Active Return 1,978.55%
Annualized Return 15.84%
Annual Turnover 117.54%
Max Drawdown -31.74%
Benchmark Max Drawdown -28.65%
Overall Winners (25/27) 92.59%
Sharpe Ratio 1.35
Correlation with 50% Equity 50% Bond ($E50B50)= 0.51
Anton,
Will this strategy be added to the tables showing performance over X weeks, and in the table showing YTD, 1 Yr, 3 Yr, etc. data?
If so, that would be helpful along with showing the current signal such as 50% VIG + 50% TLT just as you do other timing signals.
For the CARP we will only report the risk-on and risk-off situation, similar to what we report for the “iM Standard Market Timer” which is since May-23-2021 signaling Hedge ON (risk-off).
Also we are using the CARP in combination with some of our other timers in two models (soon to be published) to improve performance.