
- The difference in return of the Consumer Staples- and the Consumer Discretionary sectors can provide risk-on and risk-off signals for equity investment.
- Four time series sets are used: ETFs XLP & XLY, Portfolio 123 Specialty SP1500 Consumer Staples & Consumer Discretion, Aggregate Series Non-Cyclical & Cyclicals, and ETFs RHS & RCD.
- Investment in equities is signaled when the 15 week return of the discretionary sector outperformes the staples sector’s return.
- From 5/1/1999 to 10/1/2021 this strategy, when accordingly switching between ETF SPY and ETF IEF, would have produced a 14.9% annualized return with a maximum drawdown of -17%.
Consumer spending contributes about 70% of the total United States production. Thus it is important to assess consumer sentiment, which can be measured by the relative performance of the Consumer Non-Cyclicals sector stocks and Consumer Cyclical sector stocks.
The model signals investment in equities when the relative performance over 15 weeks for a non-cyclical series is less than the 15 week return for its companion cyclical series. The premise is that the historic relative performance is at least for some time indicative of future performance.
Non-cyclical and companion cyclical series used for the backtest:
- (a) Consumer Staples Select Sector SPDR Fund (XLP) – inception 12/16/1998
(b) Consumer Discretionary Select Sector SPDR Fund (XLY) – inception 12/16/1998 - (a) Portfolio 123 Specialty SP1500 Consumer Staples – inception 12/30/1994
(b) Portfolio 123 Specialty SP1500 Consumer Discretion – inception 12/30/1994 - (a) iM-Aggregate Series Non-Cyclical – inception 1/4/1999
(b) iM-Aggregate Series Cyclicals – inception 1/4/1999 - (a) Invesco S&P 500 Equal Weight Consumer Staples ETF (RHS) – inception 11/1/2006
(b) Invesco S&P 500 Equal Weight Consumer Discretionary ETF (RCD) – inception 11/1/2006
Note, the custom iM-Aggregate Series were compiled from the S&P 1500 companies in the FactSet Revere Business Industry Classification System (RBICS) and represent the cap-weighted performance with dividends for:
- The iM-Aggregate Series Non-Cyclical was specified to include RBICS Consumer Non-Cyclicals, Consumer Services, Healthcare Services, and Utilities, currently a total of 304 companies, and
- The iM-Aggregate Series Cyclicals was specified to include RBICS Consumer Cyclicals and Technology, currently also by coincident a total of 304 companies.
Strategy Rules
- For the above four sets of cyclical series the 15 week returns are calculated using weekly averages. The signal for equity investment requires the discretionary sector to outperform the staples sector over the 15 week period determined by applying a simple voting system over the four sets.
- All trading is specified to occur on the first trading day of a week (typically on a Monday) after a signal at the end of the preceding week. Equities and fixed income can only be sold after a minimum holding period of 45 calendar days and 25 calendar days, respectively.
Backtesting with historic point-in-time data
The backtest was performed on the online platform Portfolio 123 (P123) for the period 5/1/1999 to 10/1/2021. Trading costs of 0.05% of transaction amounts were assumed.
Since P123 allows backtesting only from 1/2/1999 onward, the backtest was started on 5/1/1999 to allow for the required lookback period.
Backtest performance with equity ETF (SPY) and fixed income ETF (IEF) from 1999
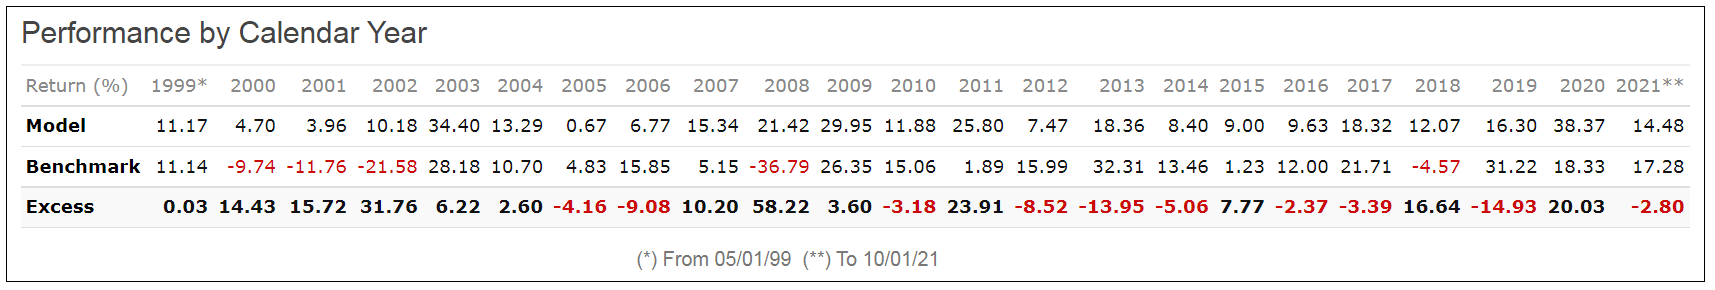
The model’s performance from 5/1/1999 to 10/1/2021 is shown in Figure-1. The model produced a 14.9% annualized return with a maximum drawdown of -17%, while the benchmark ETF (SPY) produced 7.4% with a maximum drawdown of -55%.
Over this period, longer than 22 years, there were only 70 realized buy & sell trades, indicating that one would have to trade about 3-times per year on average.
The calendar year performance is also shown below Figure-1. The model produced only positive returns for each year.

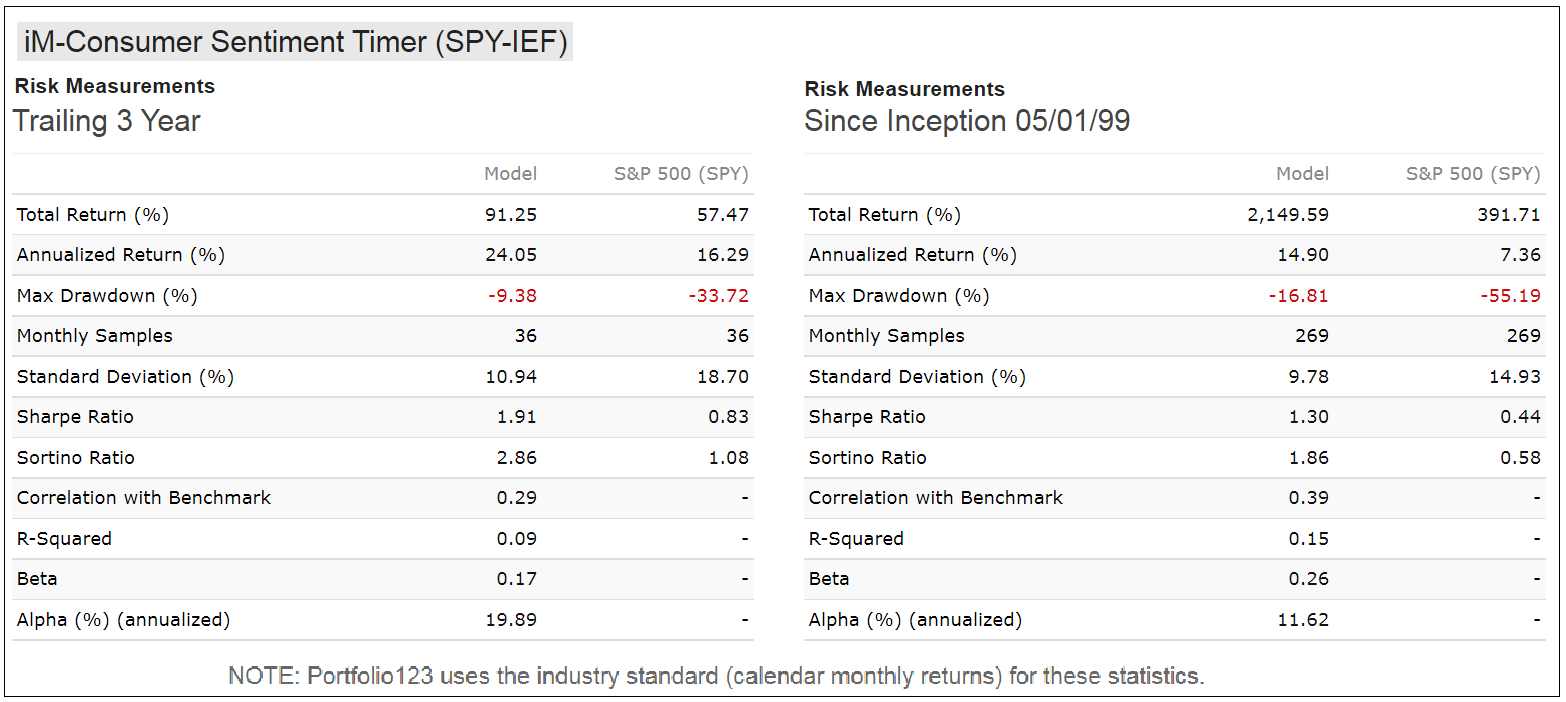
Risk Measurements
In the table below are the risk statistics for the model relative to the benchmark ETF (SPY). The model’s positive alpha indicates that this strategy would have outperformed its risk-adjusted benchmark return on average by 11.6% per year since 1999. Additionally, SPY’s much higher Standard Deviation of 15% (versus 10% for the Model) indicates higher volatility of SPY’s monthly returns and demonstrates that the model’s investment strategy should be a better alternative to buy-and-hold SPY over the longer term.
Conclusion
It would appear that one can out-perform the S&P 500 by selecting investments in equities or fixed income according to consumer sentiment as measured in this analysis by the relative performance of the Consumer Non-Cyclicals sector stocks and Consumer Cyclical sector stocks. This is a rational premise and intuitively makes sense. No other market timing is used.
The model produced an average annualized return of about 15% since 1999, and 24% for the trailing 3 years. It avoided being in equities during the worst market periods as indicated by the maximum drawdown of only -17%.
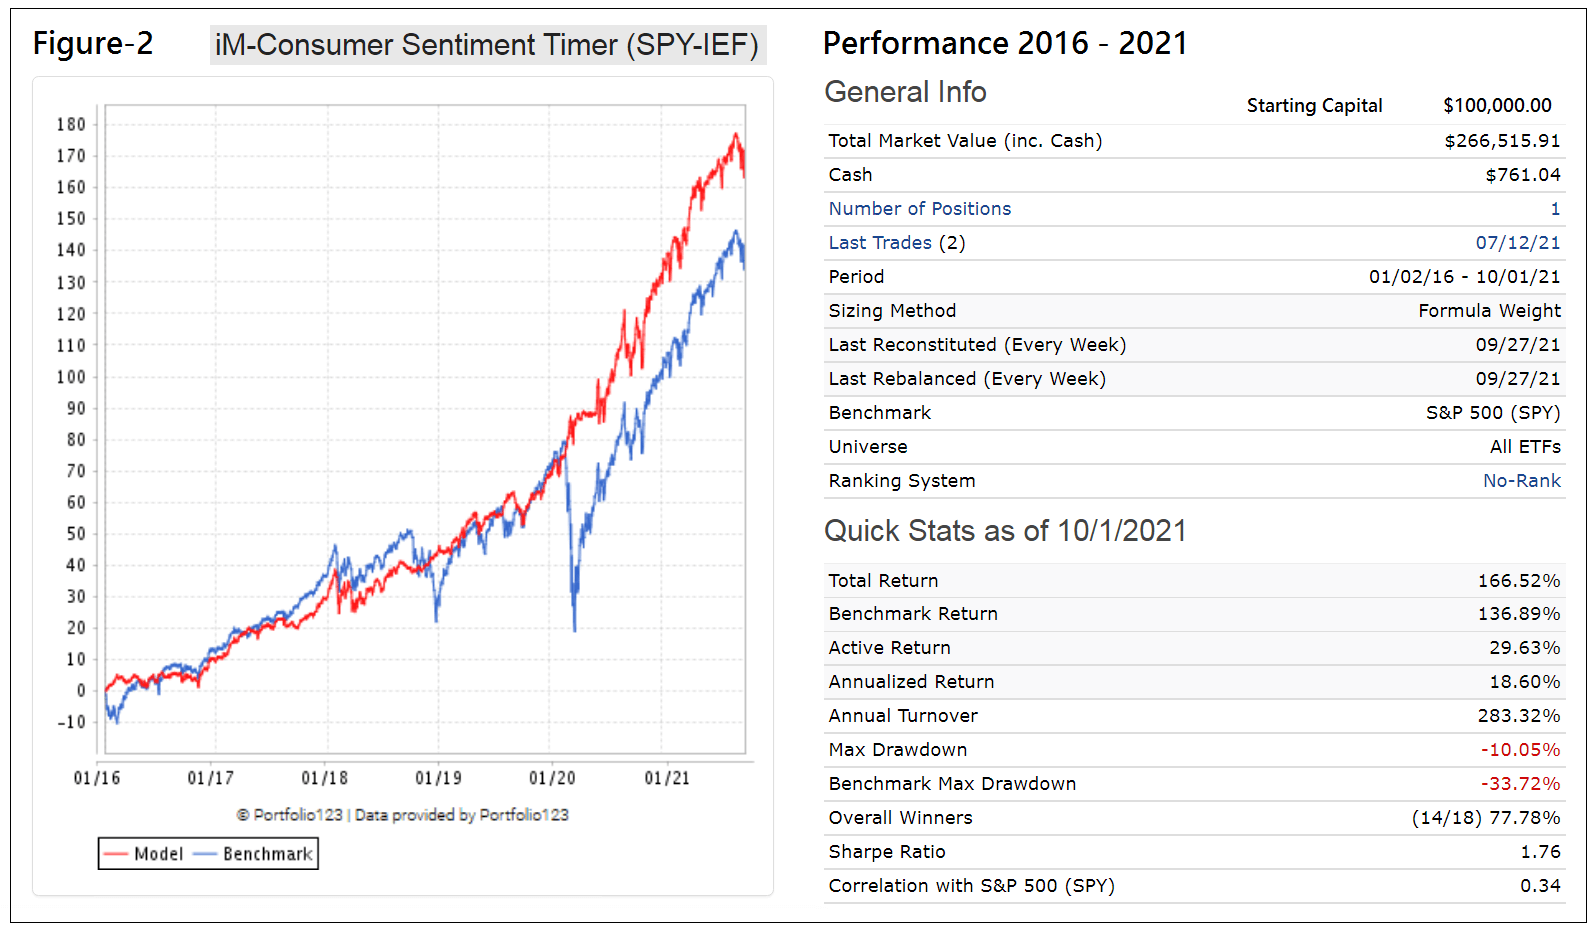
Over the up-market period 3/9/2009 to 10/1/2021 it moderately outperformed SPY, producing a total return of 764% versus 709% for SPY, with a considerably better maximum drawdown of -13% versus -34% for SPY. It also avoided the market correction in December 2018 and the “covid” bear market early in 2002 as shown in Figure-2 in the appendix.
At iMarketSignals we will report weekly the holdings and performance of this model; it currently holds SPY since 7/12/2021.
Appendix
Backtest performance with equity ETF (SPY) and fixed income ETF (IEF) from 2016
The model’s performance from 1/2/2016 to 10/1/2021 is shown in Figure-2. Note, that the model avoided the large market loss early in 2020 when it switched from SPY to IEF on 2/10/2020 and holding it until 6/1/2020.
Trading History
| Symbol | Open | Close | Days | Pct |
| IEF | 5/3/1999 | 10/4/1999 | 154 | -1.90% |
| SPY | 10/4/1999 | 4/24/2000 | 203 | 8.70% |
| IEF | 4/24/2000 | 9/18/2000 | 147 | 3.10% |
| SPY | 9/18/2000 | 11/6/2000 | 49 | -0.70% |
| IEF | 11/6/2000 | 4/23/2001 | 168 | 7.20% |
| SPY | 4/23/2001 | 6/11/2001 | 49 | 3.10% |
| IEF | 6/11/2001 | 7/9/2001 | 28 | 0.10% |
| SPY | 7/9/2001 | 8/27/2001 | 49 | -1.30% |
| IEF | 8/27/2001 | 12/24/2001 | 119 | 0.70% |
| SPY | 12/24/2001 | 3/4/2002 | 70 | 0.80% |
| IEF | 3/4/2002 | 11/18/2002 | 259 | 10.10% |
| SPY | 11/18/2002 | 1/6/2003 | 49 | 2.60% |
| IEF | 1/6/2003 | 2/3/2003 | 28 | 0.30% |
| SPY | 2/3/2003 | 3/24/2003 | 49 | 0.40% |
| IEF | 3/24/2003 | 4/21/2003 | 28 | 0.00% |
| SPY | 4/21/2003 | 2/9/2004 | 294 | 27.60% |
| IEF | 2/9/2004 | 10/11/2004 | 245 | -0.20% |
| SPY | 10/11/2004 | 1/10/2005 | 91 | 5.20% |
| IEF | 1/10/2005 | 7/18/2005 | 189 | 0.30% |
| SPY | 7/18/2005 | 9/26/2005 | 70 | -0.70% |
| IEF | 9/26/2005 | 1/17/2006 | 113 | -0.60% |
| SPY | 1/17/2006 | 3/13/2006 | 55 | 0.30% |
| IEF | 3/13/2006 | 4/10/2006 | 28 | -1.00% |
| SPY | 4/10/2006 | 5/30/2006 | 50 | -2.90% |
| IEF | 5/30/2006 | 10/9/2006 | 132 | 2.50% |
| SPY | 10/9/2006 | 2/5/2007 | 119 | 7.10% |
| IEF | 2/5/2007 | 3/5/2007 | 28 | 2.00% |
| SPY | 3/5/2007 | 4/23/2007 | 49 | 7.70% |
| IEF | 4/23/2007 | 6/25/2007 | 63 | -2.90% |
| SPY | 6/25/2007 | 8/13/2007 | 49 | -3.20% |
| IEF | 8/13/2007 | 4/7/2008 | 238 | 9.80% |
| SPY | 4/7/2008 | 5/27/2008 | 50 | 1.10% |
| IEF | 5/27/2008 | 2/17/2009 | 266 | 9.00% |
| SPY | 2/17/2009 | 11/30/2009 | 286 | 38.60% |
| IEF | 11/30/2009 | 12/28/2009 | 28 | -4.70% |
| SPY | 12/28/2009 | 6/28/2010 | 182 | -4.70% |
| IEF | 6/28/2010 | 10/11/2010 | 105 | 5.10% |
| SPY | 10/11/2010 | 3/28/2011 | 168 | 12.20% |
| IEF | 3/28/2011 | 11/28/2011 | 245 | 12.20% |
| SPY | 11/28/2011 | 5/21/2012 | 175 | 10.10% |
| IEF | 5/21/2012 | 9/10/2012 | 112 | 0.80% |
| SPY | 9/10/2012 | 1/7/2013 | 119 | 1.60% |
| IEF | 1/7/2013 | 2/4/2013 | 28 | -0.40% |
| SPY | 2/4/2013 | 3/25/2013 | 49 | 3.50% |
| IEF | 3/25/2013 | 6/10/2013 | 77 | -2.30% |
| SPY | 6/10/2013 | 3/31/2014 | 294 | 13.40% |
| IEF | 3/31/2014 | 8/4/2014 | 126 | 1.80% |
| SPY | 8/4/2014 | 10/6/2014 | 63 | 1.10% |
| IEF | 10/6/2014 | 2/2/2015 | 119 | 5.80% |
| SPY | 2/2/2015 | 7/13/2015 | 161 | 3.80% |
| IEF | 7/13/2015 | 11/9/2015 | 119 | 0.70% |
| SPY | 11/9/2015 | 12/28/2015 | 49 | -1.50% |
| IEF | 12/28/2015 | 4/25/2016 | 119 | 3.00% |
| SPY | 4/25/2016 | 6/20/2016 | 56 | -0.50% |
| IEF | 6/20/2016 | 8/1/2016 | 42 | 1.00% |
| SPY | 8/1/2016 | 3/13/2017 | 224 | 9.50% |
| IEF | 3/13/2017 | 5/15/2017 | 63 | 2.20% |
| SPY | 5/15/2017 | 8/21/2017 | 98 | 1.00% |
| IEF | 8/21/2017 | 9/18/2017 | 28 | -0.40% |
| SPY | 9/18/2017 | 8/27/2018 | 343 | 15.90% |
| IEF | 8/27/2018 | 2/4/2019 | 161 | 1.10% |
| SPY | 2/4/2019 | 5/20/2019 | 105 | 4.30% |
| IEF | 5/20/2019 | 9/16/2019 | 119 | 4.10% |
| SPY | 9/16/2019 | 11/4/2019 | 49 | 2.30% |
| IEF | 11/4/2019 | 12/2/2019 | 28 | -0.60% |
| SPY | 12/2/2019 | 2/10/2020 | 70 | 7.30% |
| IEF | 2/10/2020 | 6/1/2020 | 112 | 7.20% |
| SPY | 6/1/2020 | 6/14/2021 | 378 | 39.00% |
| IEF | 6/14/2021 | 7/12/2021 | 28 | 0.90% |
| SPY | 7/12/2021 | — | — | — |
Hi Georg,
thanks for this model. Very interesting and well thought out!
Can we see the trades with dates?
Thanks.
Trading history now added as an appendix to the article.
Thank you Georg.
I would be concerned that IEF won’t be as good as it was in the past. (But who knows?)
What’s the return if you just hold cash? What if you used a defensive sector like utilities? Or put some percent, say 50%, into SH?
Thanks, a good clear risk-on/off indicator is really valuable.
We have standardized our timing models to use SPY and IEF for risk-on and risk-off assets.
There are many other combinations that will give higher returns. It is up to the user to decide on the assets that fit their risk tolerance.
Performance stats for the Sentiment Timer with SPY and iShares 1-3 Year Treasury Bond ETF (SHY):
Period 05/01/99 – 10/01/21
Benchmark S&P 500 (SPY)
Quick Stats as of 10/1/2021
Total Return 1,032.71%
Benchmark Return 391.71%
Active Return 641.01%
Annualized Return 11.43%
Annual Turnover 298.90%
Max Drawdown -18.27%
Benchmark Max Drawdown -55.19%
Overall Winners (44/70) 62.86%
Sharpe Ratio 1.05
Hi Georg,
thanks for the additional info.
How about something a bit more aggressive?
QQQ comes to mind.
Can you run it with QQQ instead of SPY?
Thanks.
We will soon post a modified Sentiment Timer which also uses the Cyclically Adjusted Risk Premium (CARP) in the buy rules. This improves historic returns significantly.
Thanks Georg.
Looking forward to the upcoming model.
Why is there a minimum holding period? Seems kink of arbitrary. “Equities and fixed income can only be sold after a minimum holding period of 45 calendar days and 25 calendar days, respectively.”
You don’t want to trade too often. The minimum holding periods are based on historically getting the best return.
I’ve followed Georg for a while and now started a trial subscription. I’ve just read the recent featured articles “Consumer Staples/Discretionary Spending As A Reliable And Profitable Stock Market Timer” (aka “Consumer Sentiment and CARP Timer (SPY-IEF);” and “Beating the S&P 500 with Fixed Income ETFs alone.” I’m intrigued by the research but bewildered about how the site works: Does the site provide ongoing trading alerts for these two models (can’t find any) and if so, where? If you, Georg, or one of you seasoned subscribers whose comments I also read with interest, could find a spare moment to respond, I’d be grateful.
The trading model on iM for Consumer Staples/Discretionary Spending As A Reliable And Profitable Stock Market Timer is the model “iM-Consumer Sentiment Timer (SPY-IEF)” in the Bronze section.
The trading model posted on 10/19/2021 Consumer Sentiment And The Cyclically Adjusted Risk Premium Work Together As A Profitable Stock Market Timer will be in the Gold section on Sunday Oct-24 as “iM-Consumer Sentiment & CARP Timer (SPY-IEF)”
Beating the S&P 500 with Fixed Income ETFs alone is in the Gold section as “iM-Fixed Income Trader”.
We report the holdings by email every Sunday to those who have ticked on the home page (top left) to select the emails they wish to receive
Georg, this is a bit confusing, where can “iM-Consumer Sentiment & CARP Timer (SPY-IEF)” and “iM-Consumer Sentiment Timer (SPY-IEF)” be found on the website? Unless I’m missing something, these aren’t on the main updates page or on the performance summary. Thanks
“The signal for equity investment requires the discretionary sector to outperform the staples sector over the 15 week period determined by applying a simple voting system over the four sets.”
Four votes. What do you do if it’s 2 for equities and 2 for not equities?
Georg, thanks for your message of October 19. I intend to subscribe, but I’m still a bit in the dark. You said in your message, WE REPORT THE HOLDINGS BY EMAIL EVERY SUNDAY TO THOSE WHO HAVE TICKED ON THE HOME PAGE (TOP LEFT) TO SELECT THE EMAILS THEY WISH TO RECEIVE. However, (1) The home page allows the user to tick “Friday’s Weekly Update” and “Thursday’s Business Cycle Index (paused).” Is “Friday’s Weekly Update” the email you deliver on Sunday?? (2) In any case, I ticked both boxes when I started the free trial and I’ve never received an email of any kind (not in my spam, either). Can we trouble-shoot this glitch? Many thanks.