
- The Yield Curve / Federal Funds Rate Timer signals the switches from stocks to gold and vice versa near or during recession periods.
- Only three parameters are needed; the Effective Federal Funds Rate and the 2-year and 10-year U.S. Treasury yields to determine the periods when the yield curve is inverted.
- The timing rules are based on the state of yield curve and on the trend of the Effective Federal Funds Rate.
This timer signals switches from stocks (S&P500 Total Return) to gold and vice versa near or during recession periods.
Only three parameters are needed, the daily Effective Federal Funds Rate (EFFR), and the 5-day moving averages the 2-year and 10-year daily U.S. Treasury yields as measures of short-term and long-term rates.
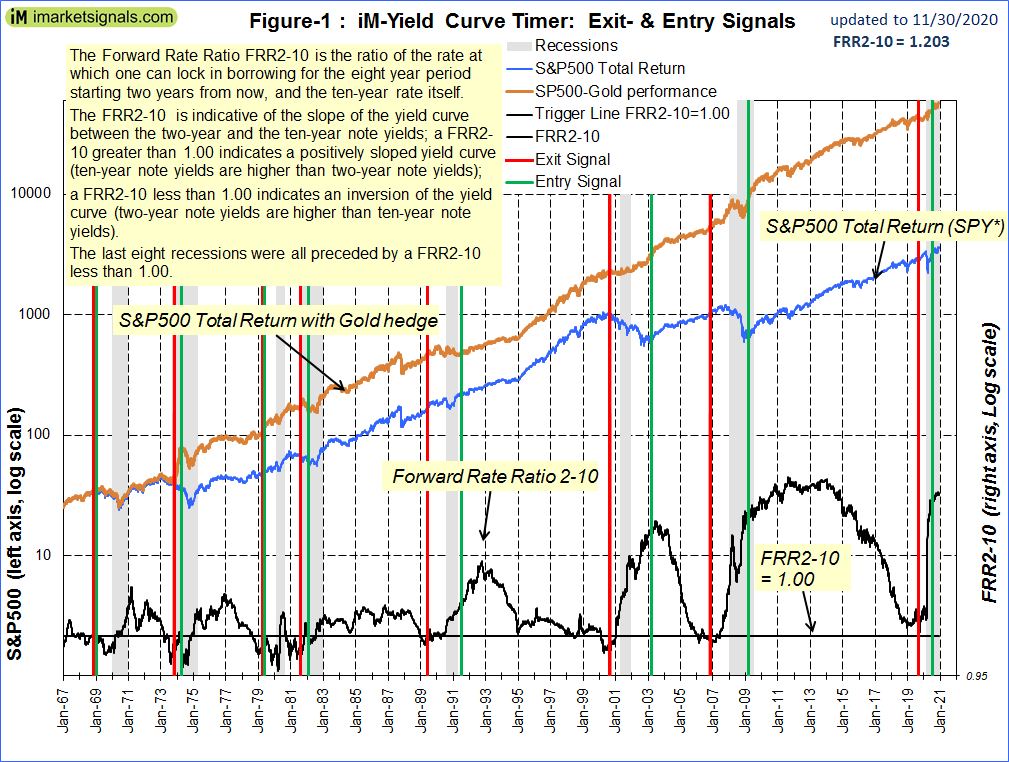
The Forward Rate Ratio (FRR2-10) is calculated from the two Treasury yields. It is the ratio of the rate at which one can lock in borrowing for the eight-year period starting two years from now and the current ten-year rate. A FRR2-10 greater than 1.00 indicates a positively sloped yield curve (ten-year note yields are higher than two-year note yields); a FRR2-10 less than 1.00 indicates an inversion of the yield curve (two-year note yields are higher than ten-year note yields). Note that the last eight recessions were all preceded by a FRR2-10 less than 1.00.
Timing Rules
The timing rules are based on the state of yield curve as indicated by the FRR2-10 and its 5-day simple moving average (SMA5), and also on the simple moving averages over 20 and 100 (SMA20 and SMA100) trading days of the EFFR.
Exit U.S. stock market and buy gold when:
- If condition FRR2-10 <= 1 occurs at least 5 times in a rolling 10 day period
- and if condition (SMA20 of EFFR < SMA100 of EFFR) occurs at least 5 times in a rolling 10 day period.
Sell Gold and enter U.S. stock market when:
- If condition (SMA20 of EFFR > a × SMA100 of EFFR) occurs at least 3 times in a rolling 10 day period,
- and a condition depending on the growth of SMA5 of FRR2-10
where a is a constants a > 1, the purpose is to stop short term exit/entry signalling at the transition points.
Performance from 1967 to 2020
For the excel analysis the performance of the S&P 500 Total Return index, here referred to as (SPY*), was calculated by splicing the data from three sources: the SPDR S&P 500 ETF (SPY) from 1993 to 2020, the Vanguard 500 Index Fund (VFINX) from 1980 to 1993 and before that from 1967 to 1980 daily data of the S&P 500 with monthly dividends taken from the Shiller CAPE data.
The analysis was performed in excel from 1967 to 2020 using the timing rules listed above. This resulted in eight periods when the model was invested in gold and not in SPY*. In Figure-1 the starting and ending dates of the gold holding periods are marked by the vertical red and green lines, respectively.
This strategy over the period 1/3/1967 to 11/30/2020 would have produced an annualized return of 15.34% with a maximum drawdown of -34.9%; or a starting capital of $100 would have grown to $220,897 over this period.
For comparison, a buy-and-hold strategy of SPY* would have produced an annualized return of 9.65% with a maximum drawdown of -55.2%; or a starting capital of $100 would have grown to $14,379 over this period.
Performance from 1999 to 2020
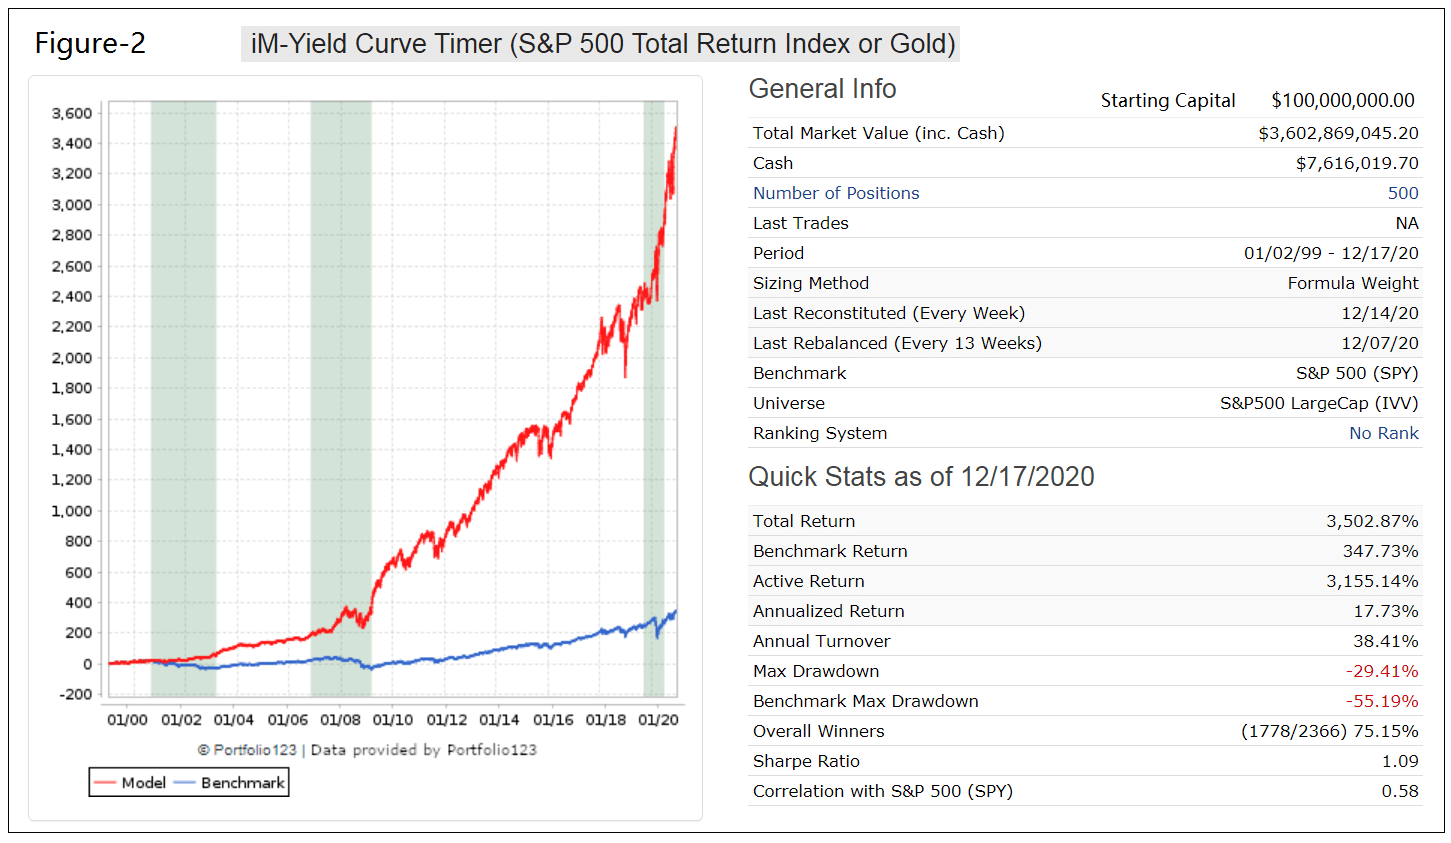
To validate the excel calculation the analysis was also performed on the on-line portfolio simulation platform Portfolio 123 (P123) which provides historic financial data for stocks, bonds and ETFs from 1999 onward.
The model’s timing rules can be written in P123 syntax and used in the hedge entry and exit rules of a simulation which uses all the cap-weighted 500 stocks of the S&P 500 index point-in-time.
The simulated performance of the S&P 500 Total Return Index with switches to gold is shown by the red plot in Figure-2, with the vertical grey bars indicating the periods when the model was in gold. The blue plot shows the performance of benchmark SPDR S&P 500 ETF (SPY).
The model’s cap-weighted stocks were rebalanced every 13 weeks (similar to the methodology used by the index provider) and switches to the SPDR Gold Trust ETF (GLD) according to the timer’s signals. Neglecting management fees and trading costs, the annualized return over the period 1/02/99 – 12/17/20 would have been 17.7% with a maximum drawdown of -29.4%, versus a return of 7.1% for the SPDR S&P 500 ETF (SPY) with a maximum drawdown of -55.2%. (Switching between ETFs SPY and GLD would have produced a marginally lower annualized return of 17.4% over this period.)
Performance comparison over periods when the model held gold
In the table below are the switching dates for the eight hedge periods determined in excel and, when applicable, also from the P123 backtest. Only one hedge period #5 did not provide a positive excess return.
The P123 analysis produced almost identical switching dates to what was calculated in excel, thus validating the calculation methodology.
Hedge # |
Platform |
Open |
Close |
Days |
GLD Return |
SPY* Return |
Excess Return |
| 1 | excel | 11/6/1968 | 1/2/1969 | 57 | 5.76% | 1.10% | 4.66% |
| 2 | excel | 10/22/1973 | 4/9/1974 | 169 | 71.28% | -13.76% | 85.04% |
| 3 | excel | 4/6/1979 | 8/3/1979 | 119 | 19.50% | 2.51% | 16.99% |
| 4 | excel | 8/10/1981 | 2/5/1982 | 179 | -2.41% | -11.63% | 9.22% |
| 5 | excel | 6/5/1989 | 7/11/1991 | 766 | 0.85% | 25.12% | -24.27% |
| 6 | excel | 8/25/2000 | 3/10/2003 | 927 | 29.53% | -44.37% | 73.90% |
| P123 | 8/28/2000 | 3/10/2003 | 924 | 28.00% | -45.80% | 73.80% | |
| 7 | excel | 10/27/2006 | 3/6/2009 | 861 | 56.44% | -45.45% | 101.89% |
| P123 | 10/30/2006 | 3/9/2009 | 861 | 51.20% | -50.10% | 101.30% | |
| 8 | excel | 9/4/2019 | 7/1/2020 | 301 | 14.59% | 7.71% | 6.87% |
| P123 | 9/9/2019 | 6/29/2020 | 294 | 17.90% | 2.30% | 15.60% |
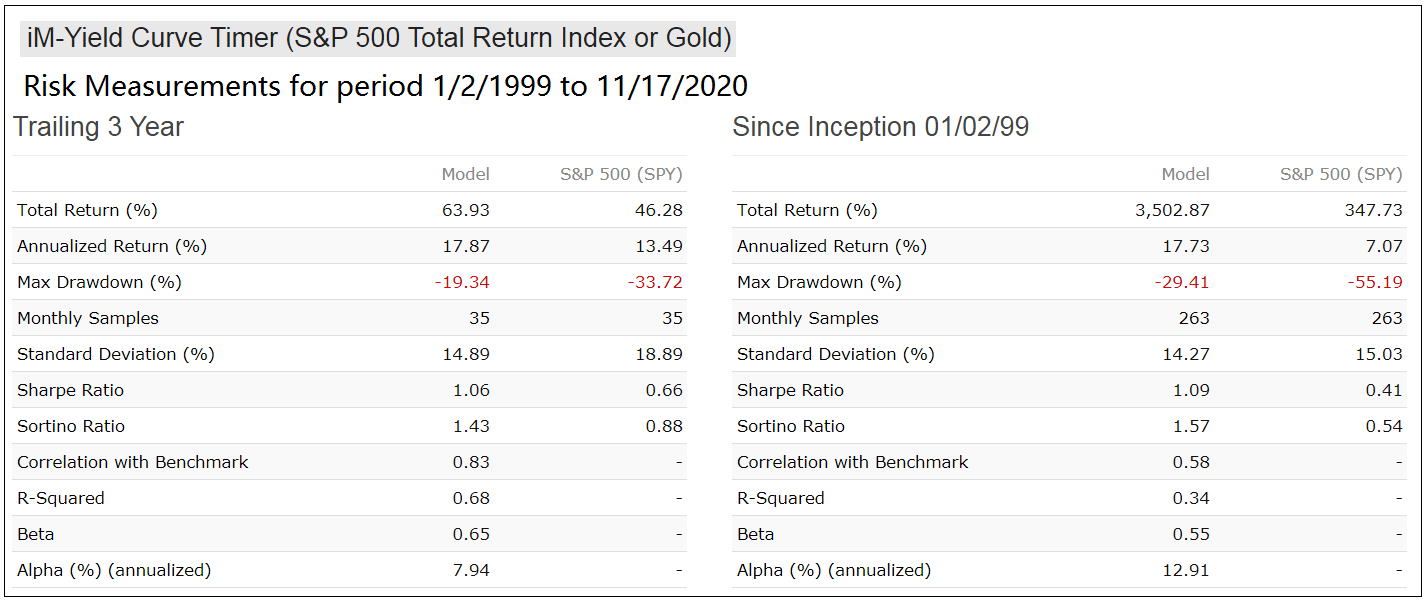
Investment Risk
In the table-2 below are the risk statistics from 1999 to 2020 for the model relative to the benchmark S&P 500 (SPY). It is evident from the risk measures that the trading strategy carries less risk than investing in SPY over the longer term.
Conclusion
It is common knowledge that an inverted yield curve is usually a harbinger of an oncoming recession. Also a downward trend of the Effective Federal Funds rate signals concern by the Federal Open Market Committee about a stalling economy.
This analysis uses only three relevant interest rates to determine signals to move from stocks to gold and vice versa. The analysis shows that such a strategy would have produced good returns. It would have, from 1967 to 2020, produced over 15-times more than a buy-and-hold investment in an S&P 500 stock index fund; from 1999 to 2020 it would have produced 10-times more.
Disclaimer:
All results shown are hypothetical and the result of backtesting over the period 1967 to 2020. No claim is made about future performance.
Hi,
Will you be tracking this going forward?
Tom C
We will incorporate this timer into the iM-Portsum/Yield Curve Timer, soon to be released.
Is it possible that some of the parameters are conveniently chosen to fit the past recessions?
Exit signals for stocks arise when the yield curve between 2-year and 10-year Treasuries becomes inverted (The FRR2-10 is <= 1.0). That typically only happens near recessions. So this is not a "conveniently chosen fit" parameter. The re-entry signal comes from the Effective Federal Funds Rate. When the EFFR has a rising again trend after a yield curve inversion it signals that the economy is in the recovery phase after a recession. Also not a "conveniently chosen fit". The backtest from 1967 encompasses 8 recessions and those signals would typically have provided reasonably good guidance to equity investors.
Hi guys,
Question about GLD holding periods in this model. You link to this article on the Yield Curve Timer, “Stock – Gold Switch Signals From The Yield Curve And The Federal Funds Rate”, which suggests that periods to hold Gold were:
8/28/00 – 3/10/03 … 28.00%
10/30/06 – 3/9/09 … 51.20%
9/9/19 – 6/29/20 … 17.90%
However, in the trade history of the ModSum / Yield Curve Timer you show in the comments above also show 3 trades, but they only appear to include a piece of those periods.
GLD … 11/18/2002 … 3/10/2003 … 10.60%
GLD … 12/22/2008 … 3/9/2009 … 8.50%
GLD … 4/20/2020 … 6/29/2020 … 1.70%
So, the sell dates match up, but not the buys. Is there something else at work in the rules that I’m not seeing?
Thanks,
Tom C
They are different models.