
Blog Archives
iM-Best Reports – 10/2/2017
Posted in pmp SPY-SH
iM-Best Reports – 9/25/2017
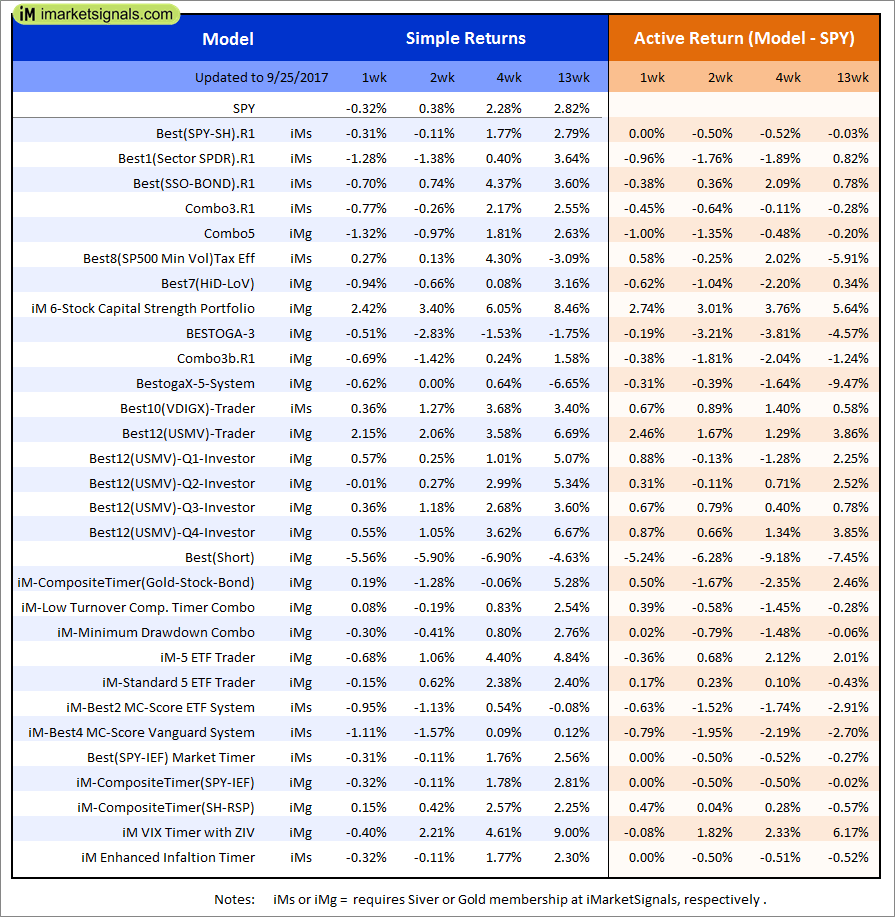 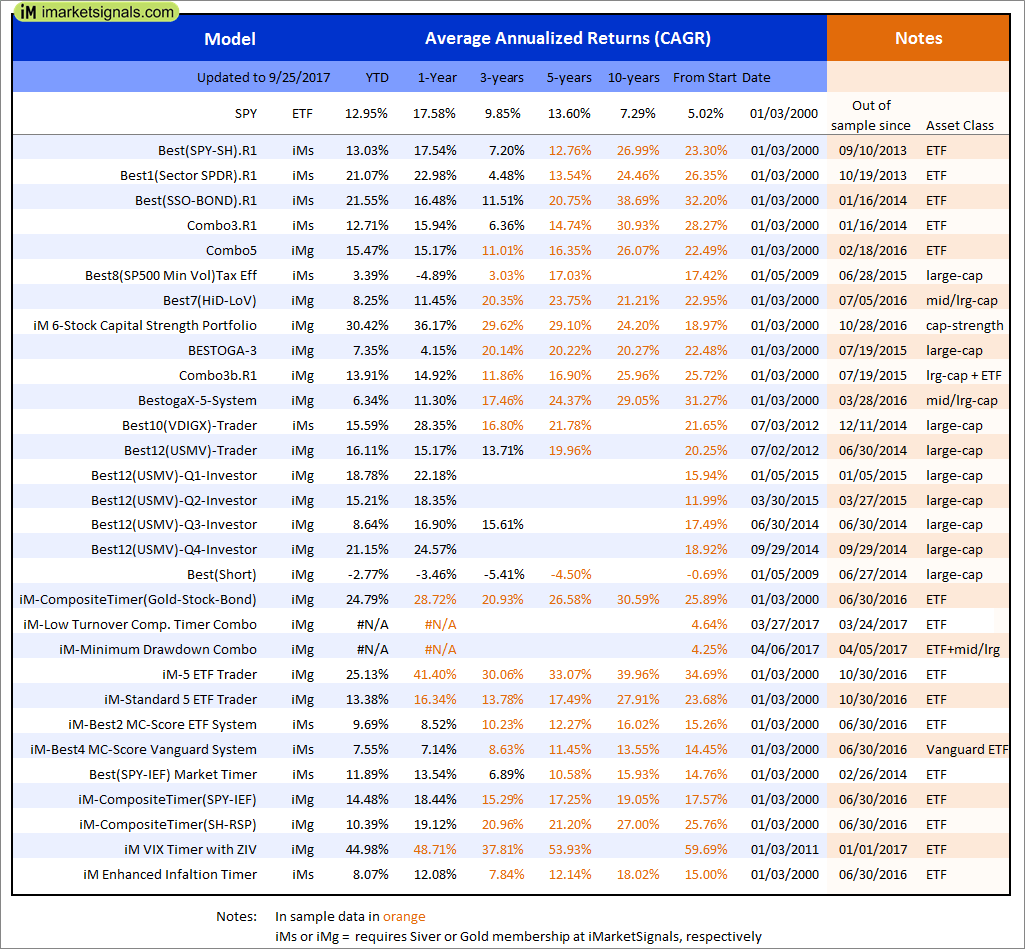 |
Out of sample performance summary of our models for the past 1, 2, 4 and 13 week periods. The active active return indicates how the models over- or underperformed the benchmark ETF SPY. Also the YTD, and the 1-, 3-, 5- and 10-year annualized returns are shown in the second table |
 |
iM-Best(SPY-SH).R1: The model’s out of sample performance YTD is 13.0%, and for the last 12 months is 17.6%. Over the same period the benchmark SPY performance was 12.9% and 17.6% respectively. Over the previous week the market value of Best(SPY-SH) gained -0.31% at a time when SPY gained -0.32%. A starting capital of $100,000 at inception on 1/2/2009 would have grown to $522,428 which includes $4,654 cash and excludes $15,358 spent on fees and slippage. |
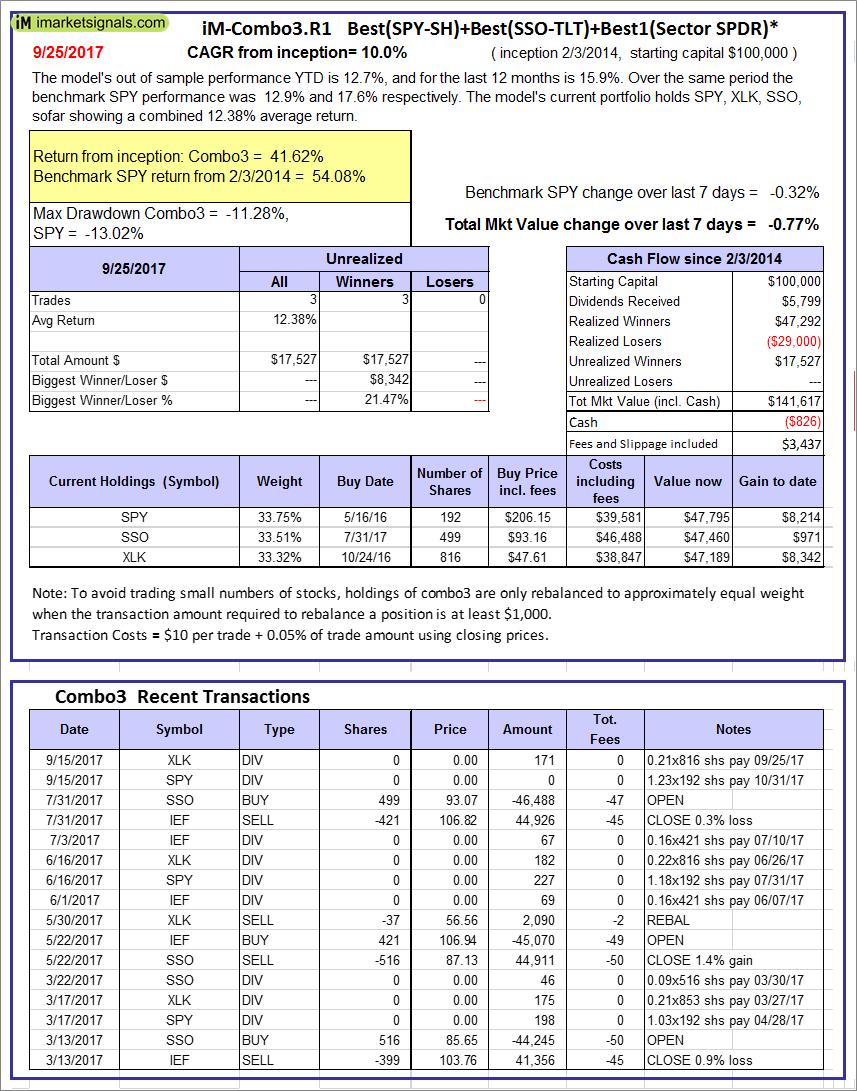 |
iM-Combo3.R1: The model’s out of sample performance YTD is 12.7%, and for the last 12 months is 15.9%. Over the same period the benchmark SPY performance was 12.9% and 17.6% respectively. Over the previous week the market value of iM-Combo3.R1 gained -0.77% at a time when SPY gained -0.32%. A starting capital of $100,000 at inception on 2/3/2014 would have grown to $141,617 which includes -$826 cash and excludes $3,437 spent on fees and slippage. |
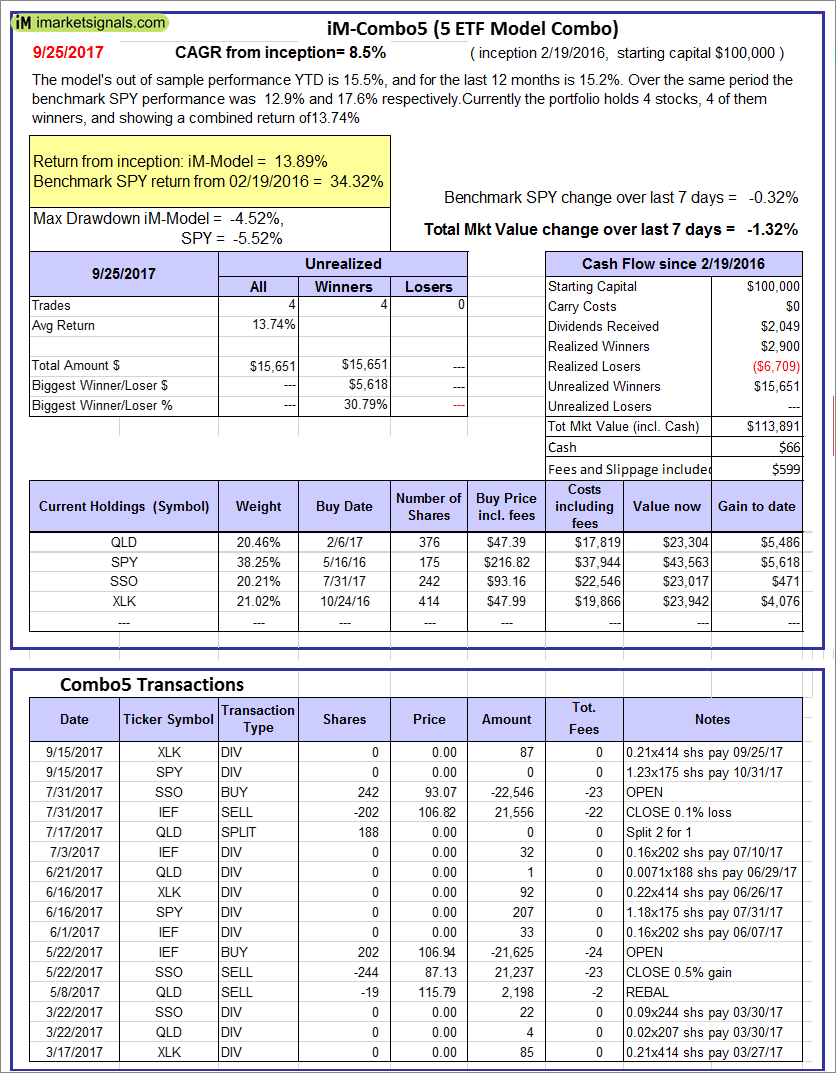 |
iM-Combo5: The model’s out of sample performance YTD is 15.5%, and for the last 12 months is 15.2%. Over the same period the benchmark SPY performance was 12.9% and 17.6% respectively. Over the previous week the market value of iM-Combo5 gained -1.32% at a time when SPY gained -0.32%. A starting capital of $100,000 at inception on 2/22/2016 would have grown to $113,891 which includes $66 cash and excludes $599 spent on fees and slippage. |
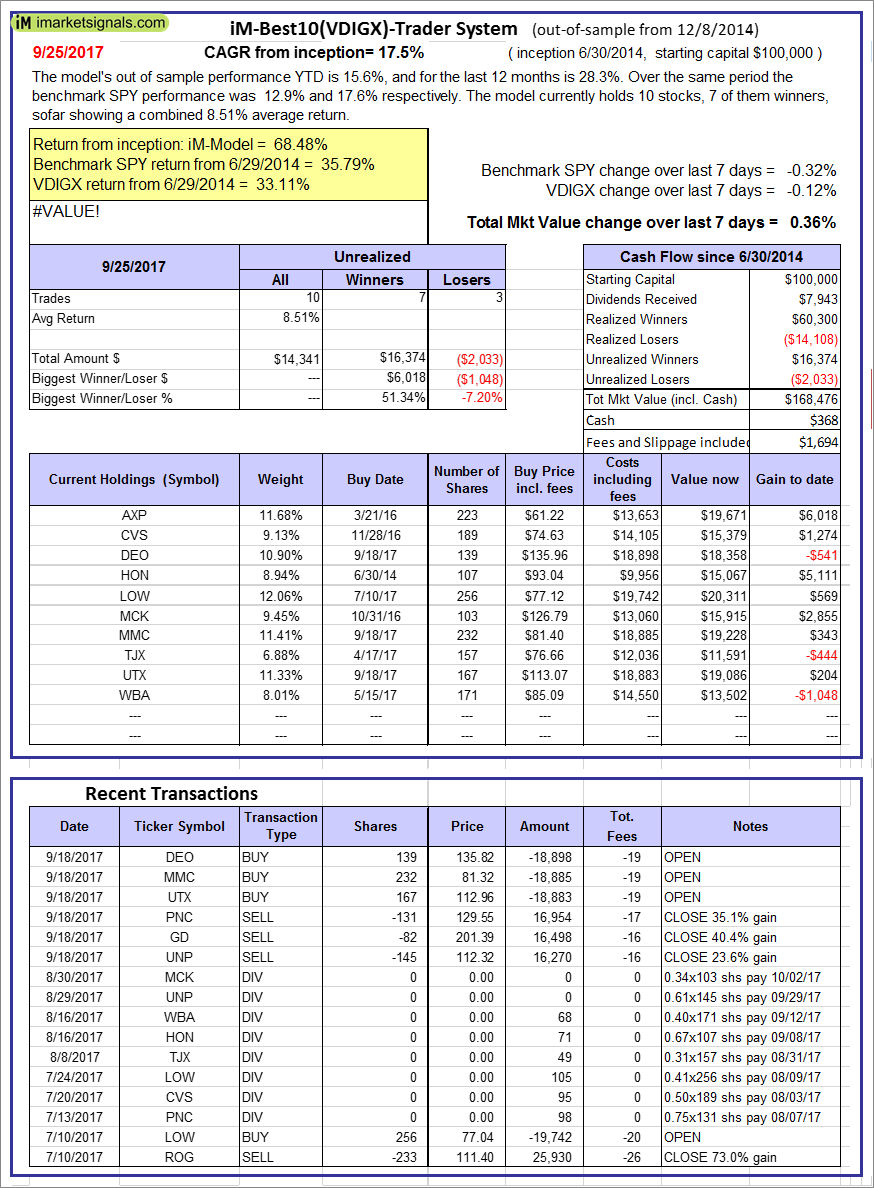 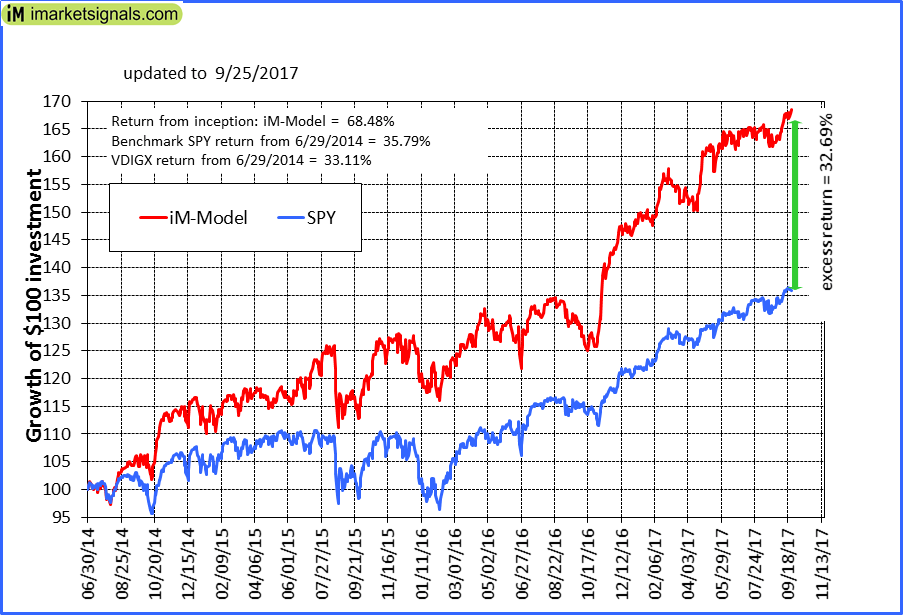 |
iM-Best10(VDIGX)-Trader: The model’s out of sample performance YTD is 15.6%, and for the last 12 months is 28.3%. Over the same period the benchmark SPY performance was 12.9% and 17.6% respectively. Since inception, on 7/1/2014, the model gained 68.48% while the benchmark SPY gained 35.79% and VDIGX gained 33.11% over the same period. Over the previous week the market value of iM-Best10(VDIGX) gained 0.36% at a time when SPY gained -0.32%. A starting capital of $100,000 at inception on 7/1/2014 would have grown to $168,476 which includes $368 cash and excludes $1,694 spent on fees and slippage. |
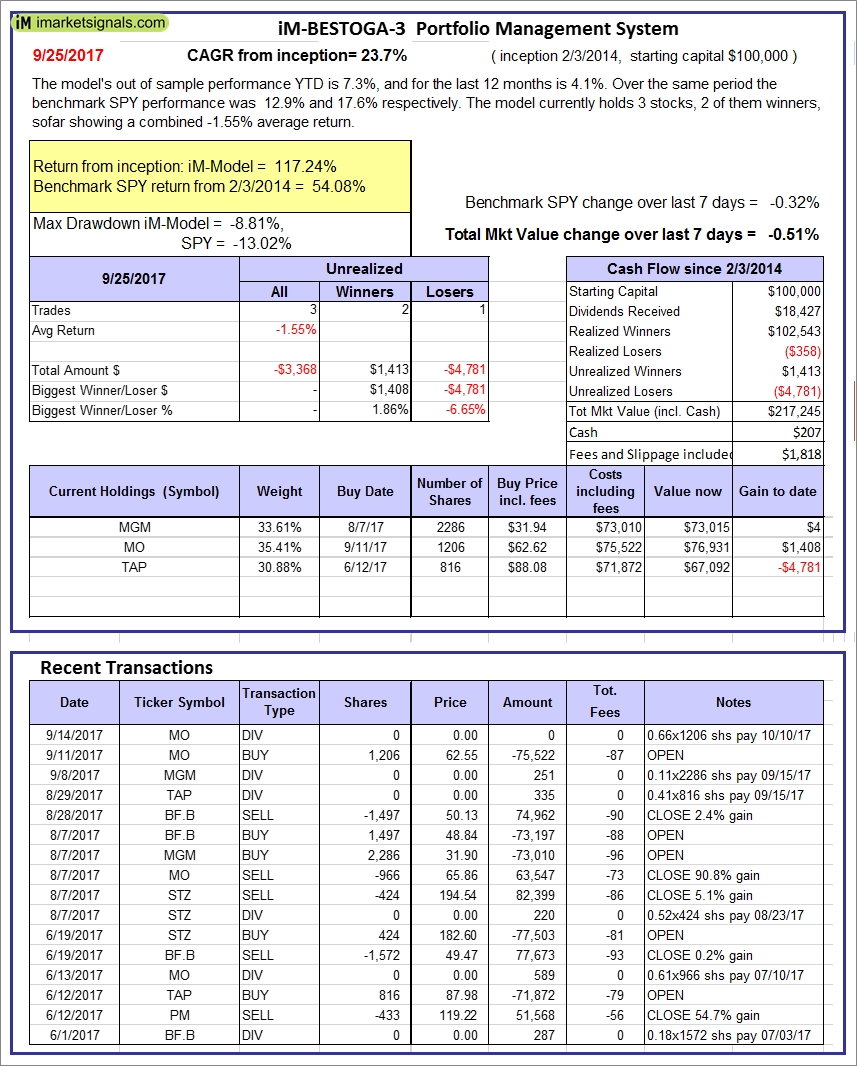 |
iM-BESTOGA-3: The model’s out of sample performance YTD is 7.3%, and for the last 12 months is 4.1%. Over the same period the benchmark SPY performance was 12.9% and 17.6% respectively. Over the previous week the market value of iM-BESTOGA-3 gained -0.51% at a time when SPY gained -0.32%. A starting capital of $100,000 at inception on 2/3/2014 would have grown to $217,245 which includes $207 cash and excludes $1,818 spent on fees and slippage. |
 |
iM-Best7(HiD-LoV): The model’s out of sample performance YTD is 8.3%, and for the last 12 months is 11.5%. Over the same period the benchmark SPY performance was 12.9% and 17.6% respectively. Over the previous week the market value of iM-BESTOGA-3 gained -0.94% at a time when SPY gained -0.32%. A starting capital of $100,000 at inception on 6/30/2016 would have grown to $111,231 which includes $51 cash and excludes $1,211 spent on fees and slippage. |
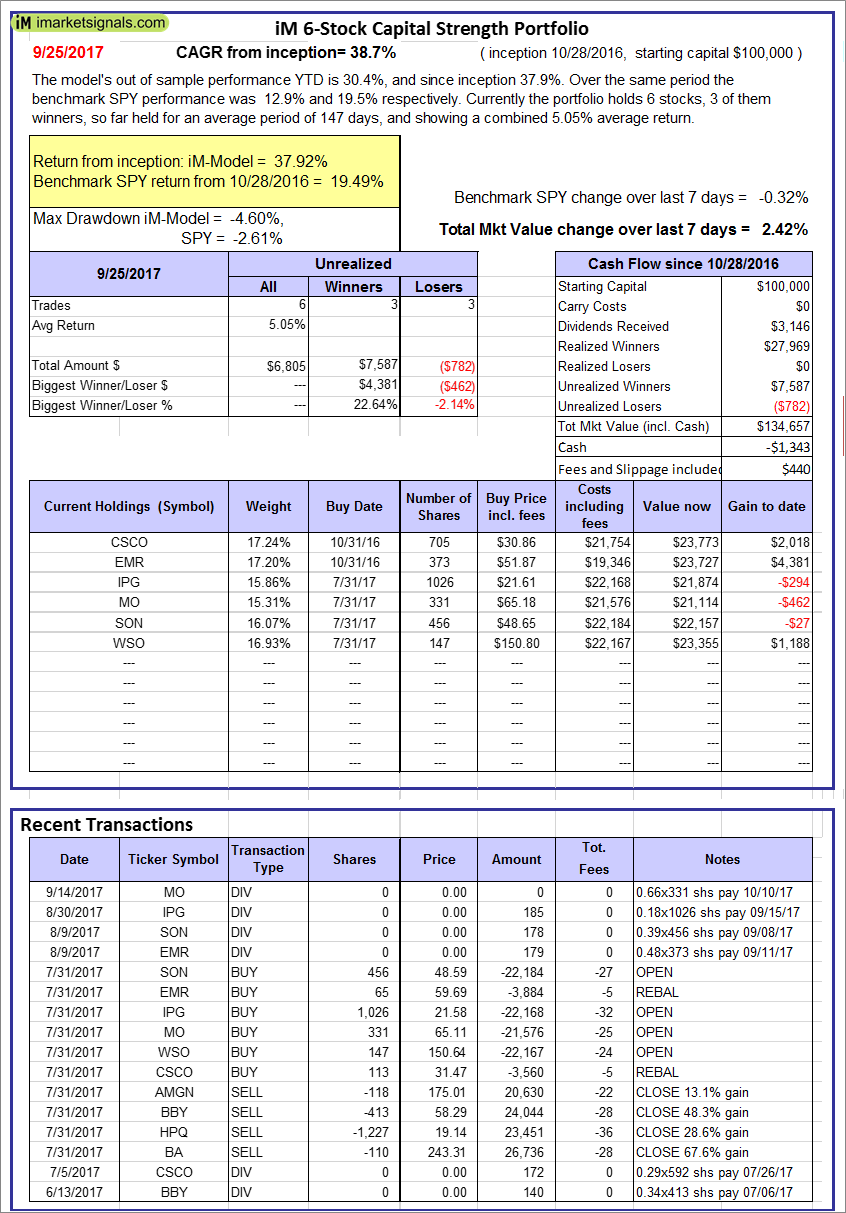 |
iM 6-Stock Capital Strength Portfolio: The model’s out of sample performance YTD is 30.4%, and since inception 37.9%. Over the same period the benchmark SPY performance was 12.9% and 19.5% respectively. Over the previous week the market value of the iM 6-Stock Capital Strength Portfolio gained 2.42% at a time when SPY gained -0.32%. A starting capital of $100,000 at inception on 10/28/2016 would have grown to $134,657 which includes -$1,343 cash and excludes $440 spent on fees and slippage. |
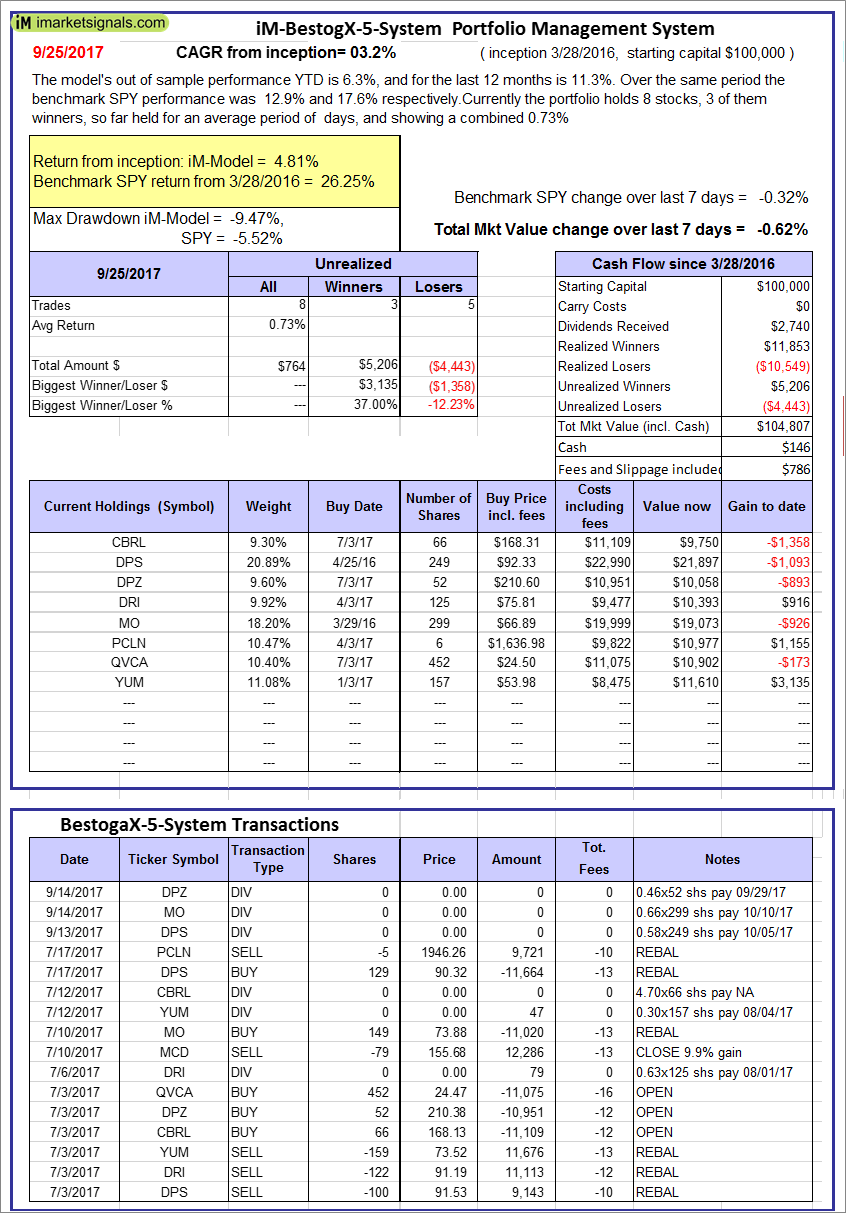 |
iM-BestogaX5-System: The model’s out of sample performance YTD is 6.3%, and for the last 12 months is 11.3%. Over the same period the benchmark SPY performance was 12.9% and 17.6% respectively. Over the previous week the market value of iM-Best8(S&P 500)Tax-Eff. gained -0.62% at a time when SPY gained -0.32%. A starting capital of $100,000 at inception on 3/28/2016 would have grown to $104,807 which includes $146 cash and excludes $786 spent on fees and slippage. |
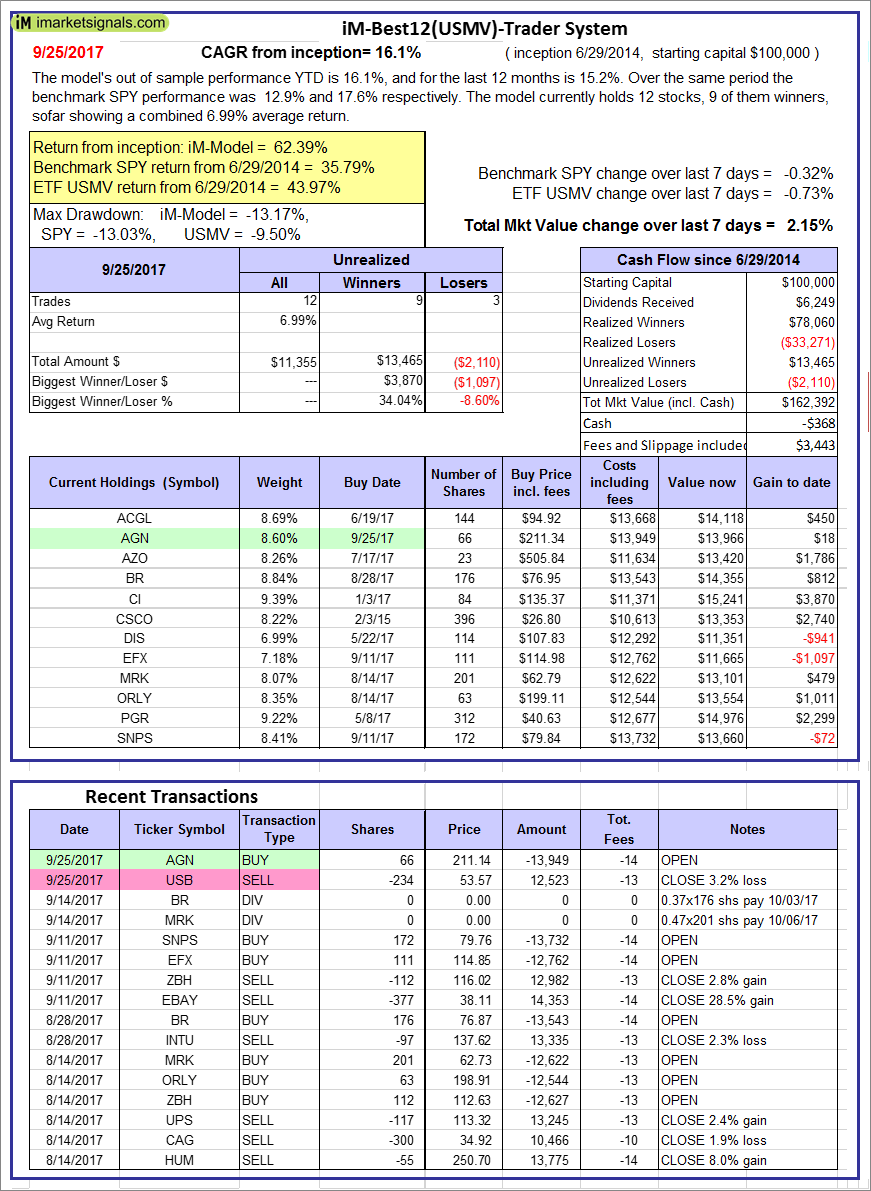  |
iM-Best12(USMV)-Trader: The model’s out of sample performance YTD is 16.1%, and for the last 12 months is 15.2%. Over the same period the benchmark SPY performance was 12.9% and 17.6% respectively. Since inception, on 6/30/2014, the model gained 62.39% while the benchmark SPY gained 35.79% and the ETF USMV gained 43.97% over the same period. Over the previous week the market value of iM-Best12(USMV)-Trader gained 2.15% at a time when SPY gained -0.32%. A starting capital of $100,000 at inception on 6/30/2014 would have grown to $162,392 which includes -$368 cash and excludes $3,443 spent on fees and slippage. |
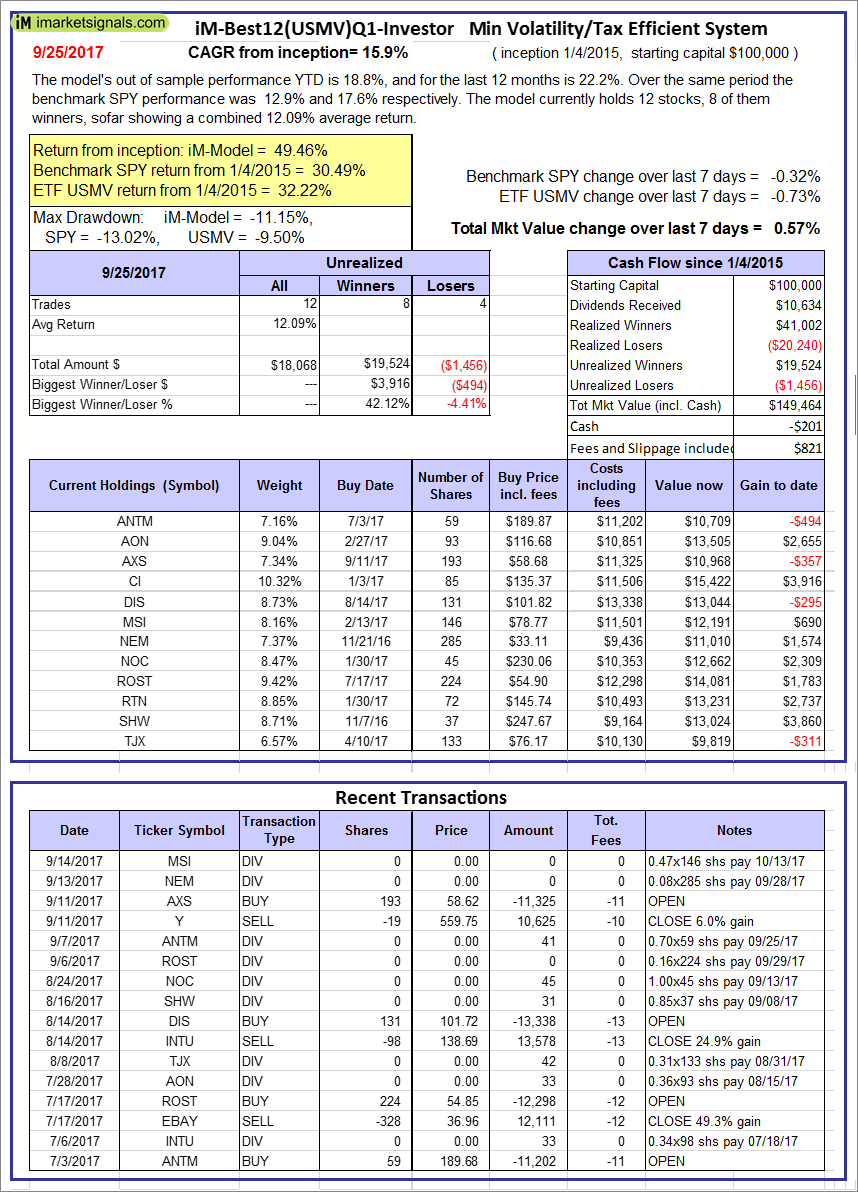 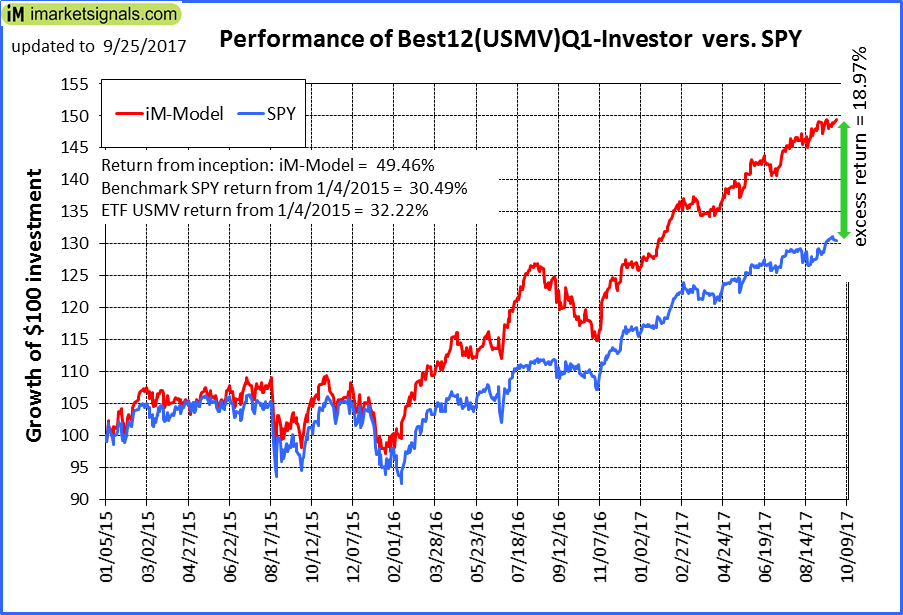 |
iM-Best12(USMV)Q1-Investor: The model’s out of sample performance YTD is 18.8%, and for the last 12 months is 22.2%. Over the same period the benchmark SPY performance was 12.9% and 17.6% respectively. Since inception, on 1/5/2015, the model gained 49.46% while the benchmark SPY gained 30.49% and the ETF USMV gained 32.22% over the same period. Over the previous week the market value of iM-Best12(USMV)Q1 gained 0.57% at a time when SPY gained -0.32%. A starting capital of $100,000 at inception on 1/5/2015 would have grown to $149,464 which includes -$201 cash and excludes $821 spent on fees and slippage. |
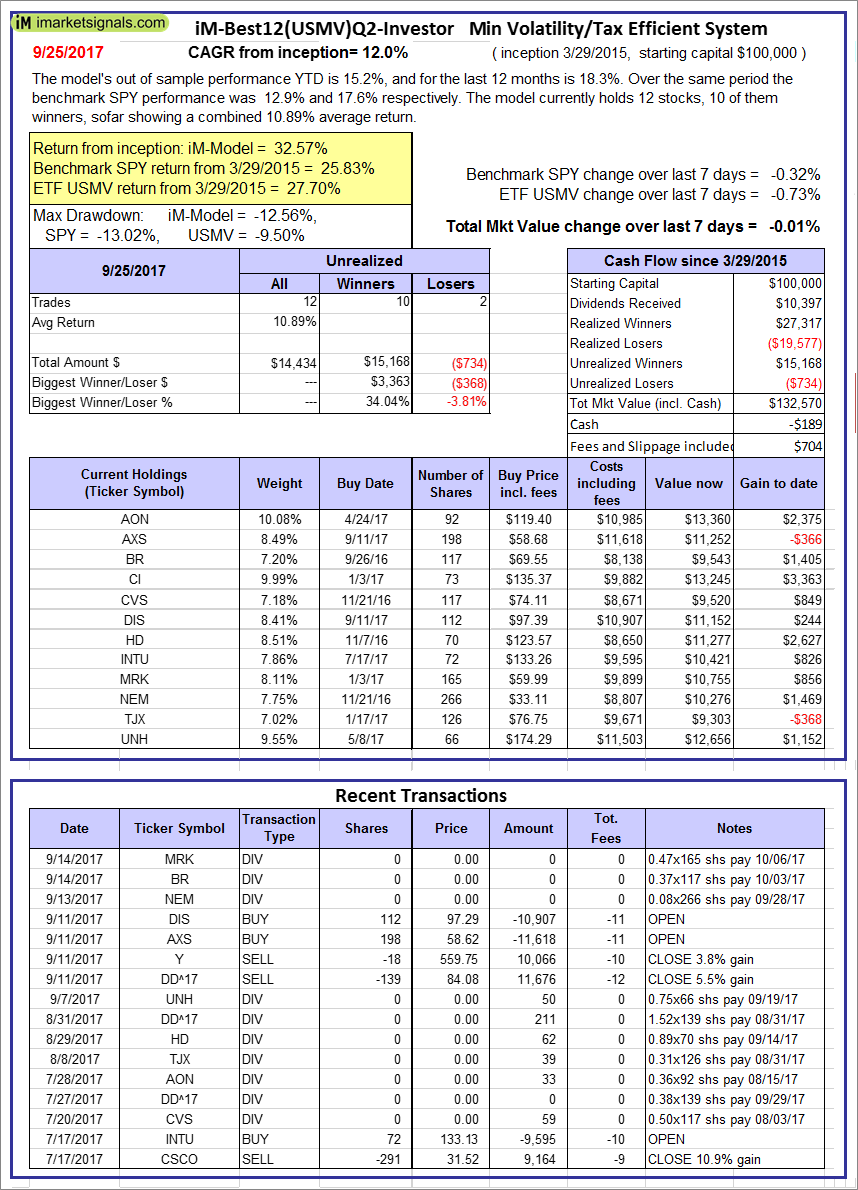  |
iM-Best12(USMV)Q2-Investor: The model’s out of sample performance YTD is 15.2%, and for the last 12 months is 18.3%. Over the same period the benchmark SPY performance was 12.9% and 17.6% respectively. Since inception, on 3/30/2015, the model gained 32.57% while the benchmark SPY gained 25.83% and the ETF USMV gained 27.70% over the same period. Over the previous week the market value of iM-Best12(USMV)Q2 gained -0.01% at a time when SPY gained -0.32%. A starting capital of $100,000 at inception on 3/30/2015 would have grown to $132,570 which includes -$189 cash and excludes $704 spent on fees and slippage. |
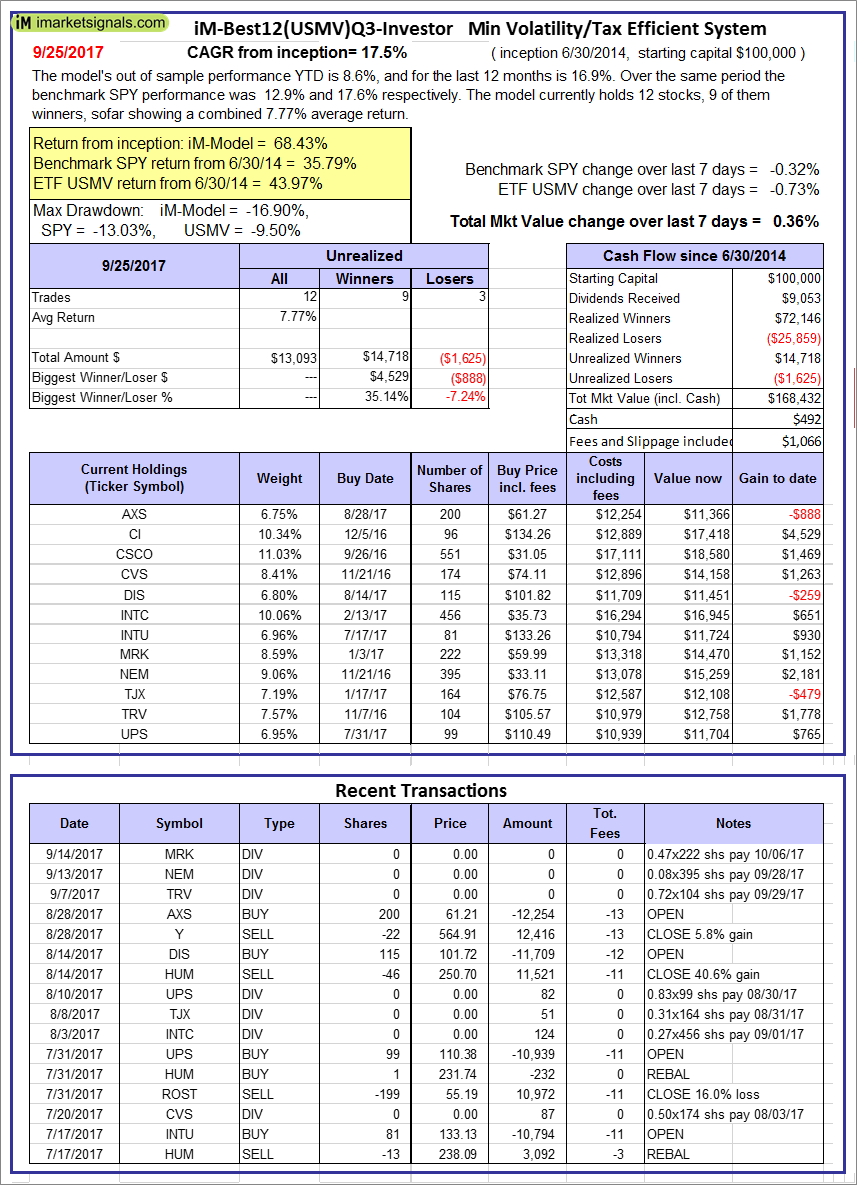 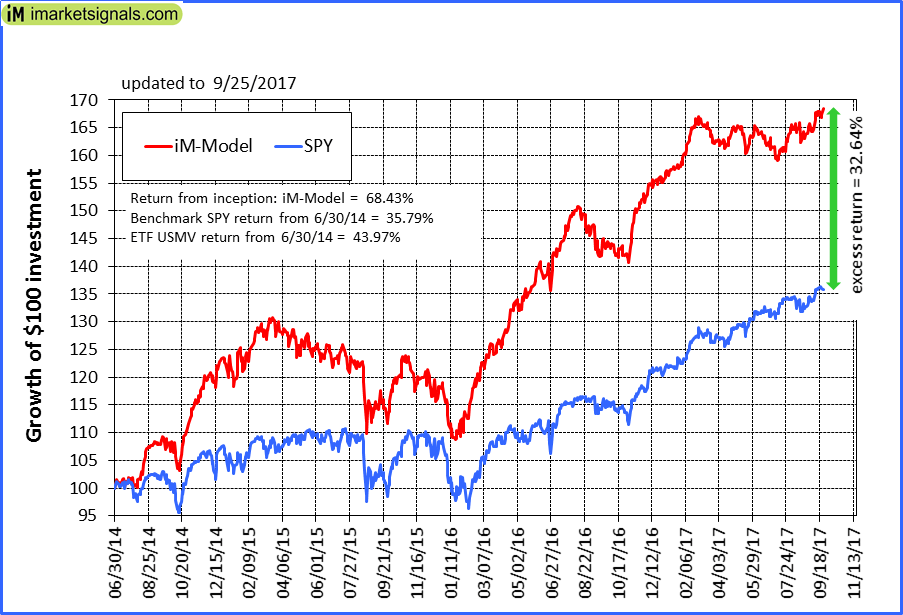 |
iM-Best12(USMV)Q3-Investor: The model’s out of sample performance YTD is 8.6%, and for the last 12 months is 16.9%. Over the same period the benchmark SPY performance was 12.9% and 17.6% respectively. Since inception, on 7/1/2014, the model gained 68.43% while the benchmark SPY gained 35.79% and the ETF USMV gained 43.97% over the same period. Over the previous week the market value of iM-Best12(USMV)Q3 gained 0.36% at a time when SPY gained -0.32%. A starting capital of $100,000 at inception on 7/1/2014 would have grown to $168,432 which includes $492 cash and excludes $1,066 spent on fees and slippage. |
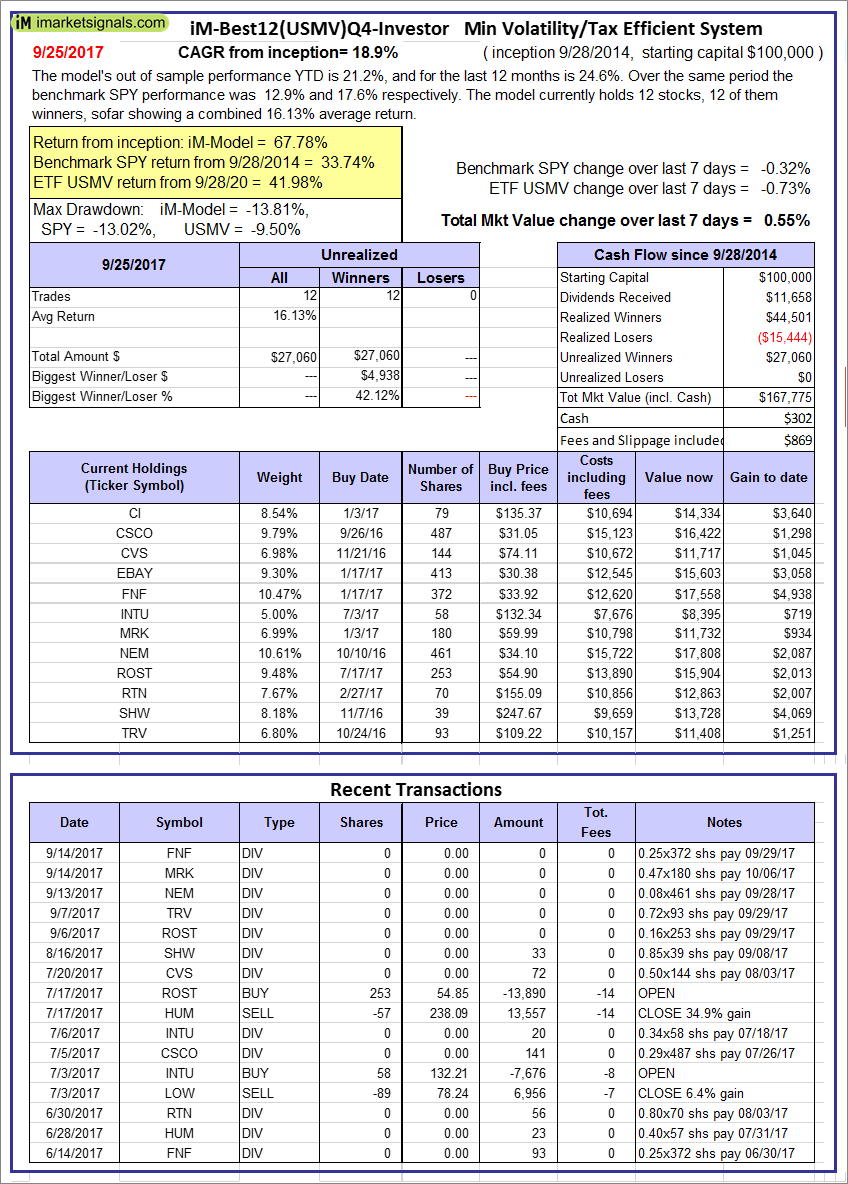 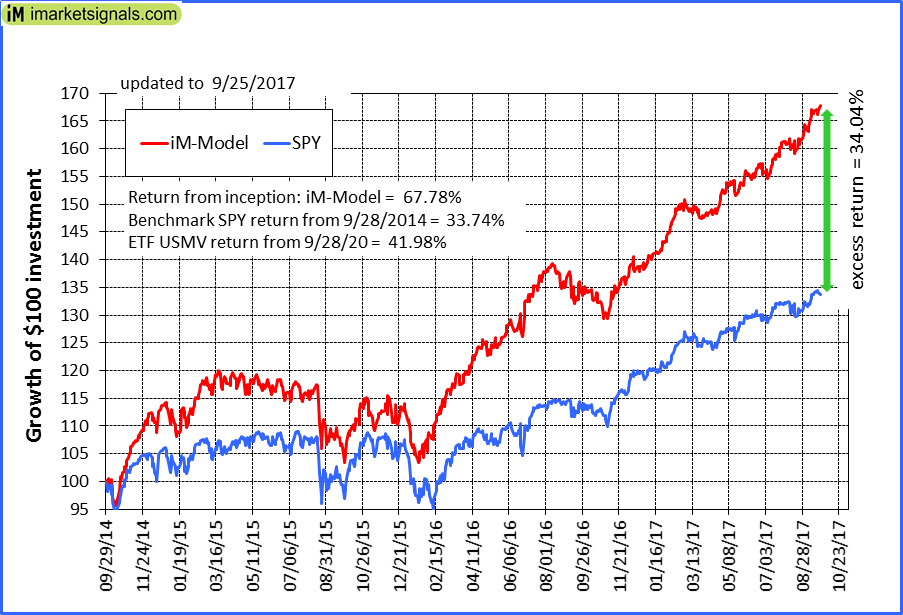 |
iM-Best12(USMV)Q4-Investor: Since inception, on 9/29/2014, the model gained 67.78% while the benchmark SPY gained 33.74% and the ETF USMV gained 41.98% over the same period. Over the previous week the market value of iM-Best12(USMV)Q4 gained 0.55% at a time when SPY gained -0.32%. A starting capital of $100,000 at inception on 9/29/2014 would have grown to $167,775 which includes $302 cash and excludes $869 spent on fees and slippage. |
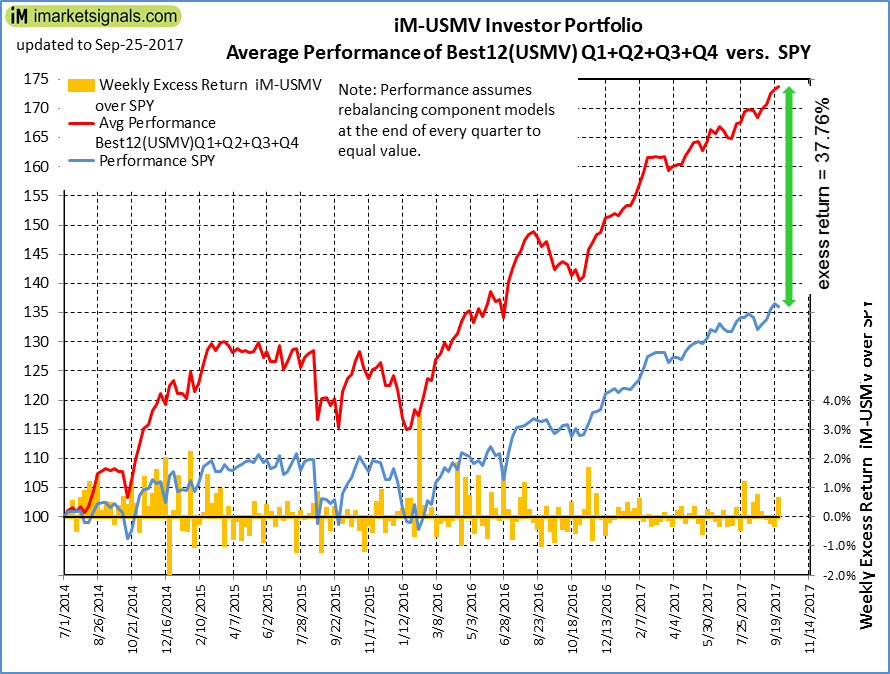 |
Average Performance of iM-Best12(USMV)Q1+Q2+Q3+Q4-Investor resulted in an excess return of 37.76% over SPY. (see iM-USMV Investor Portfolio) |
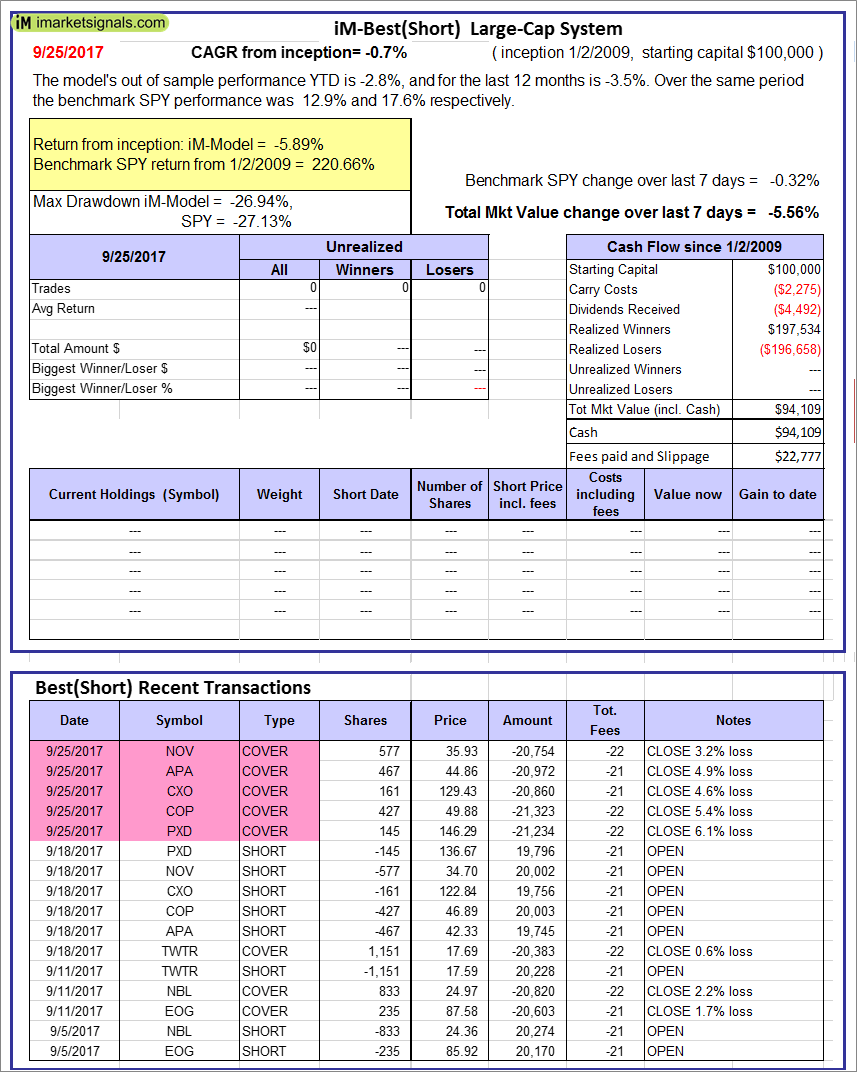 |
iM-Best(Short): The model’s out of sample performance YTD is -2.8%, and for the last 12 months is -3.5%. Over the same period the benchmark SPY performance was 12.9% and 17.6% respectively. Over the previous week the market value of iM-Best(Short) gained -5.56% at a time when SPY gained -0.32%. Over the period 1/2/2009 to 9/25/2017 the starting capital of $100,000 would have grown to $94,109 which includes $94,109 cash and excludes $22,777 spent on fees and slippage. |
 |
iM-Best2 MC-Score ETF System: The model’s out of sample performance YTD is 9.7%, and for the last 12 months is 8.5%. Over the same period the benchmark SPY performance was 12.9% and 17.6% respectively. Over the previous week the market value of the iM-Best2 MC-Score ETF System gained -0.95% at a time when SPY gained -0.32%. A starting capital of $100,000 at inception on 6/30/2016 would have grown to $106,346 which includes $399 cash and excludes $111 spent on fees and slippage. |
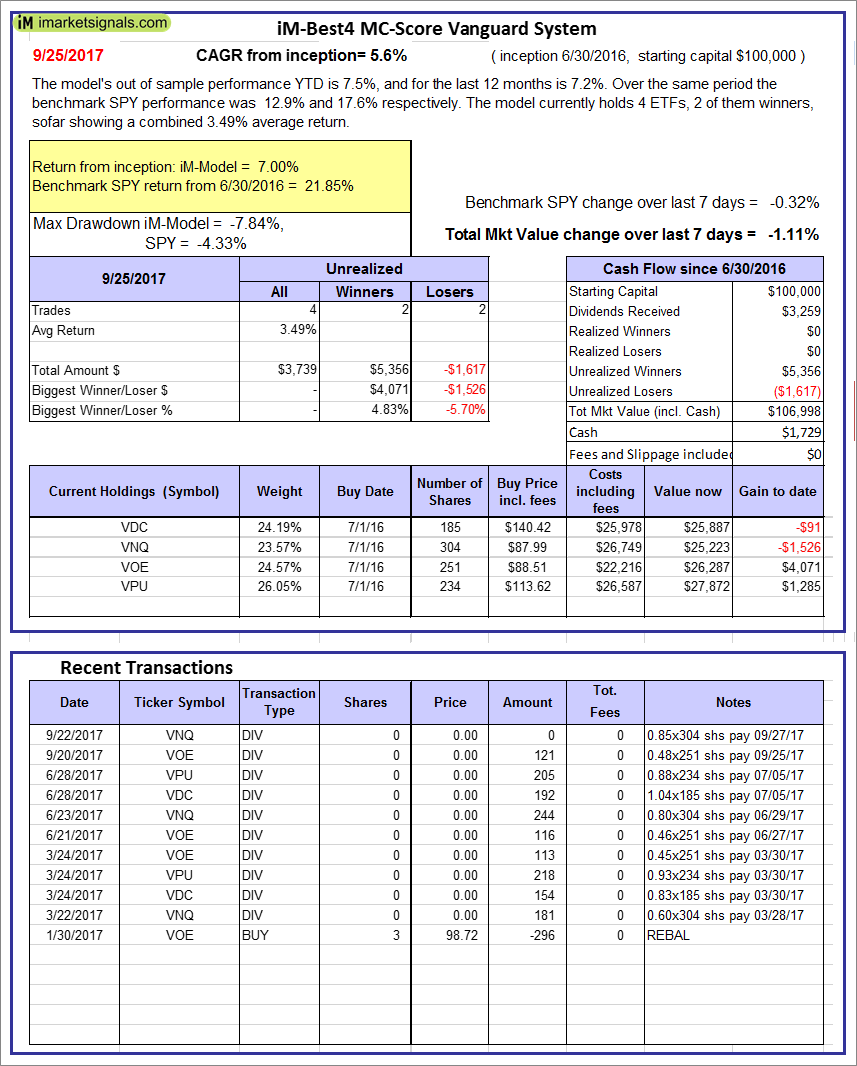 |
iM-Best4 MC-Score Vanguard System: The model’s out of sample performance YTD is 7.5%, and for the last 12 months is 7.2%. Over the same period the benchmark SPY performance was 12.9% and 17.6% respectively. Over the previous week the market value of the iM-Best4 MC-Score Vanguard System gained -1.11% at a time when SPY gained -0.32%. A starting capital of $100,000 at inception on 6/30/2016 would have grown to $106,998 which includes $1,729 cash and excludes $00 spent on fees and slippage. |
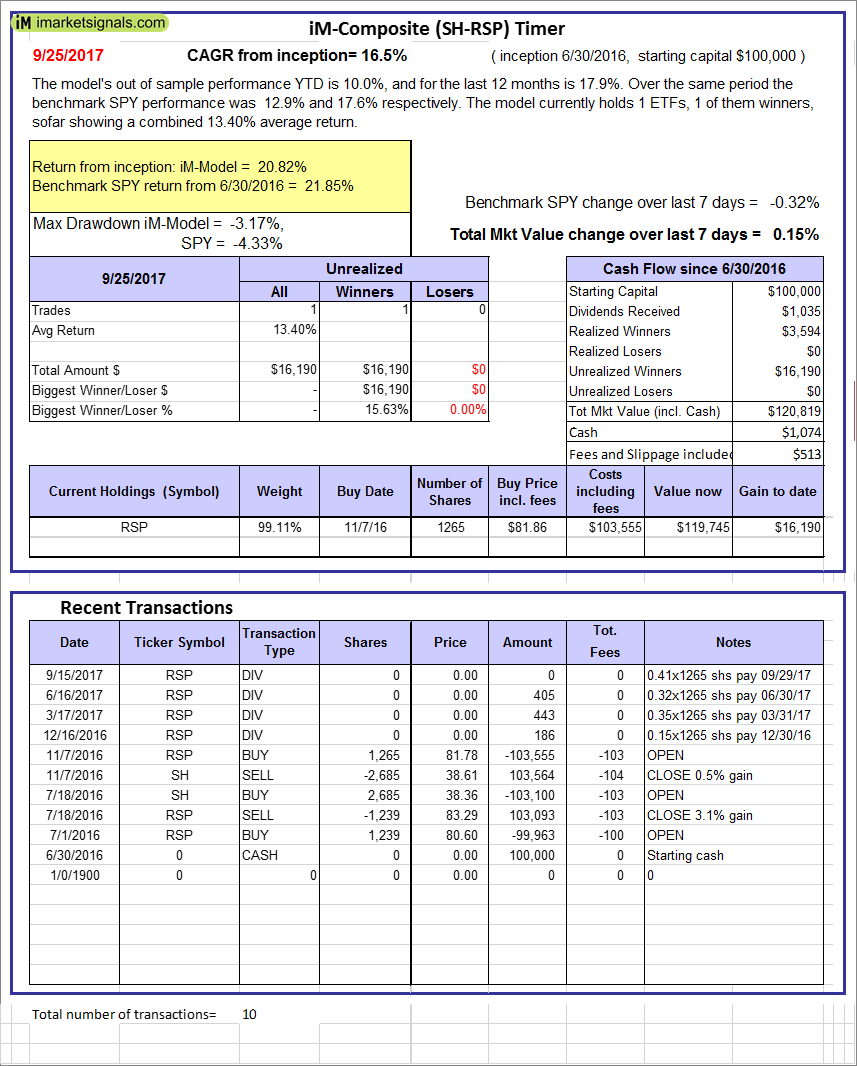 |
iM-Composite (SH-RSP) Timer: The model’s out of sample performance YTD is 10.0%, and for the last 12 months is 17.9%. Over the same period the benchmark SPY performance was 12.9% and 17.6% respectively. Over the previous week the market value of the iM-Composite (SH-RSP) Timer gained 0.15% at a time when SPY gained -0.32%. A starting capital of $100,000 at inception on 6/30/2016 would have grown to $120,819 which includes $1,074 cash and excludes $513 spent on fees and slippage. |
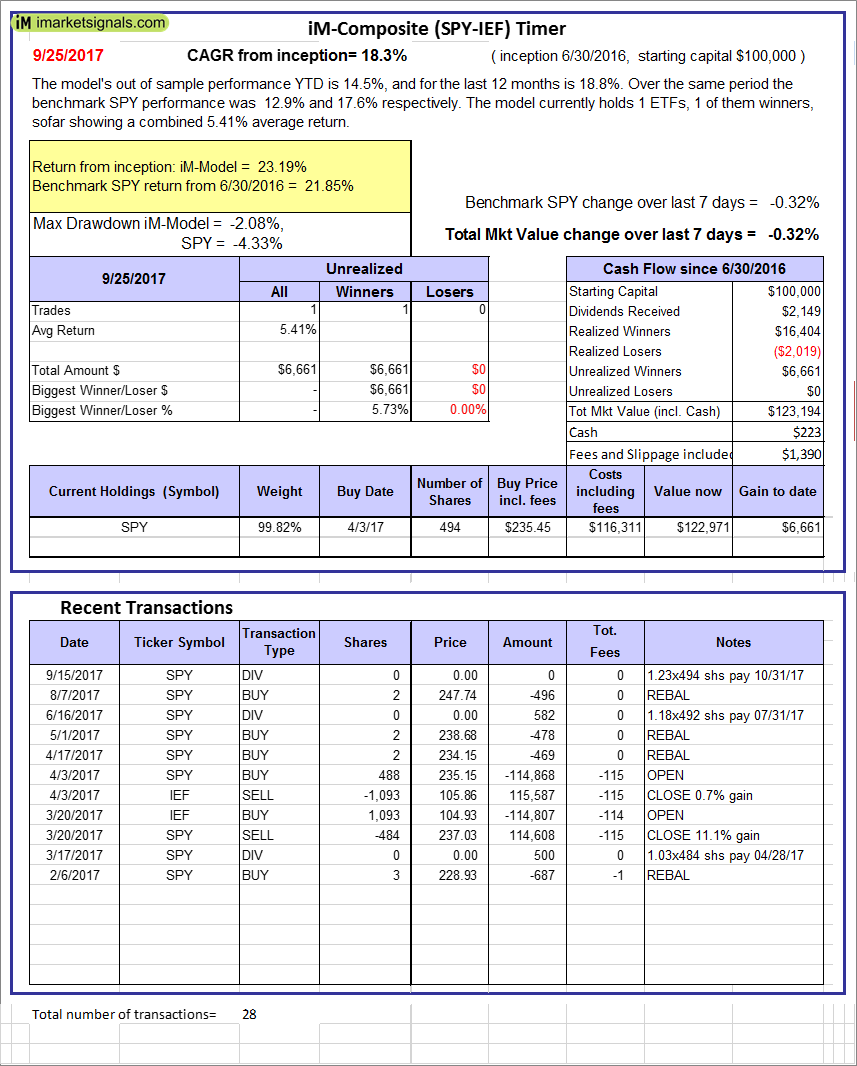 |
iM-Composite (SPY-IEF) Timer: The model’s out of sample performance YTD is 14.5%, and for the last 12 months is 18.8%. Over the same period the benchmark SPY performance was 12.9% and 17.6% respectively. Over the previous week the market value of the iM-Composite (SPY-IEF) Timer gained -0.32% at a time when SPY gained -0.32%. A starting capital of $100,000 at inception on 6/30/2016 would have grown to $123,194 which includes $223 cash and excludes $1,390 spent on fees and slippage. |
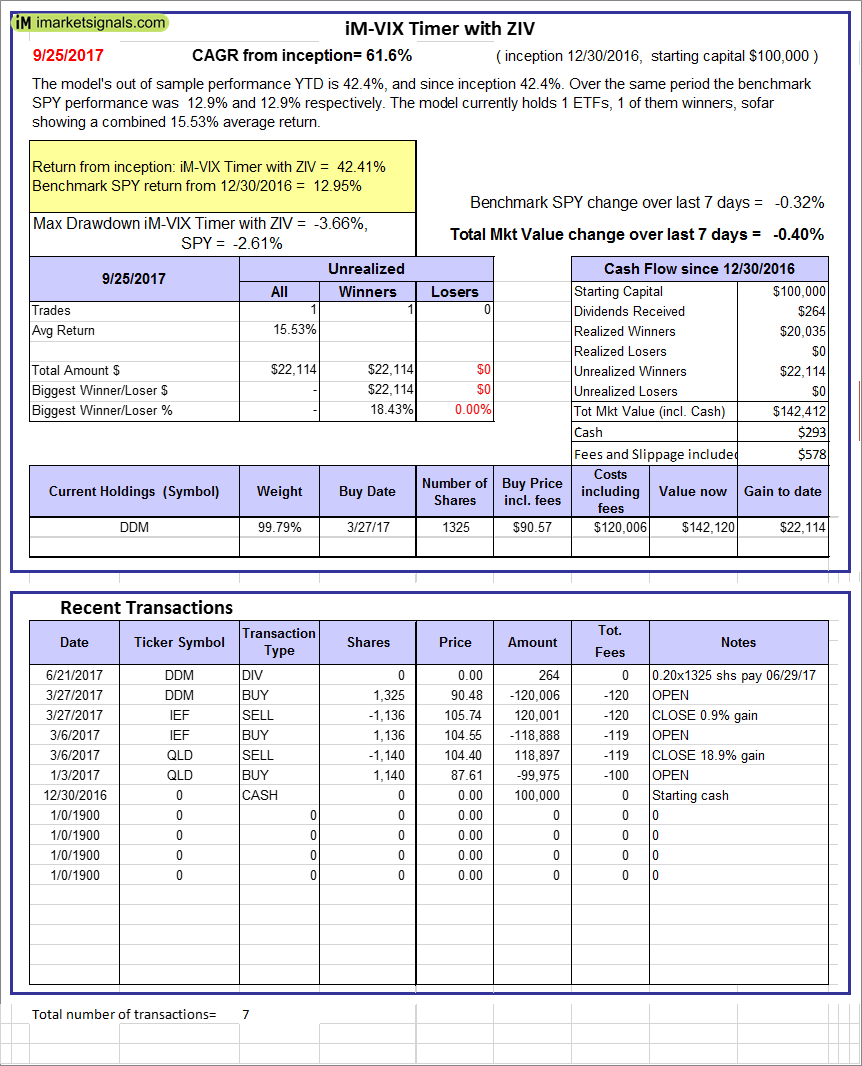 |
iM-VIX Timer with ZIV: The model’s out of sample performance YTD is 42.4%, and since inception 42.4%. Over the same period the benchmark SPY performance was 12.9% and 12.9% respectively. Over the previous week the market value of the iM-VIX Timer with ZIV gained -0.40% at a time when SPY gained -0.32%. A starting capital of $100,000 at inception on 12/30/2016 would have grown to $142,412 which includes $293 cash and excludes $578 spent on fees and slippage. |
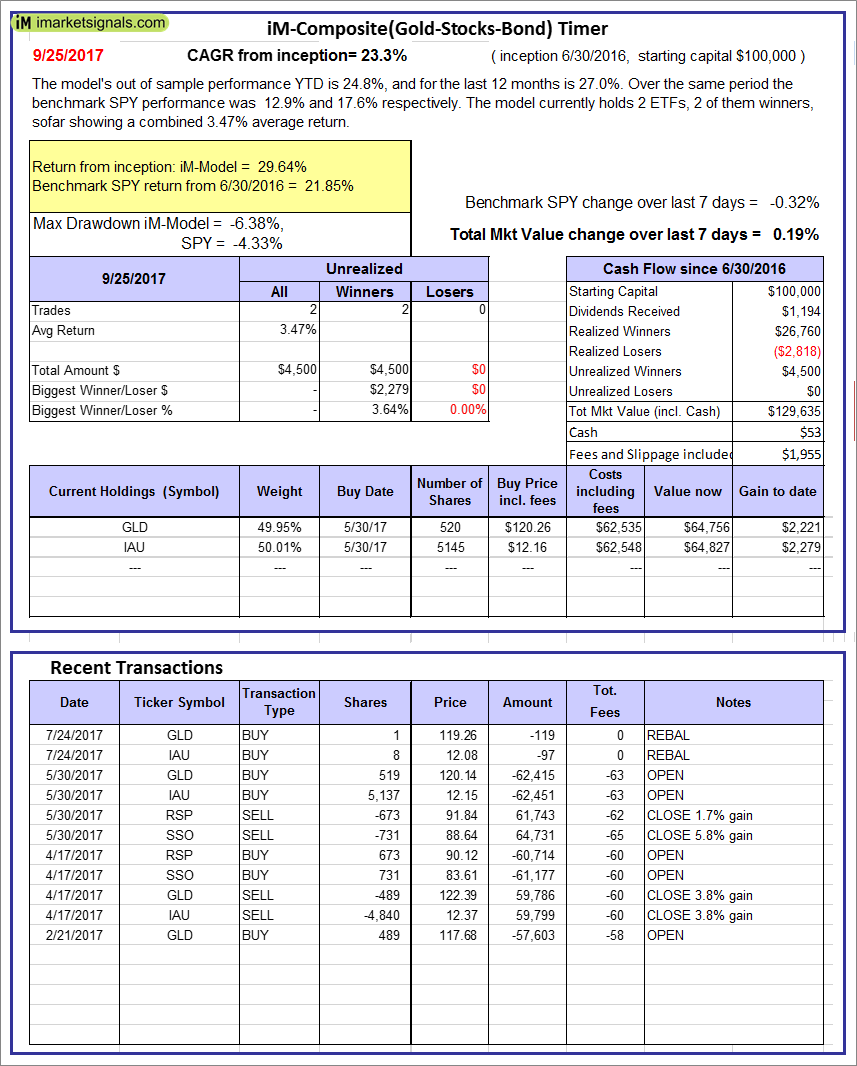 |
iM-Composite(Gold-Stocks-Bond) Timer: The model’s out of sample performance YTD is 24.8%, and for the last 12 months is 27.0%. Over the same period the benchmark SPY performance was 12.9% and 17.6% respectively. Over the previous week the market value of the iM-Composite(Gold-Stocks-Bond) Timer gained 0.19% at a time when SPY gained -0.32%. A starting capital of $100,000 at inception on 6/30/2016 would have grown to $129,635 which includes $53 cash and excludes $1,955 spent on fees and slippage. |
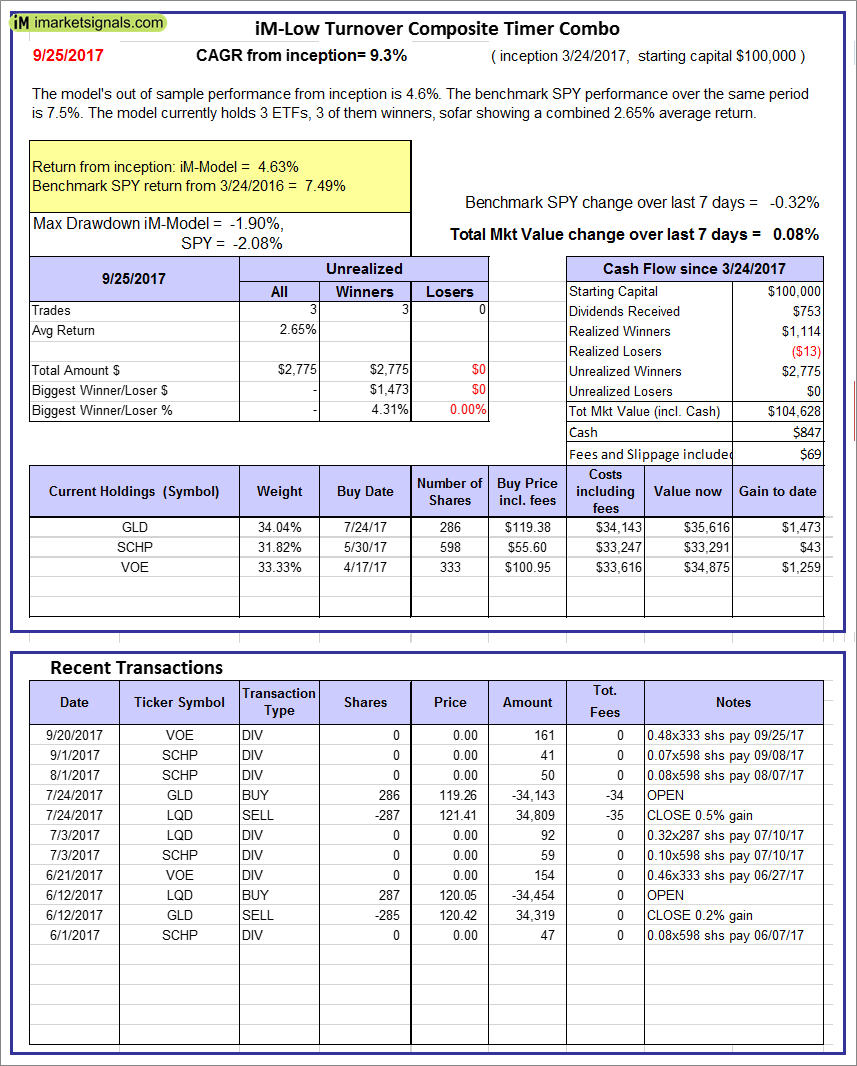 |
iM-Low Turnover Composite Timer Combo: The model’s out of sample performance from inception is 4.6%. The benchmark SPY performance over the same period is 7.5%. Over the previous week the market value of the iM-Low Turnover Composite Timer Combo gained 0.08% at a time when SPY gained -0.32%. A starting capital of $100,000 at inception on 3/24/27 would have grown to $104,628 which includes $847 cash and excludes $69 spent on fees and slippage. |
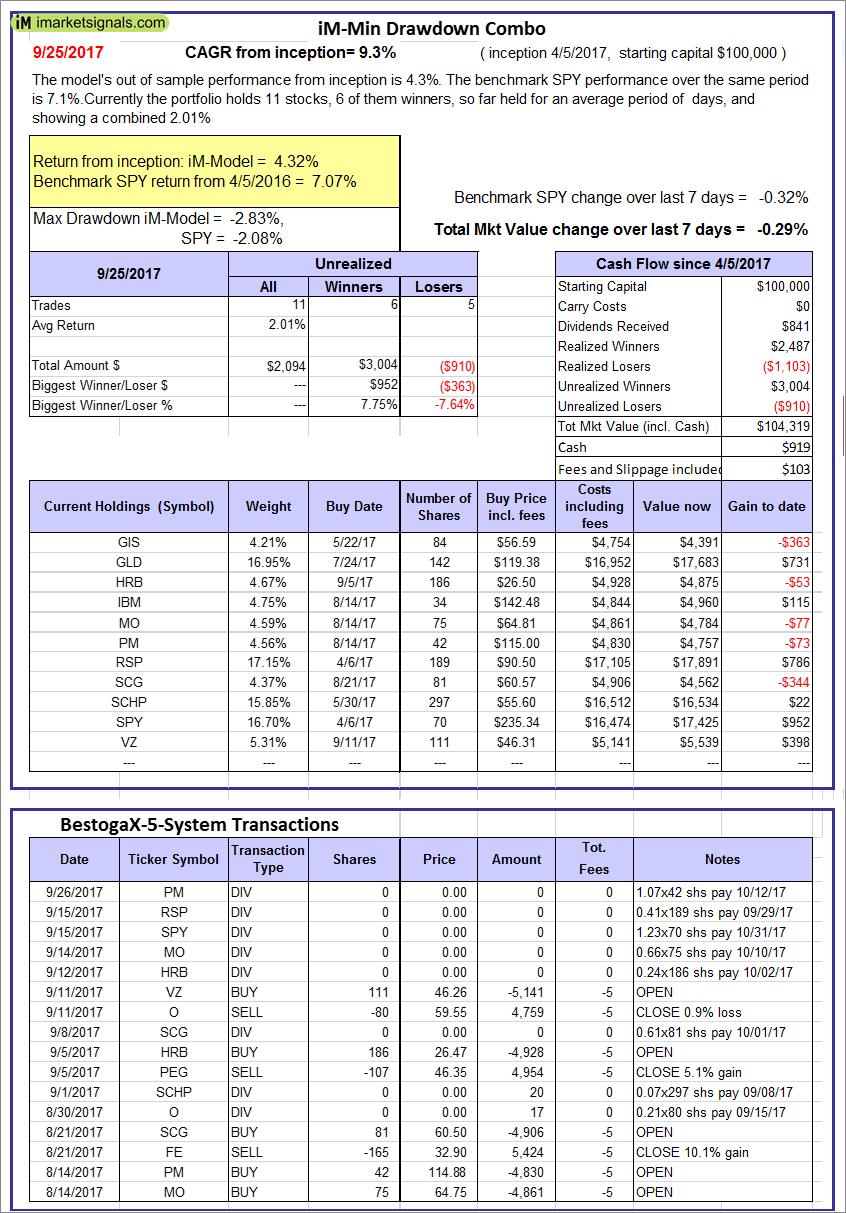 |
iM-Min Drawdown Combo: The model’s out of sample performance from inception is 4.3%. The benchmark SPY performance over the same period is 7.1%. Over the previous week the market value of the iM-Min Drawdown Combo gained -0.29% at a time when SPY gained -0.32%. A starting capital of $100,000 at inception on 4/5/2017 would have grown to $104,319 which includes $919 cash and excludes $103 spent on fees and slippage. |
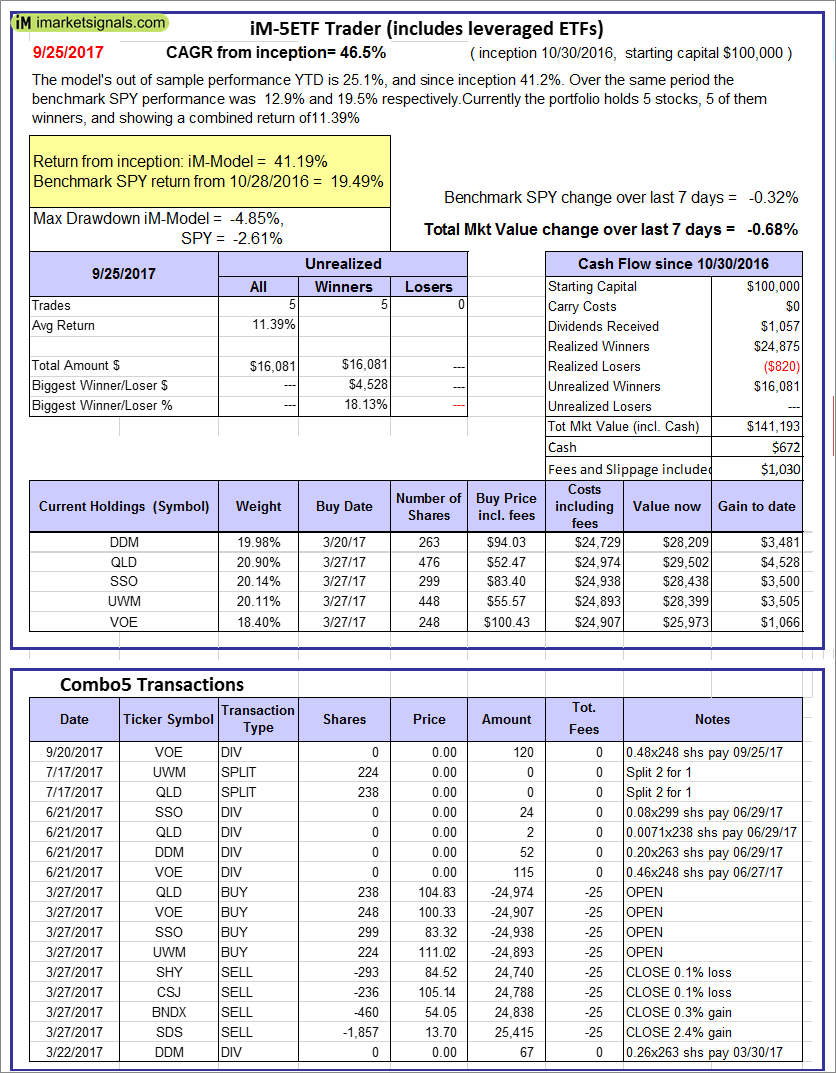 |
iM-5ETF Trader (includes leveraged ETFs): The model’s out of sample performance YTD is 25.1%, and since inception 41.2%. Over the same period the benchmark SPY performance was 12.9% and 19.5% respectively. Over the previous week the market value of the iM-5ETF Trader (includes leveraged ETFs) gained -0.68% at a time when SPY gained -0.32%. A starting capital of $100,000 at inception on 10/30/2016 would have grown to $141,193 which includes $672 cash and excludes $1,030 spent on fees and slippage. |
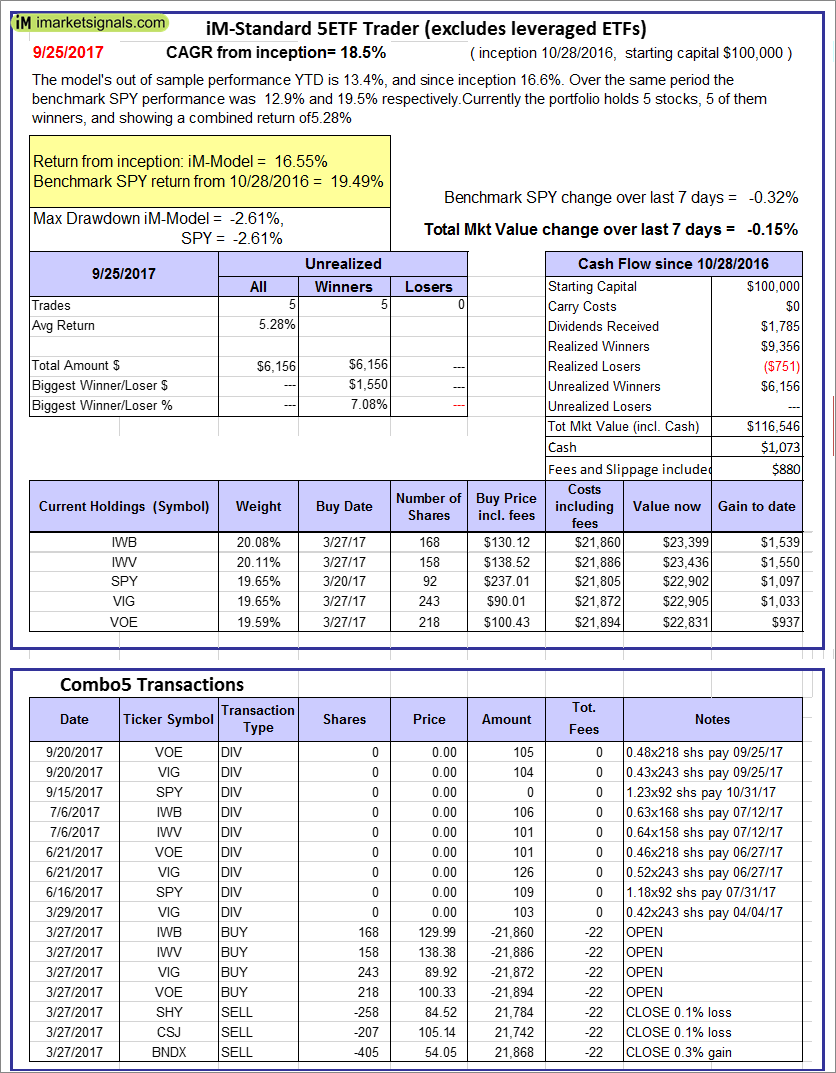 |
iM-Standard 5ETF Trader (excludes leveraged ETFs): The model’s out of sample performance YTD is 13.4%, and since inception 16.6%. Over the same period the benchmark SPY performance was 12.9% and 19.5% respectively. Over the previous week the market value of the iM-Standard 5ETF Trader (excludes leveraged ETFs) gained -0.15% at a time when SPY gained -0.32%. A starting capital of $100,000 at inception on 10/30/2016 would have grown to $116,546 which includes $1,073 cash and excludes $880 spent on fees and slippage. |
Posted in pmp SPY-SH
iM-Best Reports – 9/18/2017
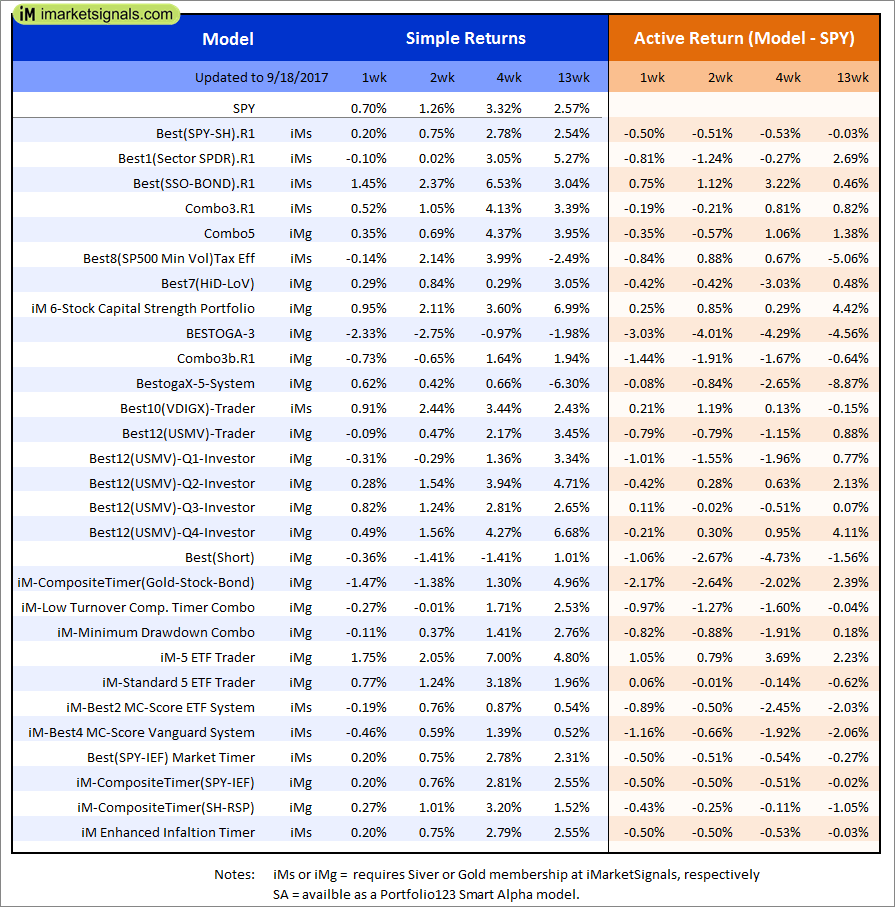 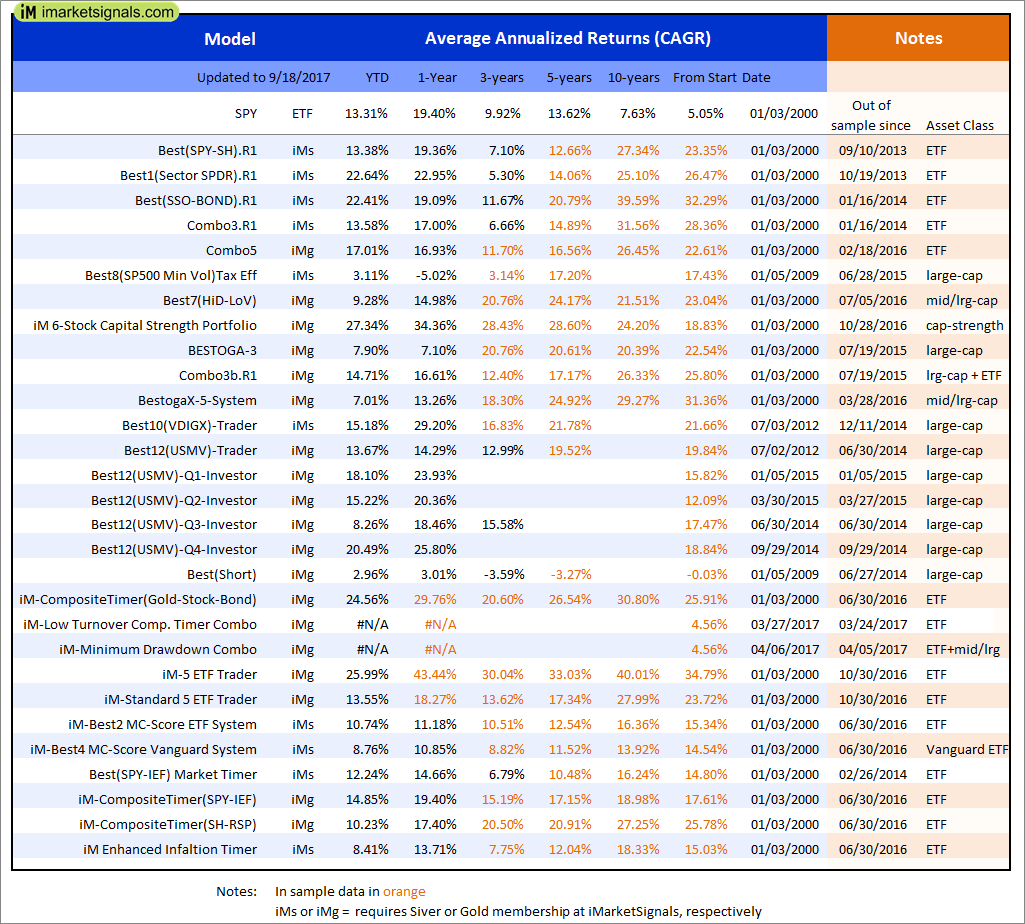 |
Out of sample performance summary of our models for the past 1, 2, 4 and 13 week periods. The active active return indicates how the models over- or underperformed the benchmark ETF SPY. Also the YTD, and the 1-, 3-, 5- and 10-year annualized returns are shown in the second table |
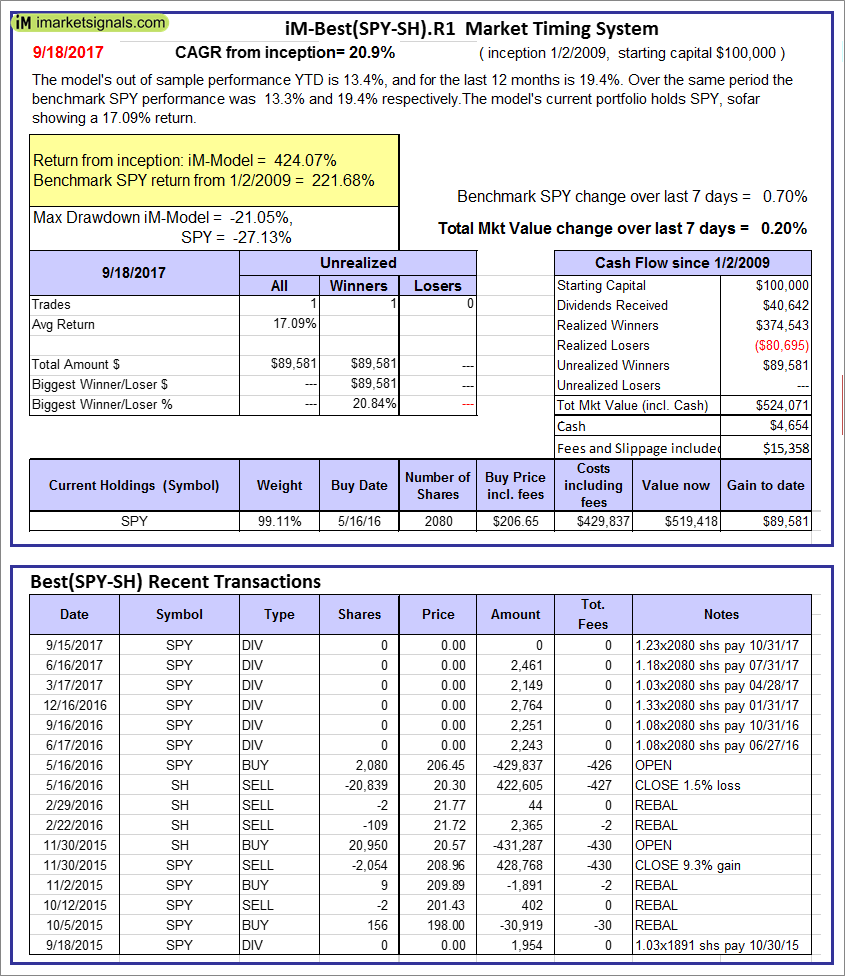 |
iM-Best(SPY-SH).R1: The model’s out of sample performance YTD is 13.4%, and for the last 12 months is 19.4%. Over the same period the benchmark SPY performance was 13.3% and 19.4% respectively. Over the previous week the market value of Best(SPY-SH) gained 0.20% at a time when SPY gained 0.70%. A starting capital of $100,000 at inception on 1/2/2009 would have grown to $524,071 which includes $4,654 cash and excludes $15,358 spent on fees and slippage. |
 |
iM-Combo3.R1: The model’s out of sample performance YTD is 13.6%, and for the last 12 months is 17.0%. Over the same period the benchmark SPY performance was 13.3% and 19.4% respectively. Over the previous week the market value of iM-Combo3.R1 gained 0.52% at a time when SPY gained 0.70%. A starting capital of $100,000 at inception on 2/3/2014 would have grown to $142,716 which includes -$997 cash and excludes $3,437 spent on fees and slippage. |
 |
iM-Combo5: The model’s out of sample performance YTD is 17.0%, and for the last 12 months is 16.9%. Over the same period the benchmark SPY performance was 13.3% and 19.4% respectively. Over the previous week the market value of iM-Combo5 gained 0.35% at a time when SPY gained 0.70%. A starting capital of $100,000 at inception on 2/22/2016 would have grown to $115,412 which includes -$21 cash and excludes $599 spent on fees and slippage. |
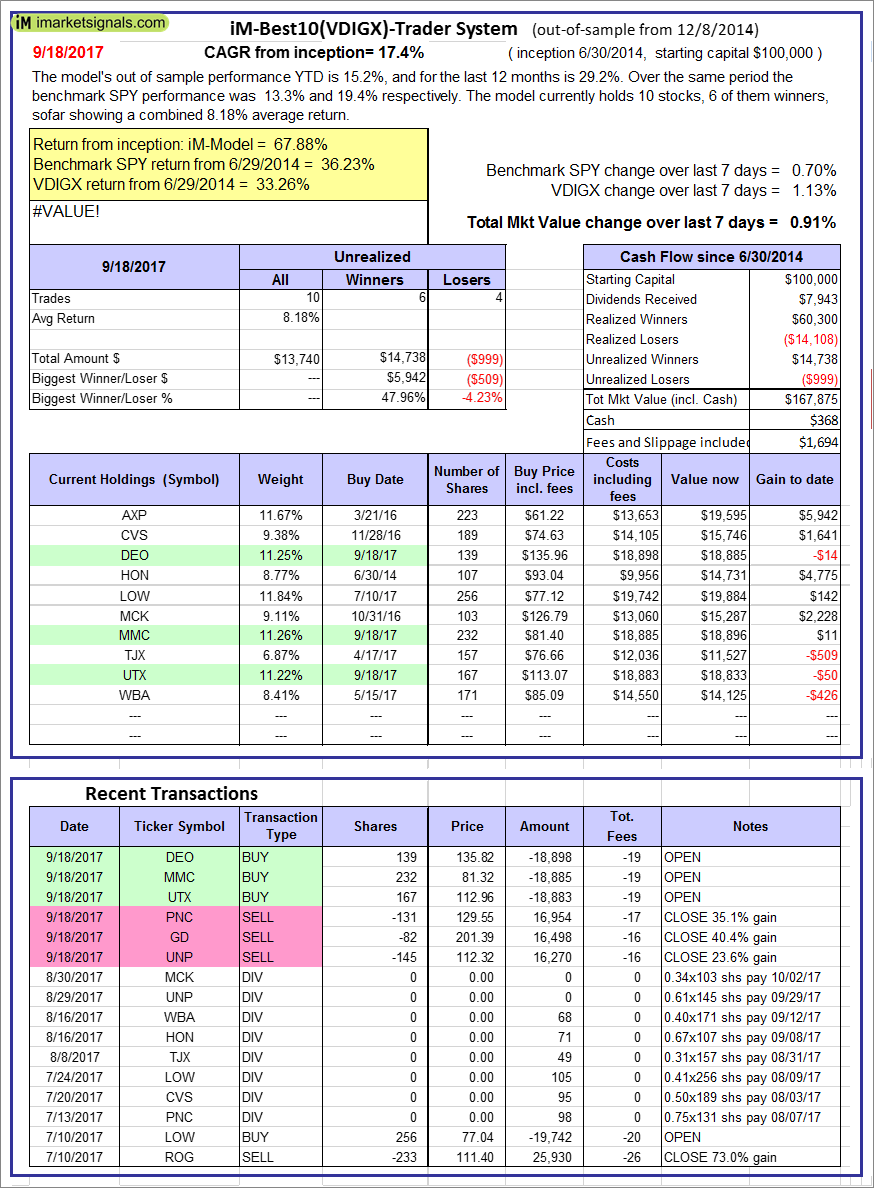 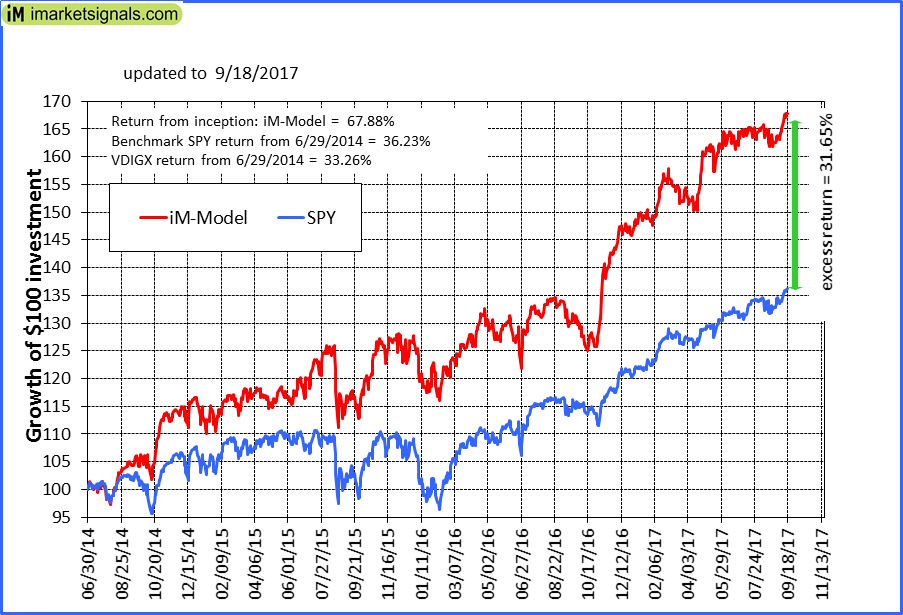 |
iM-Best10(VDIGX)-Trader: The model’s out of sample performance YTD is 15.2%, and for the last 12 months is 29.2%. Over the same period the benchmark SPY performance was 13.3% and 19.4% respectively. Since inception, on 7/1/2014, the model gained 67.88% while the benchmark SPY gained 36.23% and VDIGX gained 33.26% over the same period. Over the previous week the market value of iM-Best10(VDIGX) gained 0.91% at a time when SPY gained 0.70%. A starting capital of $100,000 at inception on 7/1/2014 would have grown to $167,875 which includes $368 cash and excludes $1,694 spent on fees and slippage. |
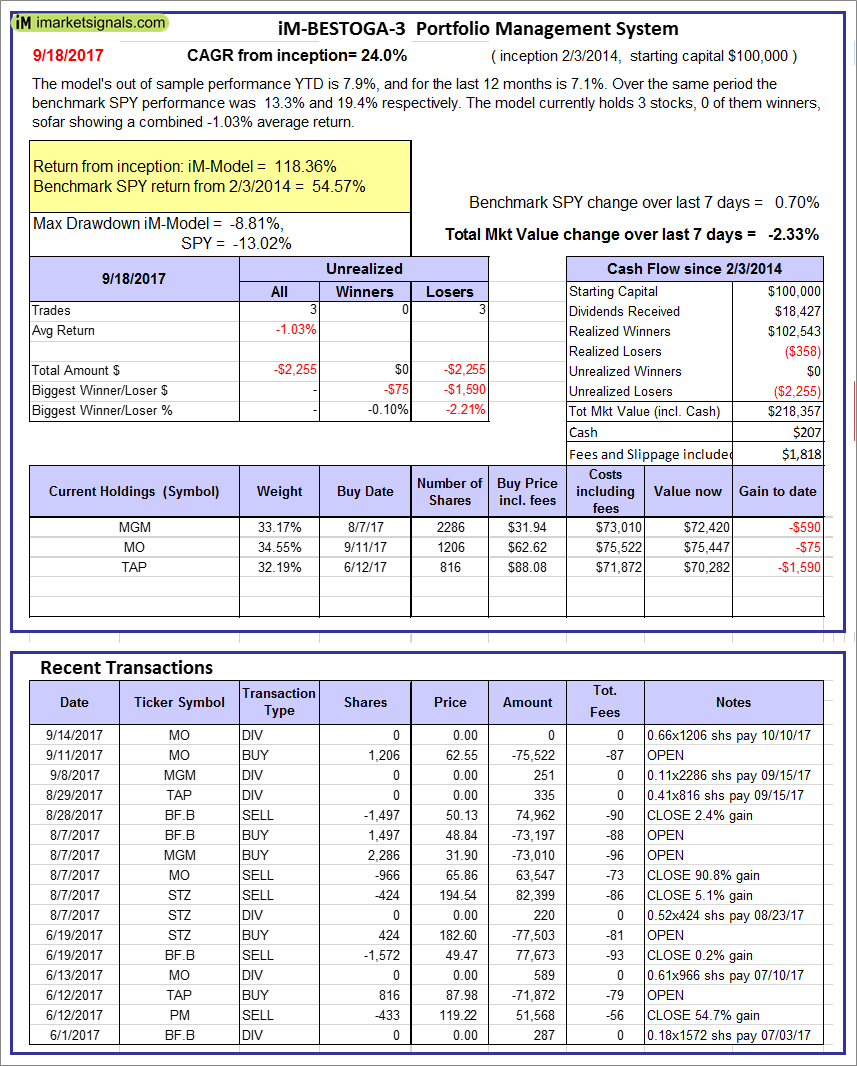 |
iM-BESTOGA-3: The model’s out of sample performance YTD is 7.9%, and for the last 12 months is 7.1%. Over the same period the benchmark SPY performance was 13.3% and 19.4% respectively. Over the previous week the market value of iM-BESTOGA-3 gained -2.33% at a time when SPY gained 0.70%. A starting capital of $100,000 at inception on 2/3/2014 would have grown to $218,357 which includes $207 cash and excludes $1,818 spent on fees and slippage. |
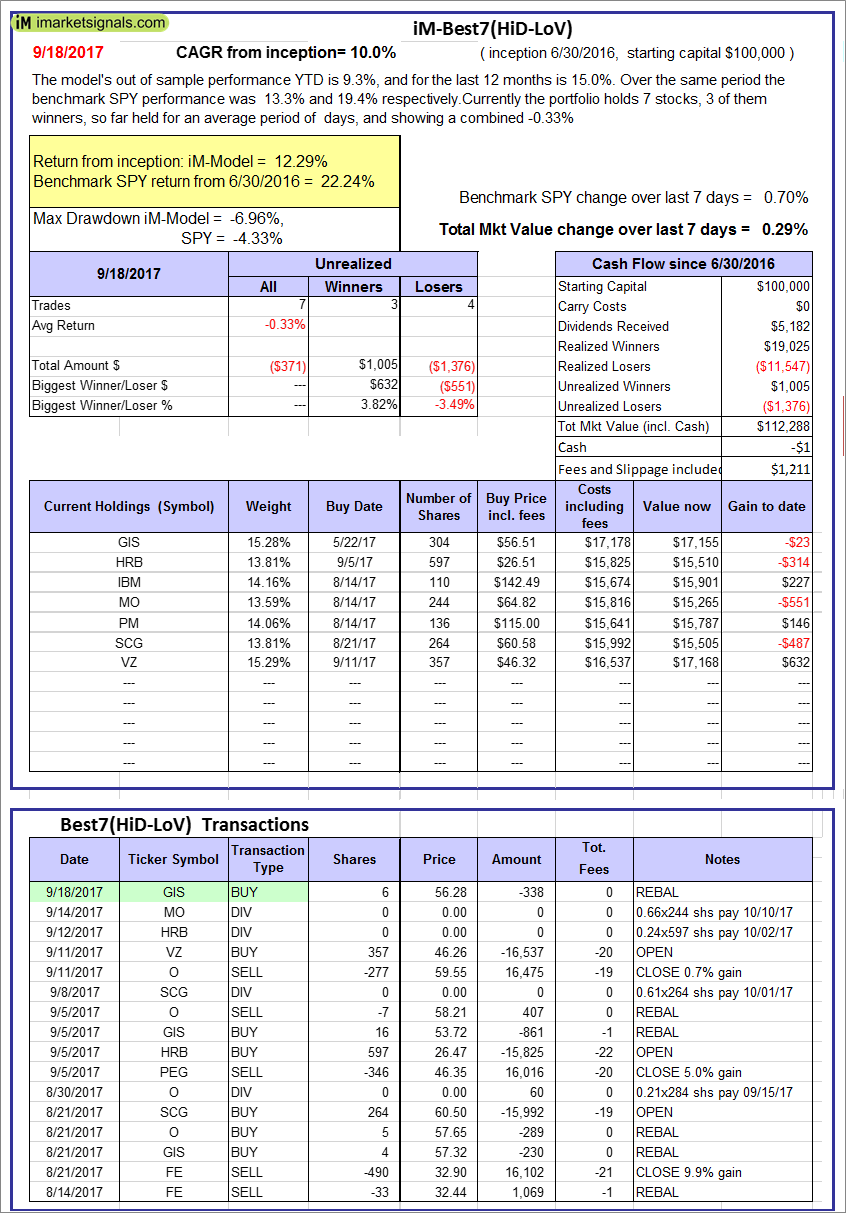 |
iM-Best7(HiD-LoV): The model’s out of sample performance YTD is 9.3%, and for the last 12 months is 15.0%. Over the same period the benchmark SPY performance was 13.3% and 19.4% respectively. Over the previous week the market value of iM-BESTOGA-3 gained 0.29% at a time when SPY gained 0.70%. A starting capital of $100,000 at inception on 6/30/2016 would have grown to $112,288 which includes -$1 cash and excludes $1,211 spent on fees and slippage. |
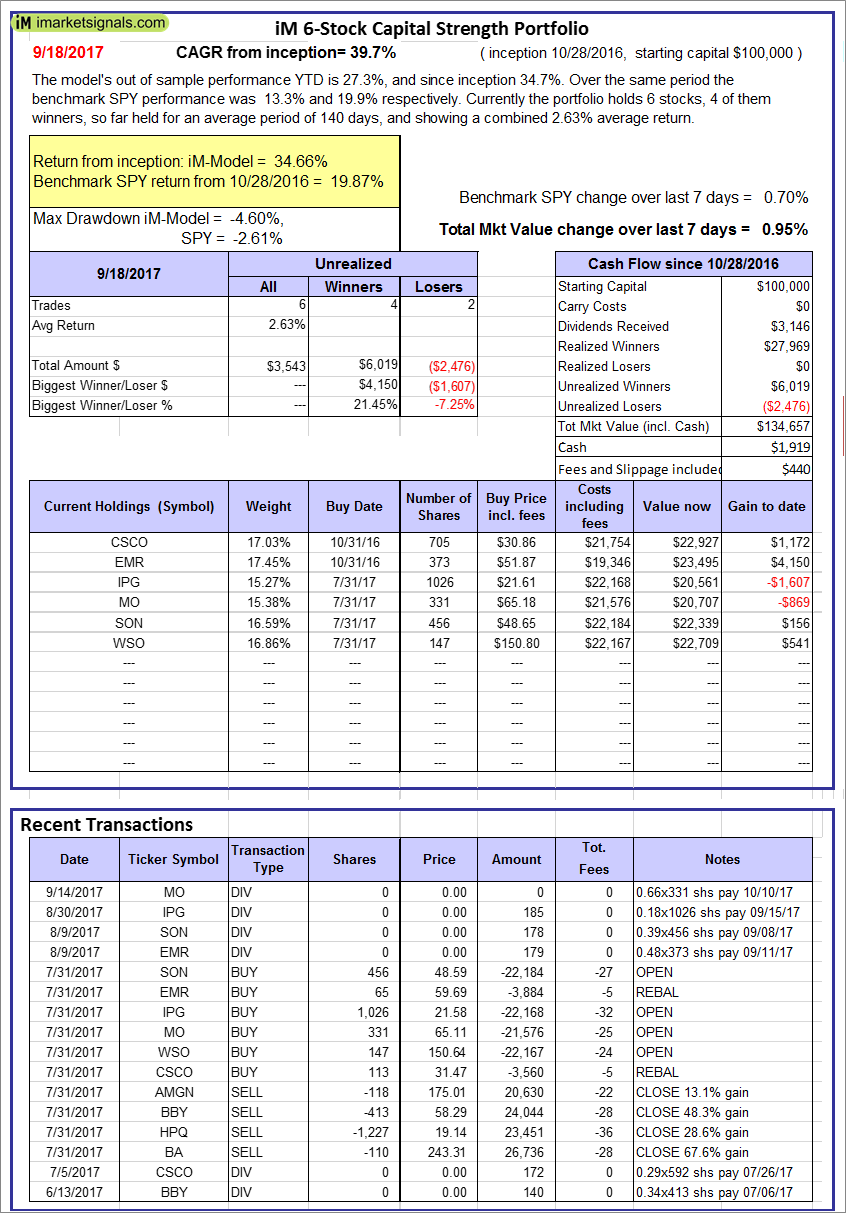 |
iM 6-Stock Capital Strength Portfolio: The model’s out of sample performance YTD is 27.3%, and since inception 34.7%. Over the same period the benchmark SPY performance was 13.3% and 19.9% respectively. Over the previous week the market value of the iM 6-Stock Capital Strength Portfolio gained 0.95% at a time when SPY gained 0.70%. A starting capital of $100,000 at inception on 10/28/2016 would have grown to $134,657 which includes $1,919 cash and excludes $440 spent on fees and slippage. |
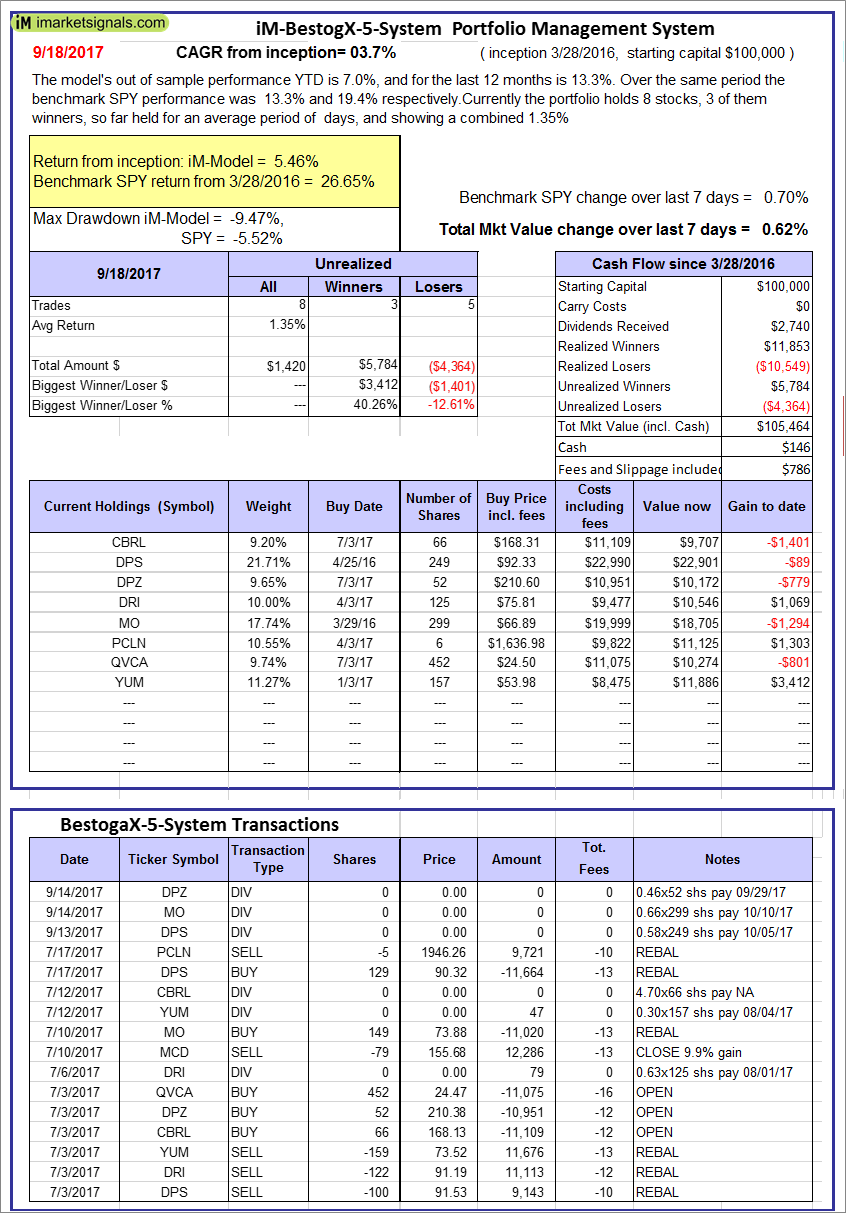 |
iM-BestogaX5-System: The model’s out of sample performance YTD is 7.0%, and for the last 12 months is 13.3%. Over the same period the benchmark SPY performance was 13.3% and 19.4% respectively. Over the previous week the market value of iM-Best8(S&P 500)Tax-Eff. gained 0.62% at a time when SPY gained 0.70%. A starting capital of $100,000 at inception on 3/28/2016 would have grown to $105,464 which includes $146 cash and excludes $786 spent on fees and slippage. |
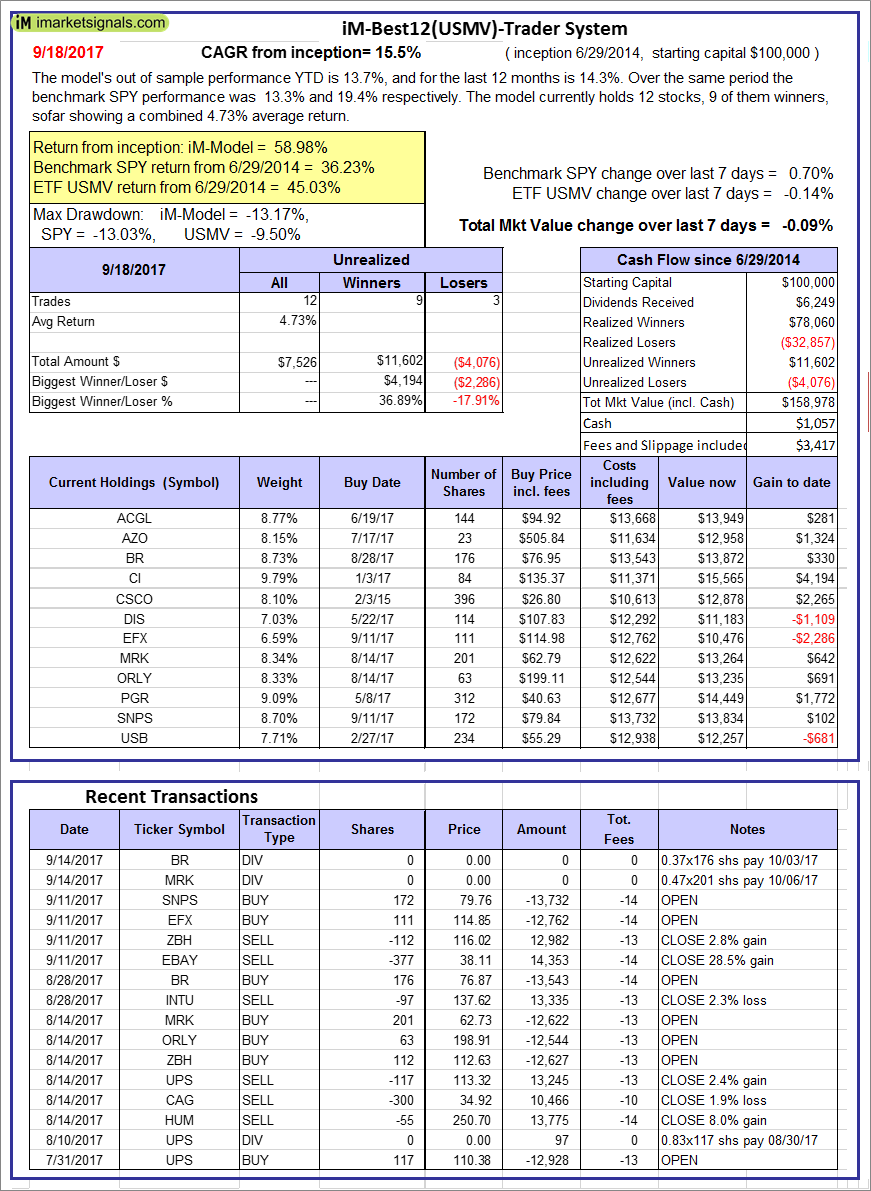 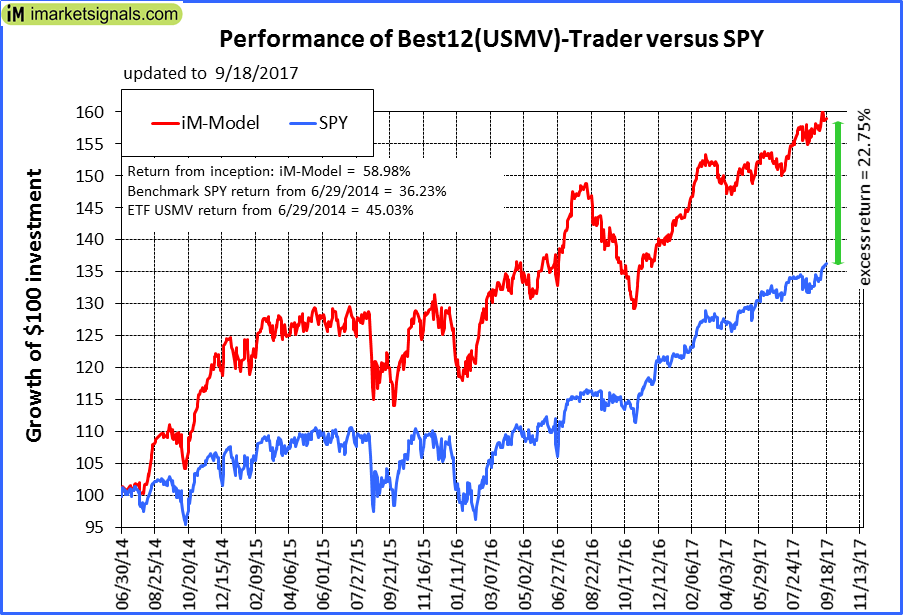 |
iM-Best12(USMV)-Trader: The model’s out of sample performance YTD is 13.7%, and for the last 12 months is 14.3%. Over the same period the benchmark SPY performance was 13.3% and 19.4% respectively. Since inception, on 6/30/2014, the model gained 58.98% while the benchmark SPY gained 36.23% and the ETF USMV gained 45.03% over the same period. Over the previous week the market value of iM-Best12(USMV)-Trader gained -0.09% at a time when SPY gained 0.70%. A starting capital of $100,000 at inception on 6/30/2014 would have grown to $158,978 which includes $1,057 cash and excludes $3,417 spent on fees and slippage. |
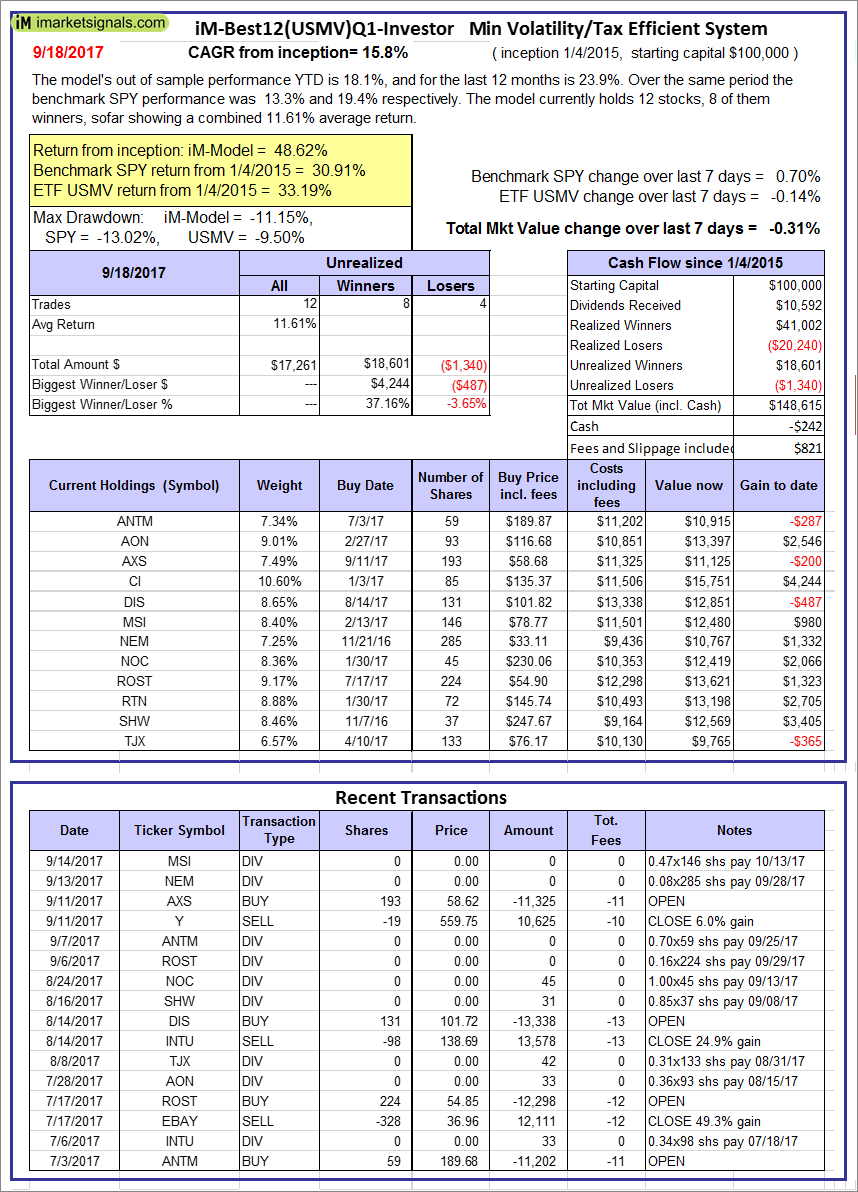 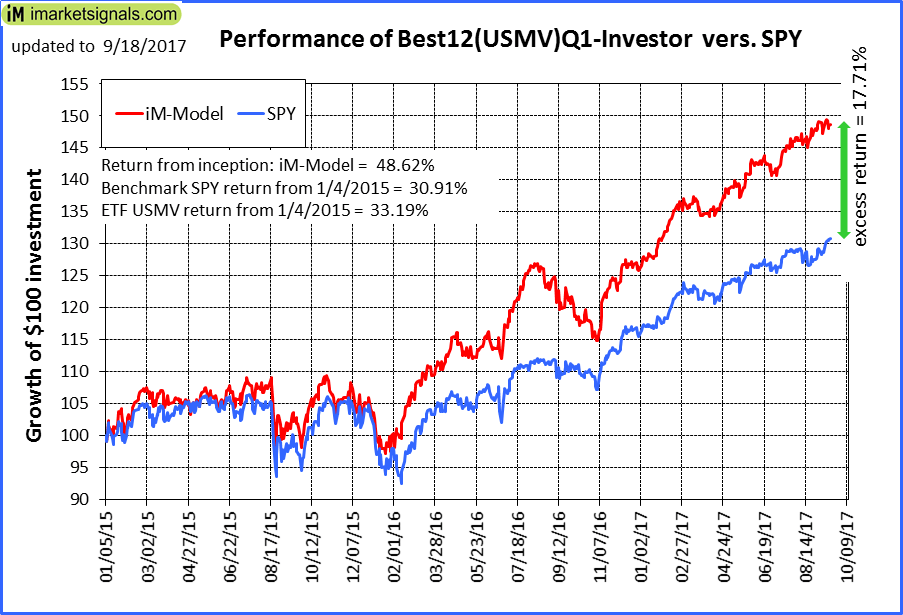 |
iM-Best12(USMV)Q1-Investor: The model’s out of sample performance YTD is 18.1%, and for the last 12 months is 23.9%. Over the same period the benchmark SPY performance was 13.3% and 19.4% respectively. Since inception, on 1/5/2015, the model gained 48.62% while the benchmark SPY gained 30.91% and the ETF USMV gained 33.19% over the same period. Over the previous week the market value of iM-Best12(USMV)Q1 gained -0.31% at a time when SPY gained 0.70%. A starting capital of $100,000 at inception on 1/5/2015 would have grown to $148,615 which includes -$242 cash and excludes $821 spent on fees and slippage. |
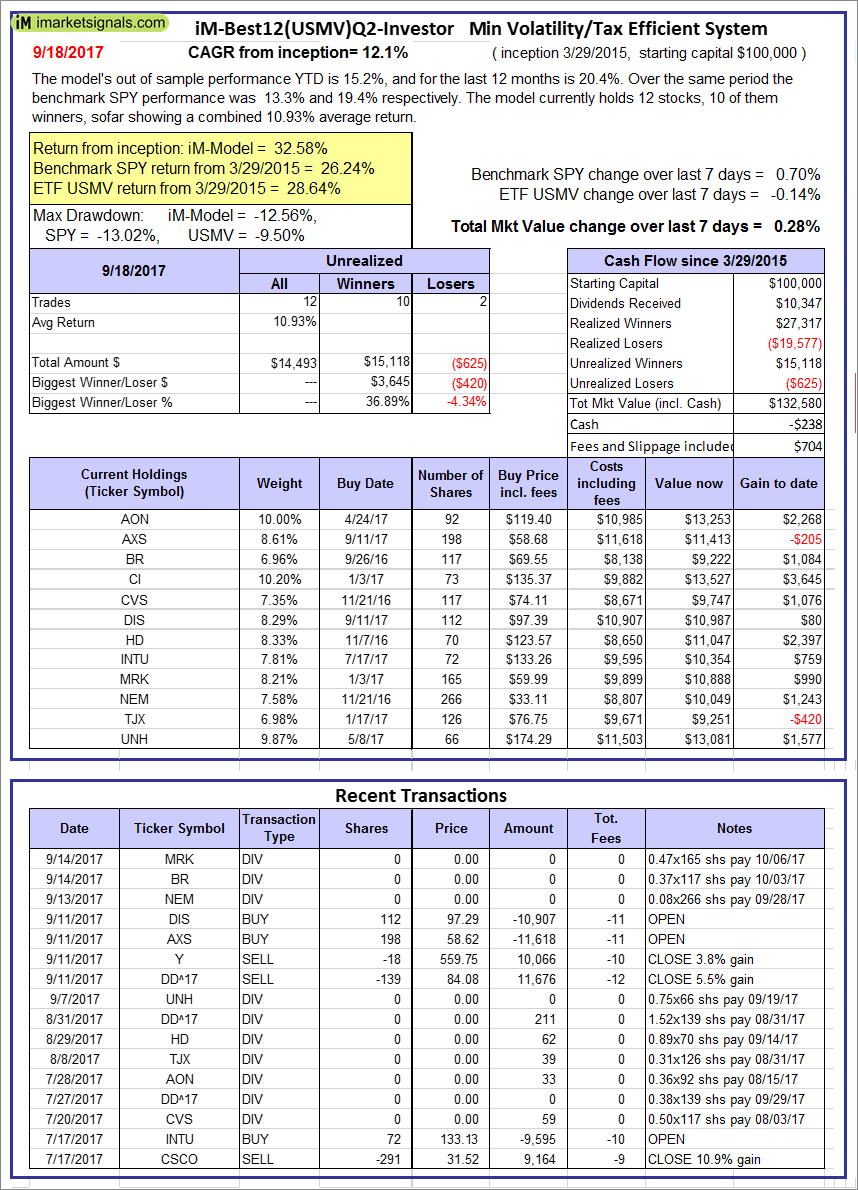 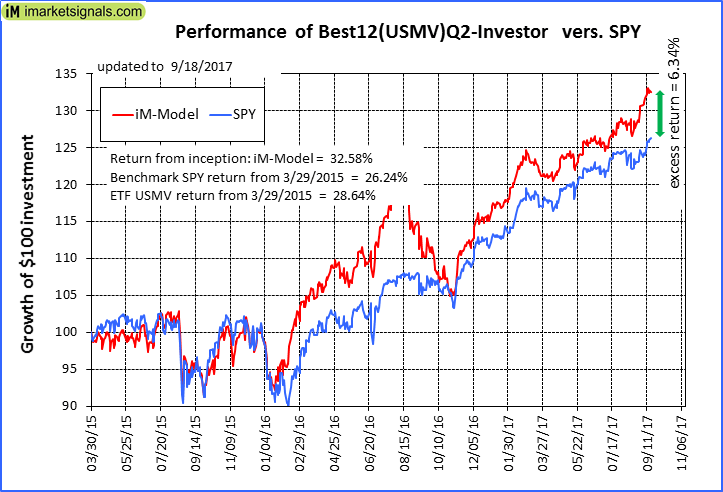 |
iM-Best12(USMV)Q2-Investor: The model’s out of sample performance YTD is 15.2%, and for the last 12 months is 20.4%. Over the same period the benchmark SPY performance was 13.3% and 19.4% respectively. Since inception, on 3/30/2015, the model gained 32.58% while the benchmark SPY gained 26.24% and the ETF USMV gained 28.64% over the same period. Over the previous week the market value of iM-Best12(USMV)Q2 gained 0.28% at a time when SPY gained 0.70%. A starting capital of $100,000 at inception on 3/30/2015 would have grown to $132,580 which includes -$238 cash and excludes $704 spent on fees and slippage. |
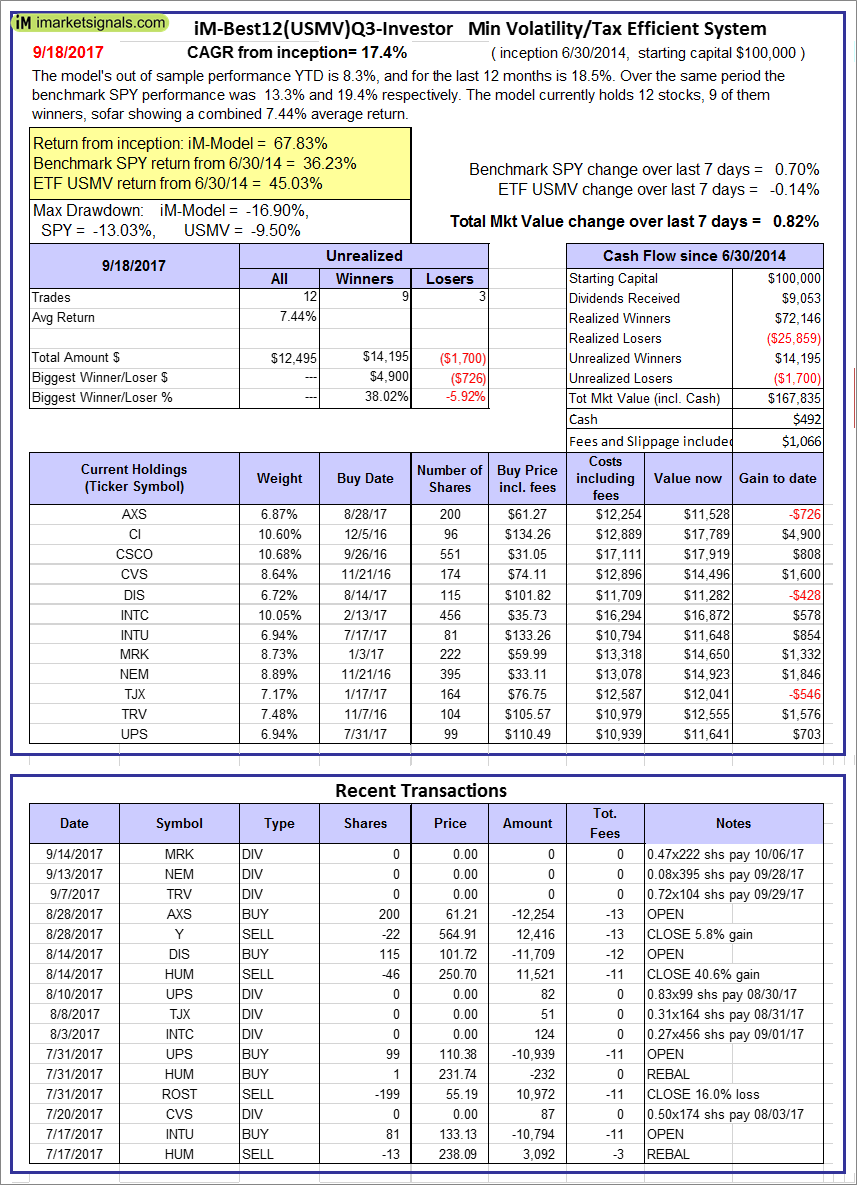 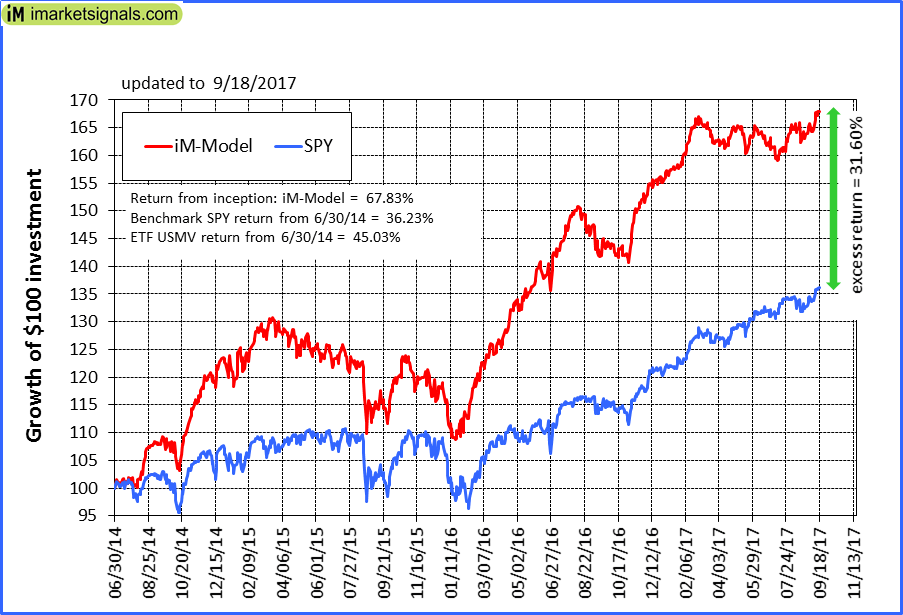 |
iM-Best12(USMV)Q3-Investor: The model’s out of sample performance YTD is 8.3%, and for the last 12 months is 18.5%. Over the same period the benchmark SPY performance was 13.3% and 19.4% respectively. Since inception, on 7/1/2014, the model gained 67.83% while the benchmark SPY gained 36.23% and the ETF USMV gained 45.03% over the same period. Over the previous week the market value of iM-Best12(USMV)Q3 gained 0.82% at a time when SPY gained 0.70%. A starting capital of $100,000 at inception on 7/1/2014 would have grown to $167,835 which includes $492 cash and excludes $1,066 spent on fees and slippage. |
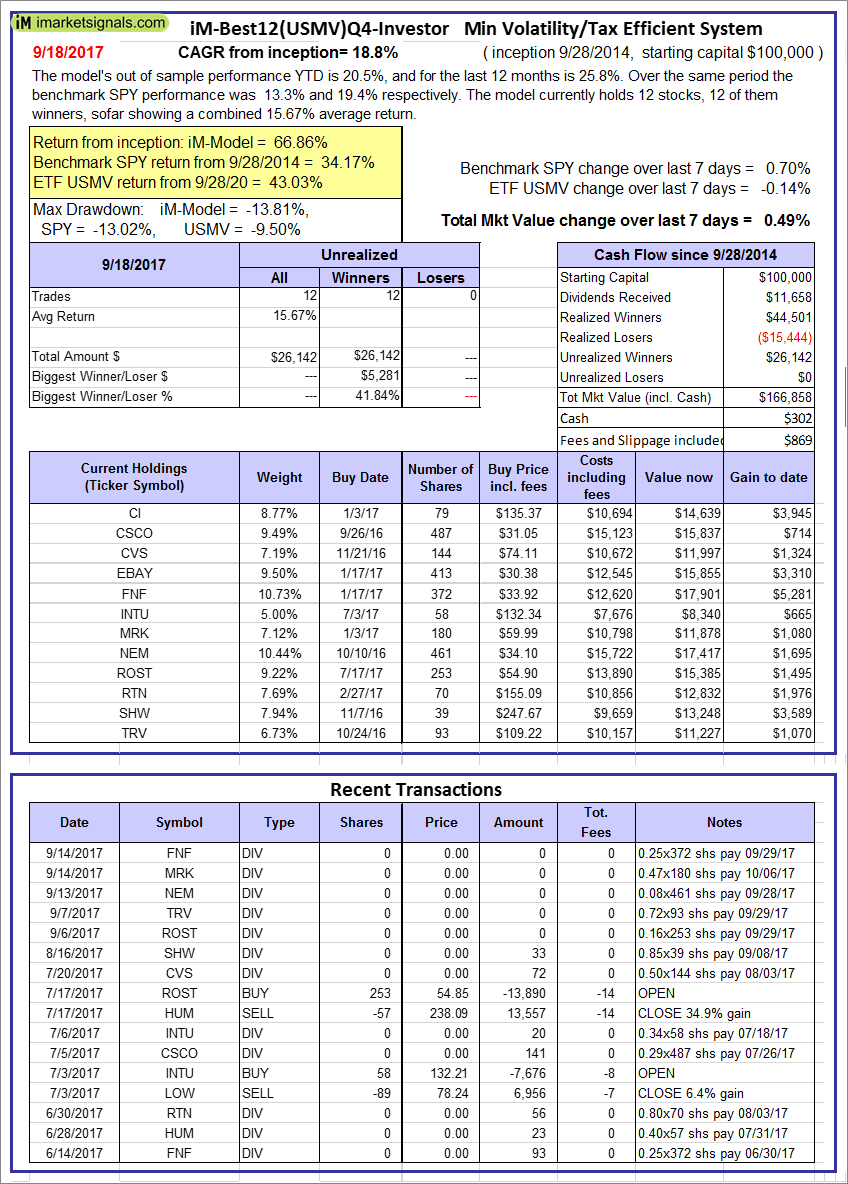 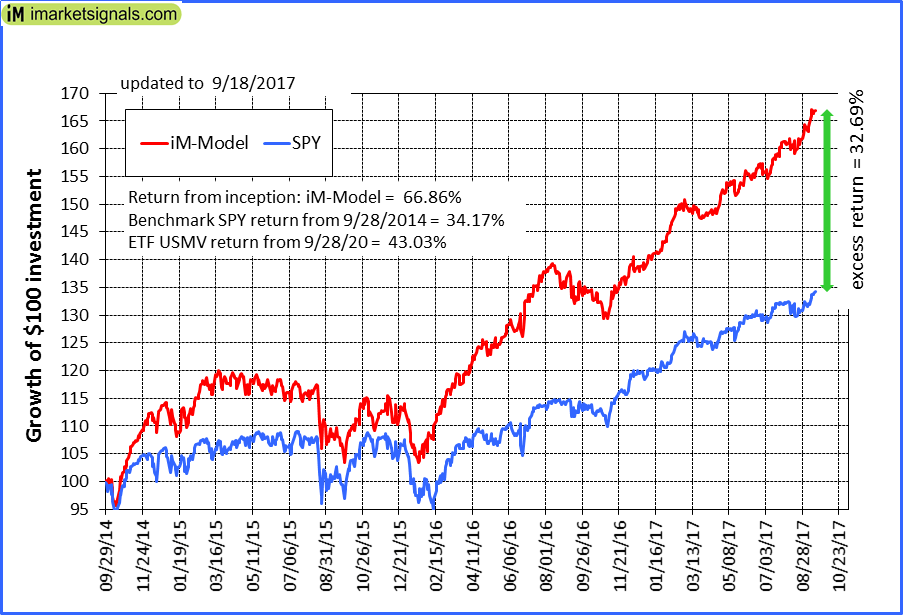 |
iM-Best12(USMV)Q4-Investor: Since inception, on 9/29/2014, the model gained 66.86% while the benchmark SPY gained 34.17% and the ETF USMV gained 43.03% over the same period. Over the previous week the market value of iM-Best12(USMV)Q4 gained 0.49% at a time when SPY gained 0.70%. A starting capital of $100,000 at inception on 9/29/2014 would have grown to $166,858 which includes $302 cash and excludes $869 spent on fees and slippage. |
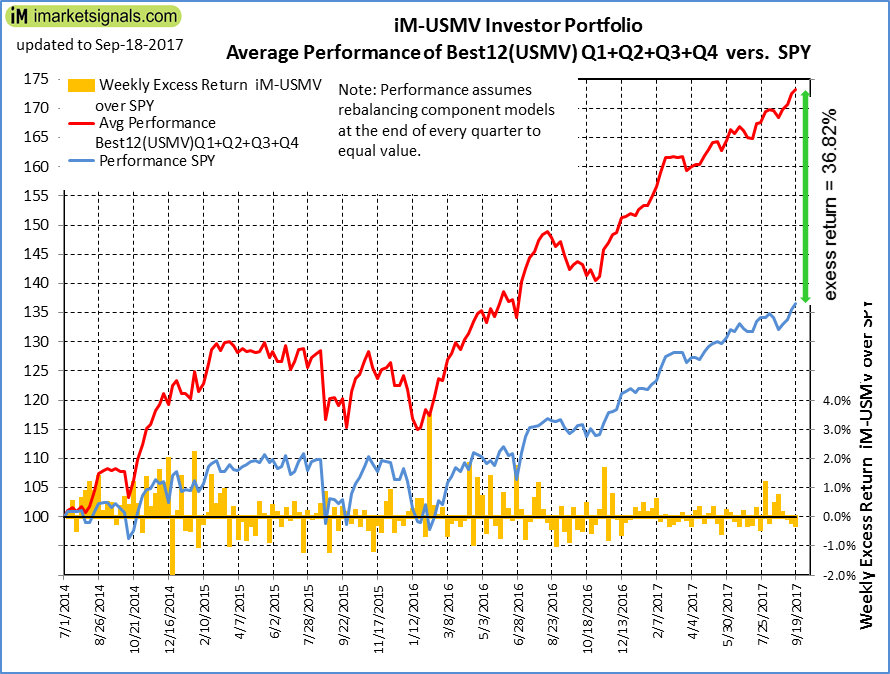 |
Average Performance of iM-Best12(USMV)Q1+Q2+Q3+Q4-Investor resulted in an excess return of 36.82% over SPY. (see iM-USMV Investor Portfolio) |
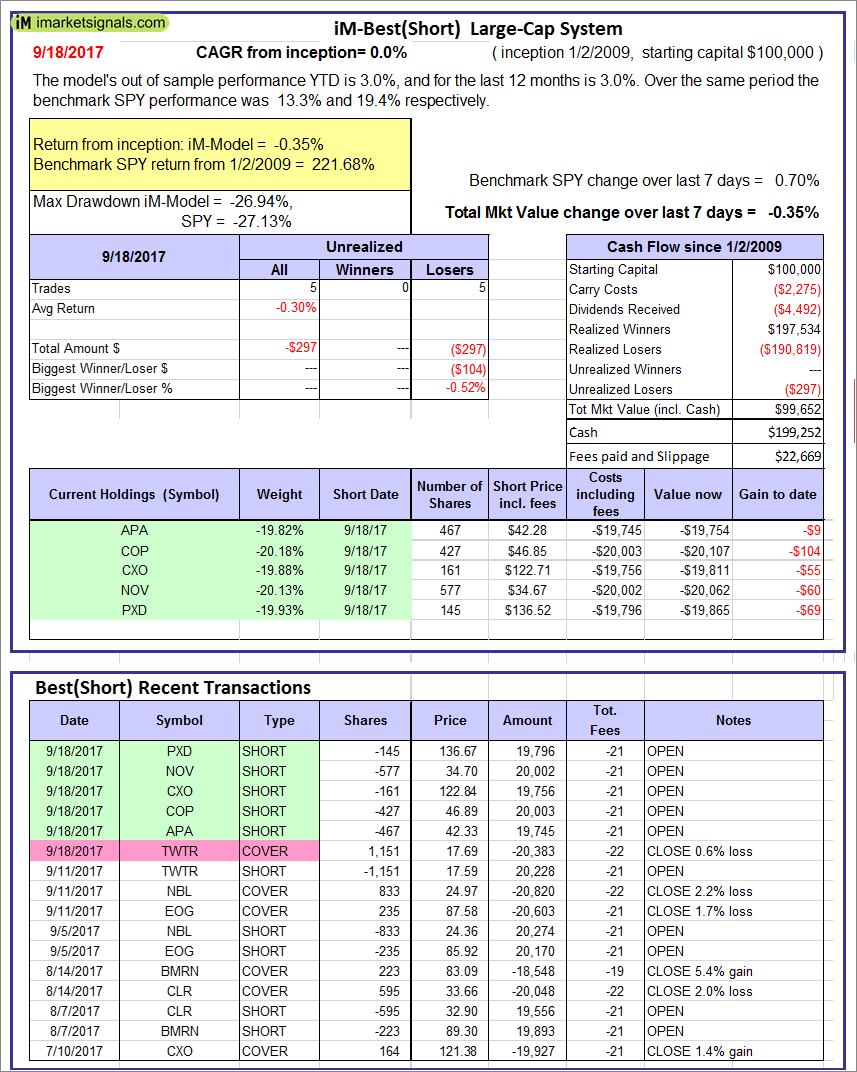 |
iM-Best(Short): The model’s out of sample performance YTD is 3.0%, and for the last 12 months is 3.0%. Over the same period the benchmark SPY performance was 13.3% and 19.4% respectively. Over the previous week the market value of iM-Best(Short) gained -0.35% at a time when SPY gained 0.70%. Over the period 1/2/2009 to 9/18/2017 the starting capital of $100,000 would have grown to $99,652 which includes $199,252 cash and excludes $22,669 spent on fees and slippage. |
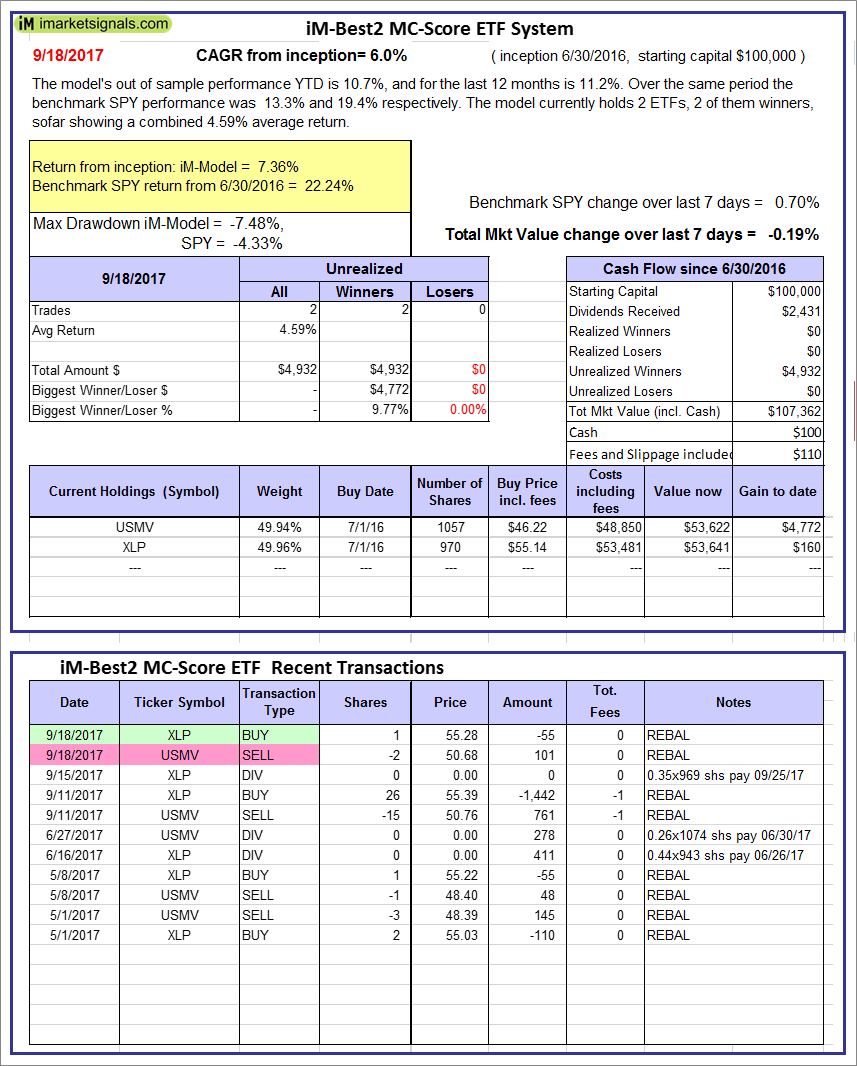 |
iM-Best2 MC-Score ETF System: The model’s out of sample performance YTD is 10.7%, and for the last 12 months is 11.2%. Over the same period the benchmark SPY performance was 13.3% and 19.4% respectively. Over the previous week the market value of the iM-Best2 MC-Score ETF System gained -0.19% at a time when SPY gained 0.70%. A starting capital of $100,000 at inception on 6/30/2016 would have grown to $107,362 which includes $100 cash and excludes $110 spent on fees and slippage. |
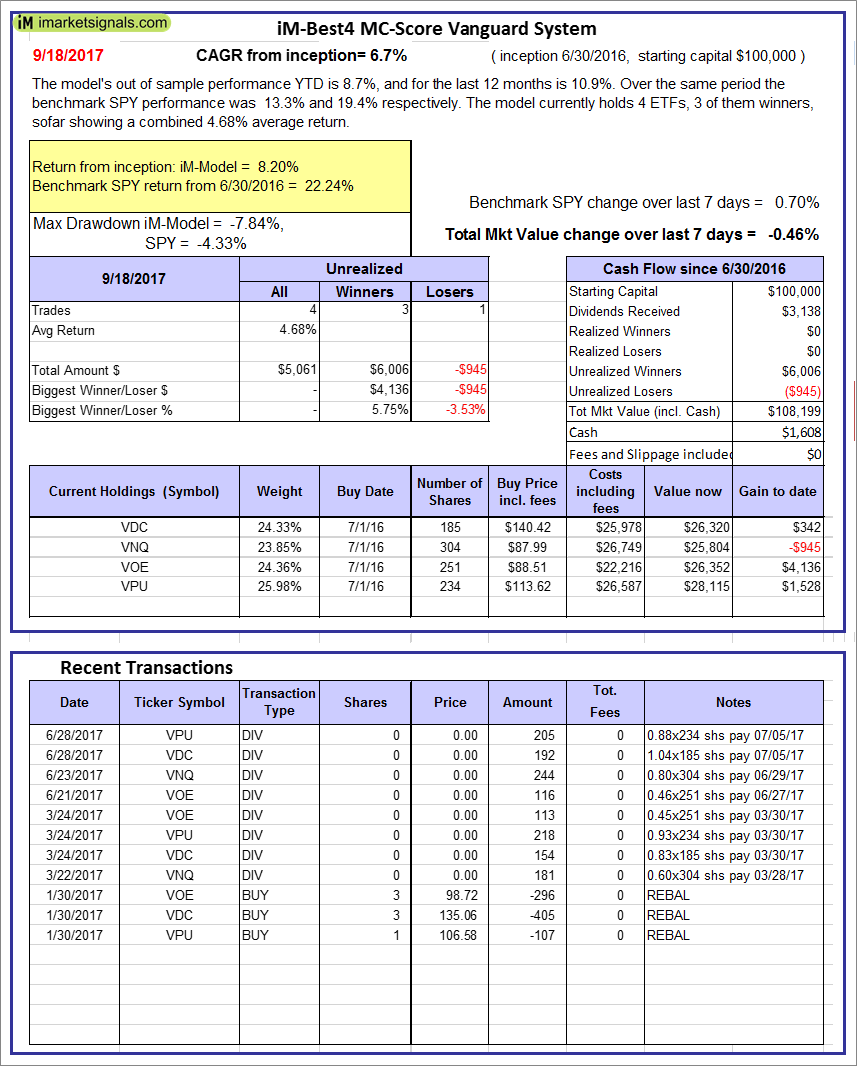 |
iM-Best4 MC-Score Vanguard System: The model’s out of sample performance YTD is 8.7%, and for the last 12 months is 10.9%. Over the same period the benchmark SPY performance was 13.3% and 19.4% respectively. Over the previous week the market value of the iM-Best4 MC-Score Vanguard System gained -0.46% at a time when SPY gained 0.70%. A starting capital of $100,000 at inception on 6/30/2016 would have grown to $108,199 which includes $1,608 cash and excludes $00 spent on fees and slippage. |
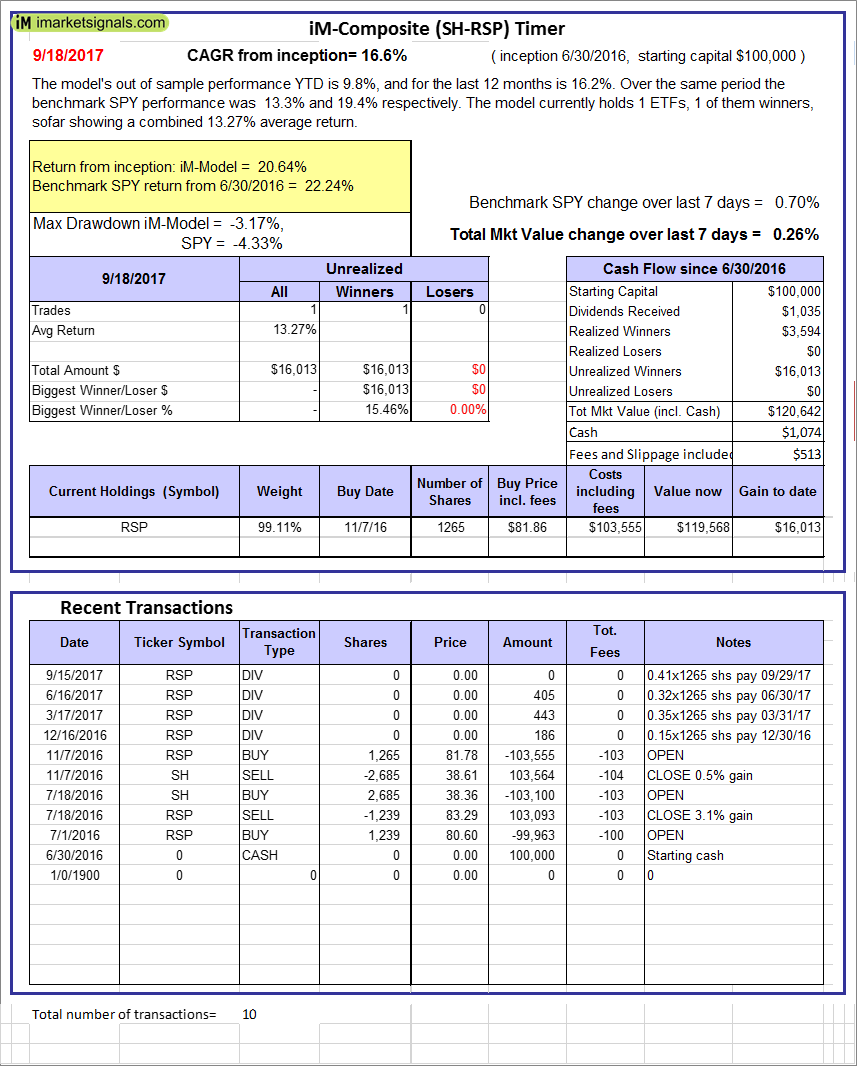 |
iM-Composite (SH-RSP) Timer: The model’s out of sample performance YTD is 9.8%, and for the last 12 months is 16.2%. Over the same period the benchmark SPY performance was 13.3% and 19.4% respectively. Over the previous week the market value of the iM-Composite (SH-RSP) Timer gained 0.26% at a time when SPY gained 0.70%. A starting capital of $100,000 at inception on 6/30/2016 would have grown to $120,642 which includes $1,074 cash and excludes $513 spent on fees and slippage. |
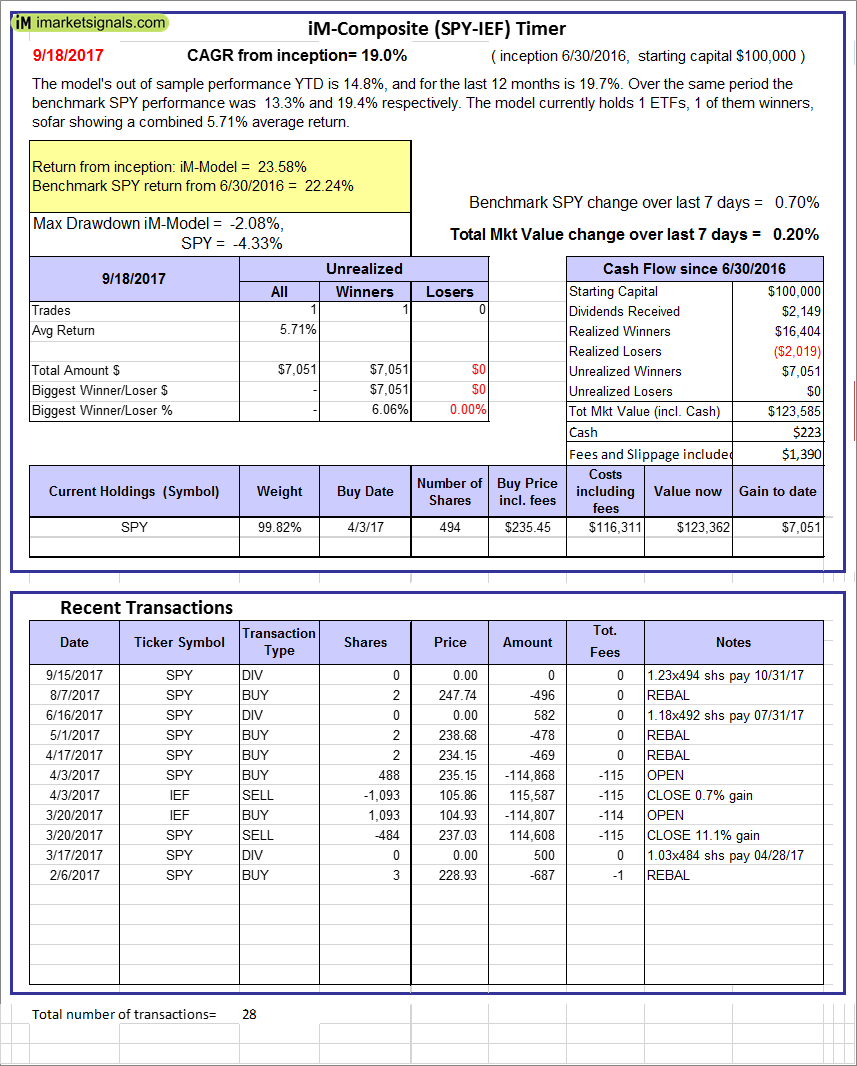 |
iM-Composite (SPY-IEF) Timer: The model’s out of sample performance YTD is 14.8%, and for the last 12 months is 19.7%. Over the same period the benchmark SPY performance was 13.3% and 19.4% respectively. Over the previous week the market value of the iM-Composite (SPY-IEF) Timer gained 0.20% at a time when SPY gained 0.70%. A starting capital of $100,000 at inception on 6/30/2016 would have grown to $123,585 which includes $223 cash and excludes $1,390 spent on fees and slippage. |
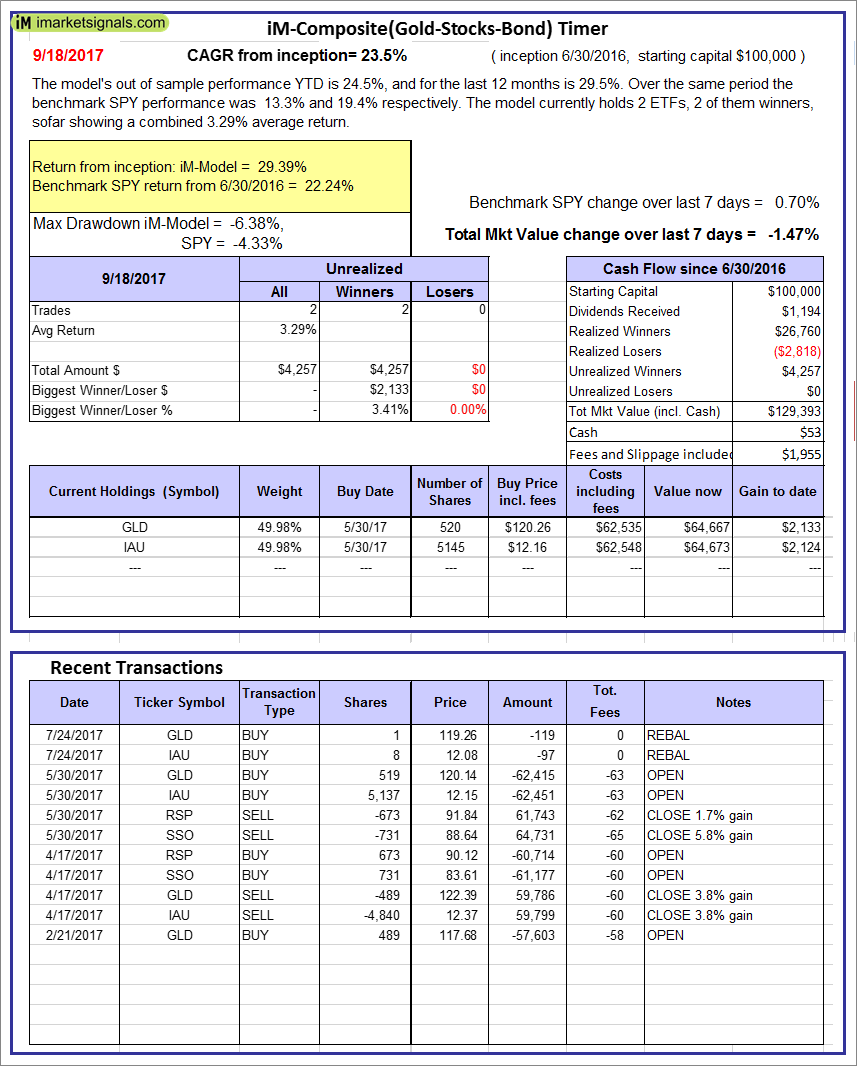 |
iM-Composite(Gold-Stocks-Bond) Timer: The model’s out of sample performance YTD is 24.5%, and for the last 12 months is 29.5%. Over the same period the benchmark SPY performance was 13.3% and 19.4% respectively. Over the previous week the market value of the iM-Composite(Gold-Stocks-Bond) Timer gained -1.47% at a time when SPY gained 0.70%. A starting capital of $100,000 at inception on 6/30/2016 would have grown to $129,393 which includes $53 cash and excludes $1,955 spent on fees and slippage. |
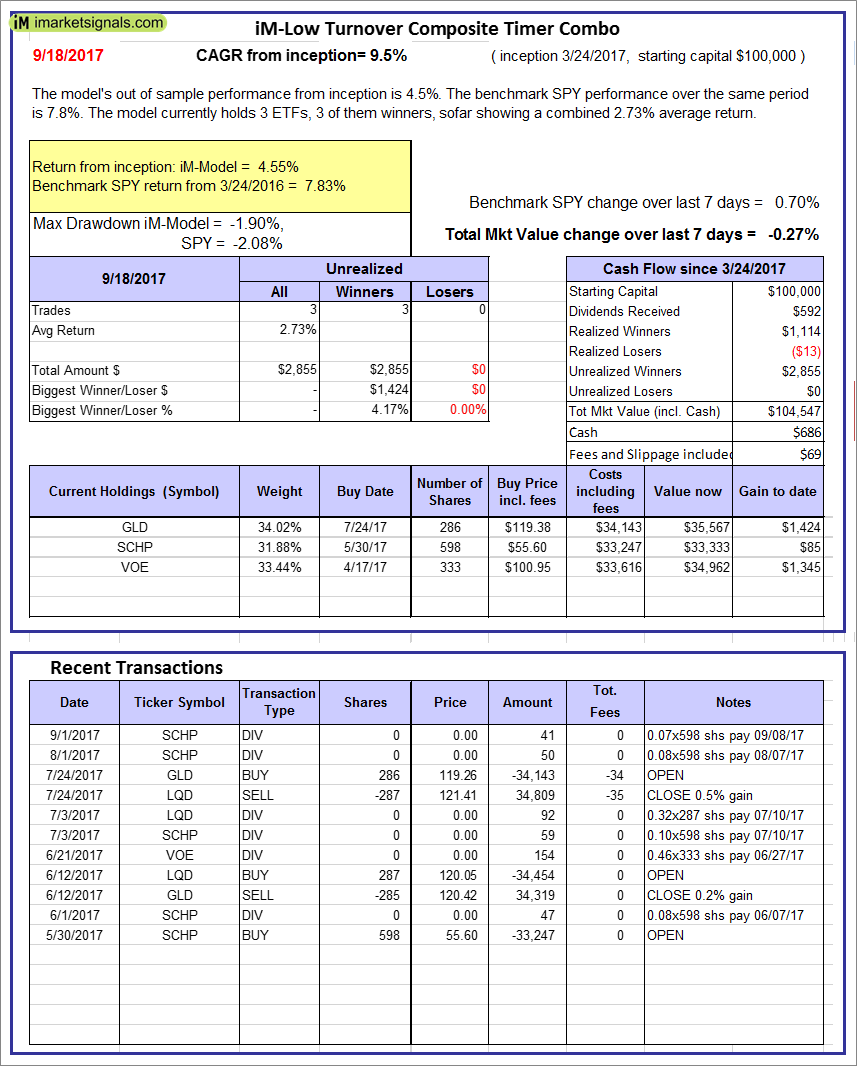 |
iM-Low Turnover Composite Timer Combo: The model’s out of sample performance from inception is 4.5%. The benchmark SPY performance over the same period is 7.8%. Over the previous week the market value of the iM-Low Turnover Composite Timer Combo gained -0.27% at a time when SPY gained 0.70%. A starting capital of $100,000 at inception on 3/24/27 would have grown to $104,547 which includes $686 cash and excludes $69 spent on fees and slippage. |
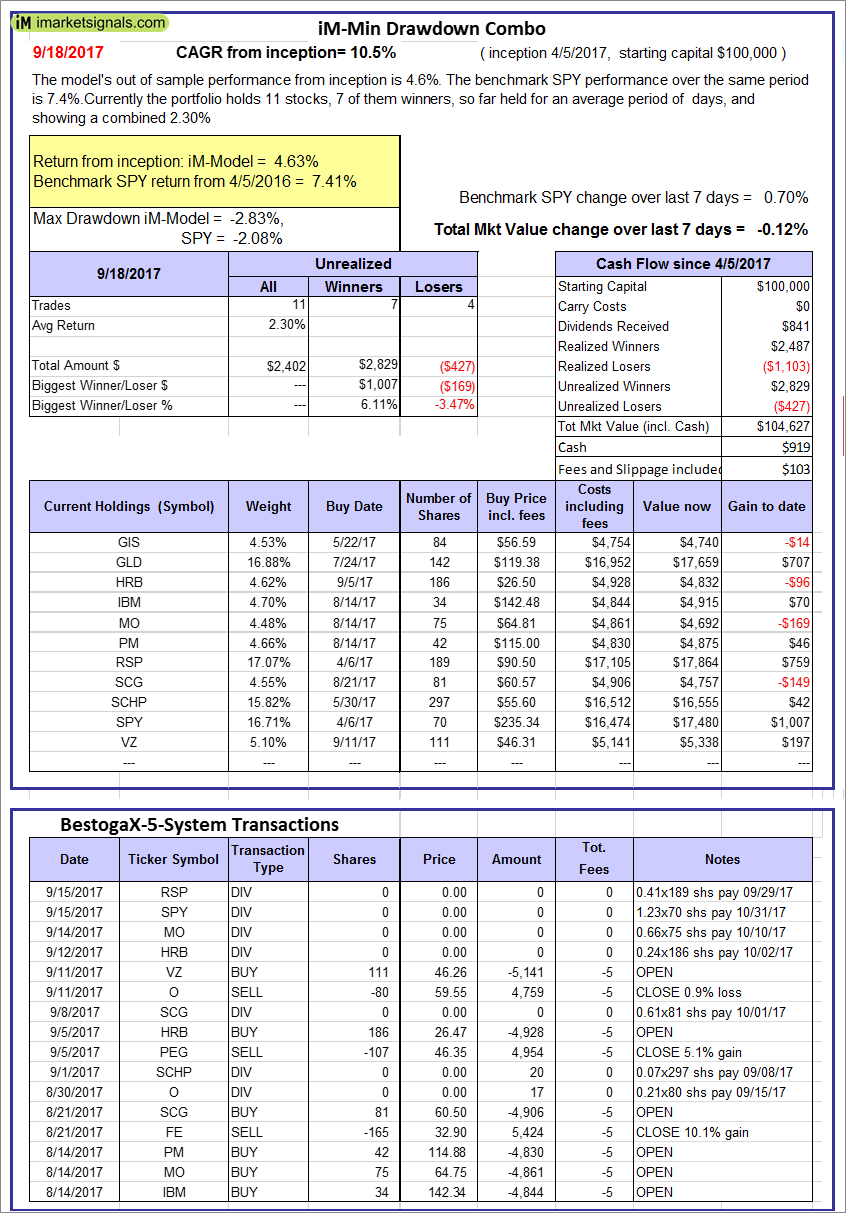 |
iM-Min Drawdown Combo: The model’s out of sample performance from inception is 4.6%. The benchmark SPY performance over the same period is 7.4%. Over the previous week the market value of the iM-Min Drawdown Combo gained -0.12% at a time when SPY gained 0.70%. A starting capital of $100,000 at inception on 4/5/2017 would have grown to $104,627 which includes $919 cash and excludes $103 spent on fees and slippage. |
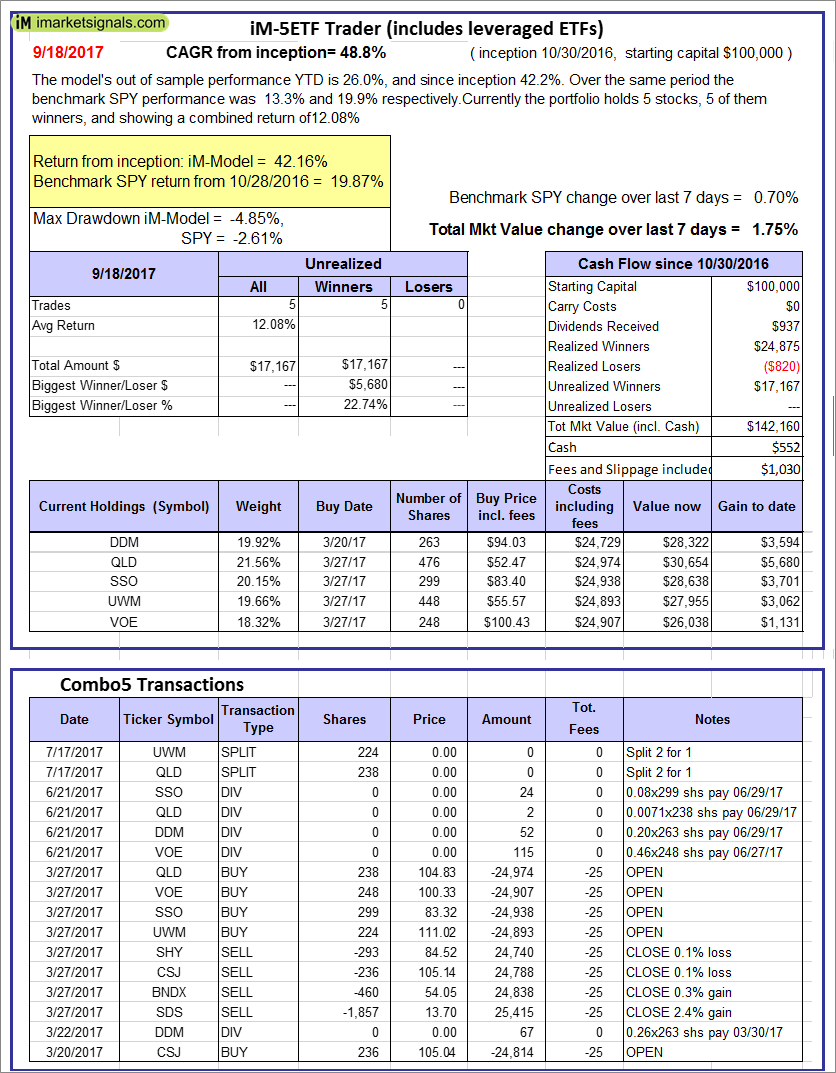 |
iM-5ETF Trader (includes leveraged ETFs): The model’s out of sample performance YTD is 13.5%, and since inception 16.7%. Over the same period the benchmark SPY performance was 13.3% and 19.9% respectively. Over the previous week the market value of the iM-5ETF Trader (includes leveraged ETFs) gained 1.75% at a time when SPY gained 0.70%. A starting capital of $100,000 at inception on 10/30/2016 would have grown to $142,160 which includes $552 cash and excludes $1,030 spent on fees and slippage. |
 |
iM-Standard 5ETF Trader (excludes leveraged ETFs): The model’s out of sample performance YTD is 13.5%, and since inception 16.7%. Over the same period the benchmark SPY performance was 13.3% and 19.9% respectively. Over the previous week the market value of the iM-Standard 5ETF Trader (excludes leveraged ETFs) gained 0.76% at a time when SPY gained 0.70%. A starting capital of $100,000 at inception on 10/30/2016 would have grown to $116,717 which includes $863 cash and excludes $880 spent on fees and slippage. |
Posted in pmp SPY-SH
iM-Best Reports – 8/28/2017
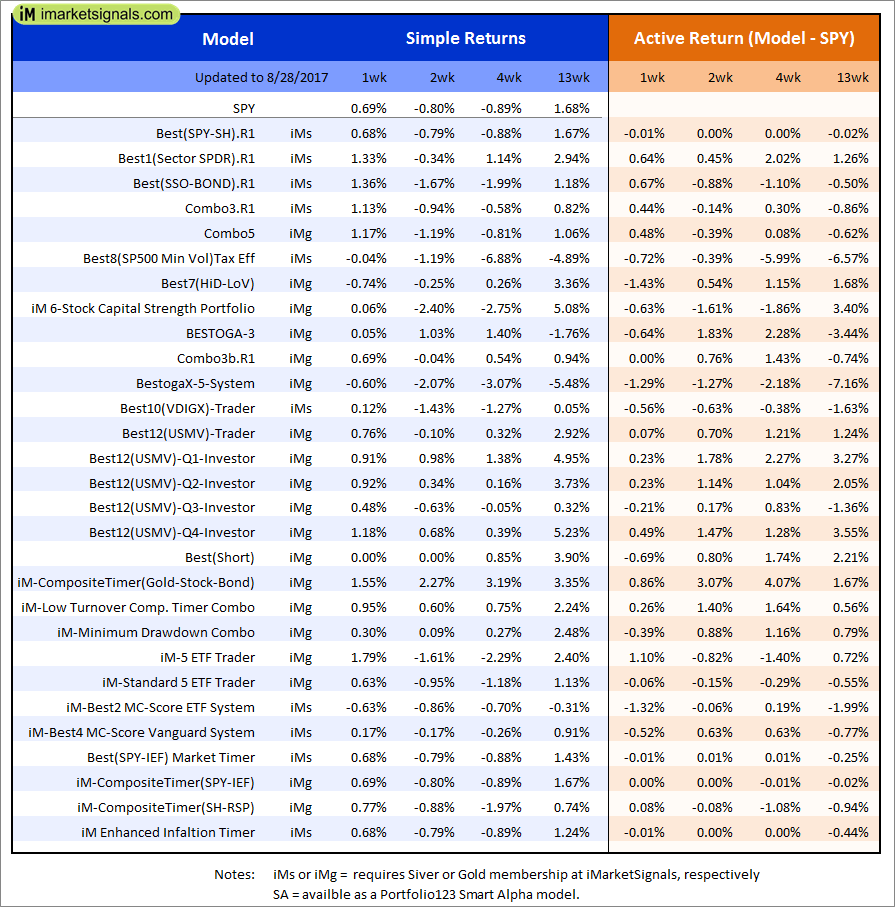  |
Out of sample performance summary of our models for the past 1, 2, 4 and 13 week periods. The active active return indicates how the models over- or underperformed the benchmark ETF SPY. Also the YTD, and the 1-, 3-, 5- and 10-year annualized returns are shown in the second table |
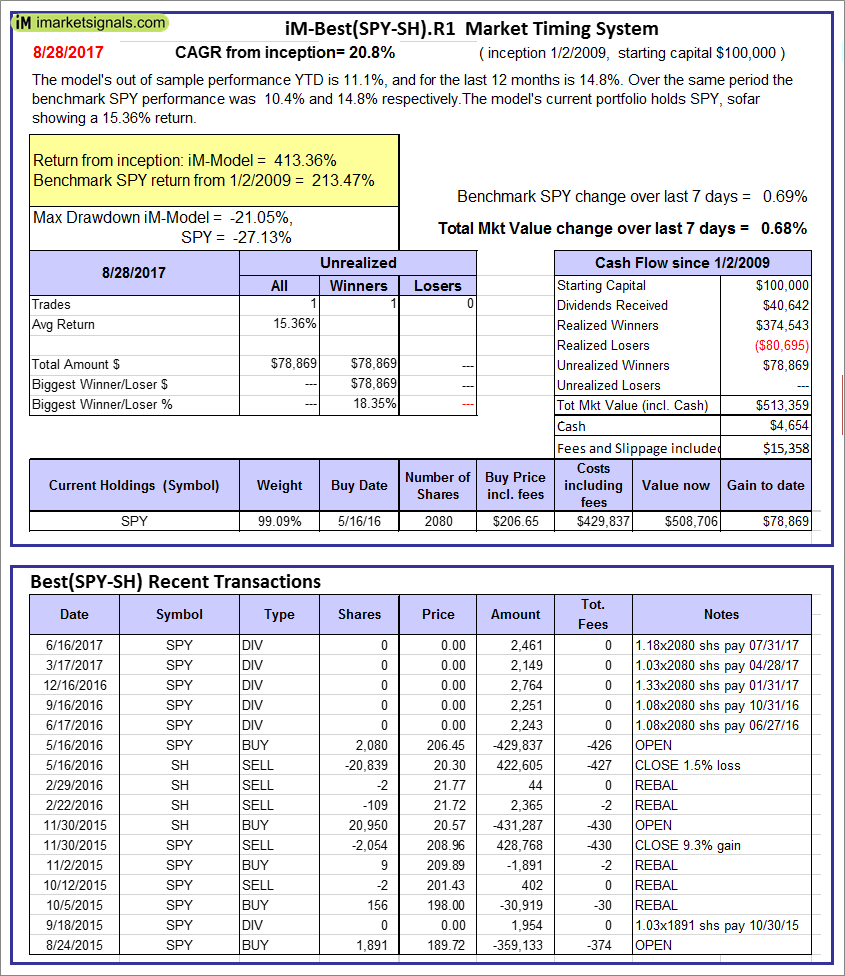 |
iM-Best(SPY-SH).R1: The model’s out of sample performance YTD is 11.1%, and for the last 12 months is 14.8%. Over the same period the benchmark SPY performance was 10.4% and 14.8% respectively. Over the previous week the market value of Best(SPY-SH) gained 0.68% at a time when SPY gained 0.69%. A starting capital of $100,000 at inception on 1/2/2009 would have grown to $513,359 which includes $4,654 cash and excludes $15,358 spent on fees and slippage. |
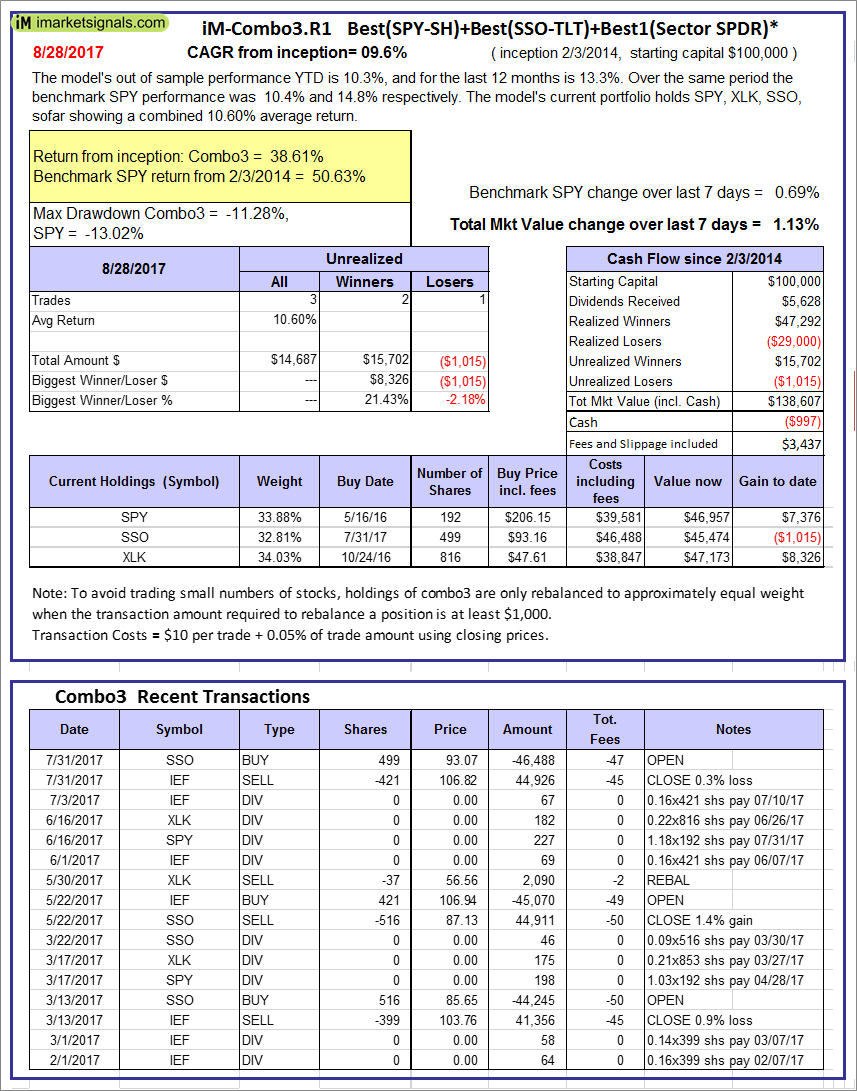 |
iM-Combo3.R1: The model’s out of sample performance YTD is 10.3%, and for the last 12 months is 13.3%. Over the same period the benchmark SPY performance was 10.4% and 14.8% respectively. Over the previous week the market value of iM-Combo3.R1 gained 1.13% at a time when SPY gained 0.69%. A starting capital of $100,000 at inception on 2/3/2014 would have grown to $138,607 which includes -$997 cash and excludes $3,437 spent on fees and slippage. |
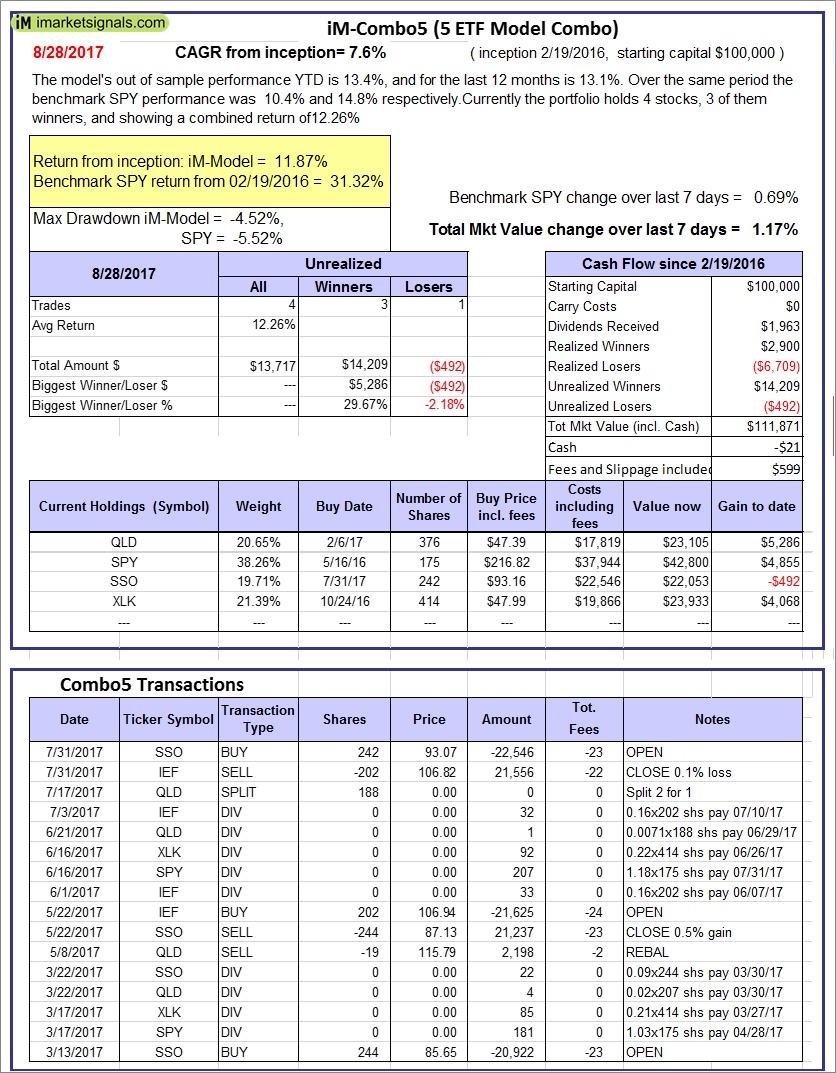 |
iM-Combo5: The model’s out of sample performance YTD is 13.4%, and for the last 12 months is 13.1%. Over the same period the benchmark SPY performance was 10.4% and 14.8% respectively. Over the previous week the market value of iM-Combo5 gained 1.17% at a time when SPY gained 0.69%. A starting capital of $100,000 at inception on 2/22/2016 would have grown to $111,871 which includes -$21 cash and excludes $599 spent on fees and slippage. |
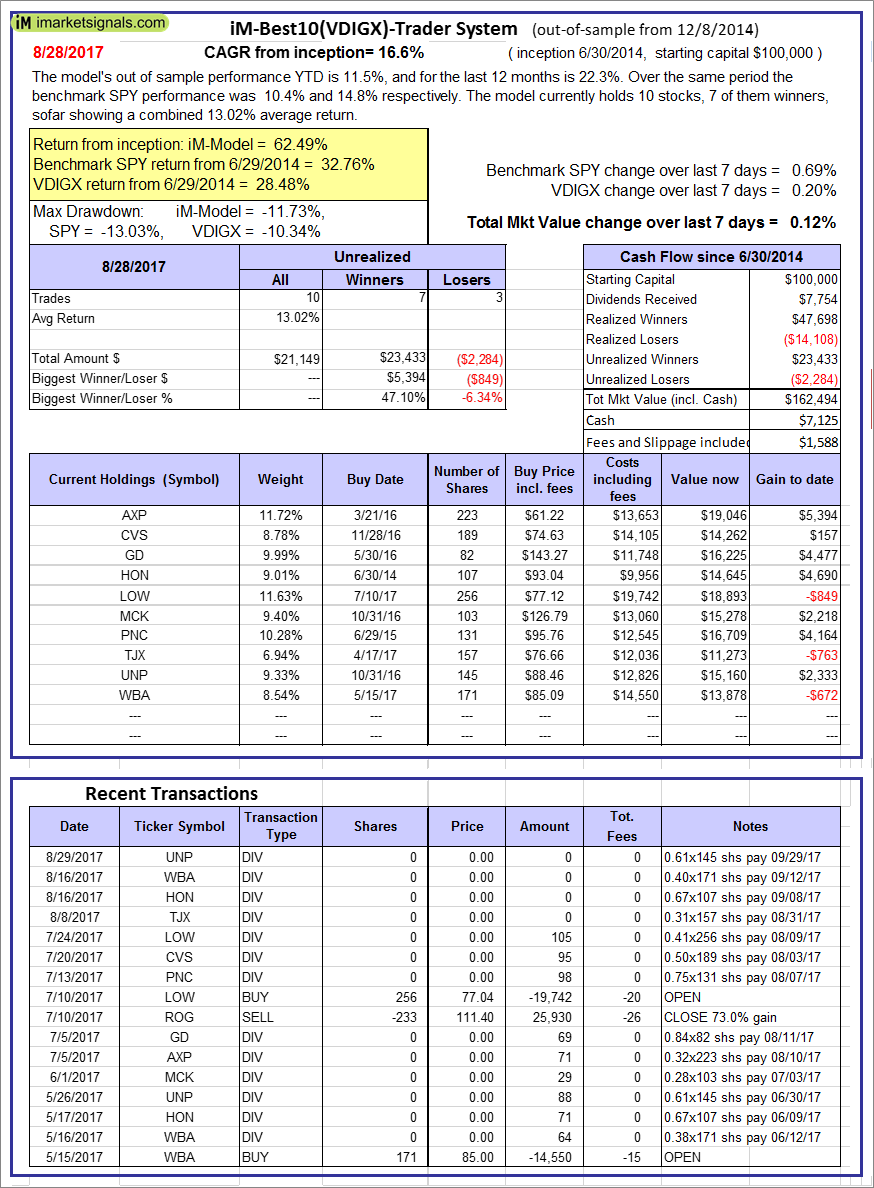 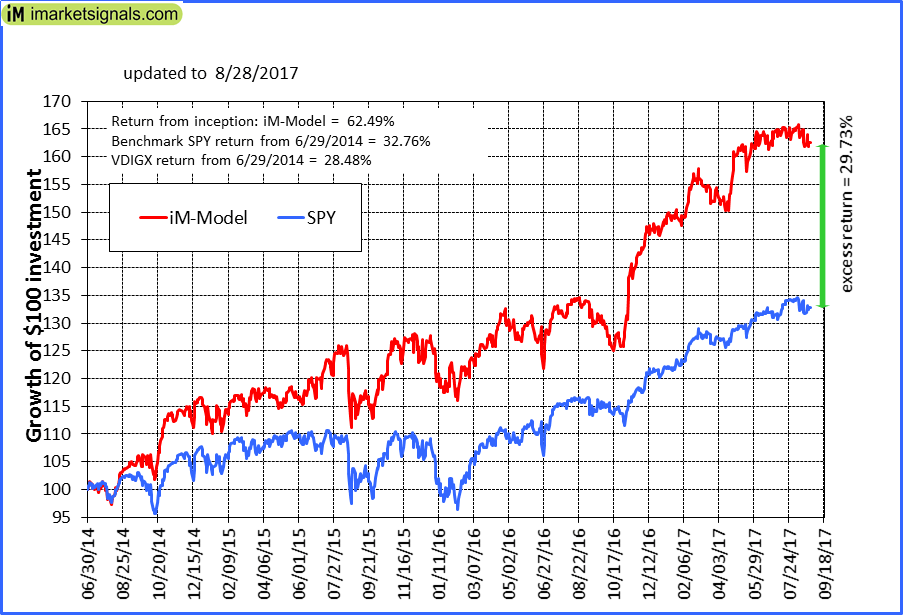 |
iM-Best10(VDIGX)-Trader: The model’s out of sample performance YTD is 11.5%, and for the last 12 months is 22.3%. Over the same period the benchmark SPY performance was 10.4% and 14.8% respectively. Since inception, on 7/1/2014, the model gained 62.49% while the benchmark SPY gained 32.76% and VDIGX gained 28.48% over the same period. Over the previous week the market value of iM-Best10(VDIGX) gained 0.12% at a time when SPY gained 0.69%. A starting capital of $100,000 at inception on 7/1/2014 would have grown to $162,494 which includes $7,125 cash and excludes $1,588 spent on fees and slippage. |
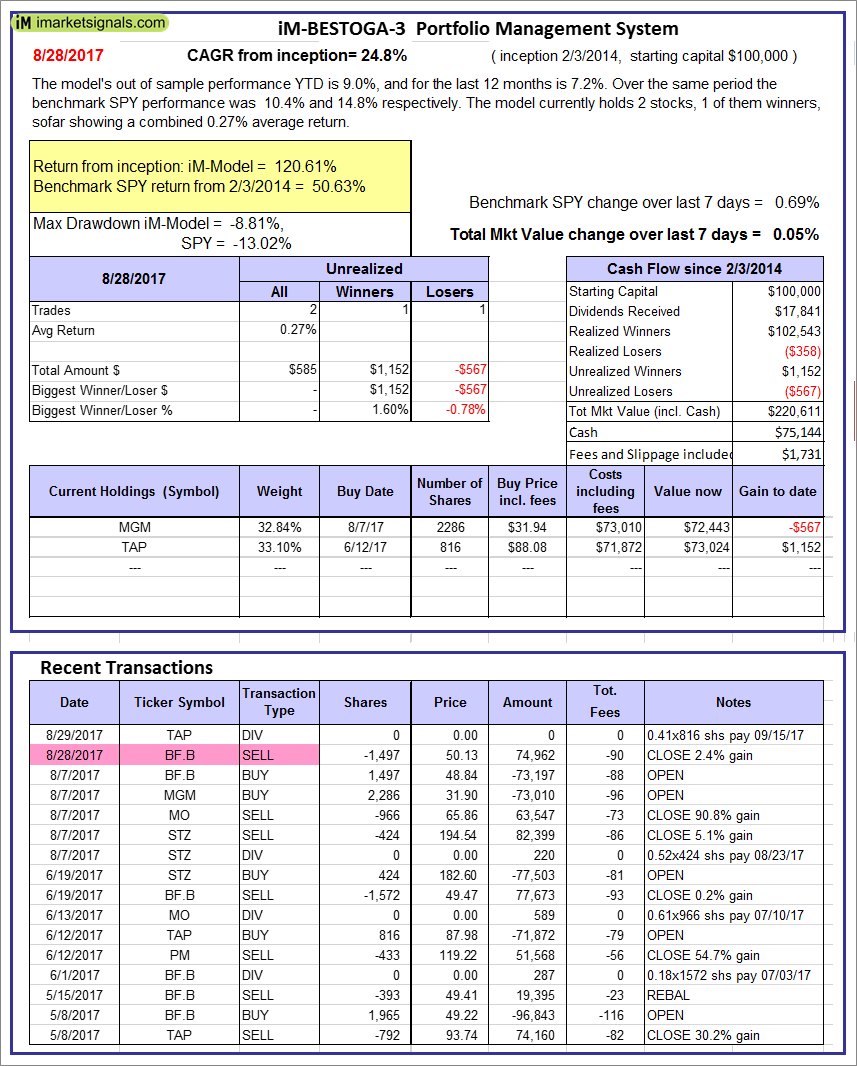 |
iM-BESTOGA-3: The model’s out of sample performance YTD is 9.0%, and for the last 12 months is 7.2%. Over the same period the benchmark SPY performance was 10.4% and 14.8% respectively. Over the previous week the market value of iM-BESTOGA-3 gained 0.05% at a time when SPY gained 0.69%. A starting capital of $100,000 at inception on 2/3/2014 would have grown to $220,611 which includes $75,144 cash and excludes $1,731 spent on fees and slippage. |
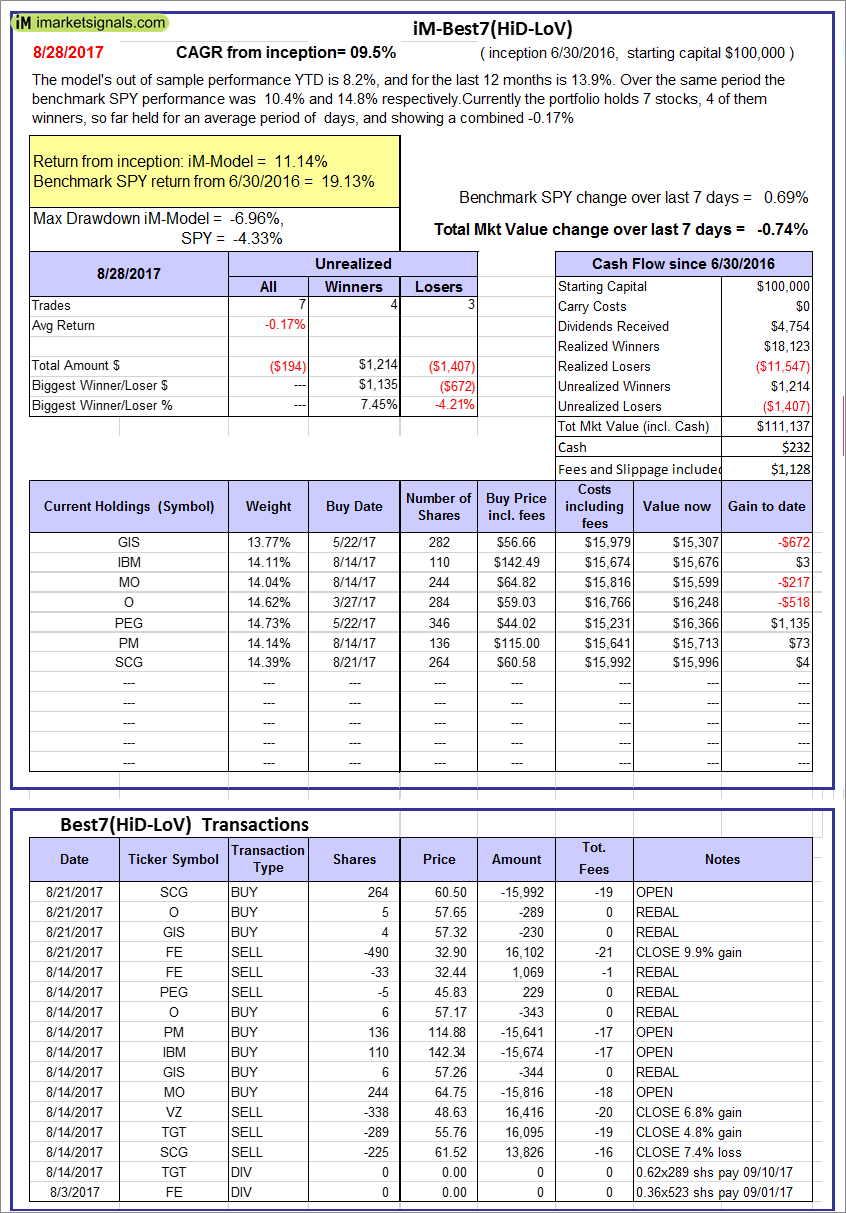 |
iM-Best7(HiD-LoV): The model’s out of sample performance YTD is 8.2%, and for the last 12 months is 13.9%. Over the same period the benchmark SPY performance was 10.4% and 14.8% respectively. Over the previous week the market value of iM-BESTOGA-3 gained -0.74% at a time when SPY gained 0.69%. A starting capital of $100,000 at inception on 6/30/2016 would have grown to $111,137 which includes $232 cash and excludes $1,128 spent on fees and slippage. |
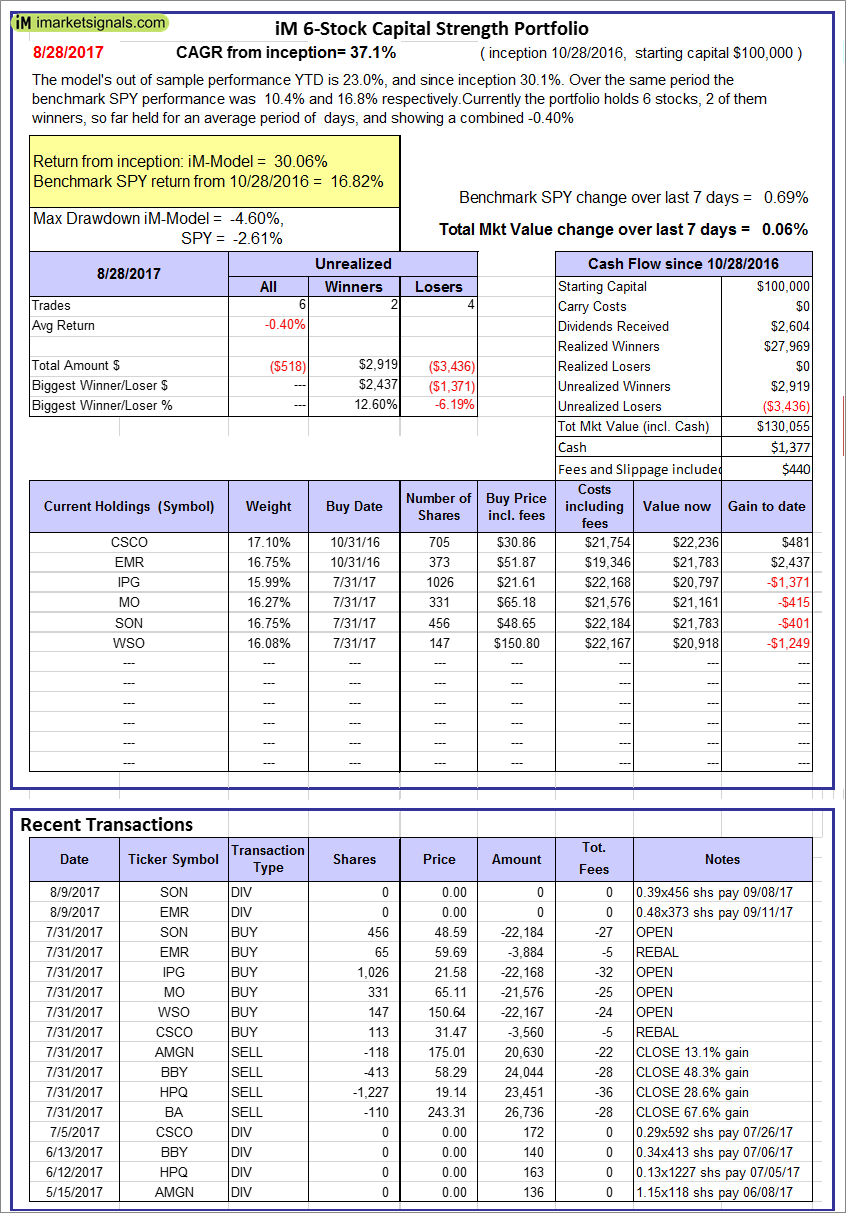 |
iM 6-Stock Capital Strength Portfolio: The model’s out of sample performance YTD is 23.0%, and since inception 30.1%. Over the same period the benchmark SPY performance was 10.4% and 16.8% respectively. Over the previous week the market value of the iM 6-Stock Capital Strength Portfolio gained 0.06% at a time when SPY gained 0.69%. A starting capital of $100,000 at inception on 10/28/2016 would have grown to $130,055 which includes $1,377 cash and excludes $440 spent on fees and slippage. |
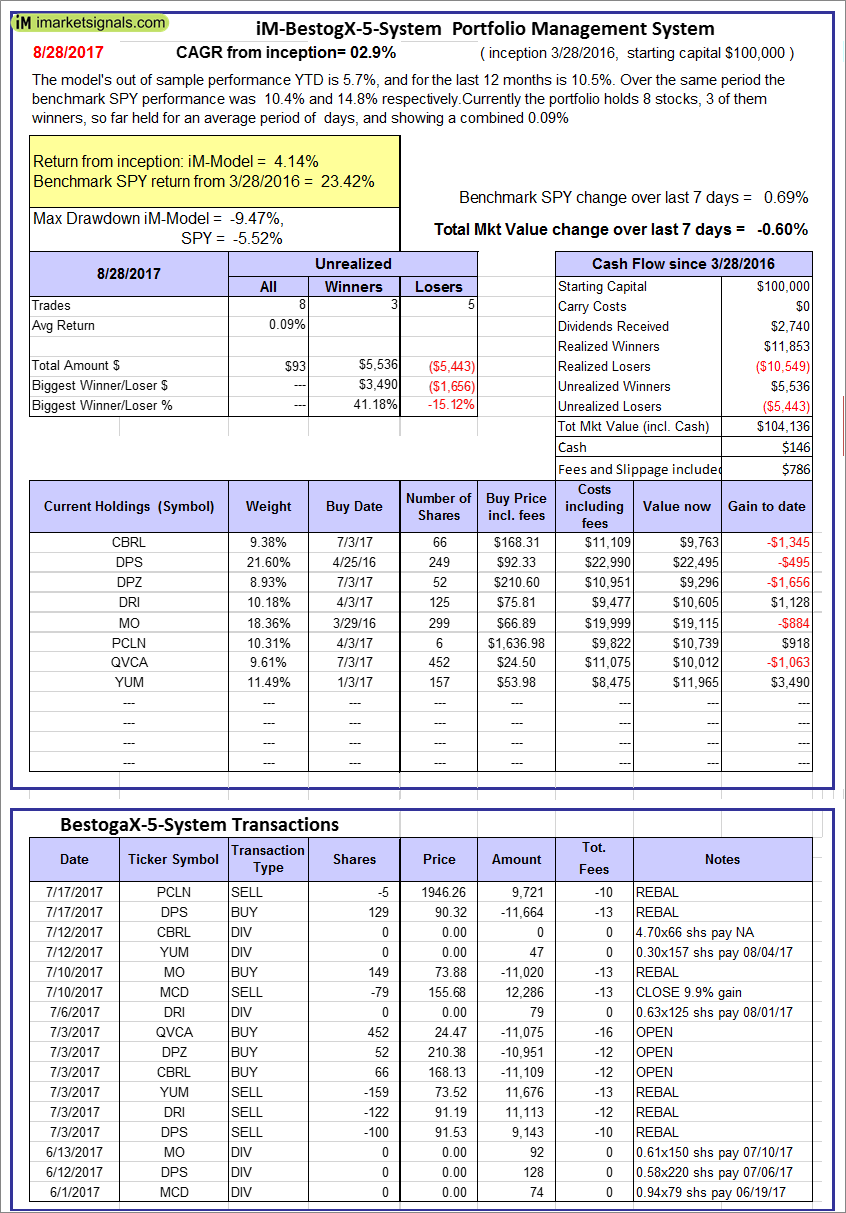 |
iM-BestogaX5-System: The model’s out of sample performance YTD is 5.7%, and for the last 12 months is 10.5%. Over the same period the benchmark SPY performance was 10.4% and 14.8% respectively. Over the previous week the market value of iM-Best8(S&P 500)Tax-Eff. gained -0.60% at a time when SPY gained 0.69%. A starting capital of $100,000 at inception on 3/28/2016 would have grown to $104,136 which includes $146 cash and excludes $786 spent on fees and slippage. |
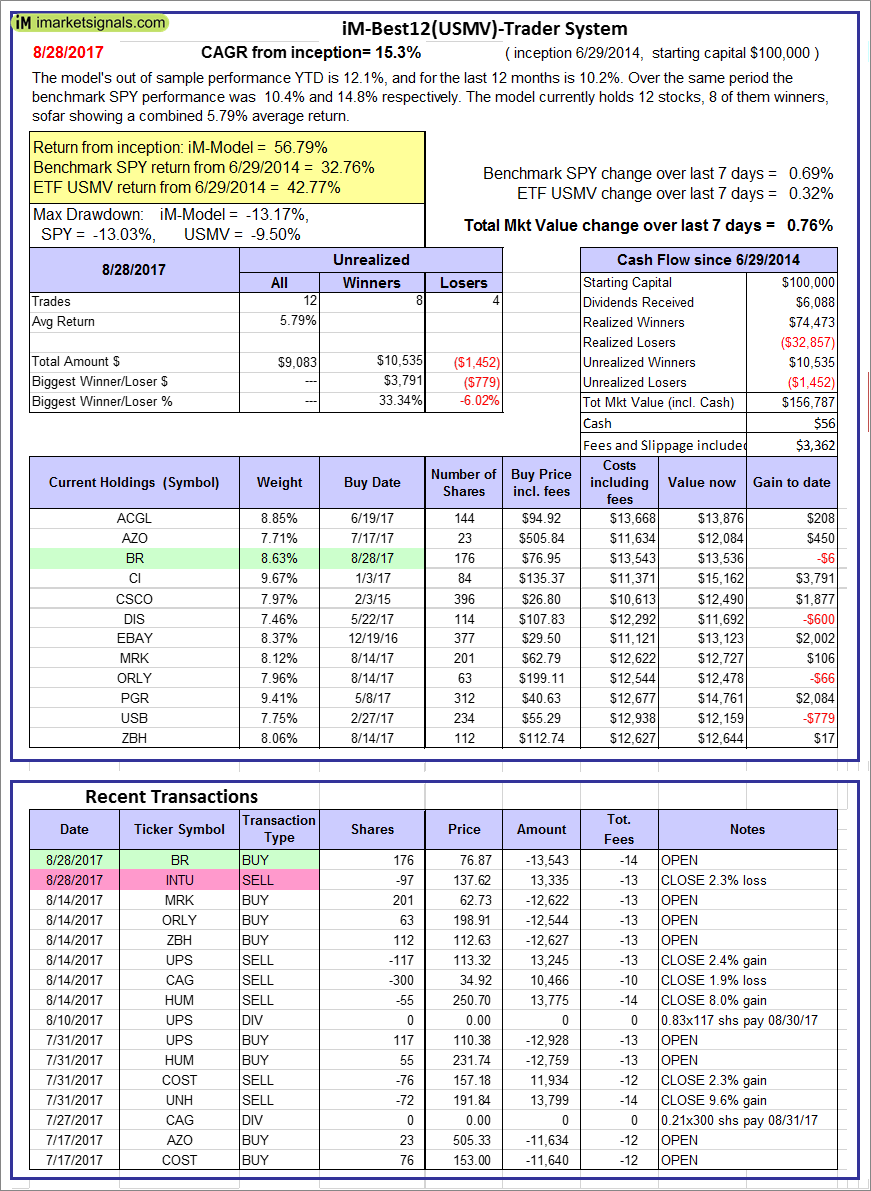 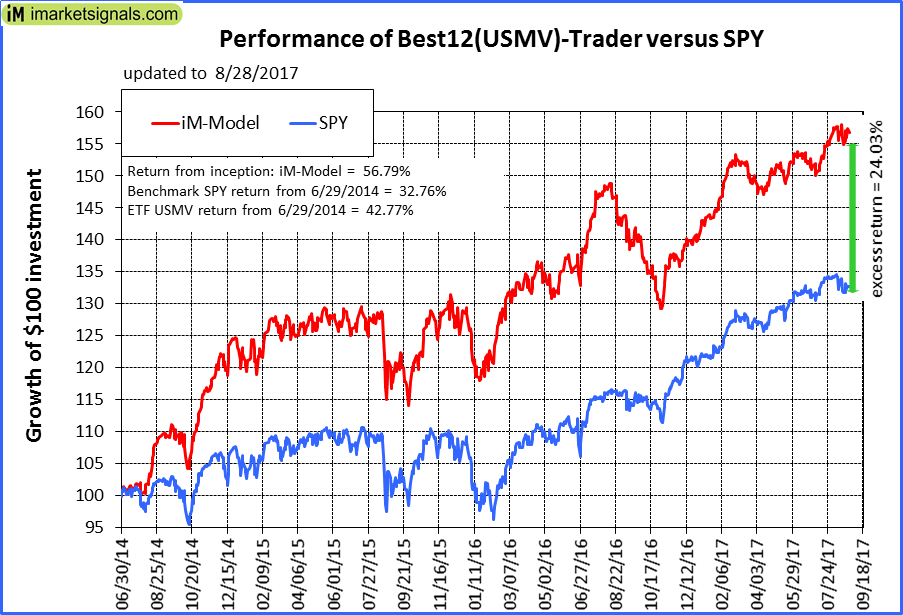 |
iM-Best12(USMV)-Trader: The model’s out of sample performance YTD is 12.1%, and for the last 12 months is 10.2%. Over the same period the benchmark SPY performance was 10.4% and 14.8% respectively. Since inception, on 6/30/2014, the model gained 56.79% while the benchmark SPY gained 32.76% and the ETF USMV gained 42.77% over the same period. Over the previous week the market value of iM-Best12(USMV)-Trader gained 0.76% at a time when SPY gained 0.69%. A starting capital of $100,000 at inception on 6/30/2014 would have grown to $156,787 which includes $56 cash and excludes $3,362 spent on fees and slippage. |
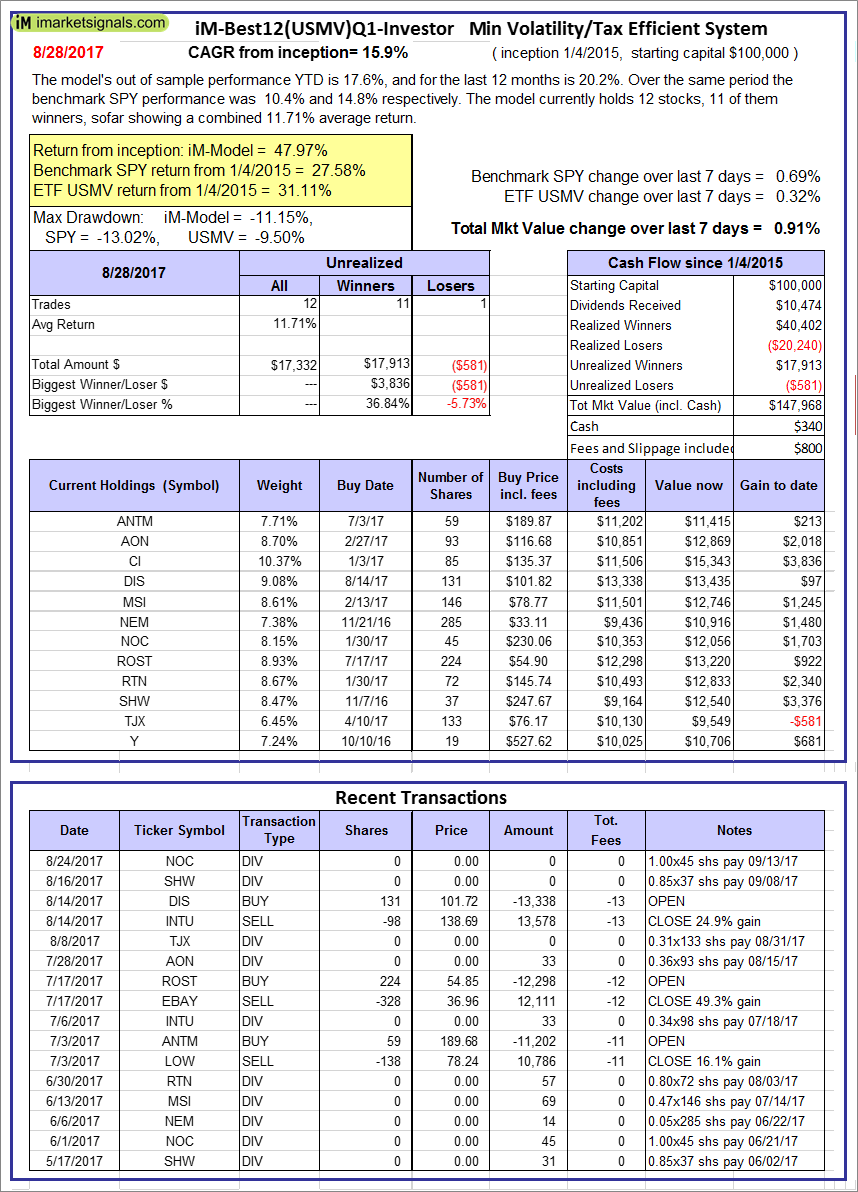 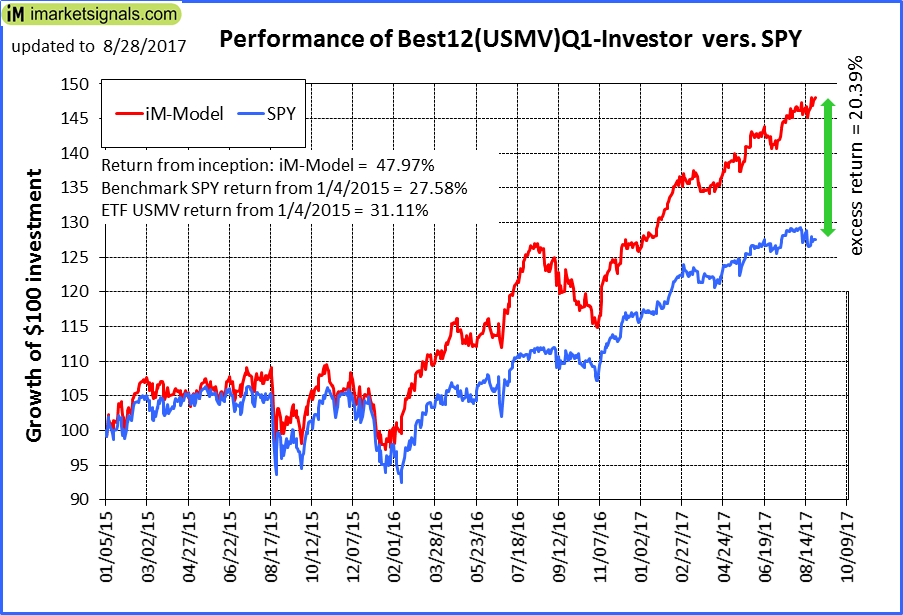 |
iM-Best12(USMV)Q1-Investor: The model’s out of sample performance YTD is 17.6%, and for the last 12 months is 20.2%. Over the same period the benchmark SPY performance was 10.4% and 14.8% respectively. Since inception, on 1/5/2015, the model gained 47.97% while the benchmark SPY gained 27.58% and the ETF USMV gained 31.11% over the same period. Over the previous week the market value of iM-Best12(USMV)Q1 gained 0.91% at a time when SPY gained 0.69%. A starting capital of $100,000 at inception on 1/5/2015 would have grown to $147,968 which includes $340 cash and excludes $800 spent on fees and slippage. |
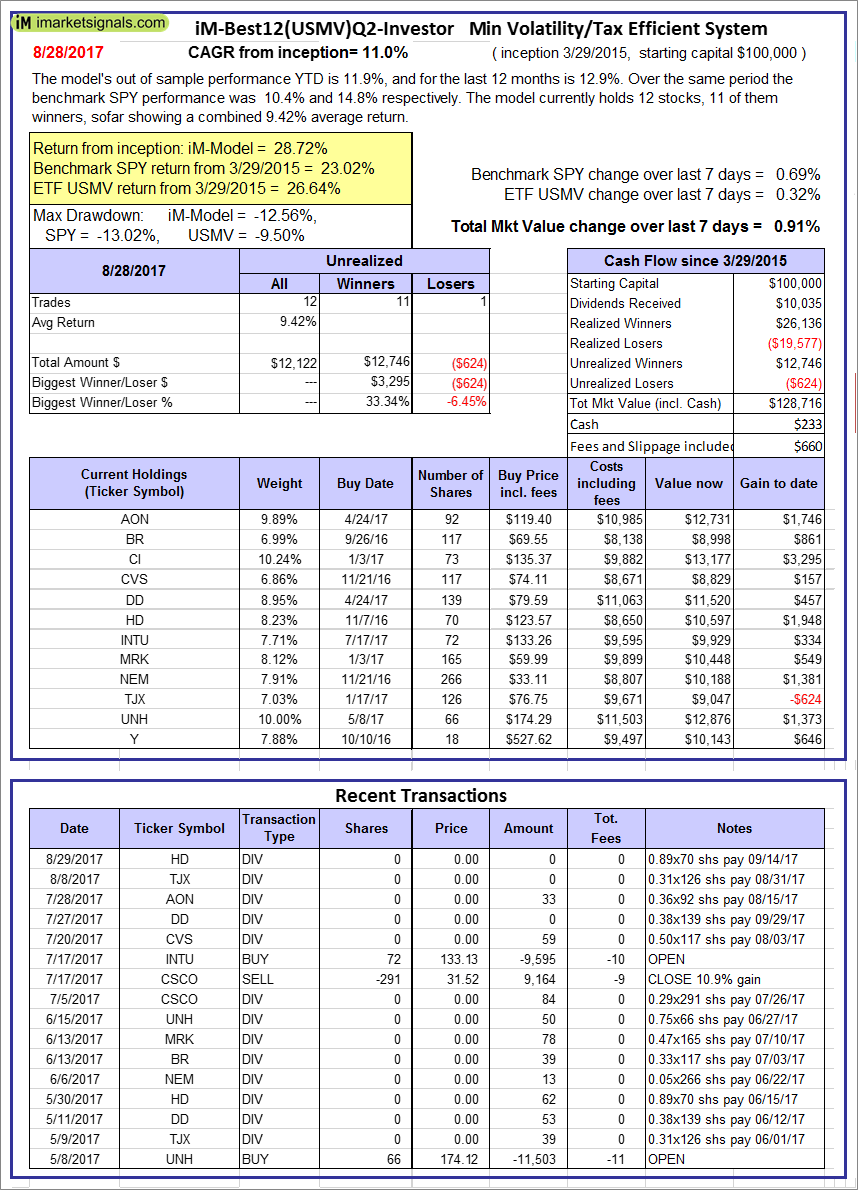  |
iM-Best12(USMV)Q2-Investor: The model’s out of sample performance YTD is 11.9%, and for the last 12 months is 12.9%. Over the same period the benchmark SPY performance was 10.4% and 14.8% respectively. Since inception, on 3/30/2015, the model gained 28.72% while the benchmark SPY gained 23.02% and the ETF USMV gained 26.64% over the same period. Over the previous week the market value of iM-Best12(USMV)Q2 gained 0.91% at a time when SPY gained 0.69%. A starting capital of $100,000 at inception on 3/30/2015 would have grown to $128,716 which includes $233 cash and excludes $660 spent on fees and slippage. |
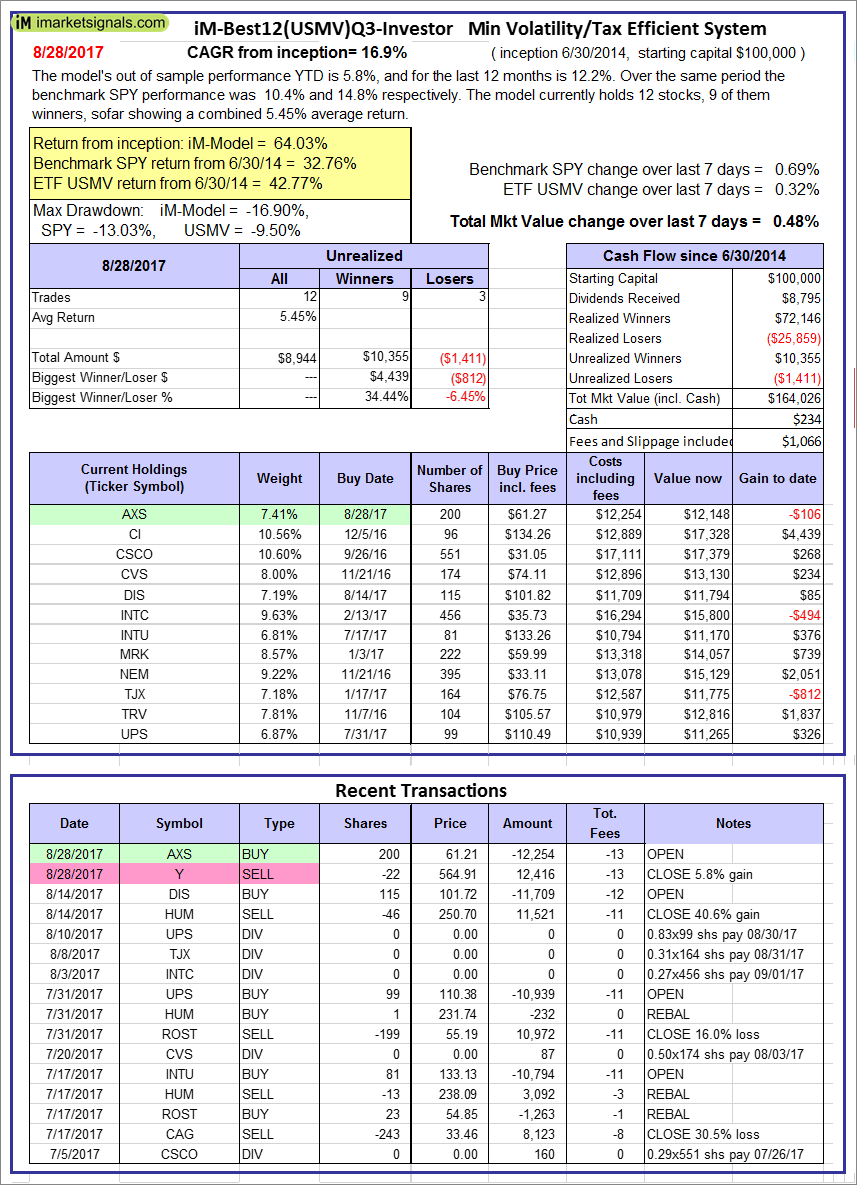 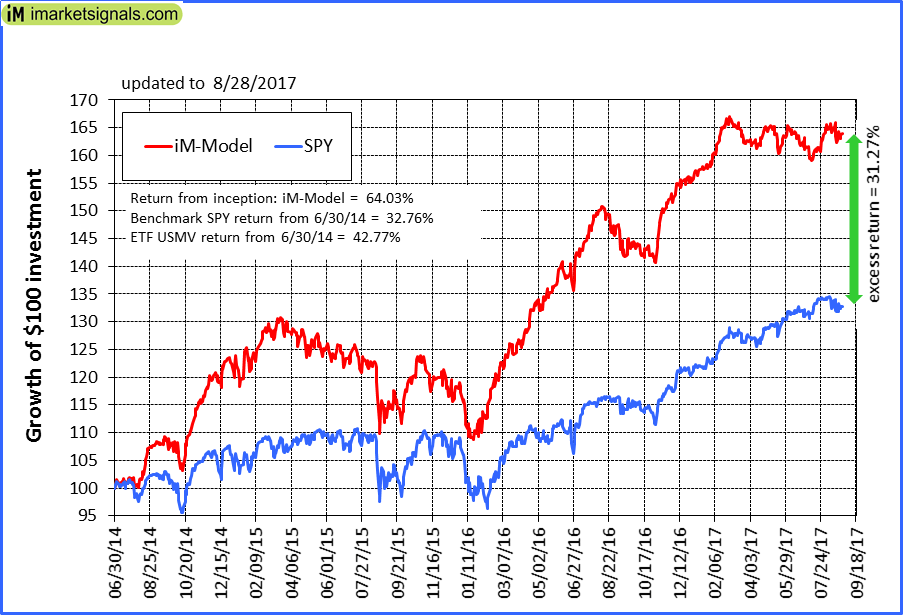 |
iM-Best12(USMV)Q3-Investor: The model’s out of sample performance YTD is 5.8%, and for the last 12 months is 12.2%. Over the same period the benchmark SPY performance was 10.4% and 14.8% respectively. Since inception, on 7/1/2014, the model gained 64.03% while the benchmark SPY gained 32.76% and the ETF USMV gained 42.77% over the same period. Over the previous week the market value of iM-Best12(USMV)Q3 gained 0.48% at a time when SPY gained 0.69%. A starting capital of $100,000 at inception on 7/1/2014 would have grown to $164,026 which includes $234 cash and excludes $1,066 spent on fees and slippage. |
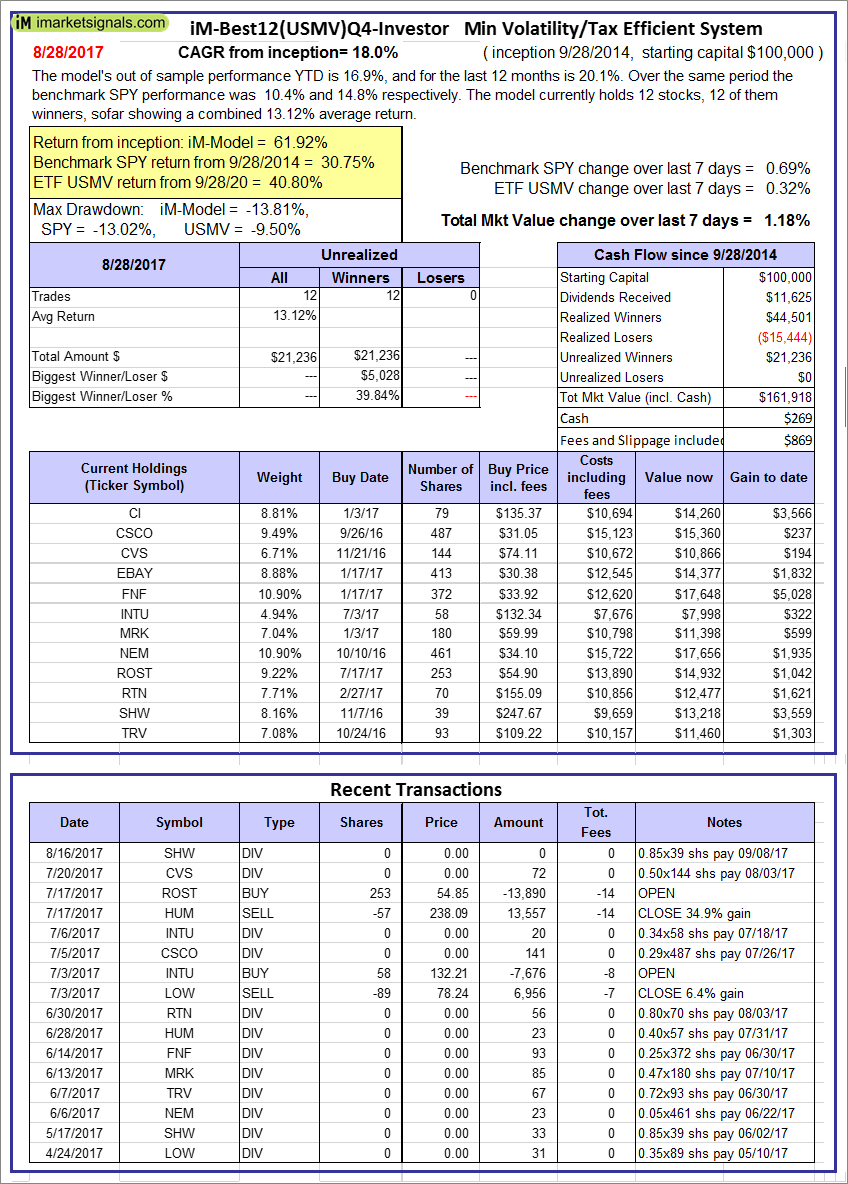  |
iM-Best12(USMV)Q4-Investor: Since inception, on 9/29/2014, the model gained 61.92% while the benchmark SPY gained 30.75% and the ETF USMV gained 40.80% over the same period. Over the previous week the market value of iM-Best12(USMV)Q4 gained 1.18% at a time when SPY gained 0.69%. A starting capital of $100,000 at inception on 9/29/2014 would have grown to $161,918 which includes $269 cash and excludes $869 spent on fees and slippage. |
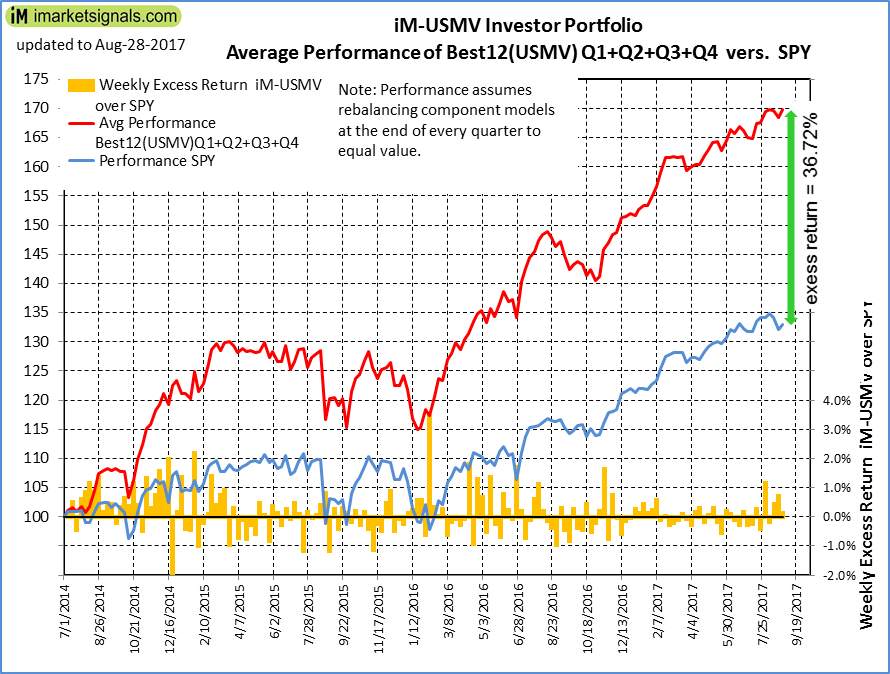 |
Average Performance of iM-Best12(USMV)Q1+Q2+Q3+Q4-Investor resulted in an excess return of 36.72% over SPY. (see iM-USMV Investor Portfolio) |
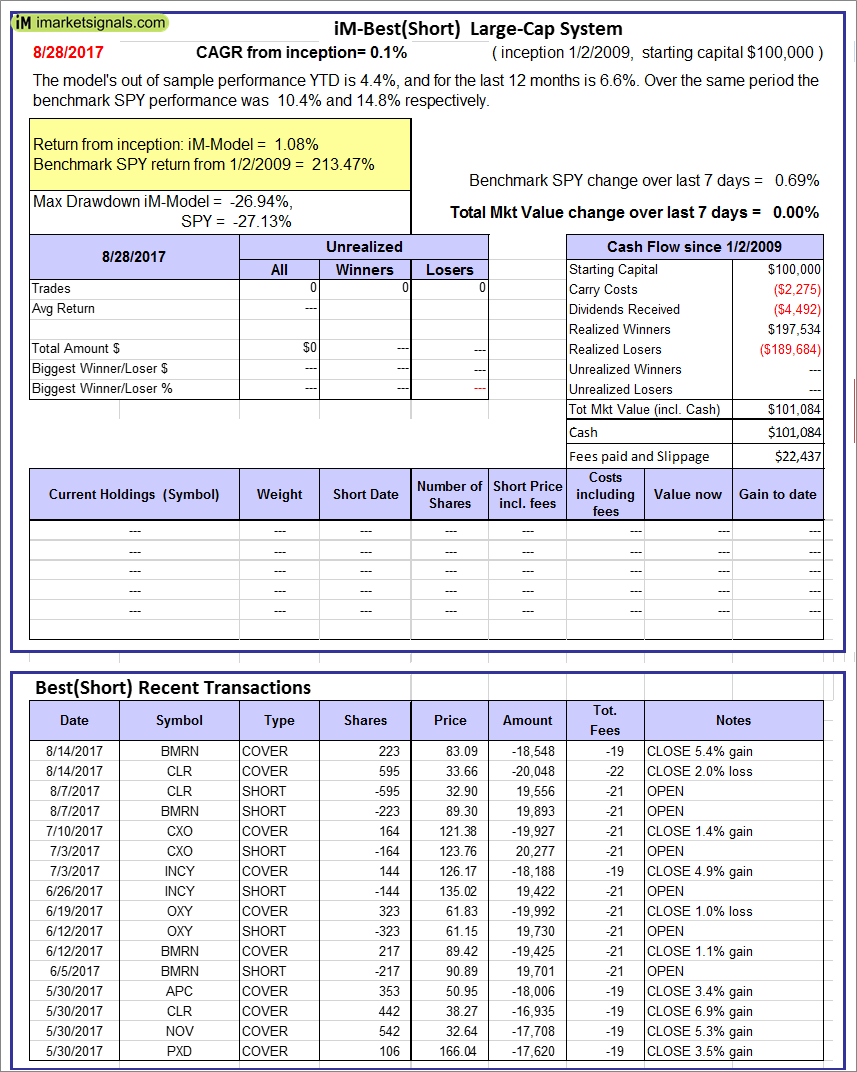 |
iM-Best(Short): The model’s out of sample performance YTD is 4.4%, and for the last 12 months is 6.6%. Over the same period the benchmark SPY performance was 10.4% and 14.8% respectively. Over the previous week the market value of iM-Best(Short) gained 0.00% at a time when SPY gained 0.69%. Over the period 1/2/2009 to 8/28/2017 the starting capital of $100,000 would have grown to $101,084 which includes $101,084 cash and excludes $22,437 spent on fees and slippage. |
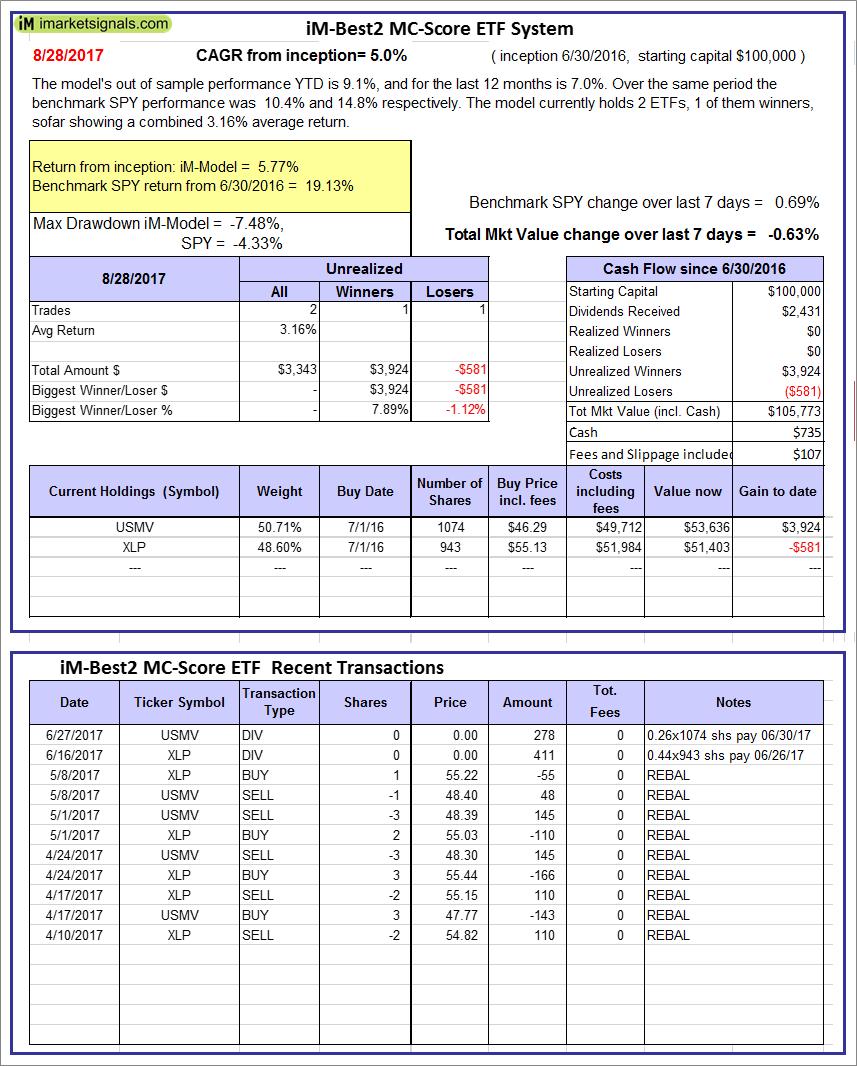 |
iM-Best2 MC-Score ETF System: The model’s out of sample performance YTD is 9.1%, and for the last 12 months is 7.0%. Over the same period the benchmark SPY performance was 10.4% and 14.8% respectively. Over the previous week the market value of the iM-Best2 MC-Score ETF System gained -0.63% at a time when SPY gained 0.69%. A starting capital of $100,000 at inception on 6/30/2016 would have grown to $105,773 which includes $735 cash and excludes $107 spent on fees and slippage. |
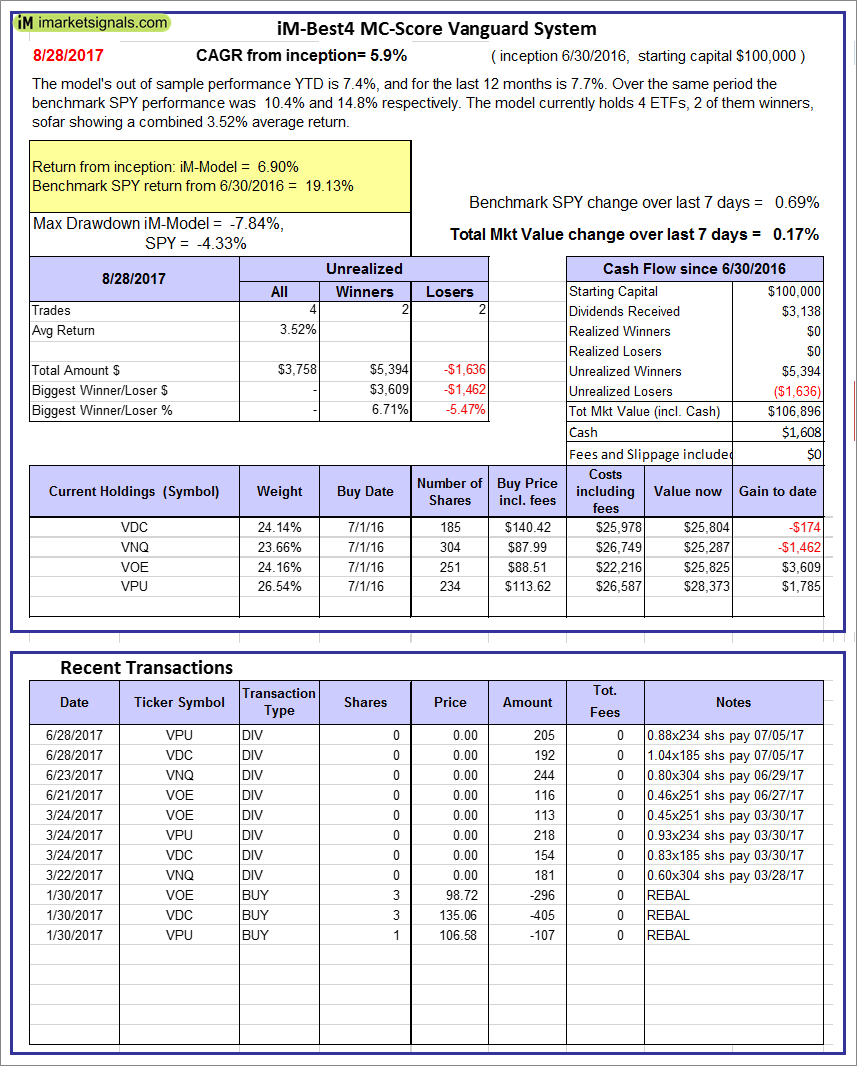 |
iM-Best4 MC-Score Vanguard System: The model’s out of sample performance YTD is 7.4%, and for the last 12 months is 7.7%. Over the same period the benchmark SPY performance was 10.4% and 14.8% respectively. Over the previous week the market value of the iM-Best4 MC-Score Vanguard System gained 0.17% at a time when SPY gained 0.69%. A starting capital of $100,000 at inception on 6/30/2016 would have grown to $106,896 which includes $1,608 cash and excludes $00 spent on fees and slippage. |
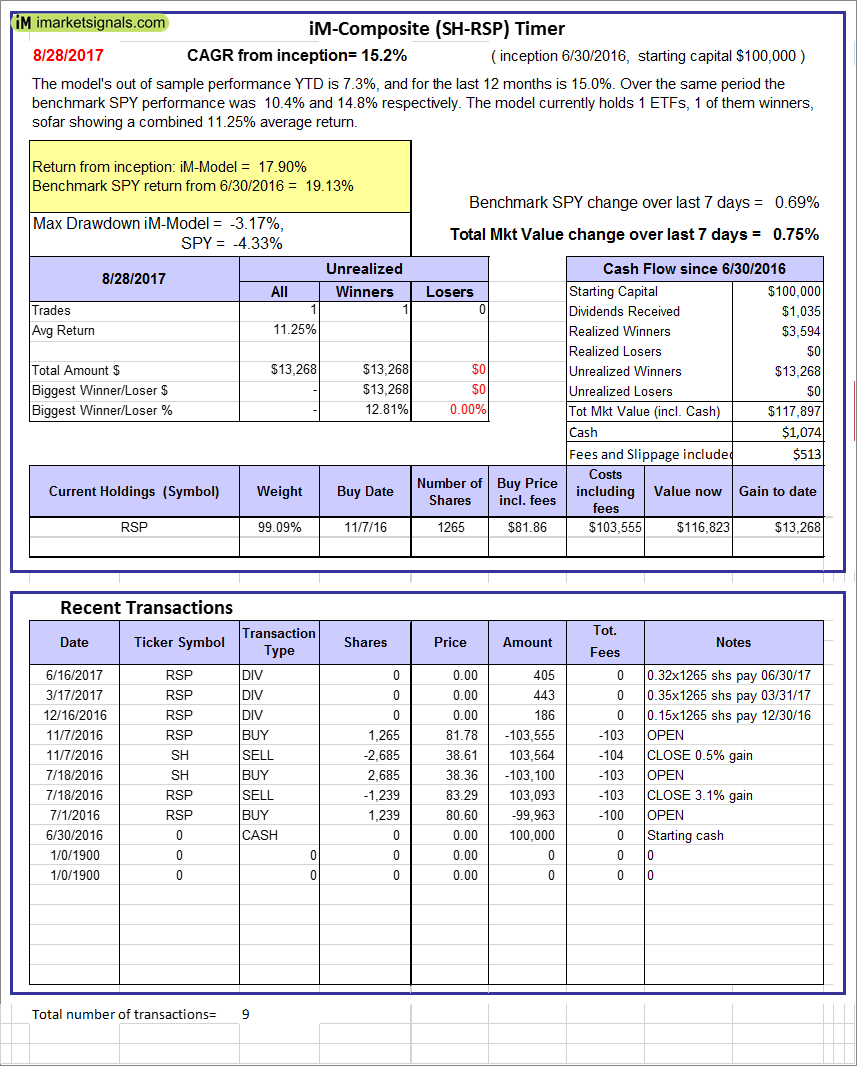 |
iM-Composite (SH-RSP) Timer: The model’s out of sample performance YTD is 7.3%, and for the last 12 months is 15.0%. Over the same period the benchmark SPY performance was 10.4% and 14.8% respectively. Over the previous week the market value of the iM-Composite (SH-RSP) Timer gained 0.75% at a time when SPY gained 0.69%. A starting capital of $100,000 at inception on 6/30/2016 would have grown to $117,897 which includes $1,074 cash and excludes $513 spent on fees and slippage. |
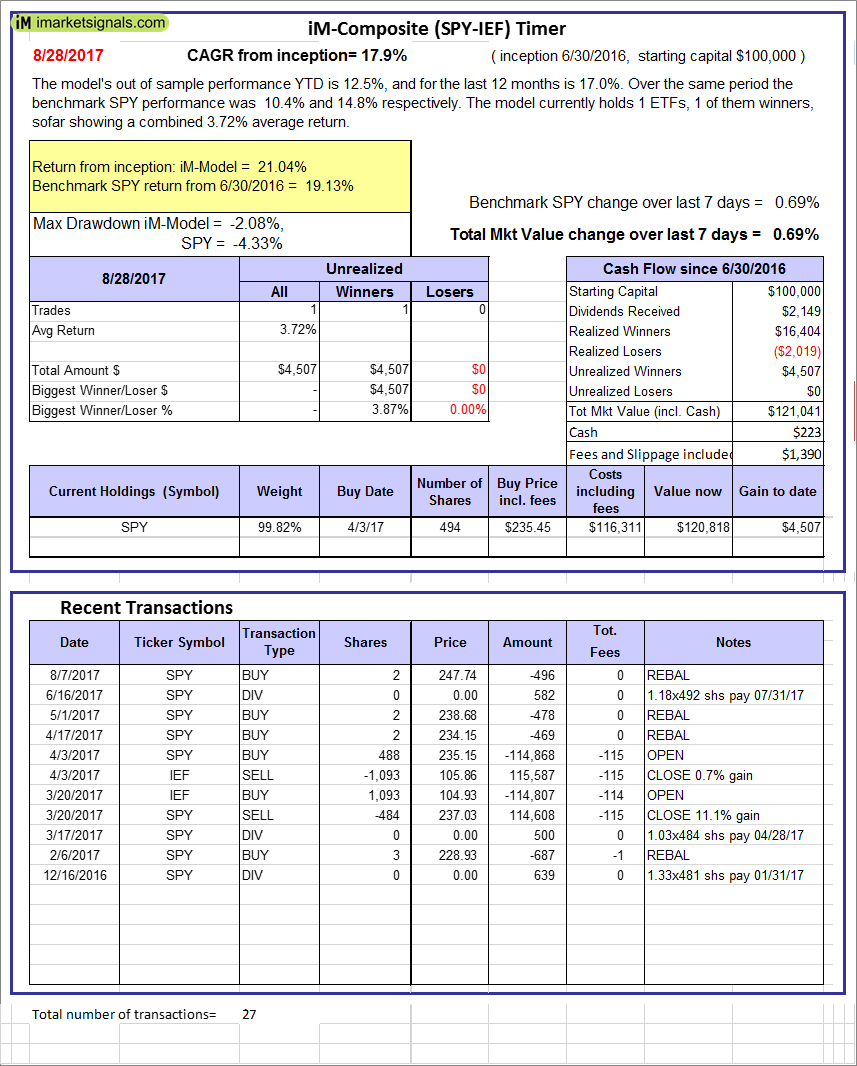 |
iM-Composite (SPY-IEF) Timer: The model’s out of sample performance YTD is 12.5%, and for the last 12 months is 17.0%. Over the same period the benchmark SPY performance was 10.4% and 14.8% respectively. Over the previous week the market value of the iM-Composite (SPY-IEF) Timer gained 0.69% at a time when SPY gained 0.69%. A starting capital of $100,000 at inception on 6/30/2016 would have grown to $121,041 which includes $223 cash and excludes $1,390 spent on fees and slippage. |
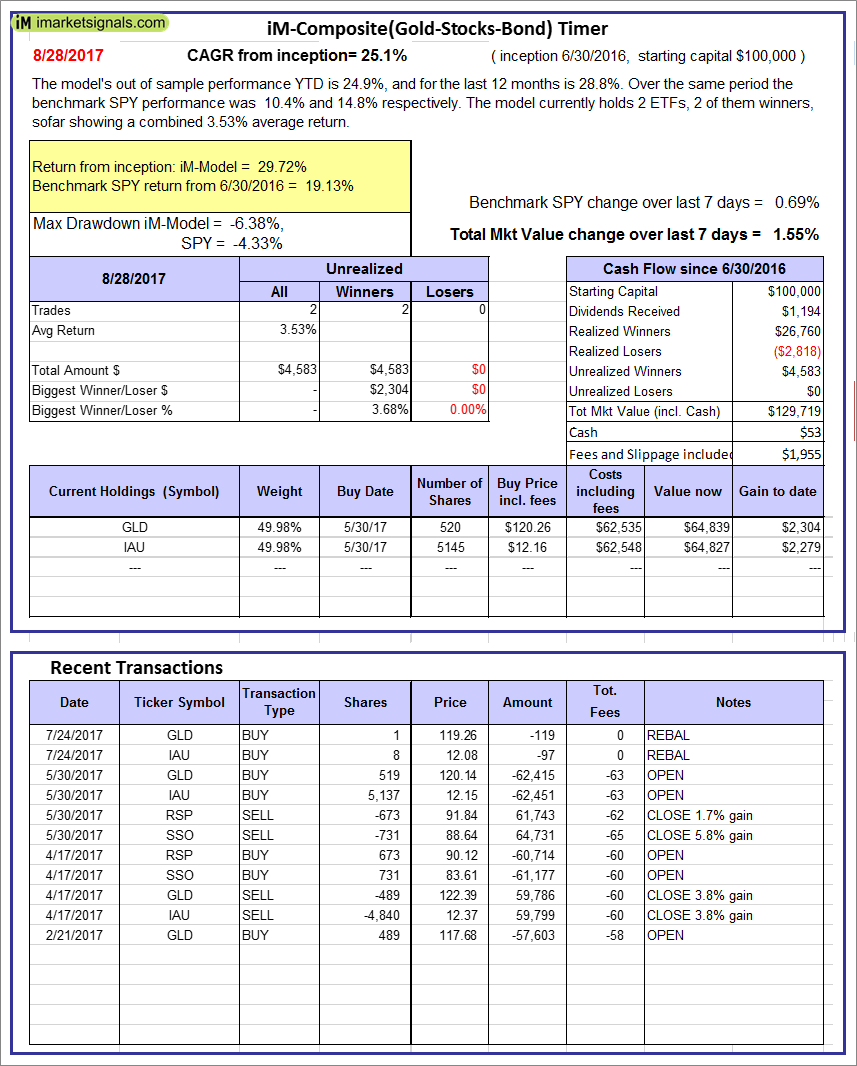 |
iM-Composite(Gold-Stocks-Bond) Timer: The model’s out of sample performance YTD is 24.9%, and for the last 12 months is 28.8%. Over the same period the benchmark SPY performance was 10.4% and 14.8% respectively. Over the previous week the market value of the iM-Composite(Gold-Stocks-Bond) Timer gained 1.55% at a time when SPY gained 0.69%. A starting capital of $100,000 at inception on 6/30/2016 would have grown to $129,719 which includes $53 cash and excludes $1,955 spent on fees and slippage. |
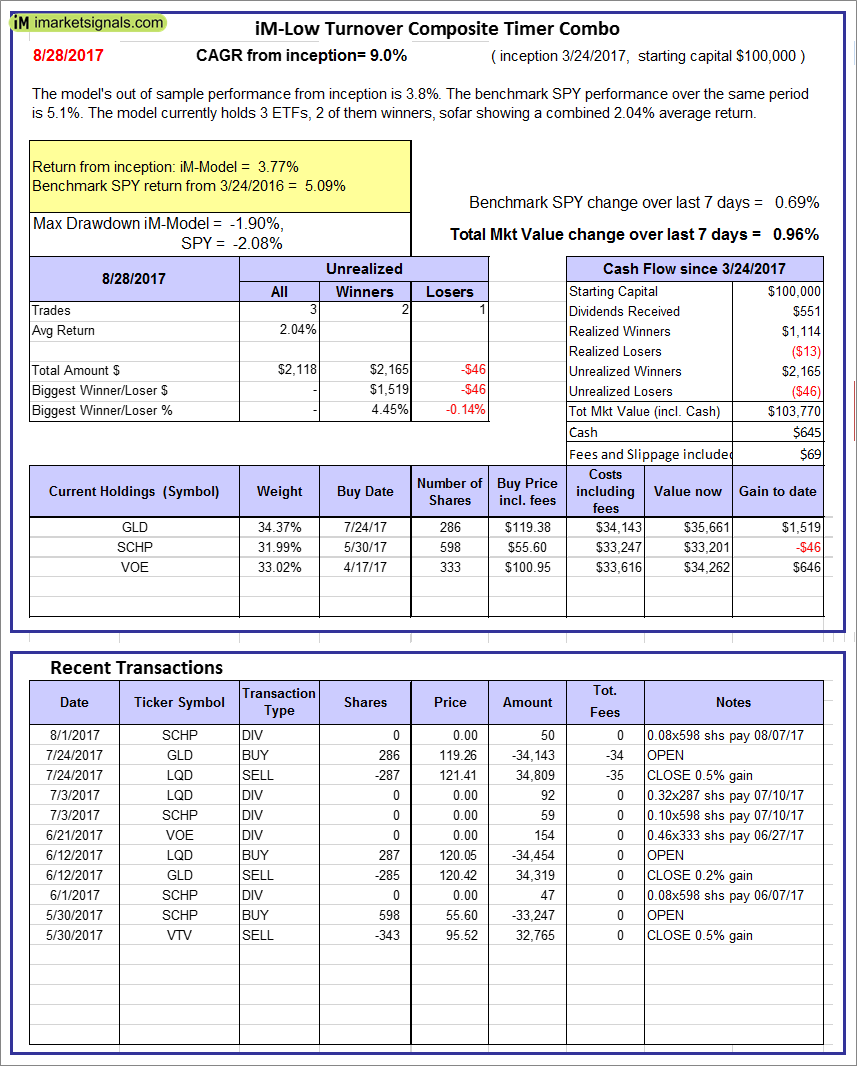 |
iM-Low Turnover Composite Timer Combo: The model’s out of sample performance from inception is 3.8%. The benchmark SPY performance over the same period is 5.1%. Over the previous week the market value of the iM-Low Turnover Composite Timer Combo gained 0.96% at a time when SPY gained 0.69%. A starting capital of $100,000 at inception on 3/24/27 would have grown to $103,770 which includes $645 cash and excludes $69 spent on fees and slippage. |
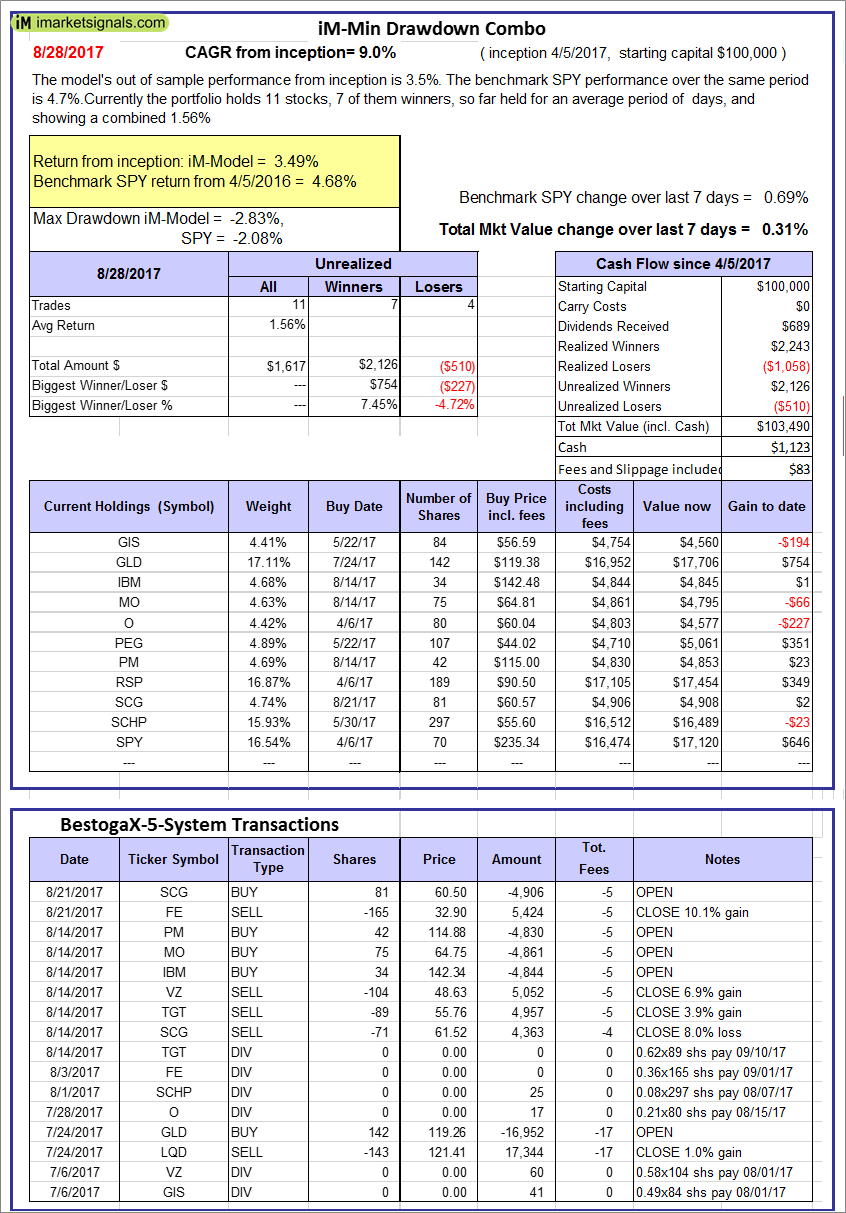 |
iM-Min Drawdown Combo: The model’s out of sample performance from inception is 3.5%. The benchmark SPY performance over the same period is 4.7%. Over the previous week the market value of the iM-Min Drawdown Combo gained 0.31% at a time when SPY gained 0.69%. A starting capital of $100,000 at inception on 4/5/2017 would have grown to $103,490 which includes $1,123 cash and excludes $83 spent on fees and slippage. |
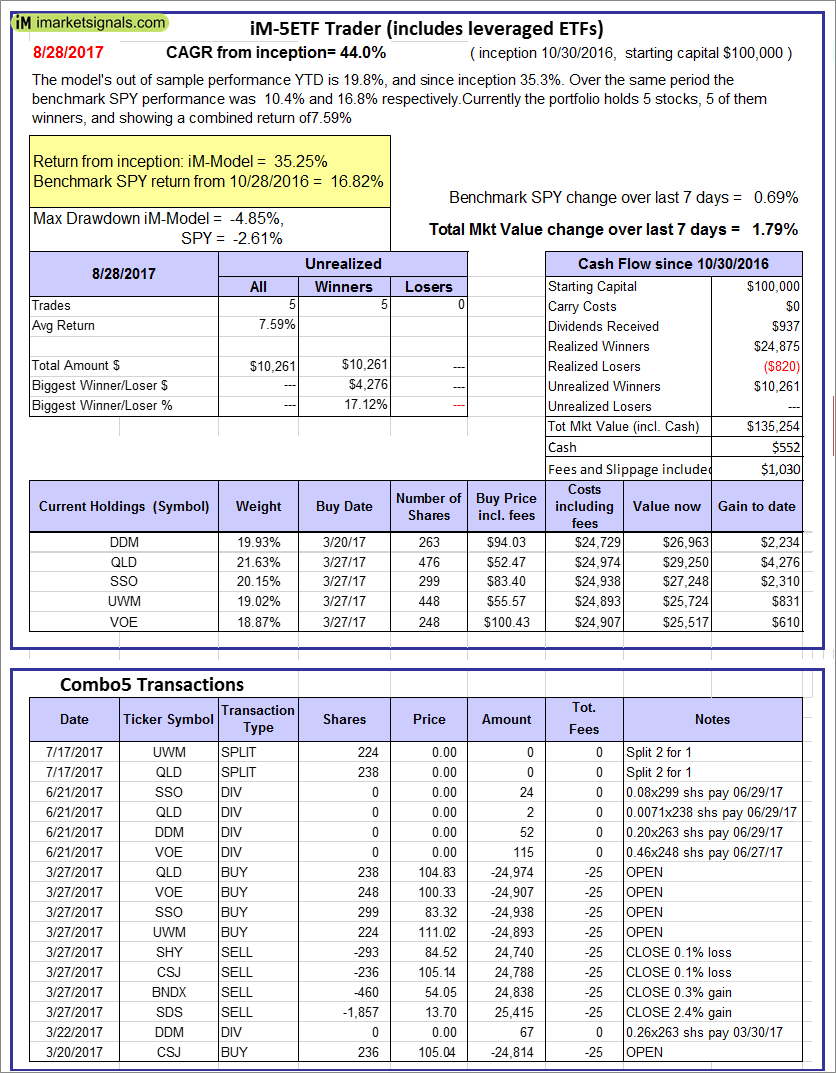 |
iM-5ETF Trader (includes leveraged ETFs): The model’s out of sample performance YTD is 10.7%, and since inception 13.8%. Over the same period the benchmark SPY performance was 10.4% and 16.8% respectively. Over the previous week the market value of the iM-5ETF Trader (includes leveraged ETFs) gained 1.79% at a time when SPY gained 0.69%. A starting capital of $100,000 at inception on 10/30/2016 would have grown to $135,254 which includes $552 cash and excludes $1,030 spent on fees and slippage. |
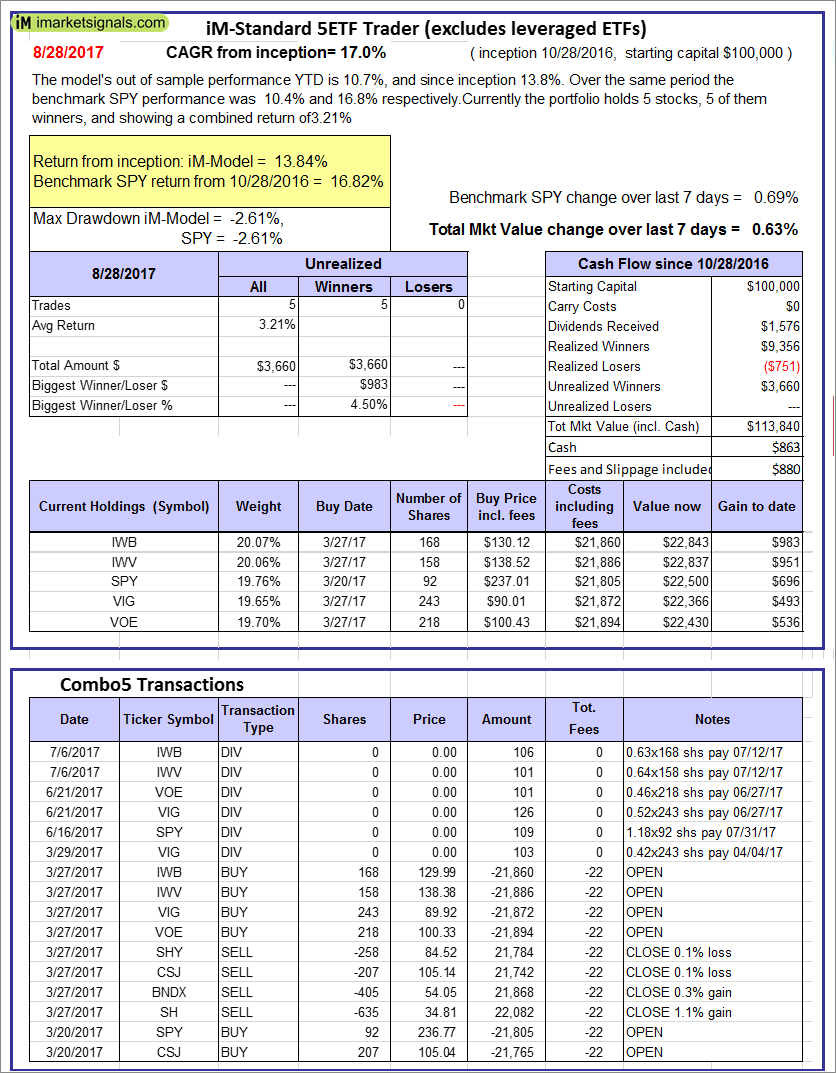 |
iM-Standard 5ETF Trader (excludes leveraged ETFs): The model’s out of sample performance YTD is 10.7%, and since inception 13.8%. Over the same period the benchmark SPY performance was 10.4% and 16.8% respectively. Over the previous week the market value of the iM-Standard 5ETF Trader (excludes leveraged ETFs) gained 0.63% at a time when SPY gained 0.69%. A starting capital of $100,000 at inception on 10/30/2016 would have grown to $113,840 which includes $863 cash and excludes $880 spent on fees and slippage. |
Posted in pmp SPY-SH
iM-Best Reports – 8/7/2017
 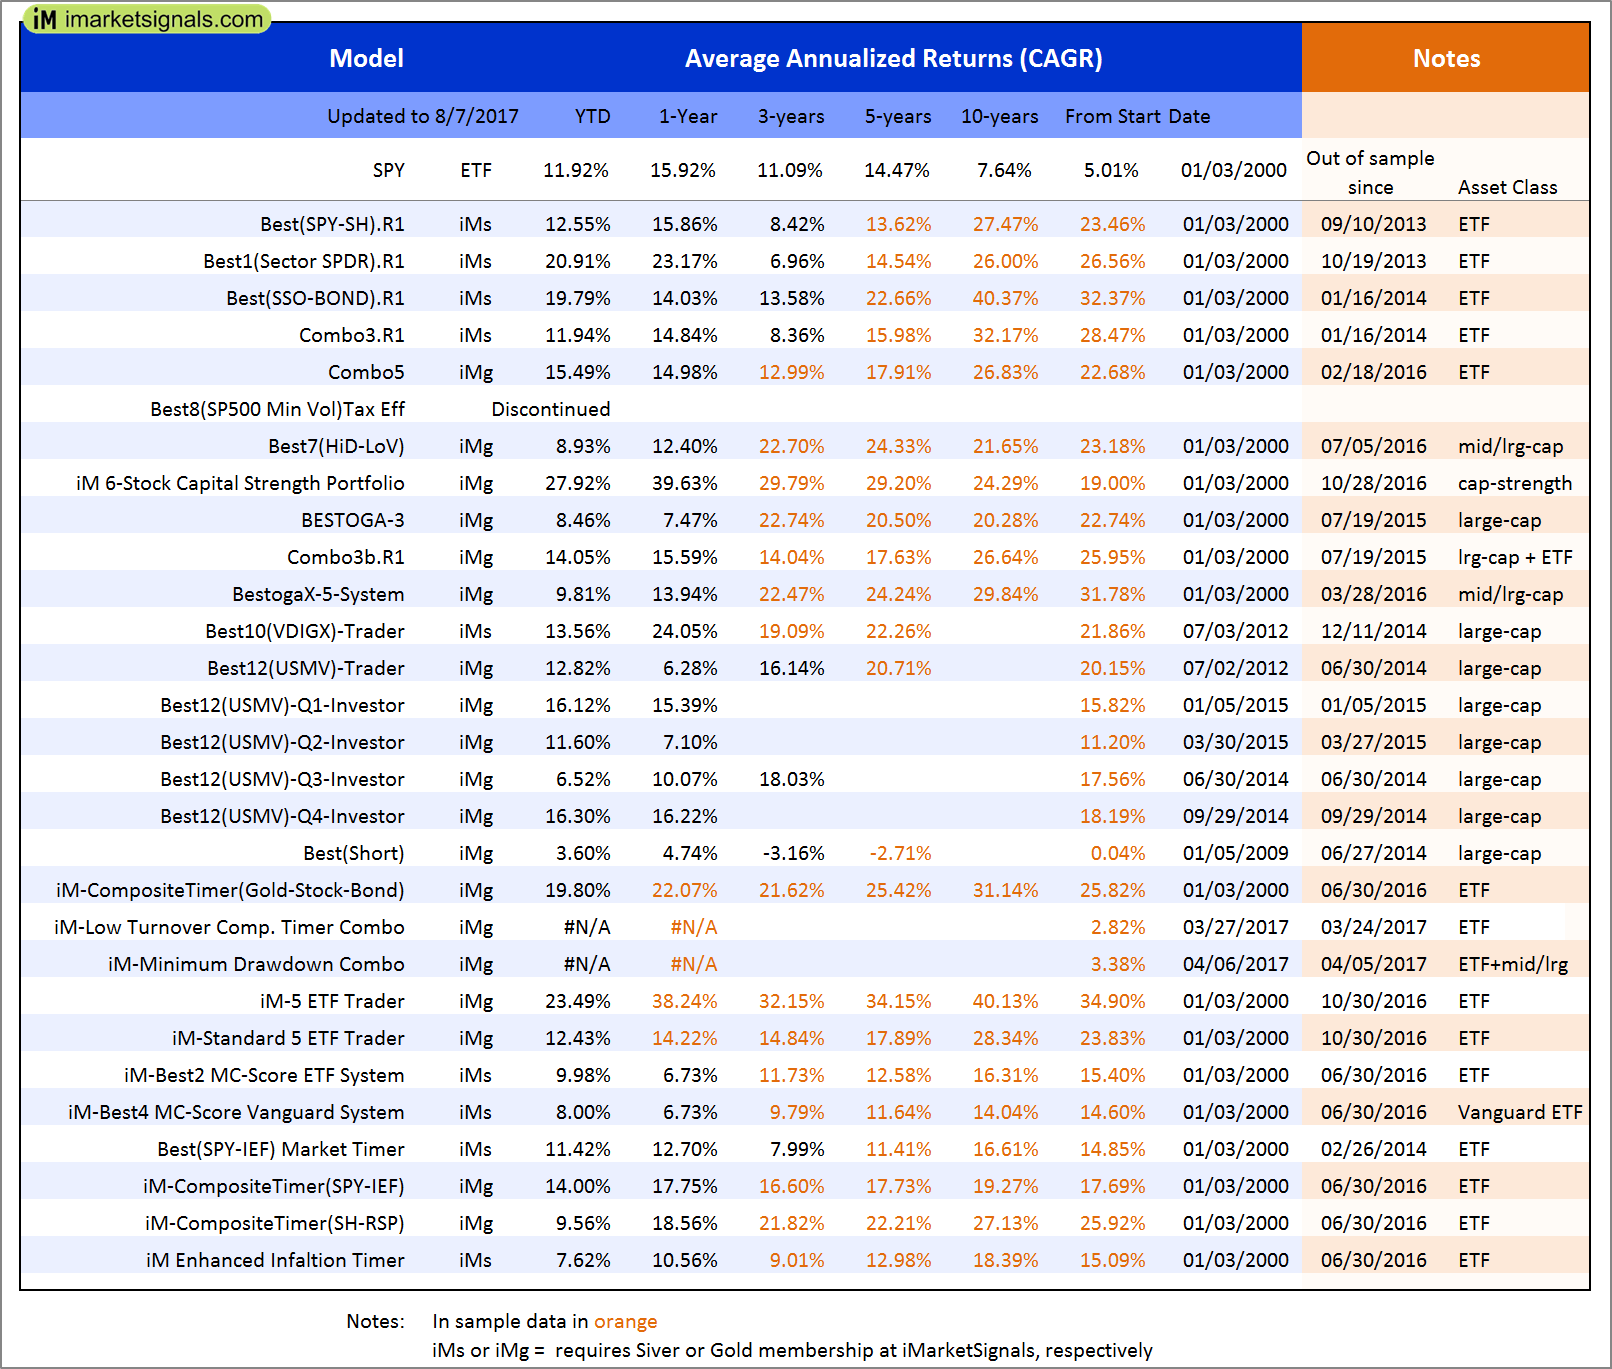 |
Out of sample performance summary of our models for the past 1, 2, 4 and 13 week periods. The active active return indicates how the models over- or underperformed the benchmark ETF SPY. Also the YTD, and the 1-, 3-, 5- and 10-year annualized returns are shown in the second table |
 |
iM-Best(SPY-SH).R1: The model’s out of sample performance YTD is 12.5%, and for the last 12 months is 15.9%. Over the same period the benchmark SPY performance was 11.9% and 15.9% respectively. Over the previous week the market value of Best(SPY-SH) gained 0.44% at a time when SPY gained 0.45%. A starting capital of $100,000 at inception on 1/2/2009 would have grown to $520,223 which includes $4,654 cash and excludes $15,358 spent on fees and slippage. |
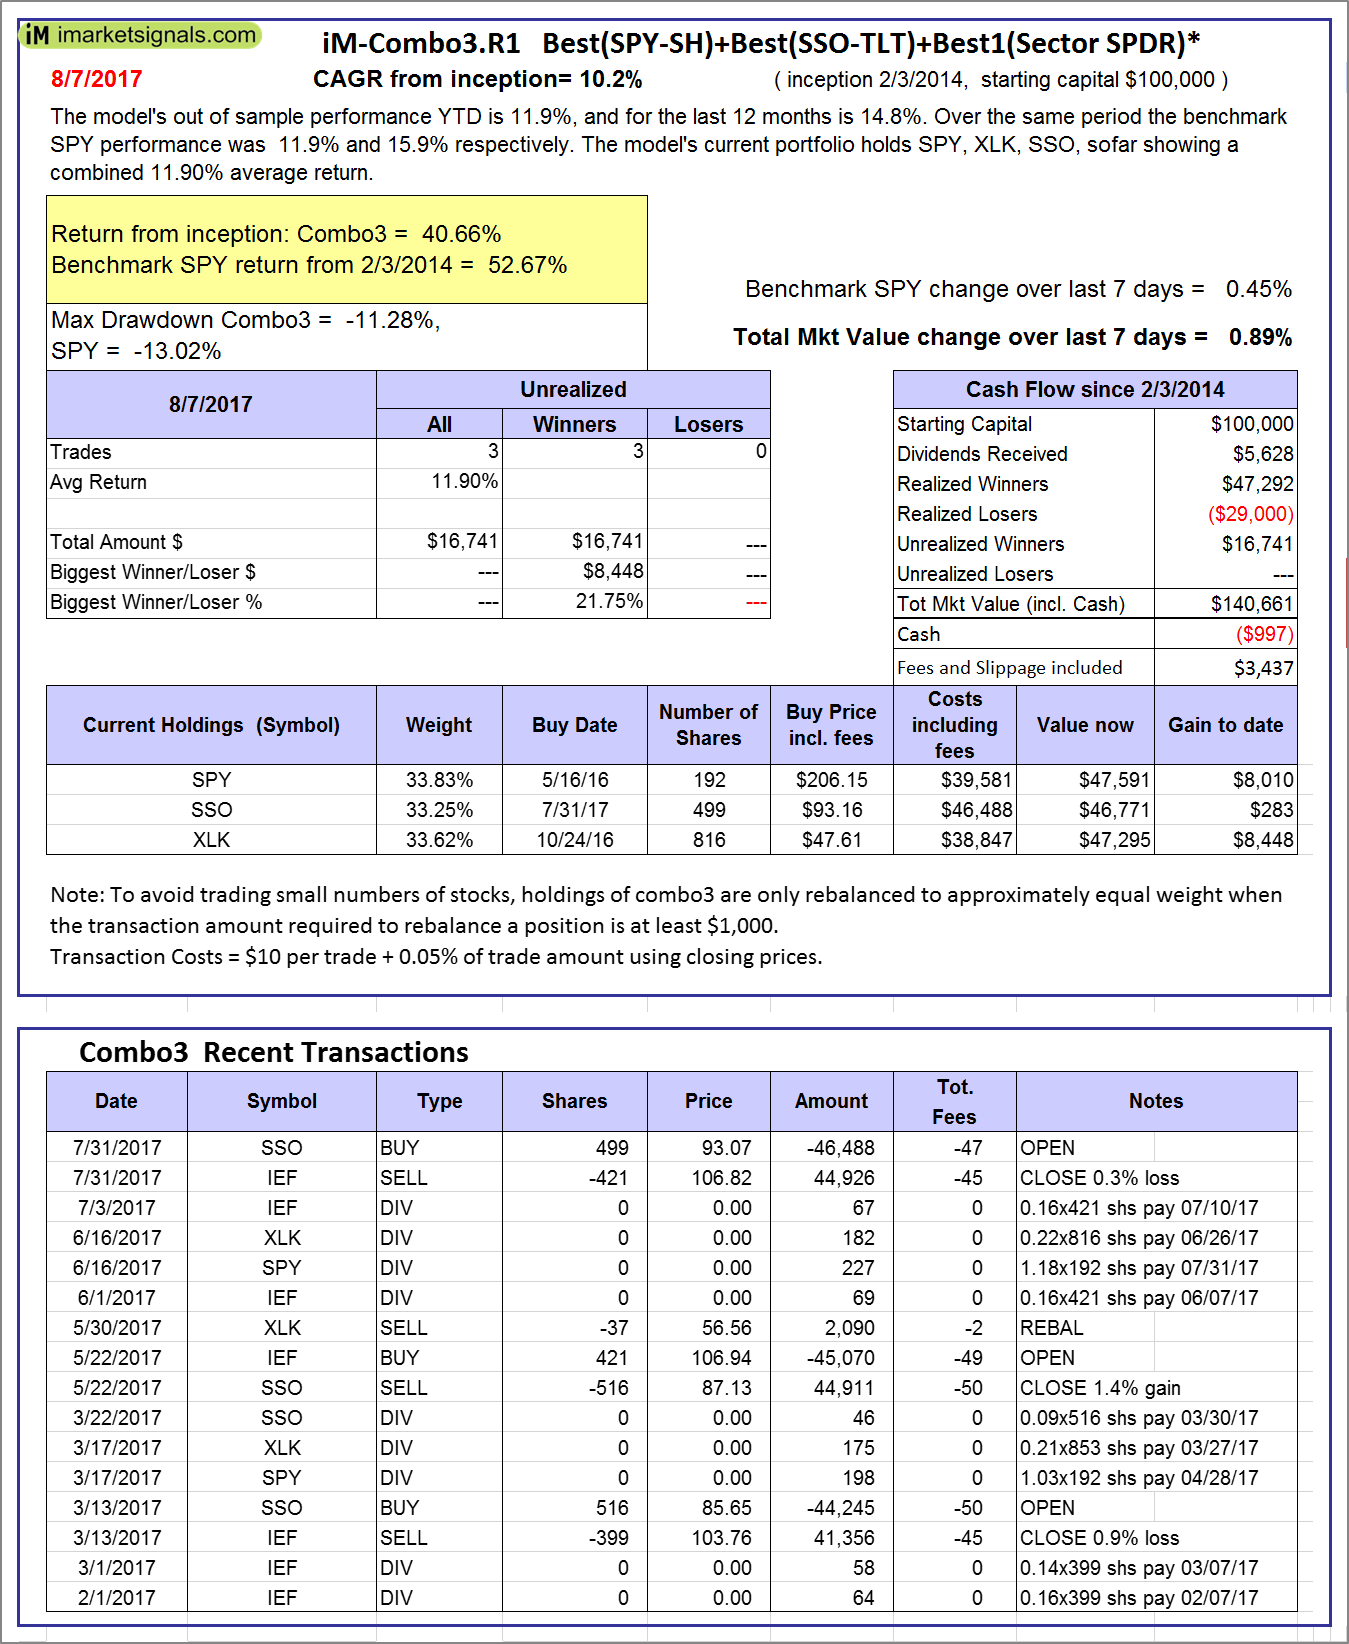 |
iM-Combo3.R1: The model’s out of sample performance YTD is 11.9%, and for the last 12 months is 14.8%. Over the same period the benchmark SPY performance was 11.9% and 15.9% respectively. Over the previous week the market value of iM-Combo3.R1 gained 0.89% at a time when SPY gained 0.45%. A starting capital of $100,000 at inception on 2/3/2014 would have grown to $140,661 which includes -$997 cash and excludes $3,437 spent on fees and slippage. |
 |
iM-Combo5: The model’s out of sample performance YTD is 15.5%, and for the last 12 months is 15.0%. Over the same period the benchmark SPY performance was 11.9% and 15.9% respectively. Over the previous week the market value of iM-Combo5 gained 1.00% at a time when SPY gained 0.45%. A starting capital of $100,000 at inception on 2/22/2016 would have grown to $113,911 which includes -$21 cash and excludes $599 spent on fees and slippage. |
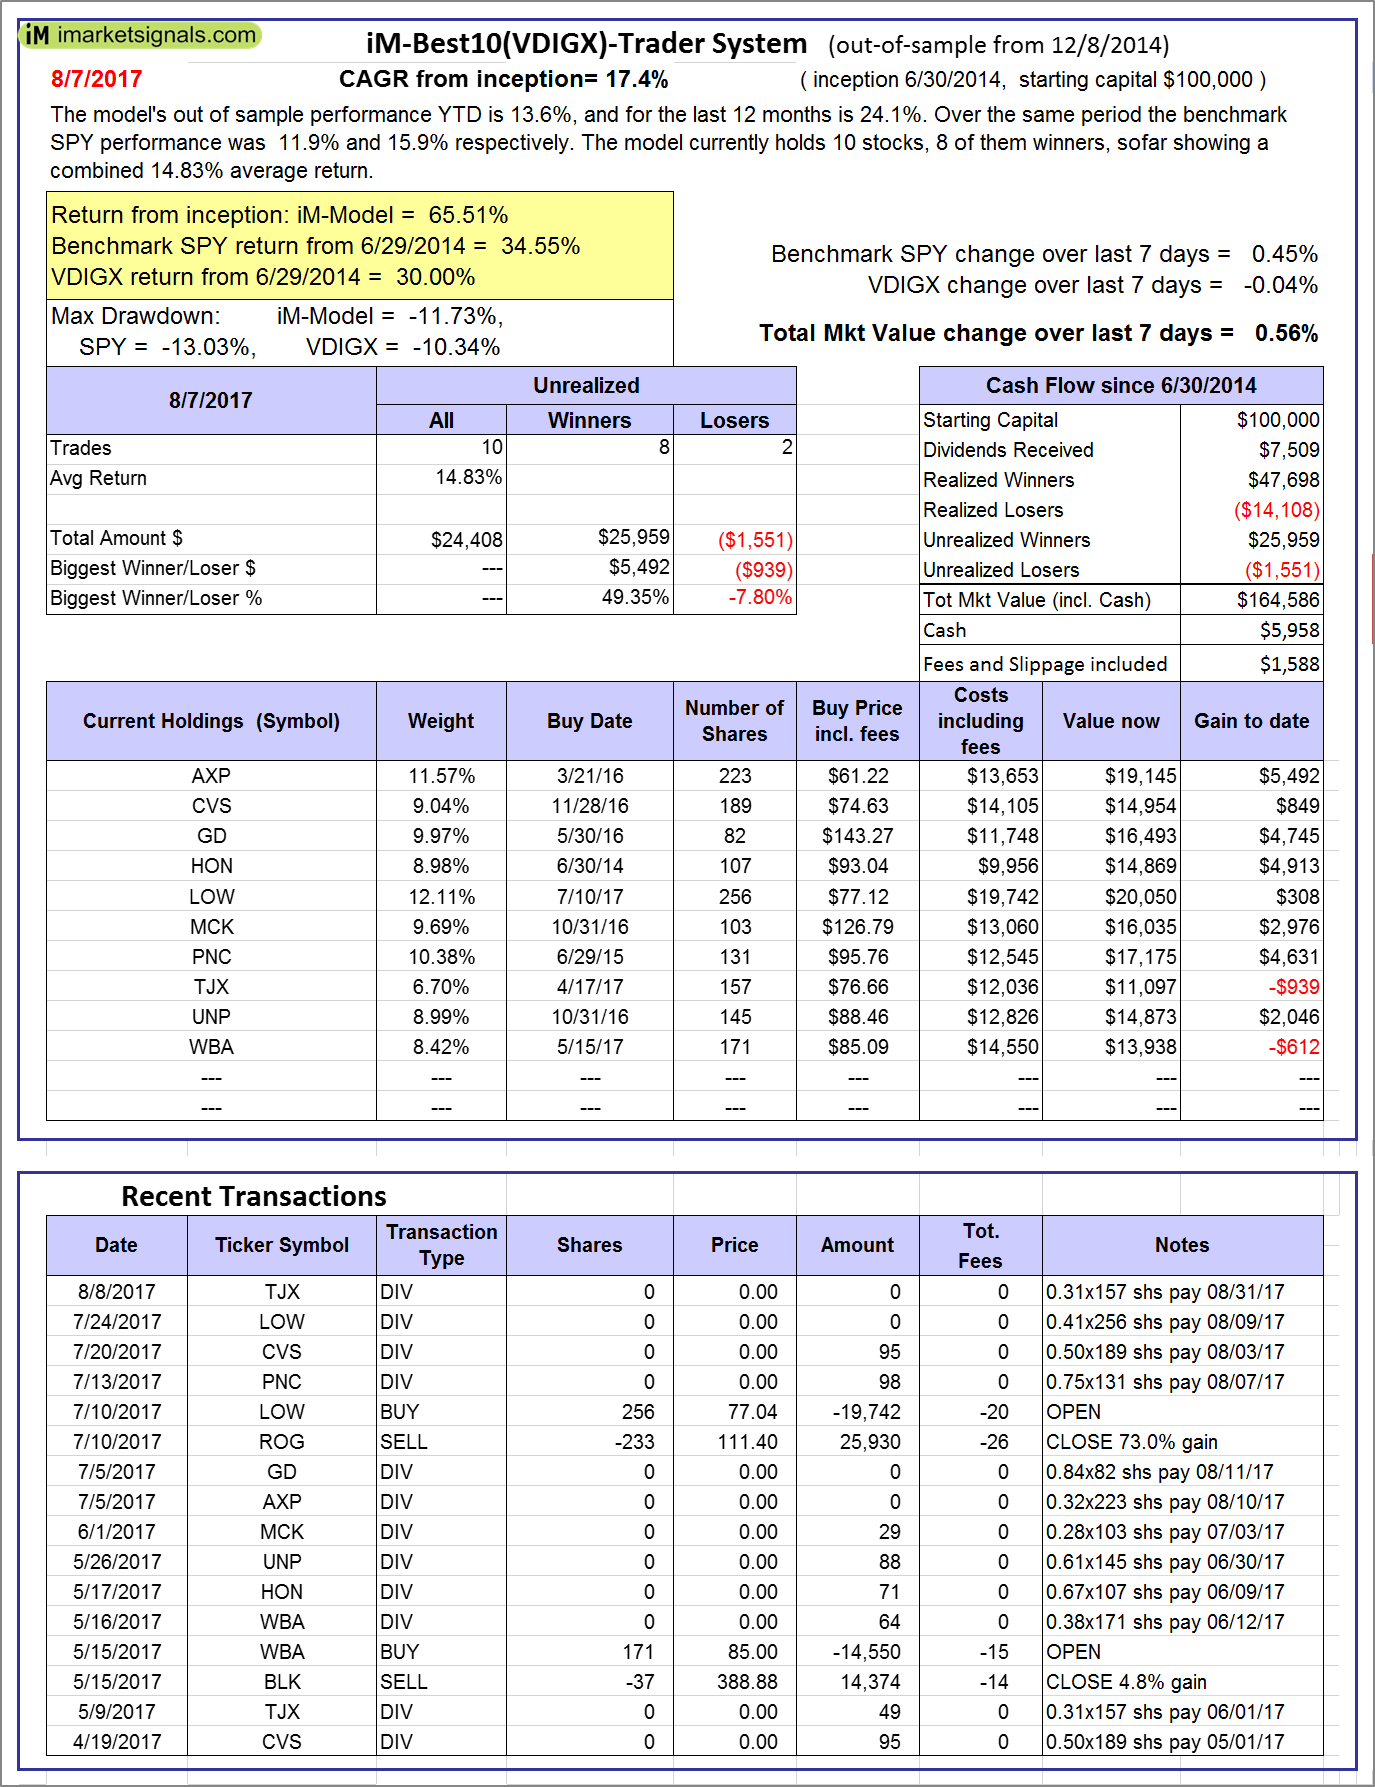  |
iM-Best10(VDIGX)-Trader: The model’s out of sample performance YTD is 13.6%, and for the last 12 months is 24.1%. Over the same period the benchmark SPY performance was 11.9% and 15.9% respectively. Since inception, on 7/1/2014, the model gained 65.51% while the benchmark SPY gained 34.55% and VDIGX gained 30.00% over the same period. Over the previous week the market value of iM-Best10(VDIGX) gained 0.56% at a time when SPY gained 0.45%. A starting capital of $100,000 at inception on 7/1/2014 would have grown to $164,586 which includes $5,958 cash and excludes $1,588 spent on fees and slippage. |
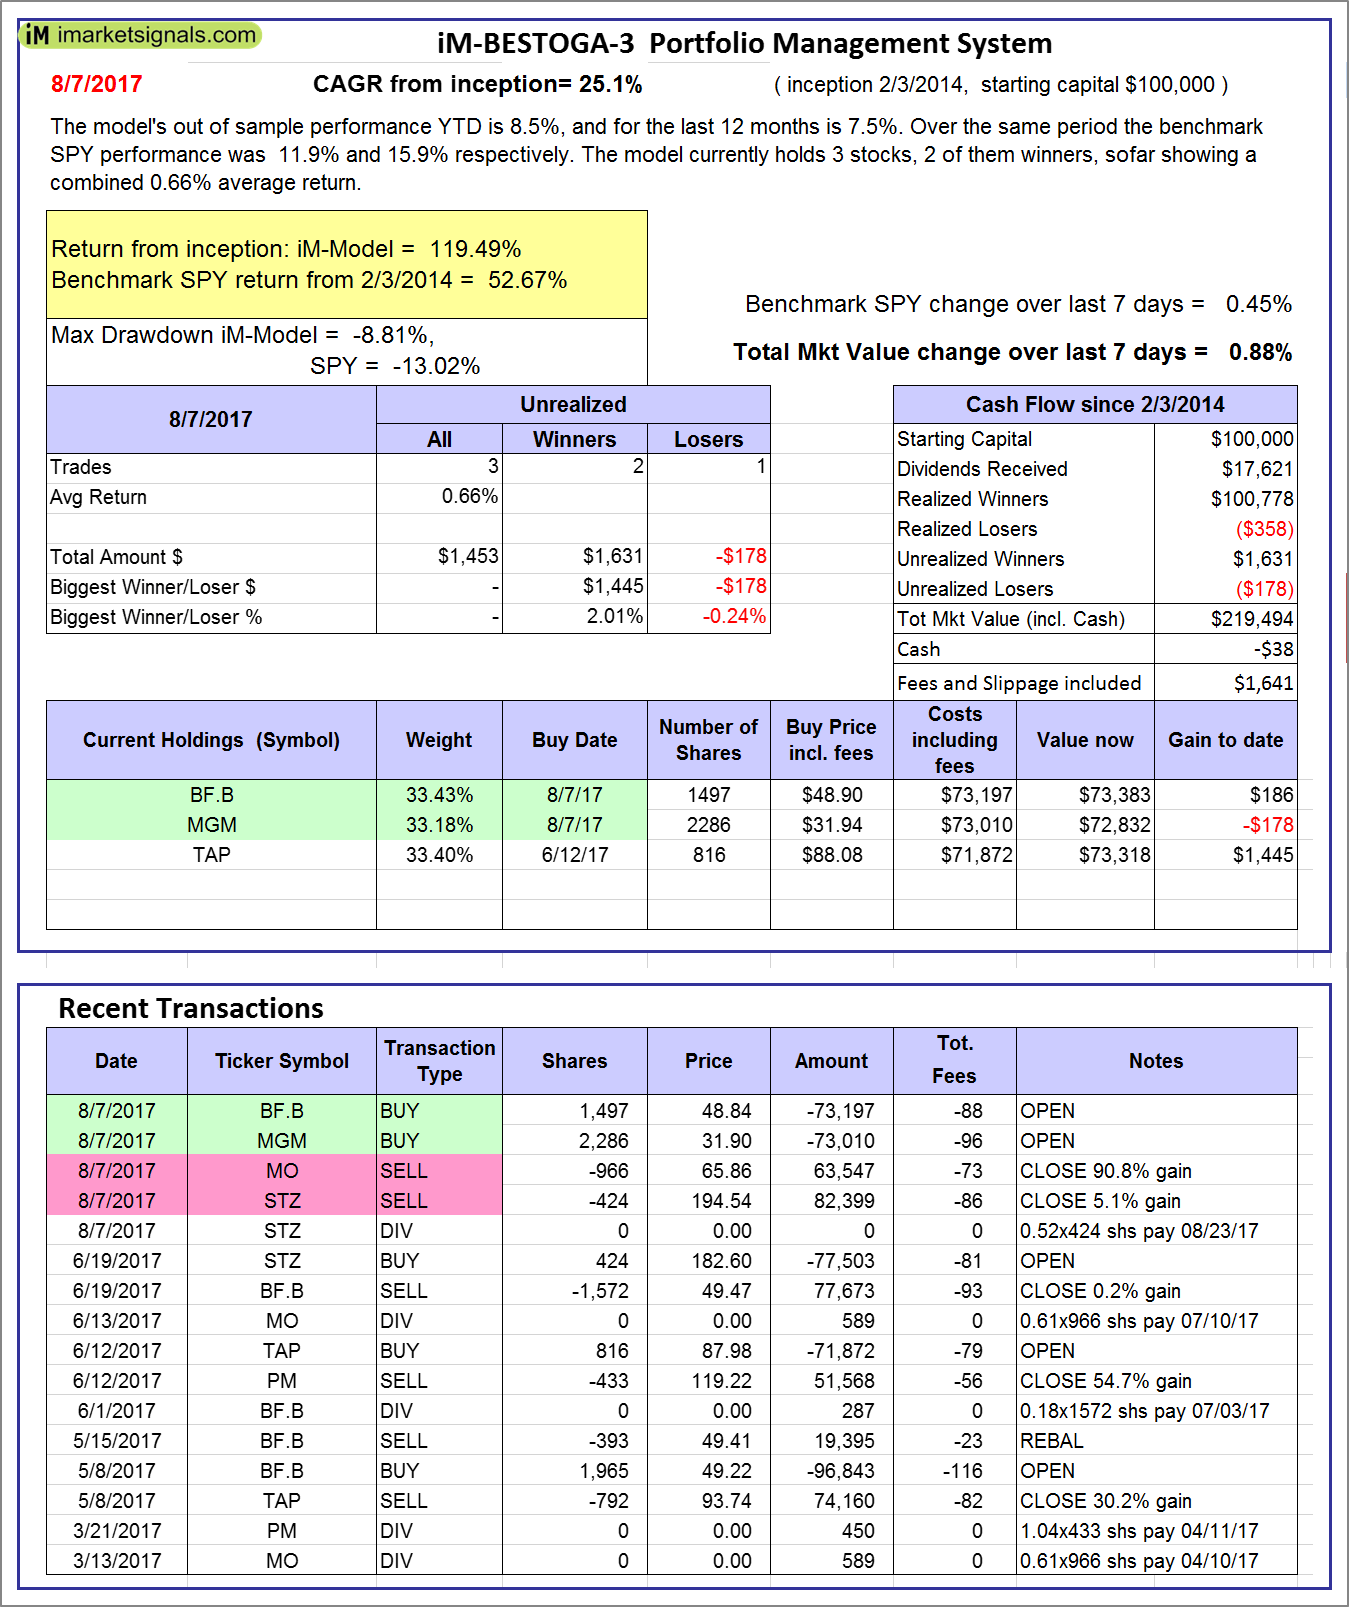 |
iM-BESTOGA-3: The model’s out of sample performance YTD is 8.5%, and for the last 12 months is 7.5%. Over the same period the benchmark SPY performance was 11.9% and 15.9% respectively. Over the previous week the market value of iM-BESTOGA-3 gained 0.88% at a time when SPY gained 0.45%. A starting capital of $100,000 at inception on 2/3/2014 would have grown to $219,494 which includes -$38 cash and excludes $1,641 spent on fees and slippage. |
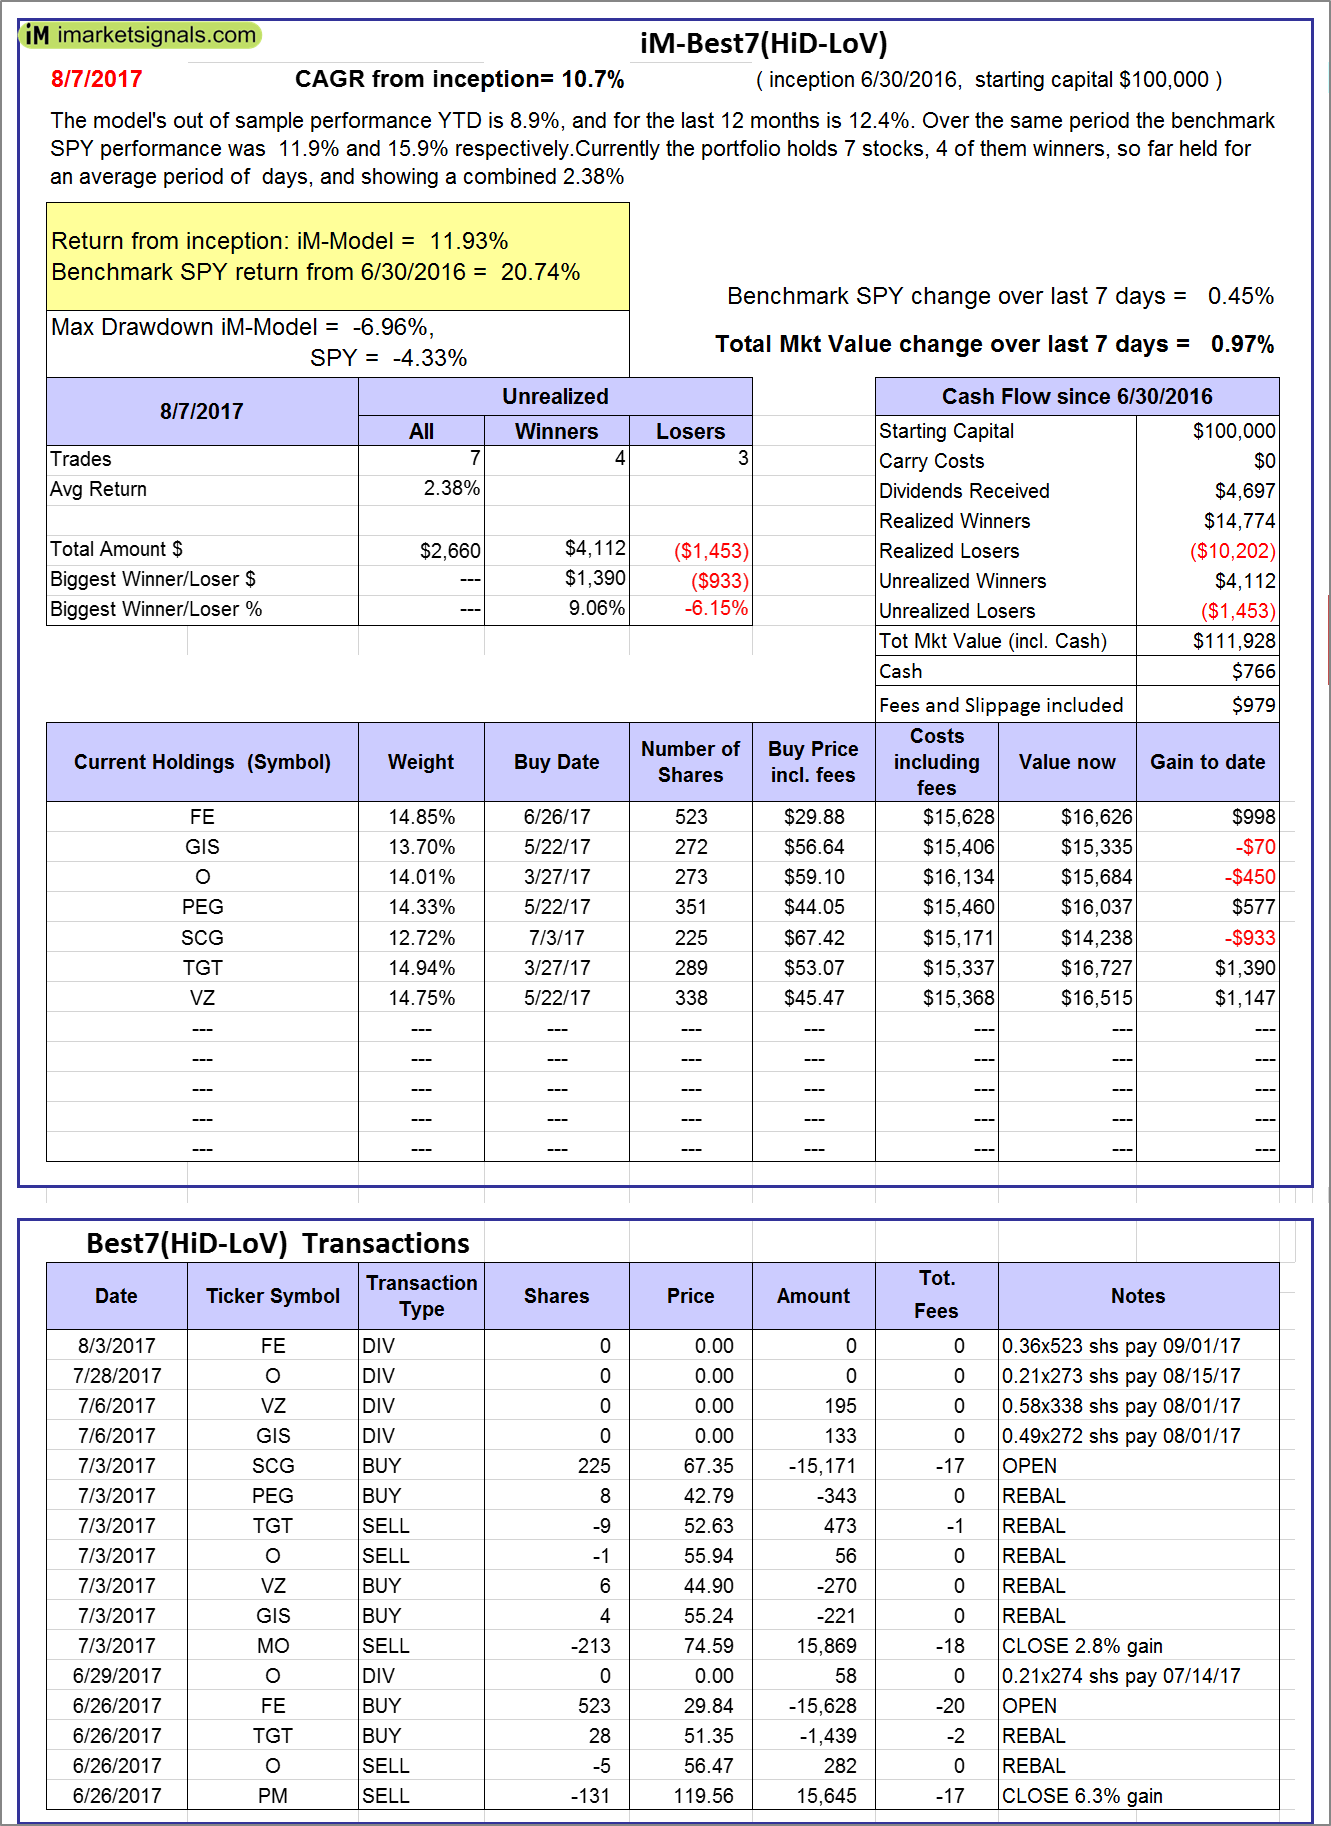 |
iM-Best7(HiD-LoV): The model’s out of sample performance YTD is 8.9%, and for the last 12 months is 12.4%. Over the same period the benchmark SPY performance was 11.9% and 15.9% respectively. Over the previous week the market value of iM-BESTOGA-3 gained 0.97% at a time when SPY gained 0.45%. A starting capital of $100,000 at inception on 6/30/2016 would have grown to $111,928 which includes $766 cash and excludes $979 spent on fees and slippage. |
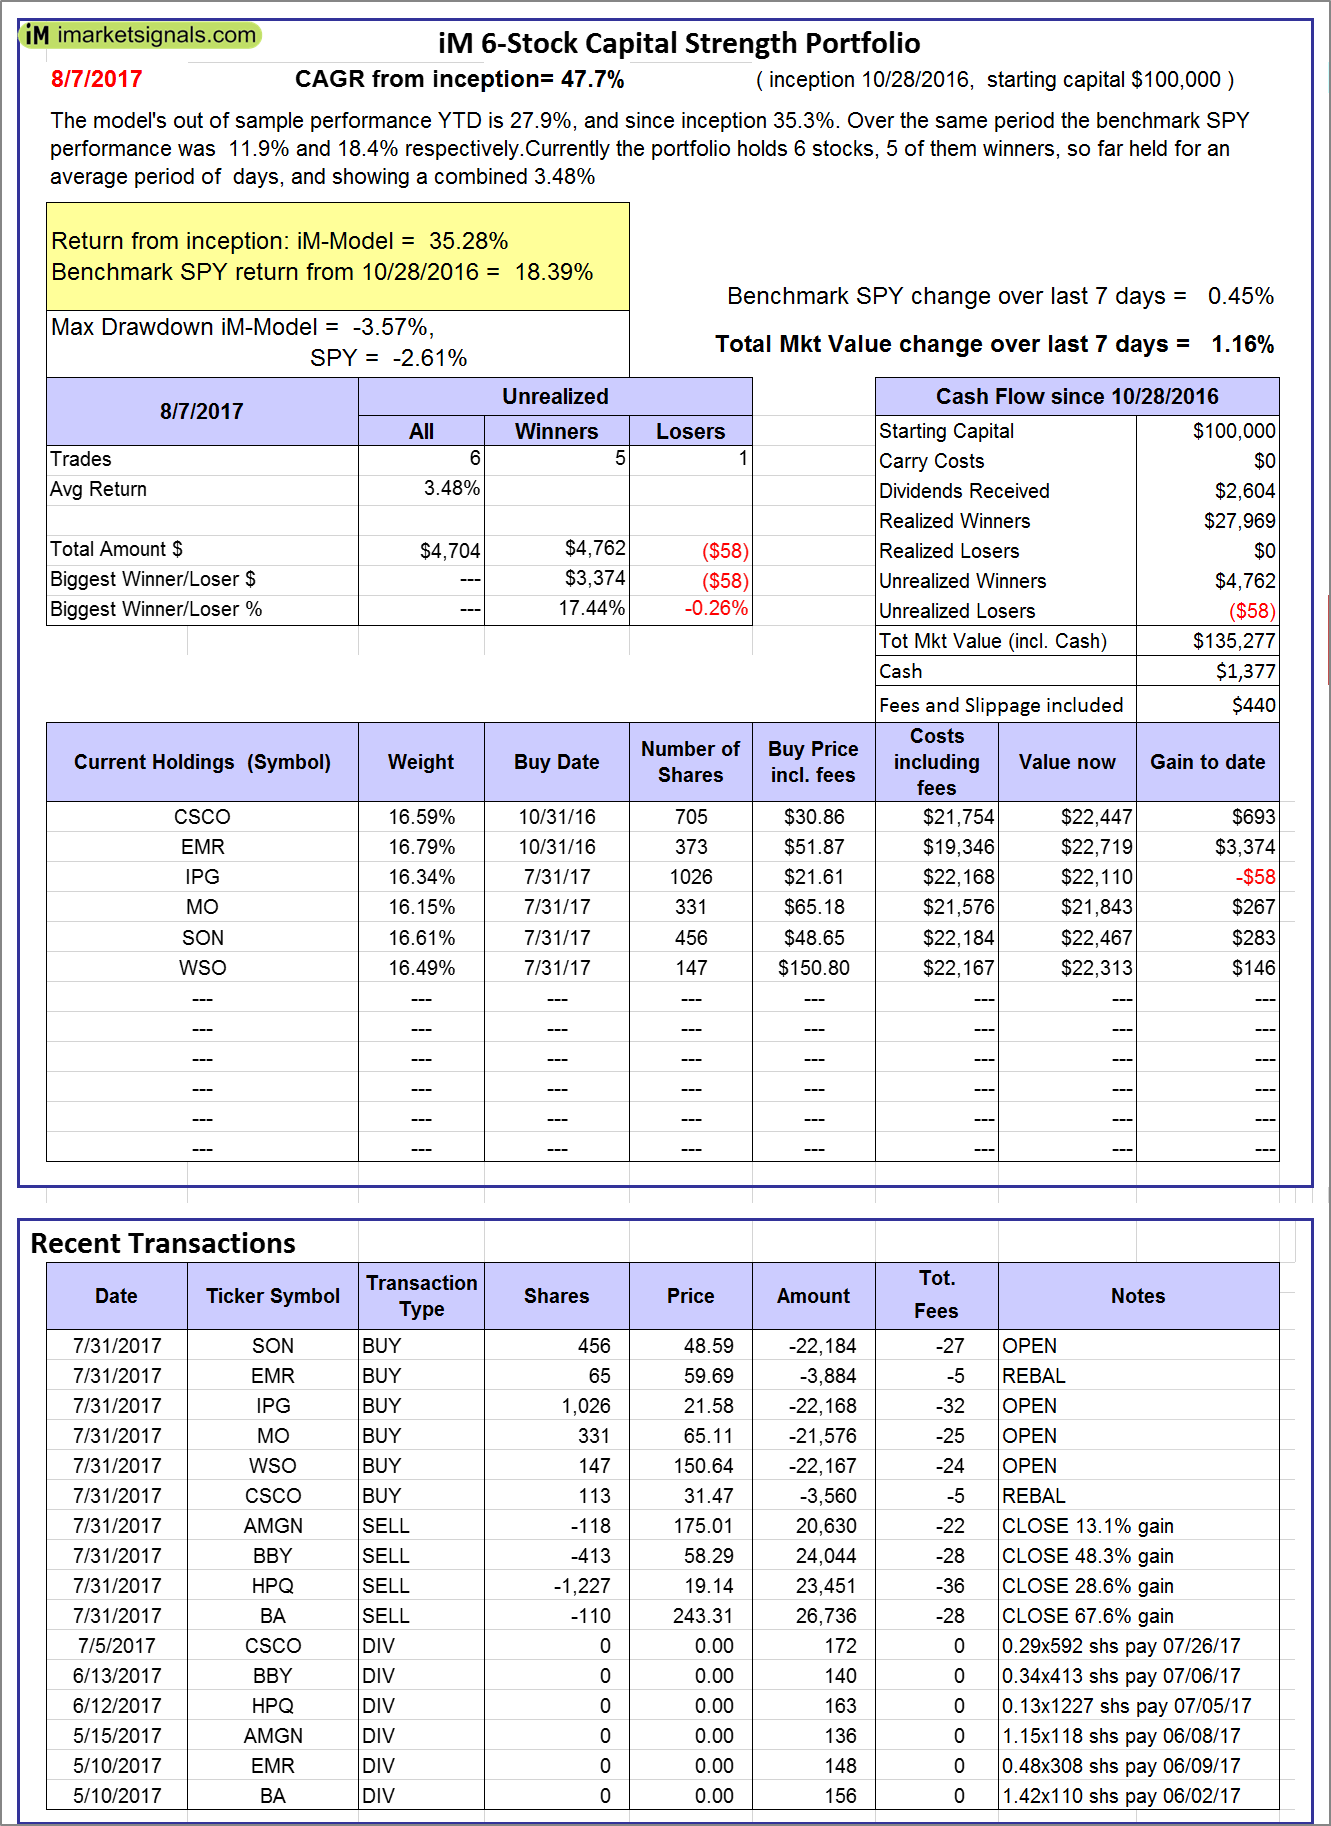 |
iM 6-Stock Capital Strength Portfolio: The model’s out of sample performance YTD is 27.9%, and since inception 35.3%. Over the same period the benchmark SPY performance was 11.9% and 18.4% respectively. Over the previous week the market value of the iM 6-Stock Capital Strength Portfolio gained 1.16% at a time when SPY gained 0.45%. A starting capital of $100,000 at inception on 10/28/2016 would have grown to $135,277 which includes $1,377 cash and excludes $440 spent on fees and slippage. |
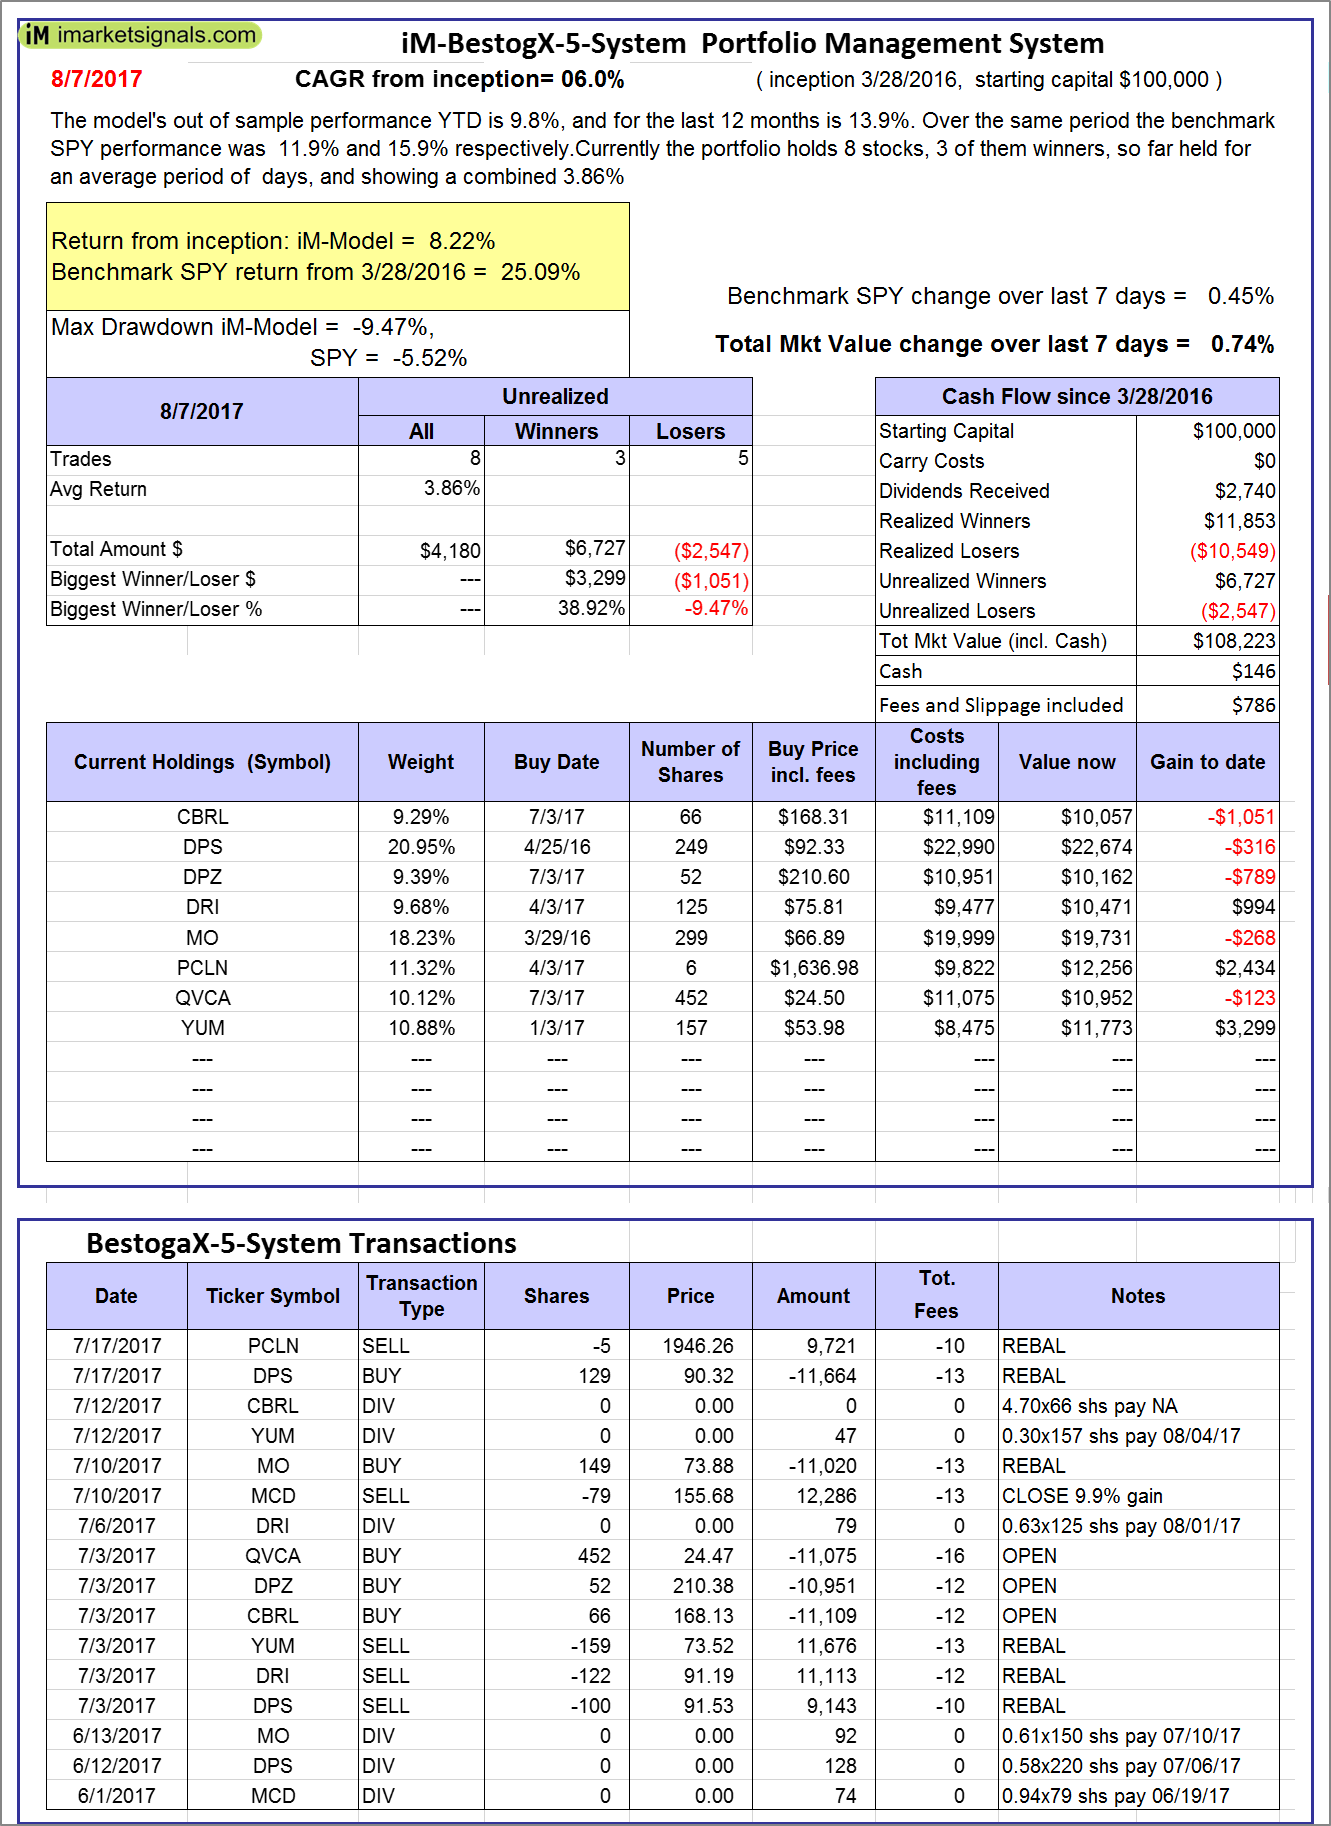 |
iM-BestogaX5-System: The model’s out of sample performance YTD is 9.8%, and for the last 12 months is 13.9%. Over the same period the benchmark SPY performance was 11.9% and 15.9% respectively. Over the previous week the market value of iM-Best8(S&P 500)Tax-Eff. gained 0.74% at a time when SPY gained 0.45%. A starting capital of $100,000 at inception on 3/28/2016 would have grown to $108,223 which includes $146 cash and excludes $786 spent on fees and slippage. |
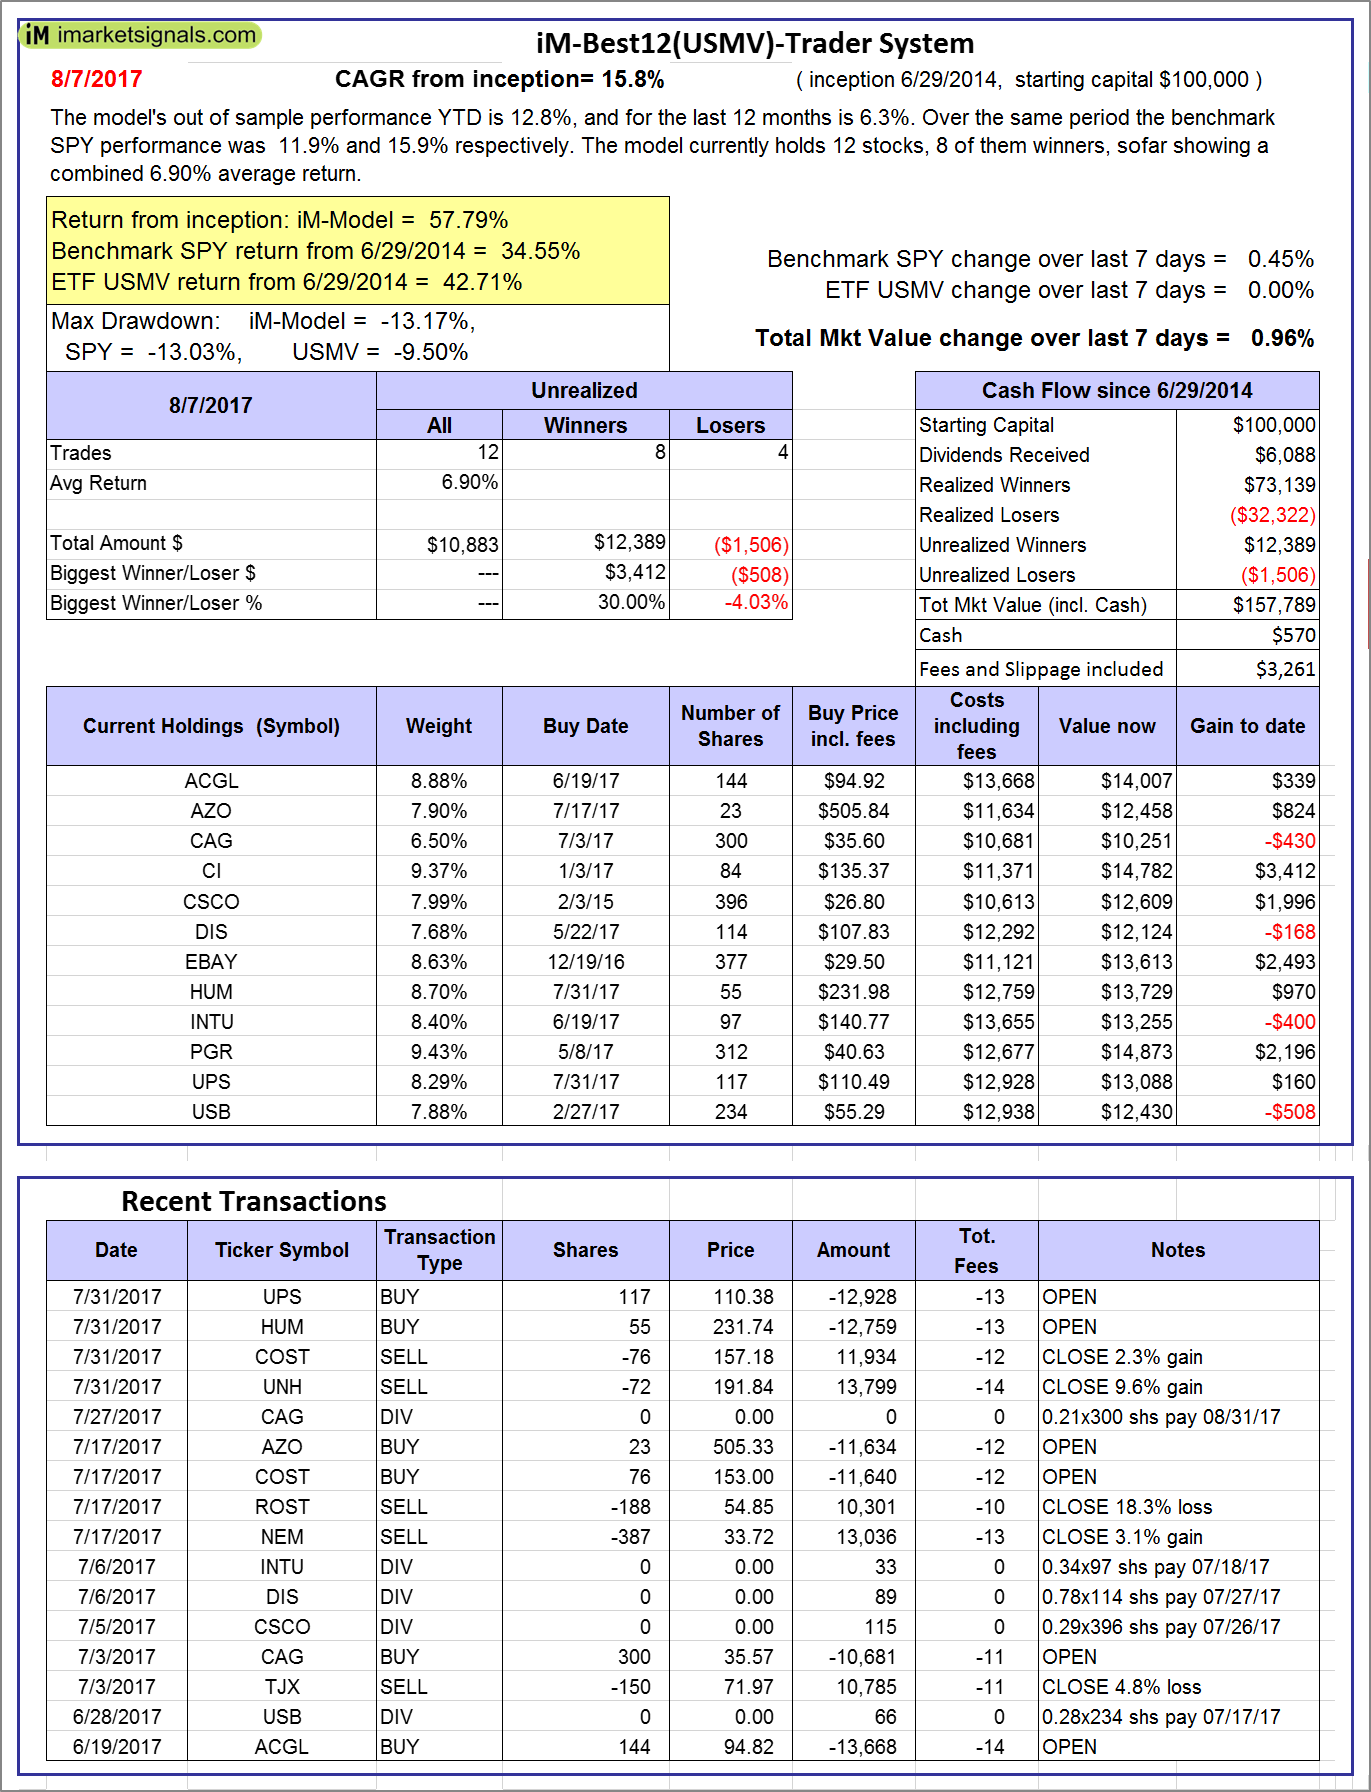 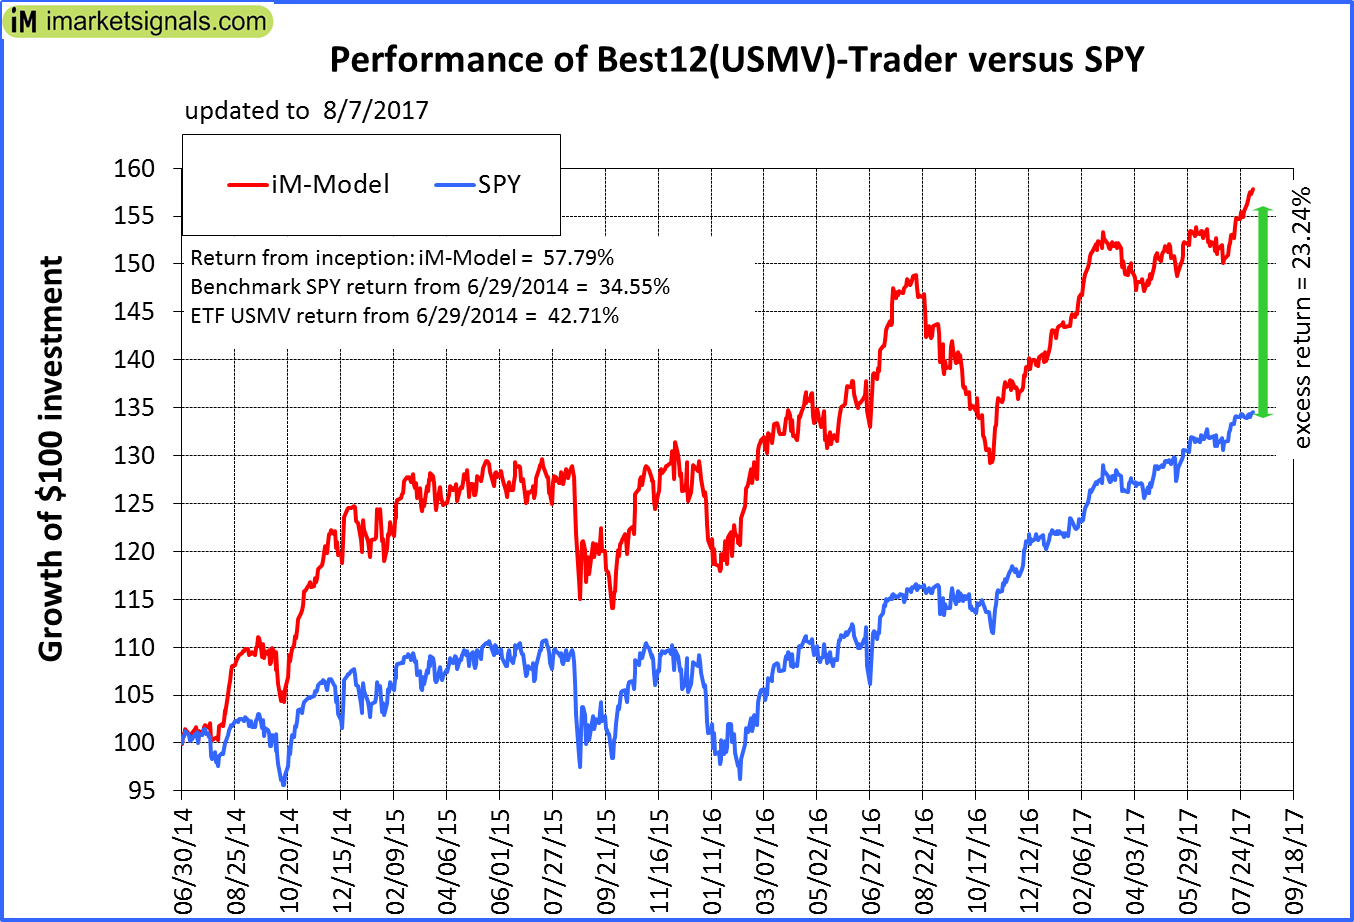 |
iM-Best12(USMV)-Trader: The model’s out of sample performance YTD is 12.8%, and for the last 12 months is 6.3%. Over the same period the benchmark SPY performance was 11.9% and 15.9% respectively. Since inception, on 6/30/2014, the model gained 57.79% while the benchmark SPY gained 34.55% and the ETF USMV gained 42.71% over the same period. Over the previous week the market value of iM-Best12(USMV)-Trader gained 0.96% at a time when SPY gained 0.45%. A starting capital of $100,000 at inception on 6/30/2014 would have grown to $157,789 which includes $570 cash and excludes $3,261 spent on fees and slippage. |
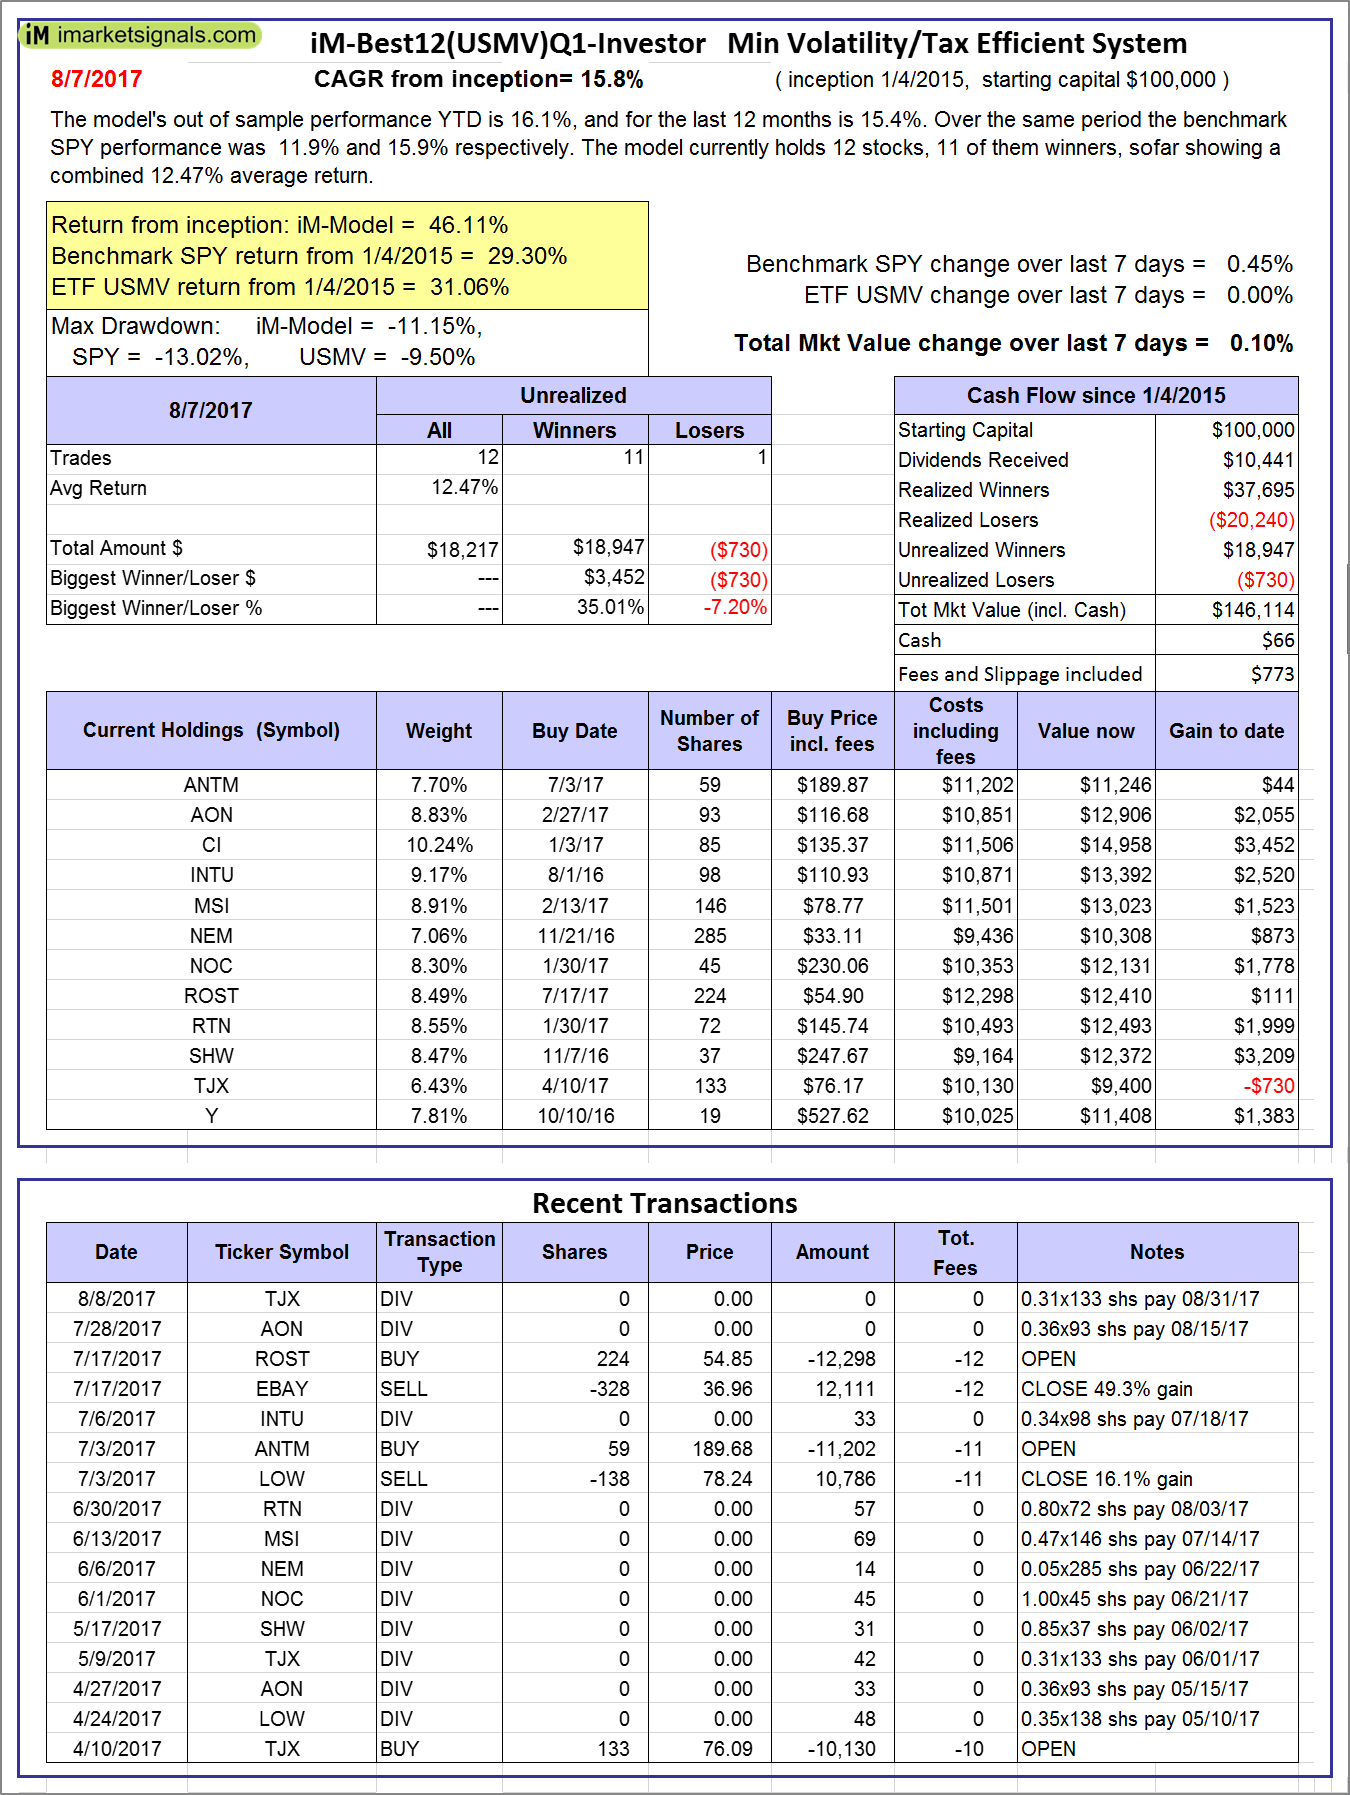  |
iM-Best12(USMV)Q1-Investor: The model’s out of sample performance YTD is 16.1%, and for the last 12 months is 15.4%. Over the same period the benchmark SPY performance was 11.9% and 15.9% respectively. Since inception, on 1/5/2015, the model gained 46.11% while the benchmark SPY gained 29.30% and the ETF USMV gained 31.06% over the same period. Over the previous week the market value of iM-Best12(USMV)Q1 gained 0.10% at a time when SPY gained 0.45%. A starting capital of $100,000 at inception on 1/5/2015 would have grown to $146,114 which includes $66 cash and excludes $773 spent on fees and slippage. |
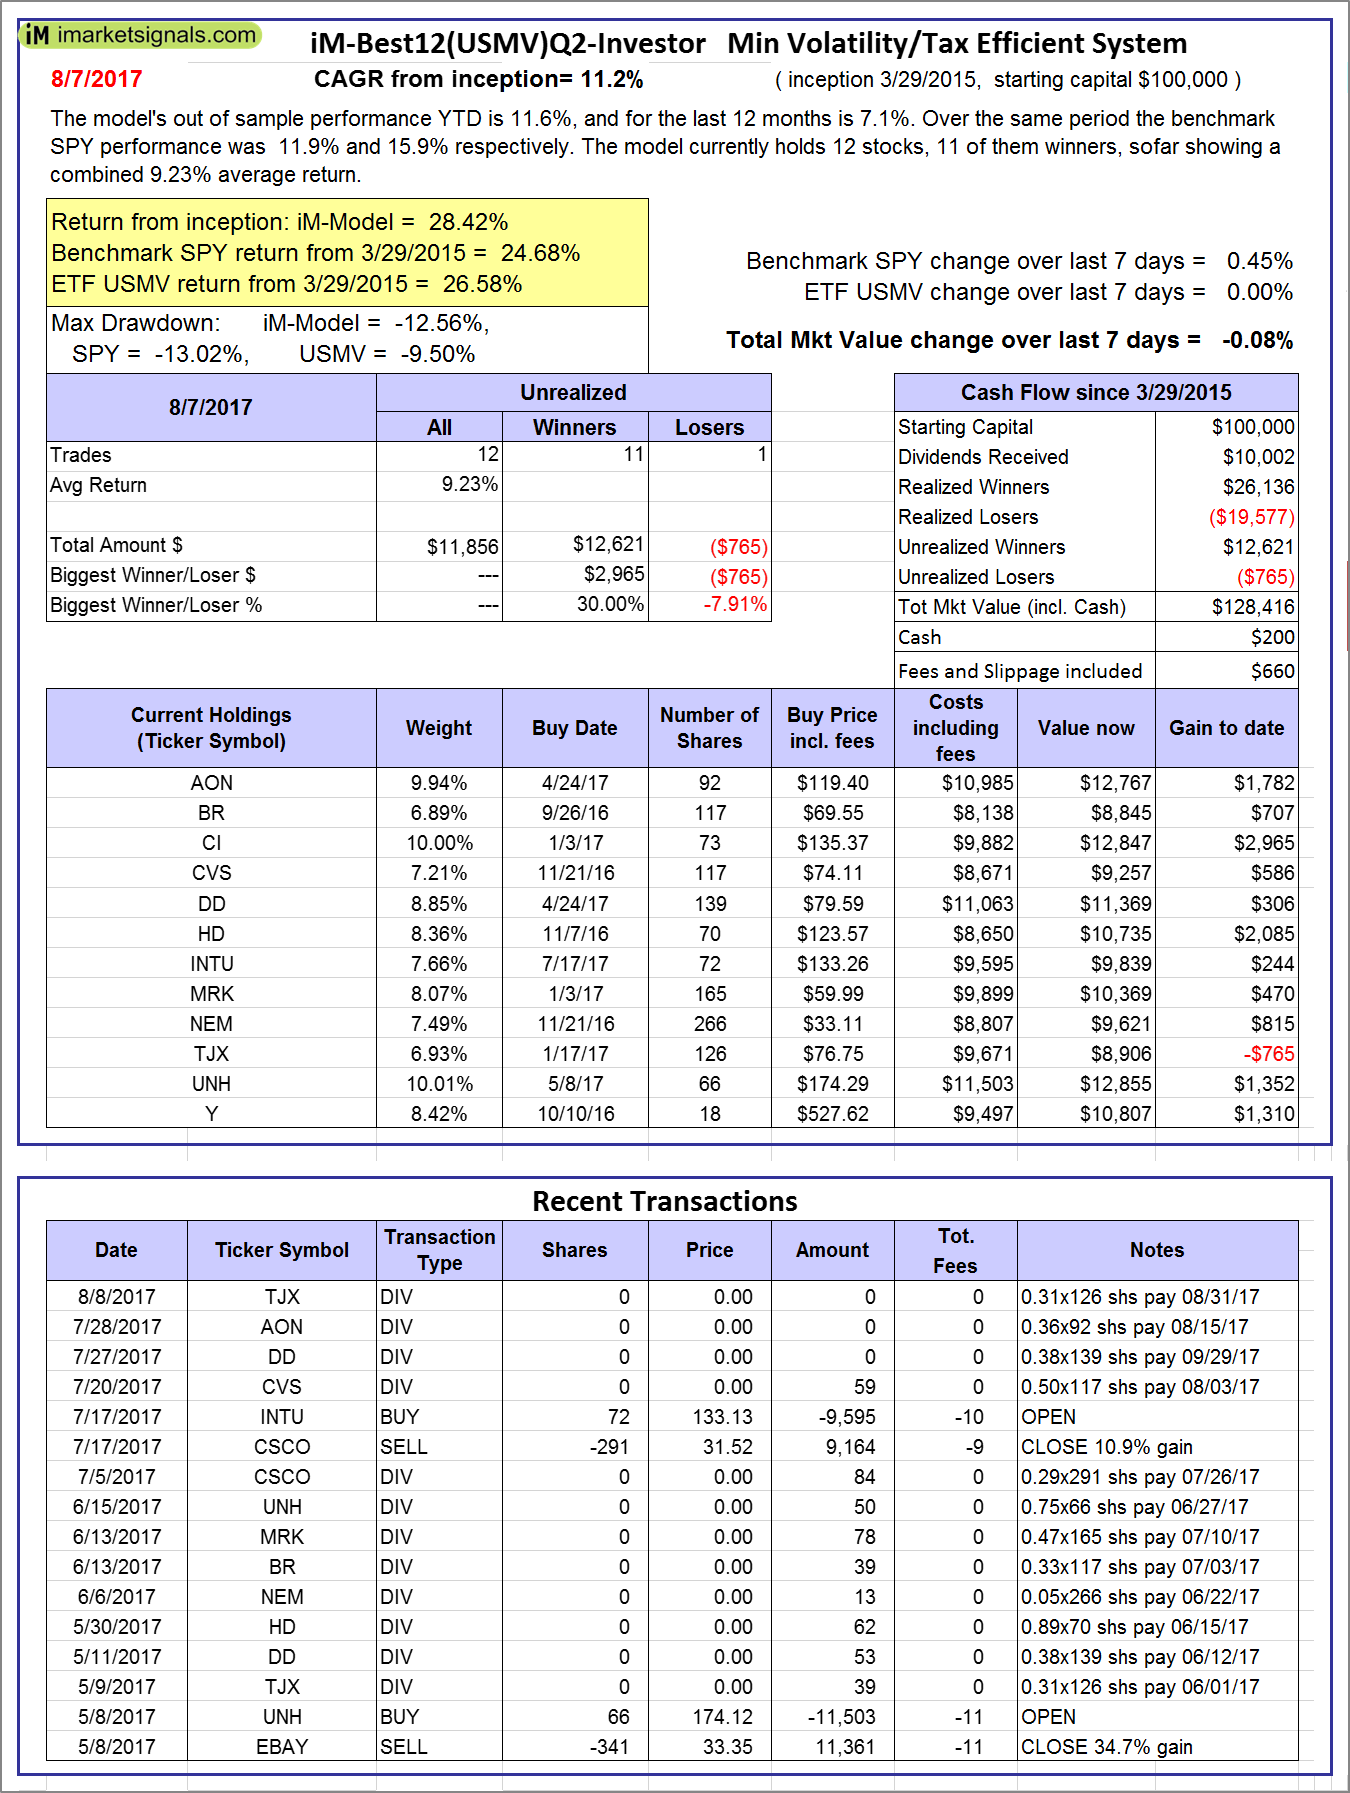 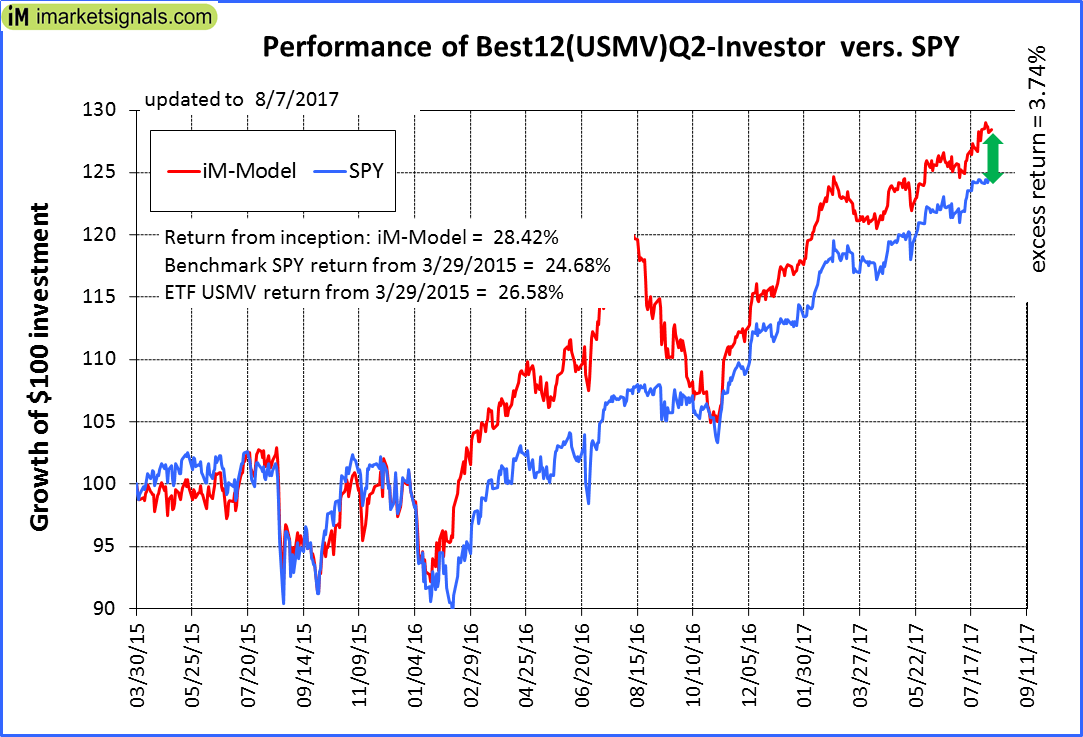 |
iM-Best12(USMV)Q2-Investor: The model’s out of sample performance YTD is 11.6%, and for the last 12 months is 7.1%. Over the same period the benchmark SPY performance was 11.9% and 15.9% respectively. Since inception, on 3/30/2015, the model gained 28.42% while the benchmark SPY gained 24.68% and the ETF USMV gained 26.58% over the same period. Over the previous week the market value of iM-Best12(USMV)Q2 gained -0.08% at a time when SPY gained 0.45%. A starting capital of $100,000 at inception on 3/30/2015 would have grown to $128,416 which includes $200 cash and excludes $660 spent on fees and slippage. |
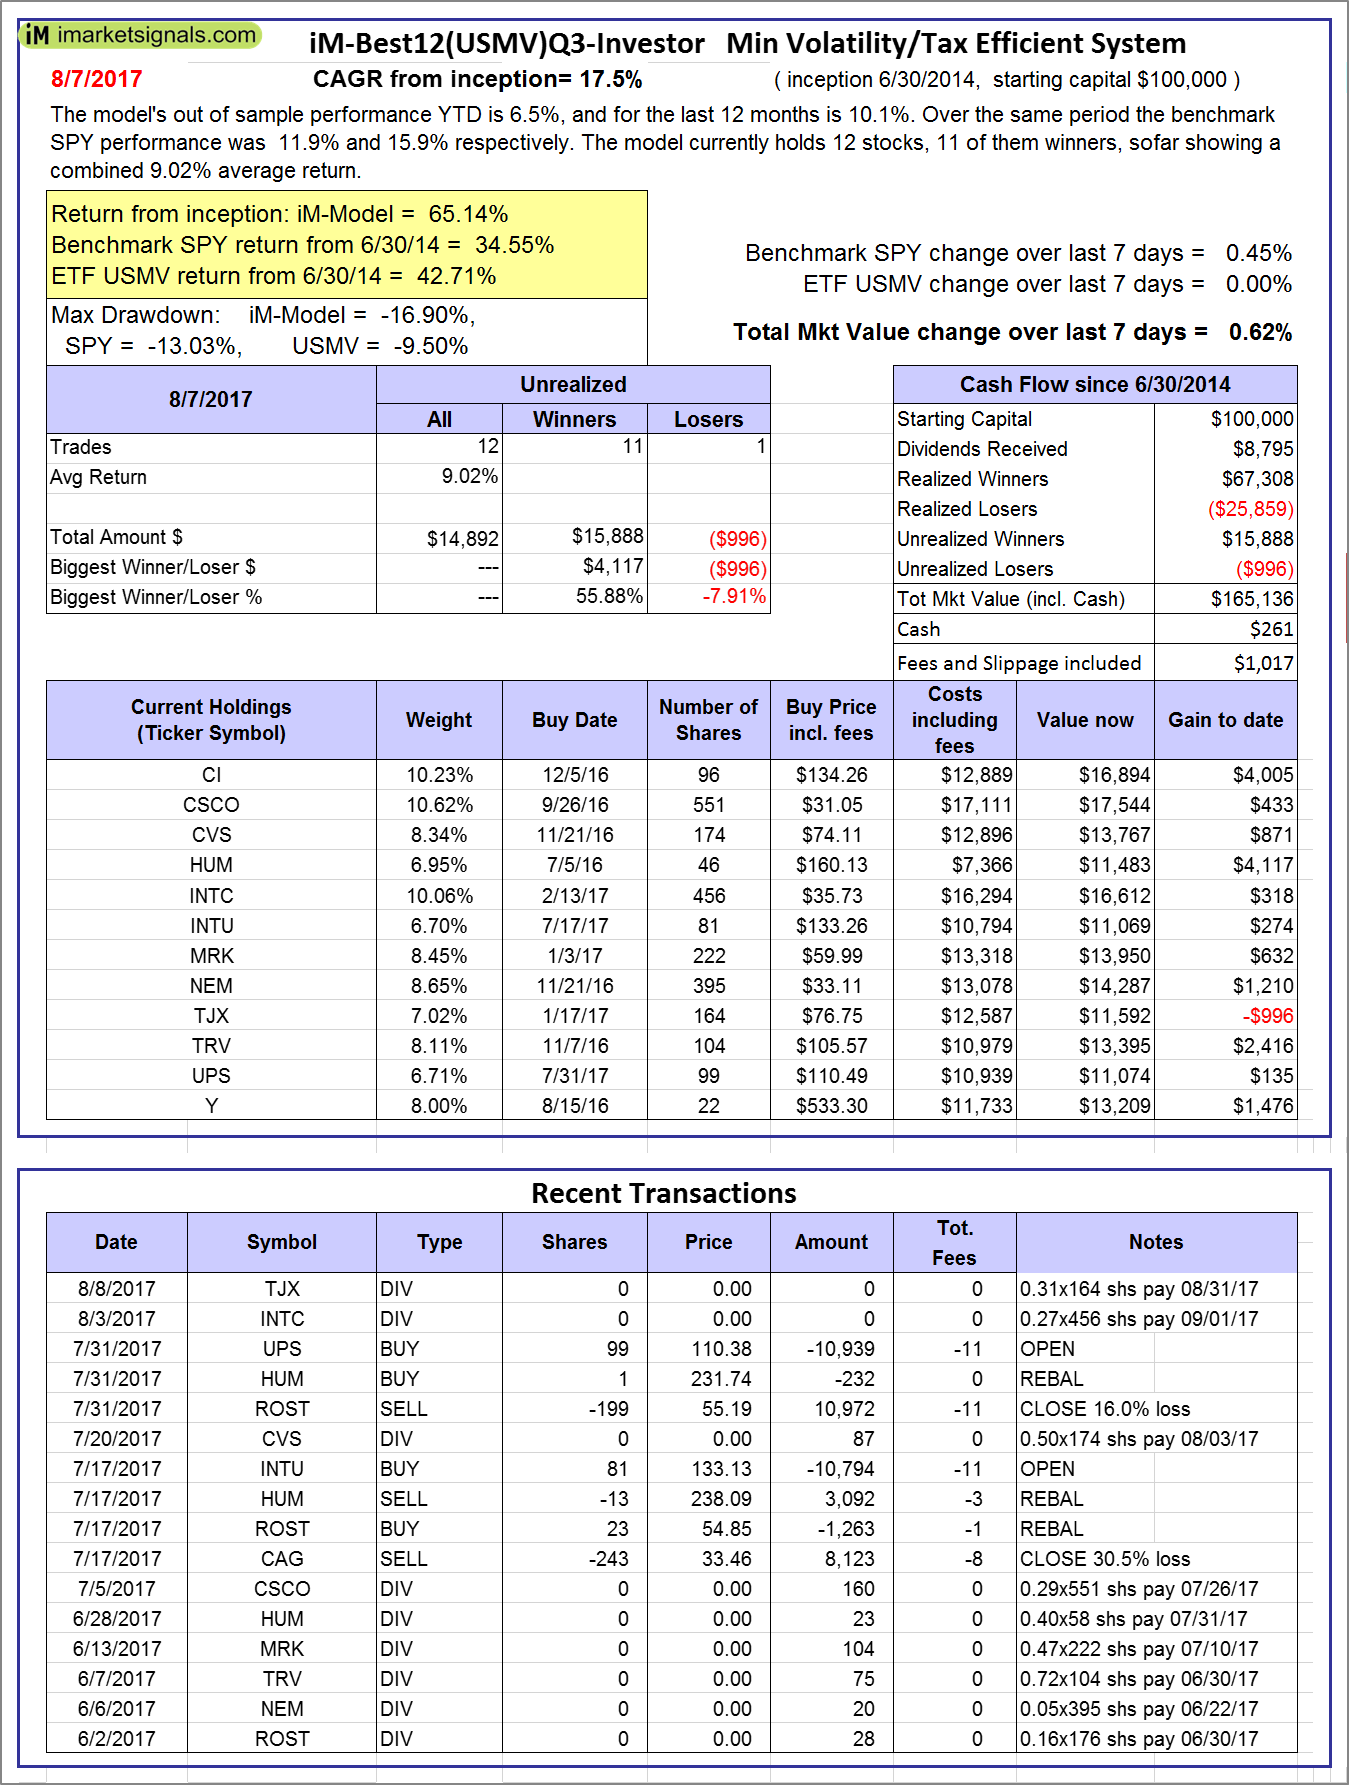 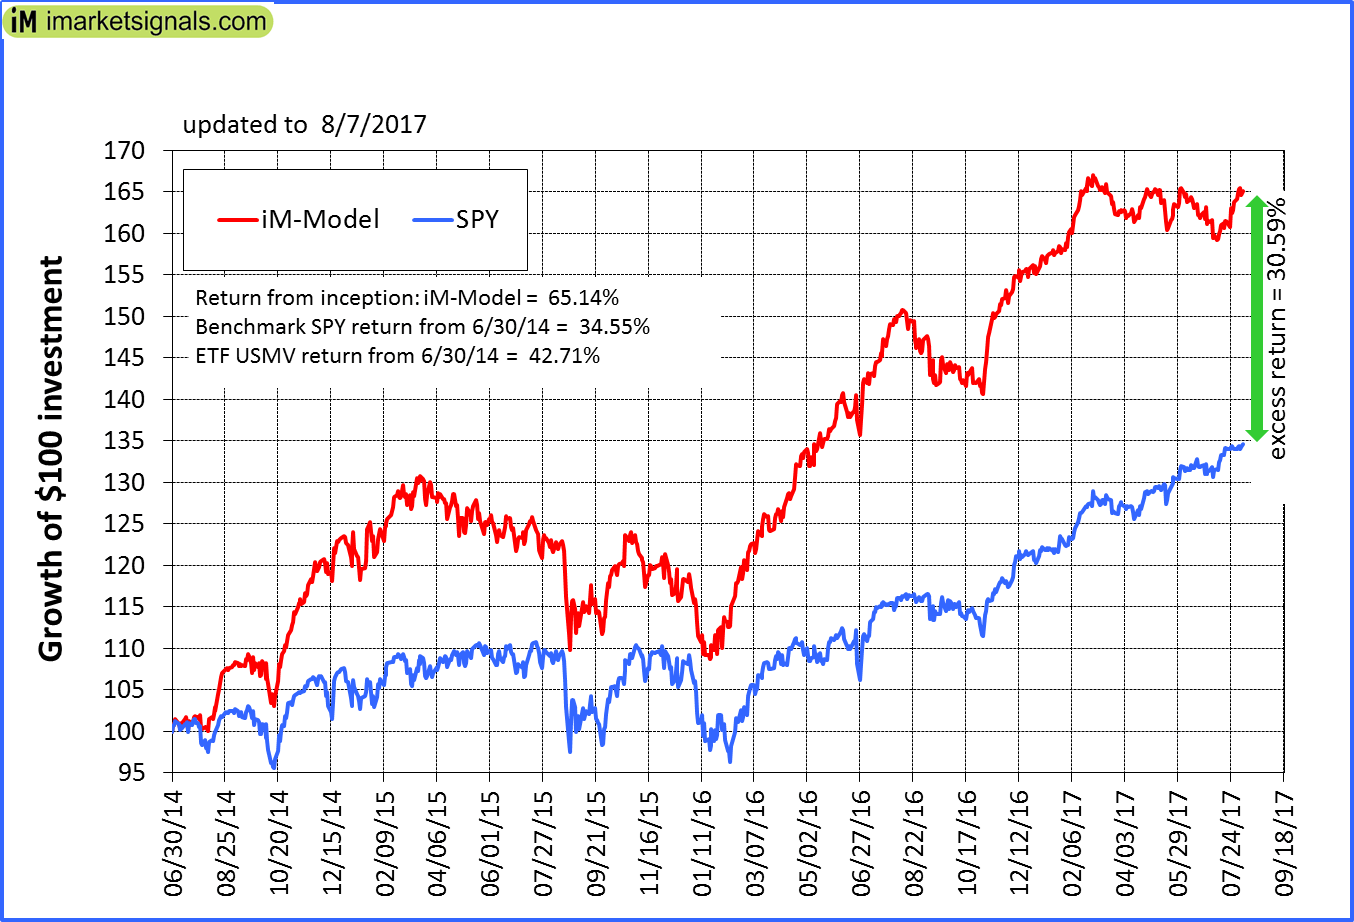 |
iM-Best12(USMV)Q3-Investor: The model’s out of sample performance YTD is 6.5%, and for the last 12 months is 10.1%. Over the same period the benchmark SPY performance was 11.9% and 15.9% respectively. Since inception, on 7/1/2014, the model gained 65.14% while the benchmark SPY gained 34.55% and the ETF USMV gained 42.71% over the same period. Over the previous week the market value of iM-Best12(USMV)Q3 gained 0.62% at a time when SPY gained 0.45%. A starting capital of $100,000 at inception on 7/1/2014 would have grown to $165,136 which includes $261 cash and excludes $1,017 spent on fees and slippage. |
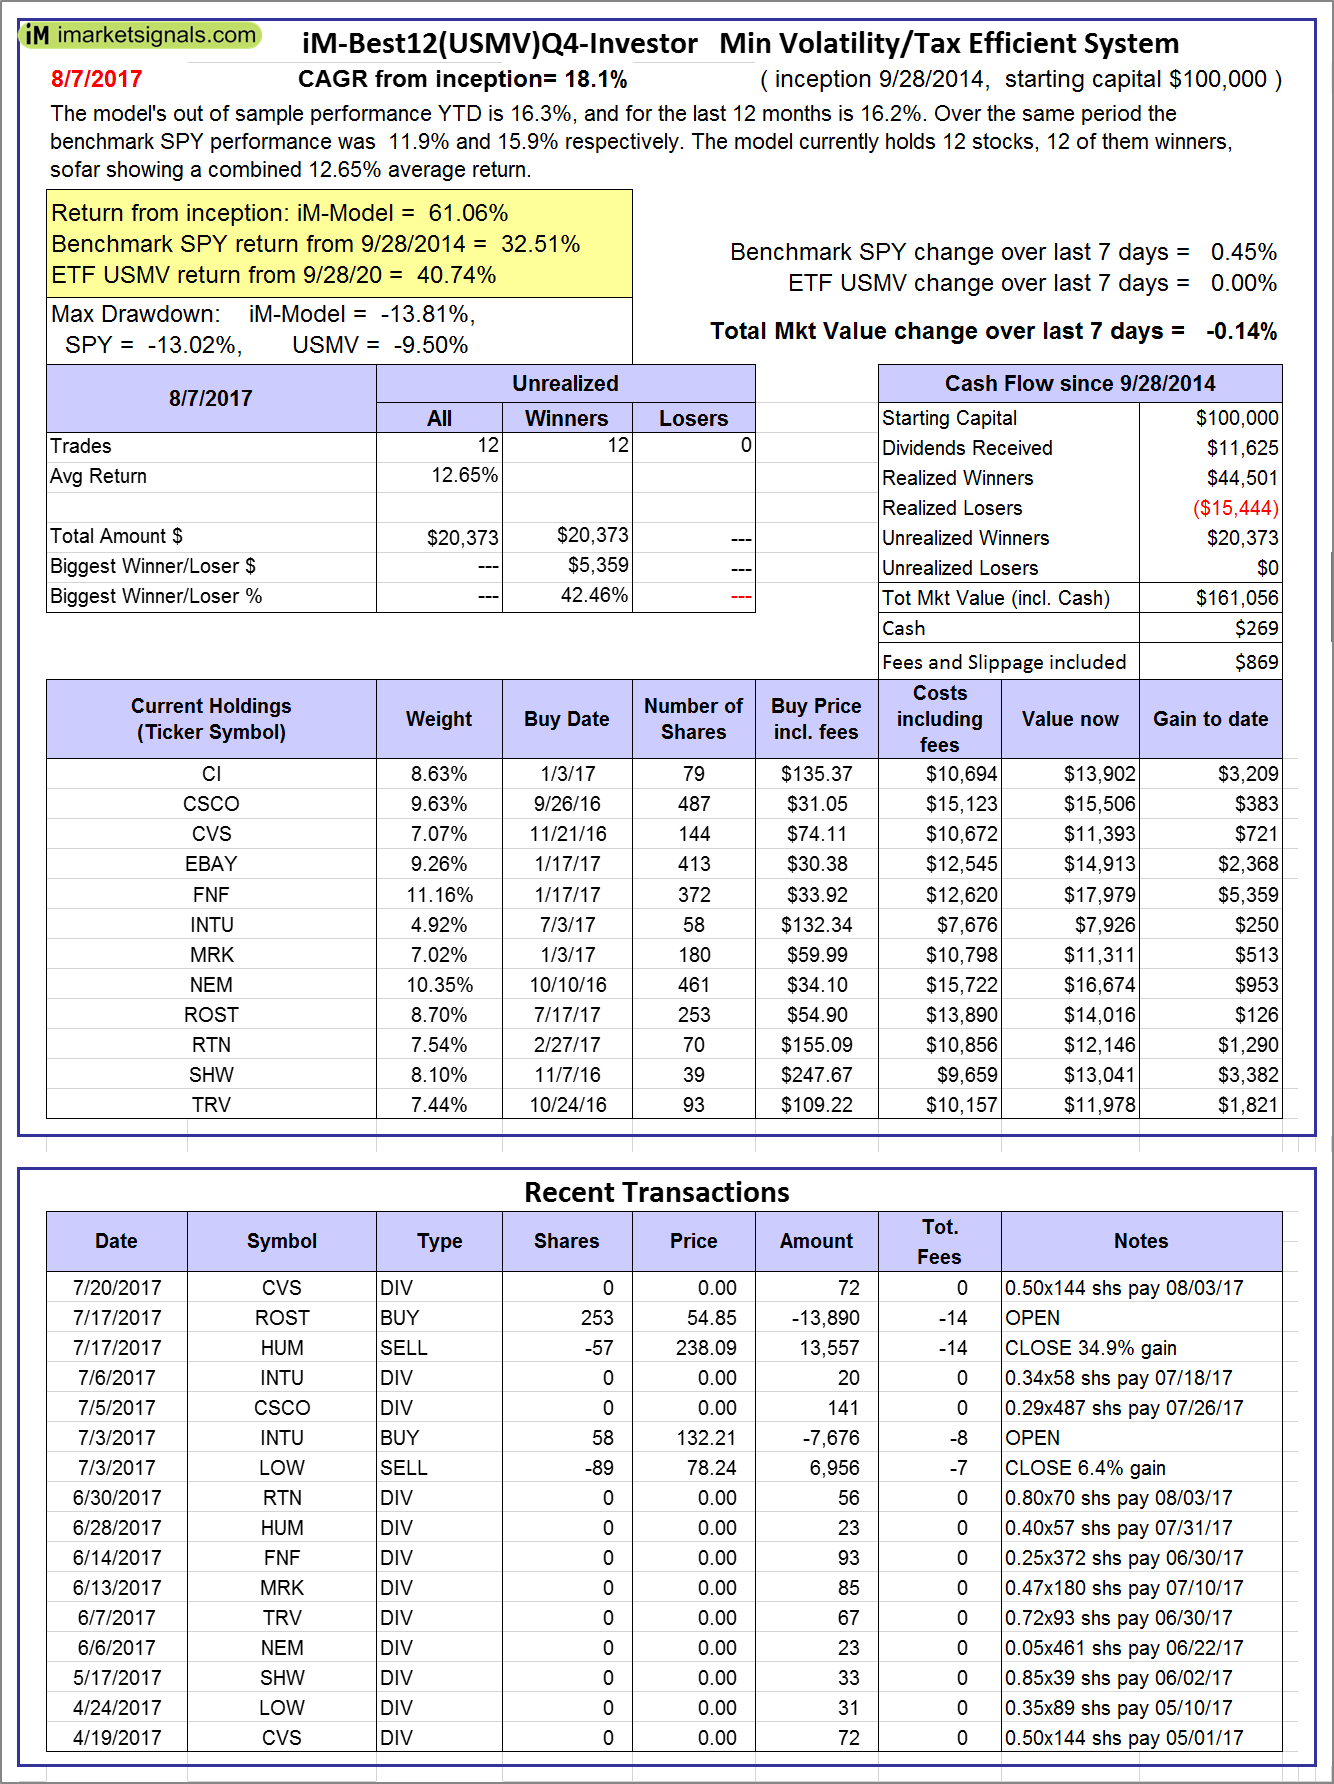 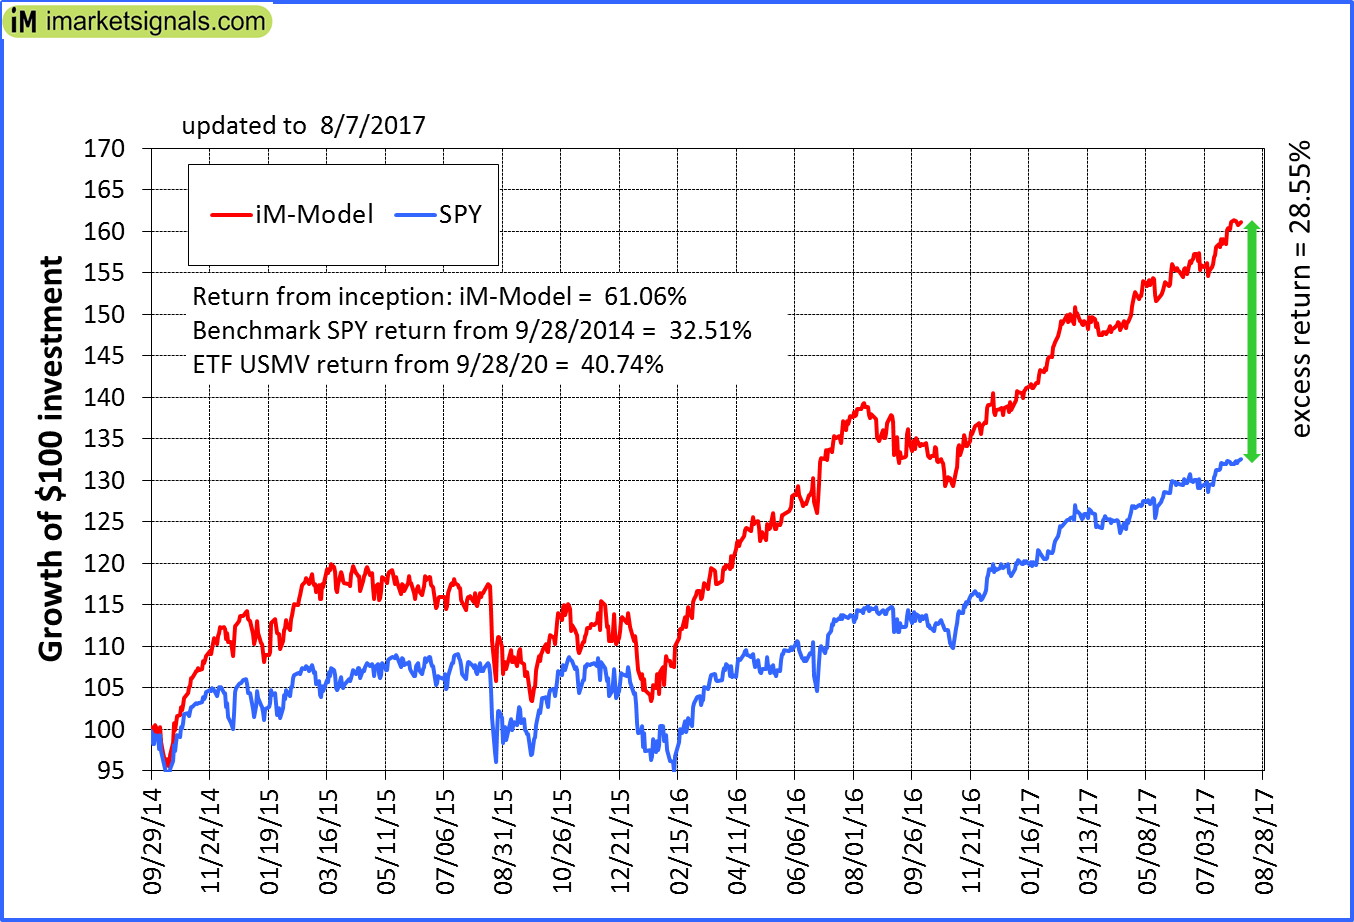 |
iM-Best12(USMV)Q4-Investor: Since inception, on 9/29/2014, the model gained 61.06% while the benchmark SPY gained 32.51% and the ETF USMV gained 40.74% over the same period. Over the previous week the market value of iM-Best12(USMV)Q4 gained -0.14% at a time when SPY gained 0.45%. A starting capital of $100,000 at inception on 9/29/2014 would have grown to $161,056 which includes $269 cash and excludes $869 spent on fees and slippage. |
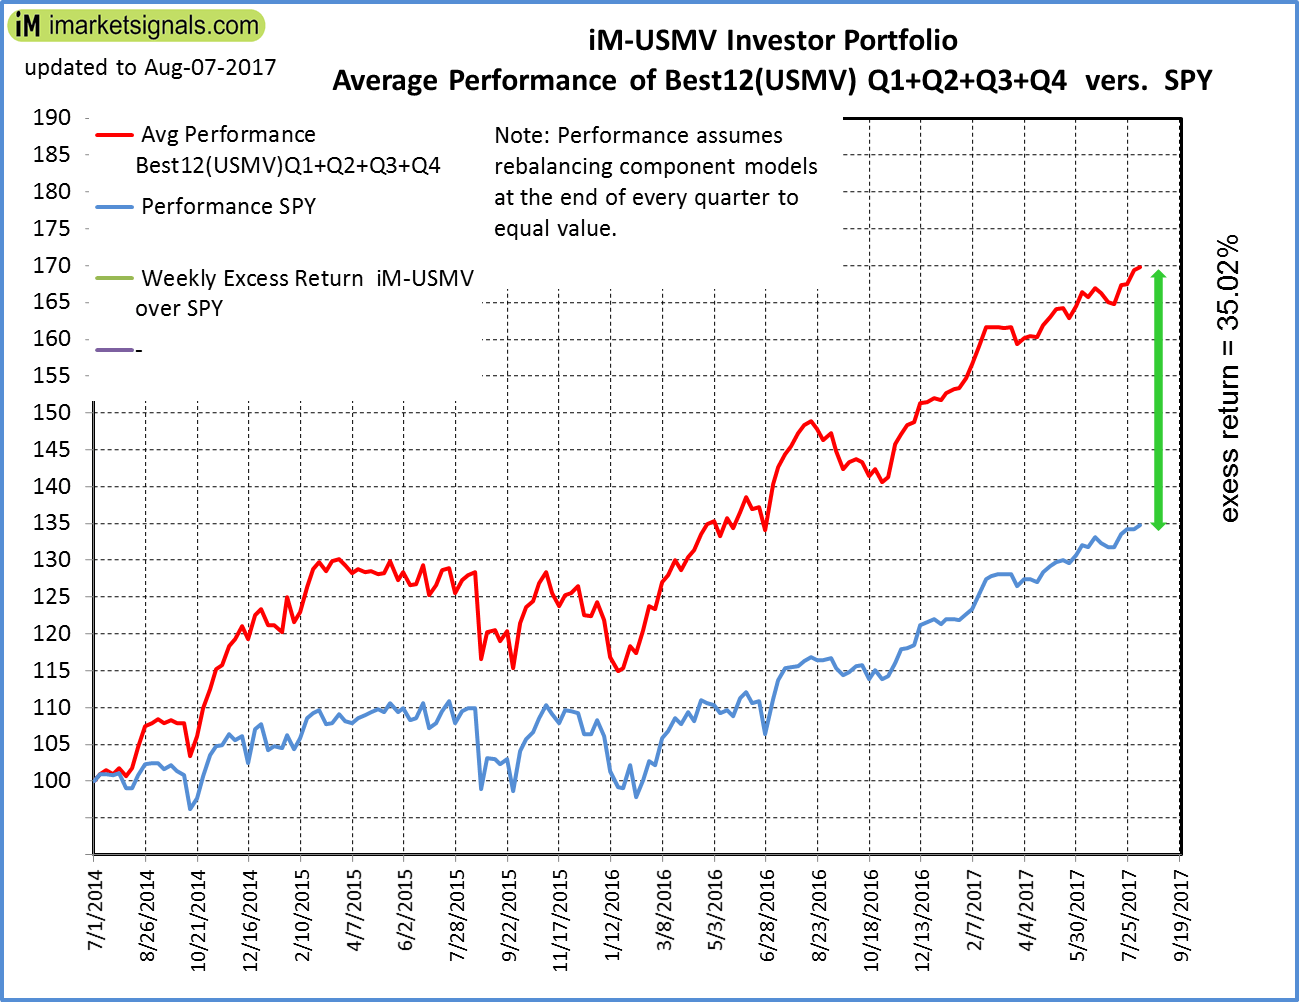 |
Average Performance of iM-Best12(USMV)Q1+Q2+Q3+Q4-Investor resulted in an excess return of 35.02% over SPY. (see iM-USMV Investor Portfolio) |
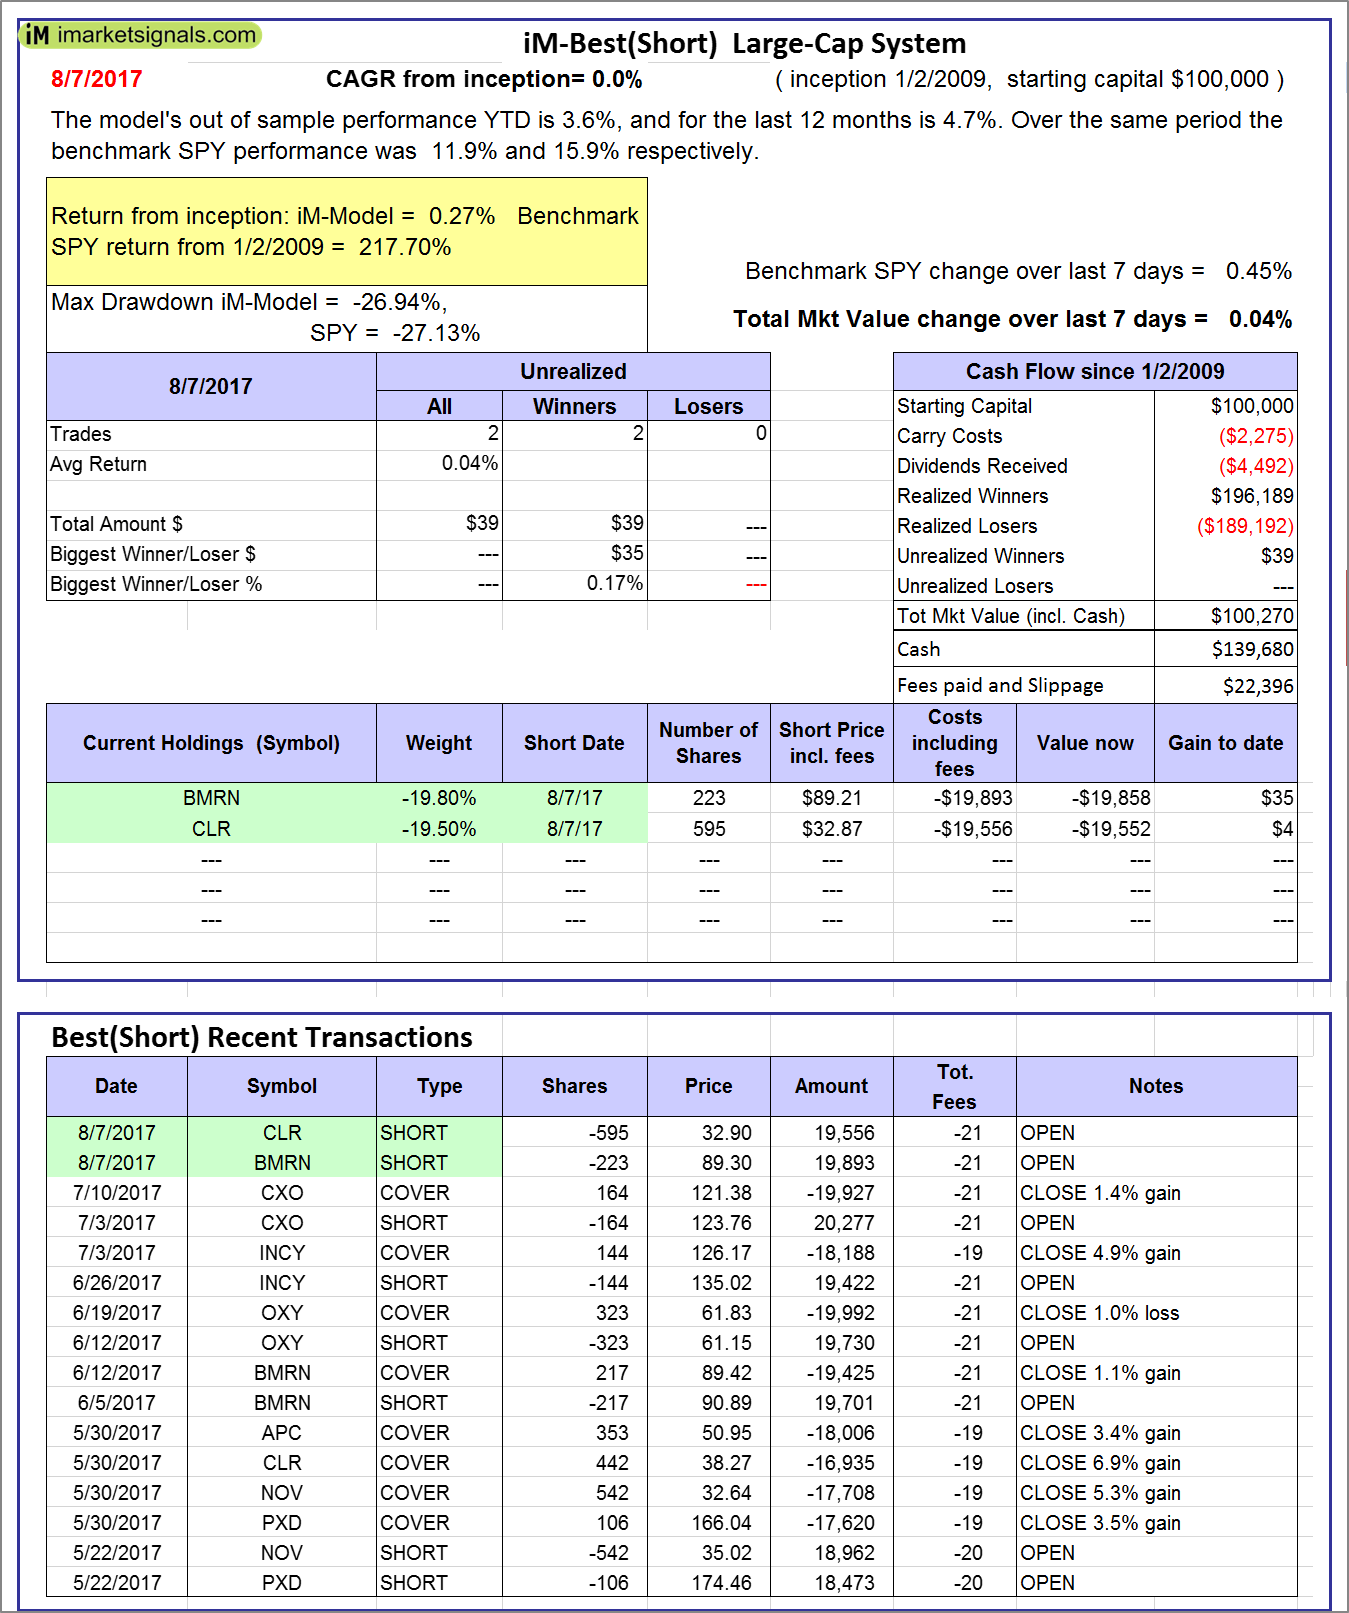 |
iM-Best(Short): The model’s out of sample performance YTD is 3.6%, and for the last 12 months is 4.7%. Over the same period the benchmark SPY performance was 11.9% and 15.9% respectively. Over the previous week the market value of iM-Best(Short) gained 0.04% at a time when SPY gained 0.45%. Over the period 1/2/2009 to 8/7/2017 the starting capital of $100,000 would have grown to $100,270 which includes $139,680 cash and excludes $22,396 spent on fees and slippage. |
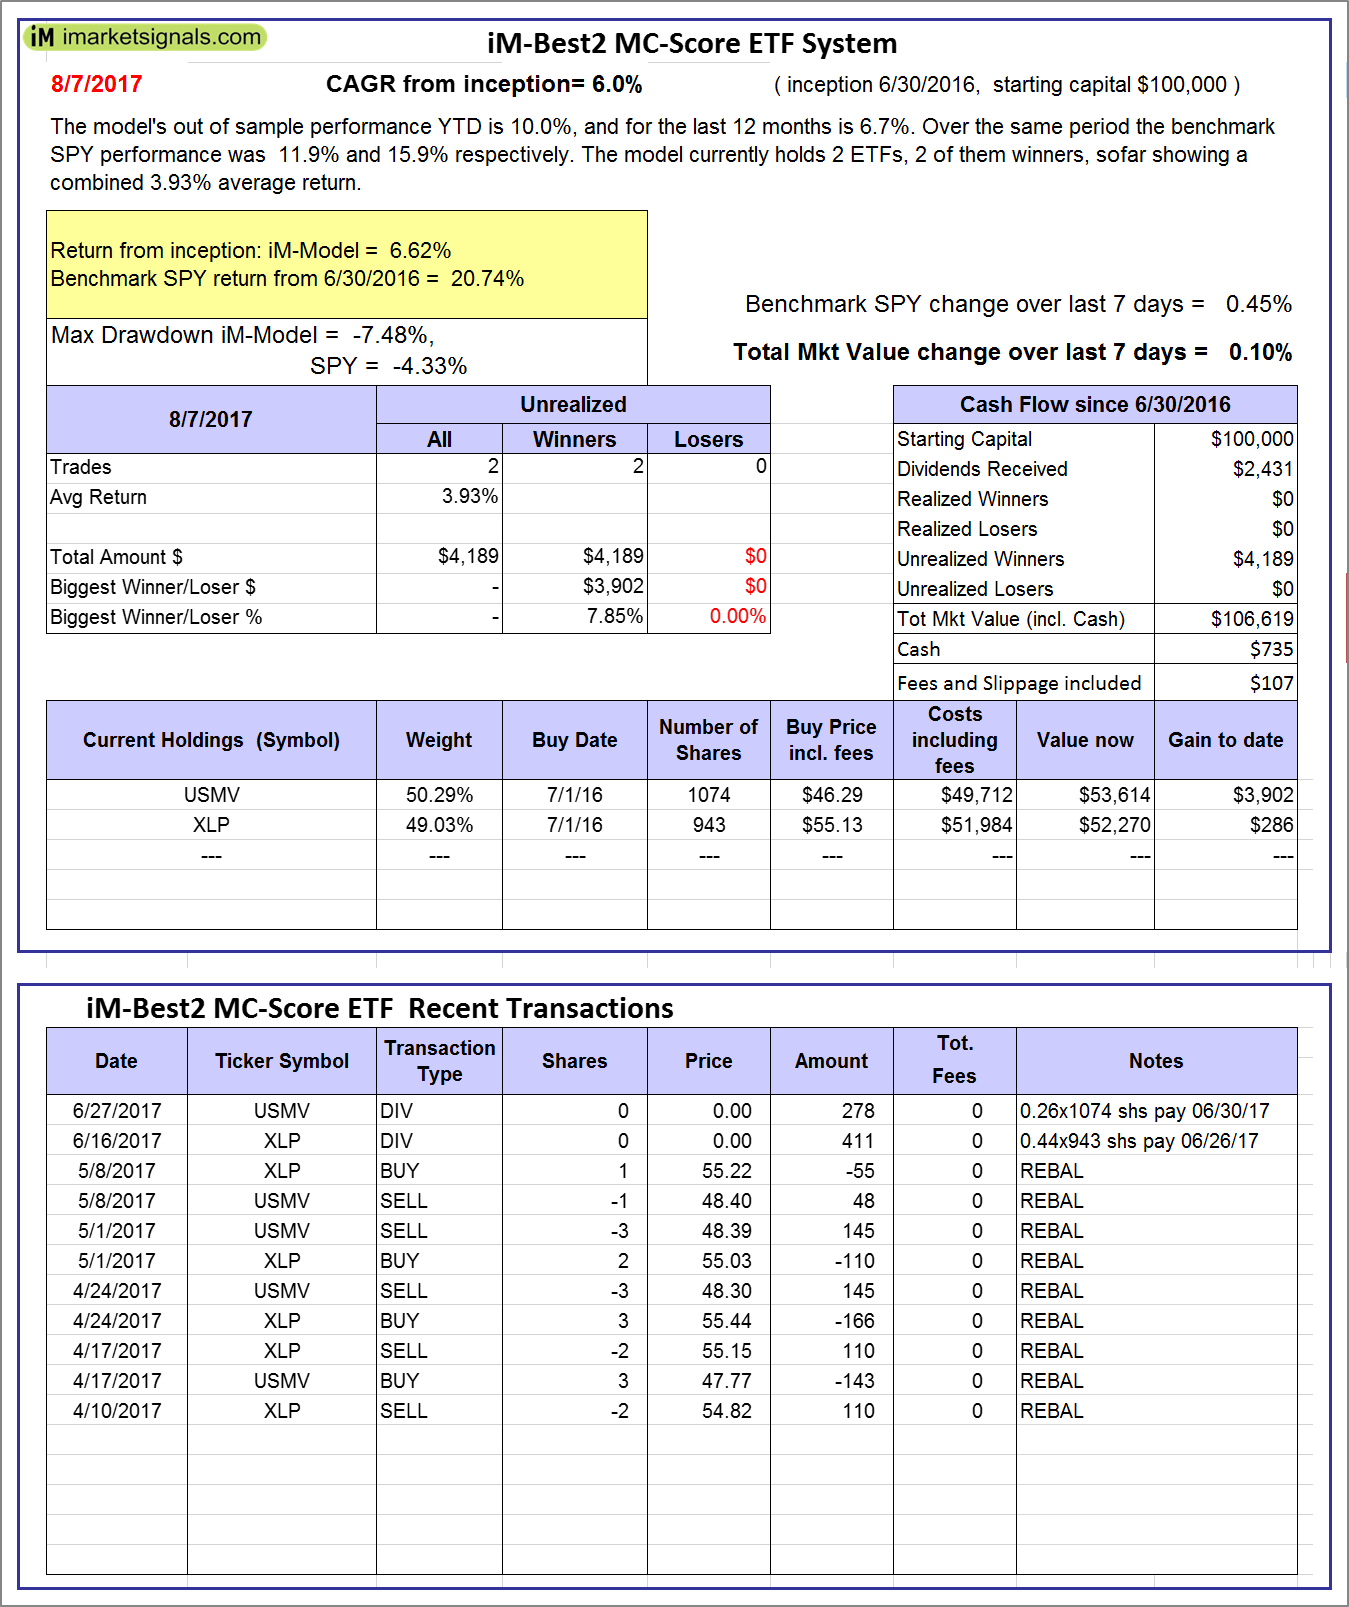 |
iM-Best2 MC-Score ETF System: The model’s out of sample performance YTD is 10.0%, and for the last 12 months is 6.7%. Over the same period the benchmark SPY performance was 11.9% and 15.9% respectively. Over the previous week the market value of the iM-Best2 MC-Score ETF System gained 0.10% at a time when SPY gained 0.45%. A starting capital of $100,000 at inception on 6/30/2016 would have grown to $106,619 which includes $735 cash and excludes $107 spent on fees and slippage. |
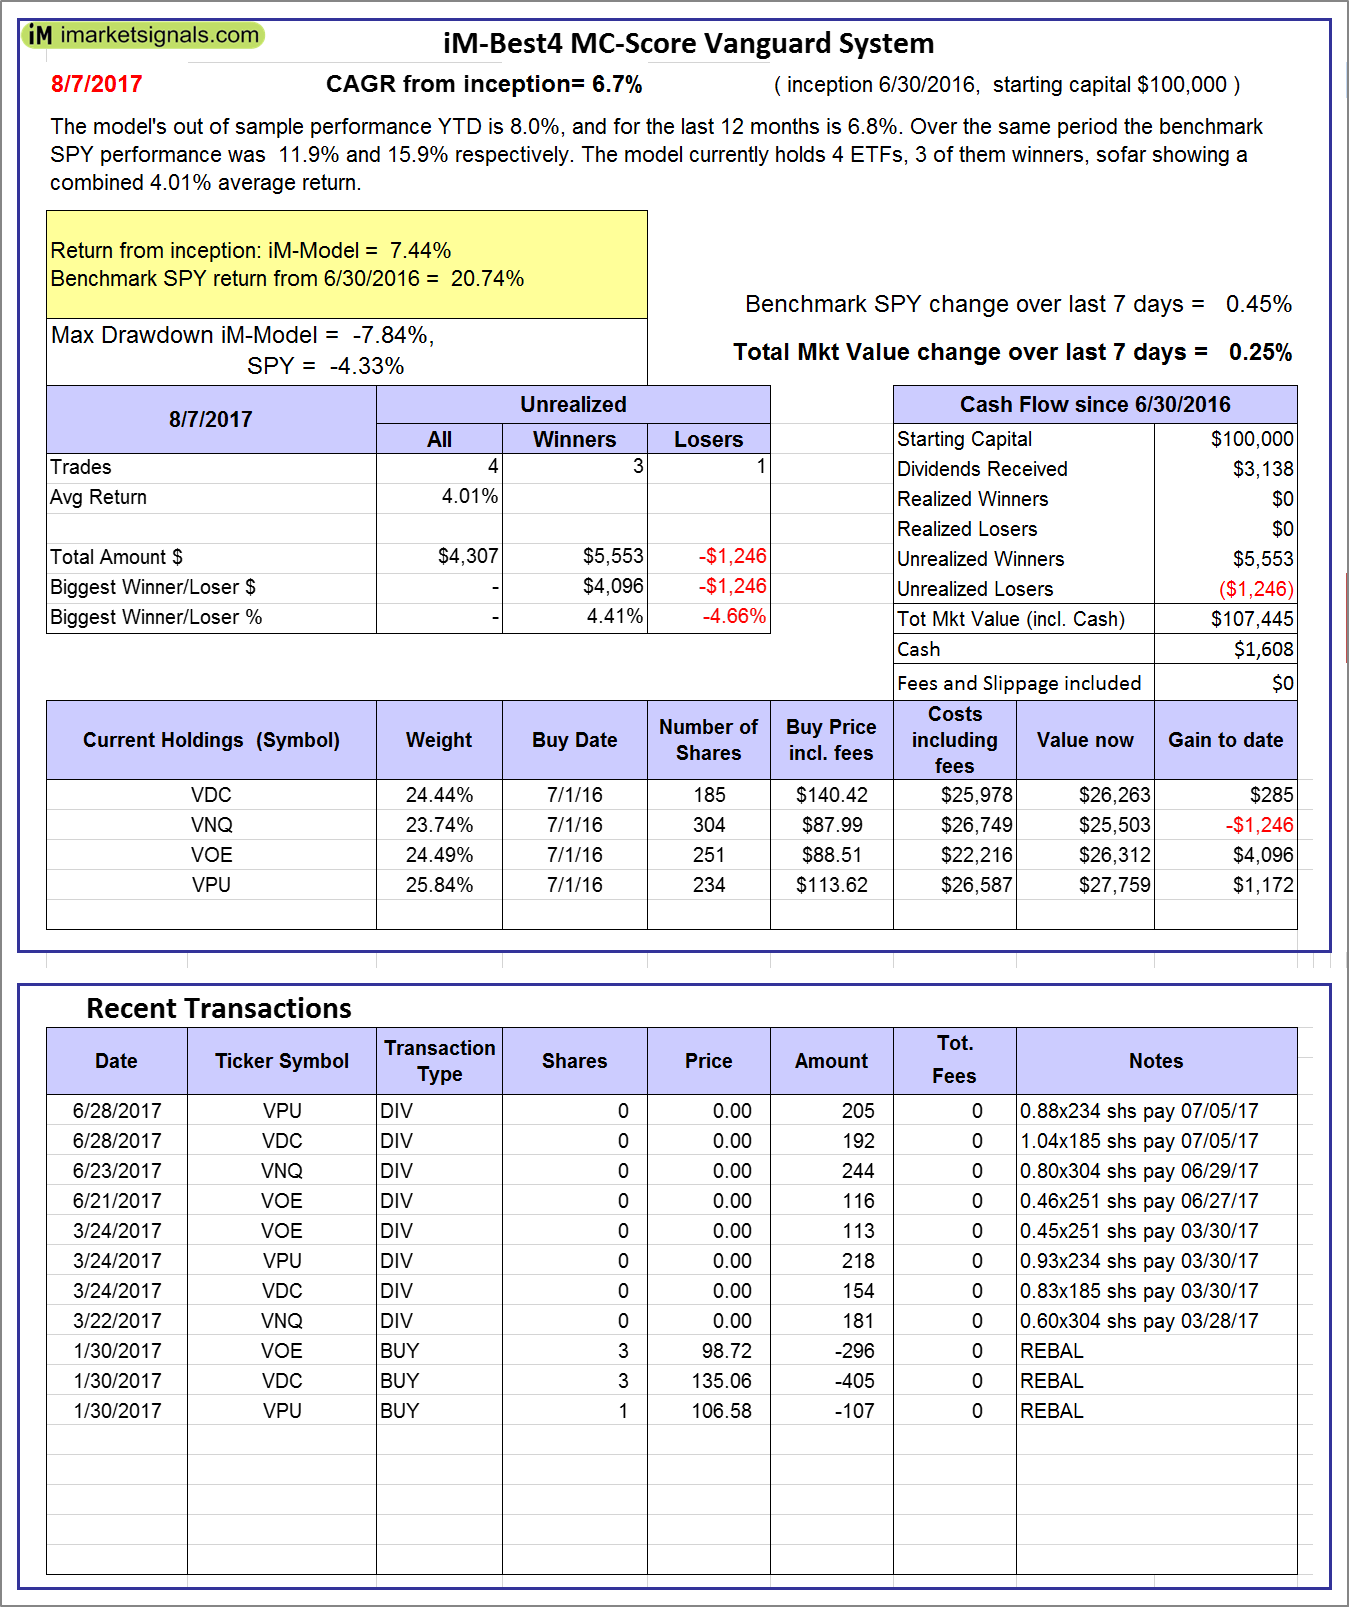 |
iM-Best4 MC-Score Vanguard System: The model’s out of sample performance YTD is 8.0%, and for the last 12 months is 6.8%. Over the same period the benchmark SPY performance was 11.9% and 15.9% respectively. Over the previous week the market value of the iM-Best4 MC-Score Vanguard System gained 0.25% at a time when SPY gained 0.45%. A starting capital of $100,000 at inception on 6/30/2016 would have grown to $107,445 which includes $1,608 cash and excludes $00 spent on fees and slippage. |
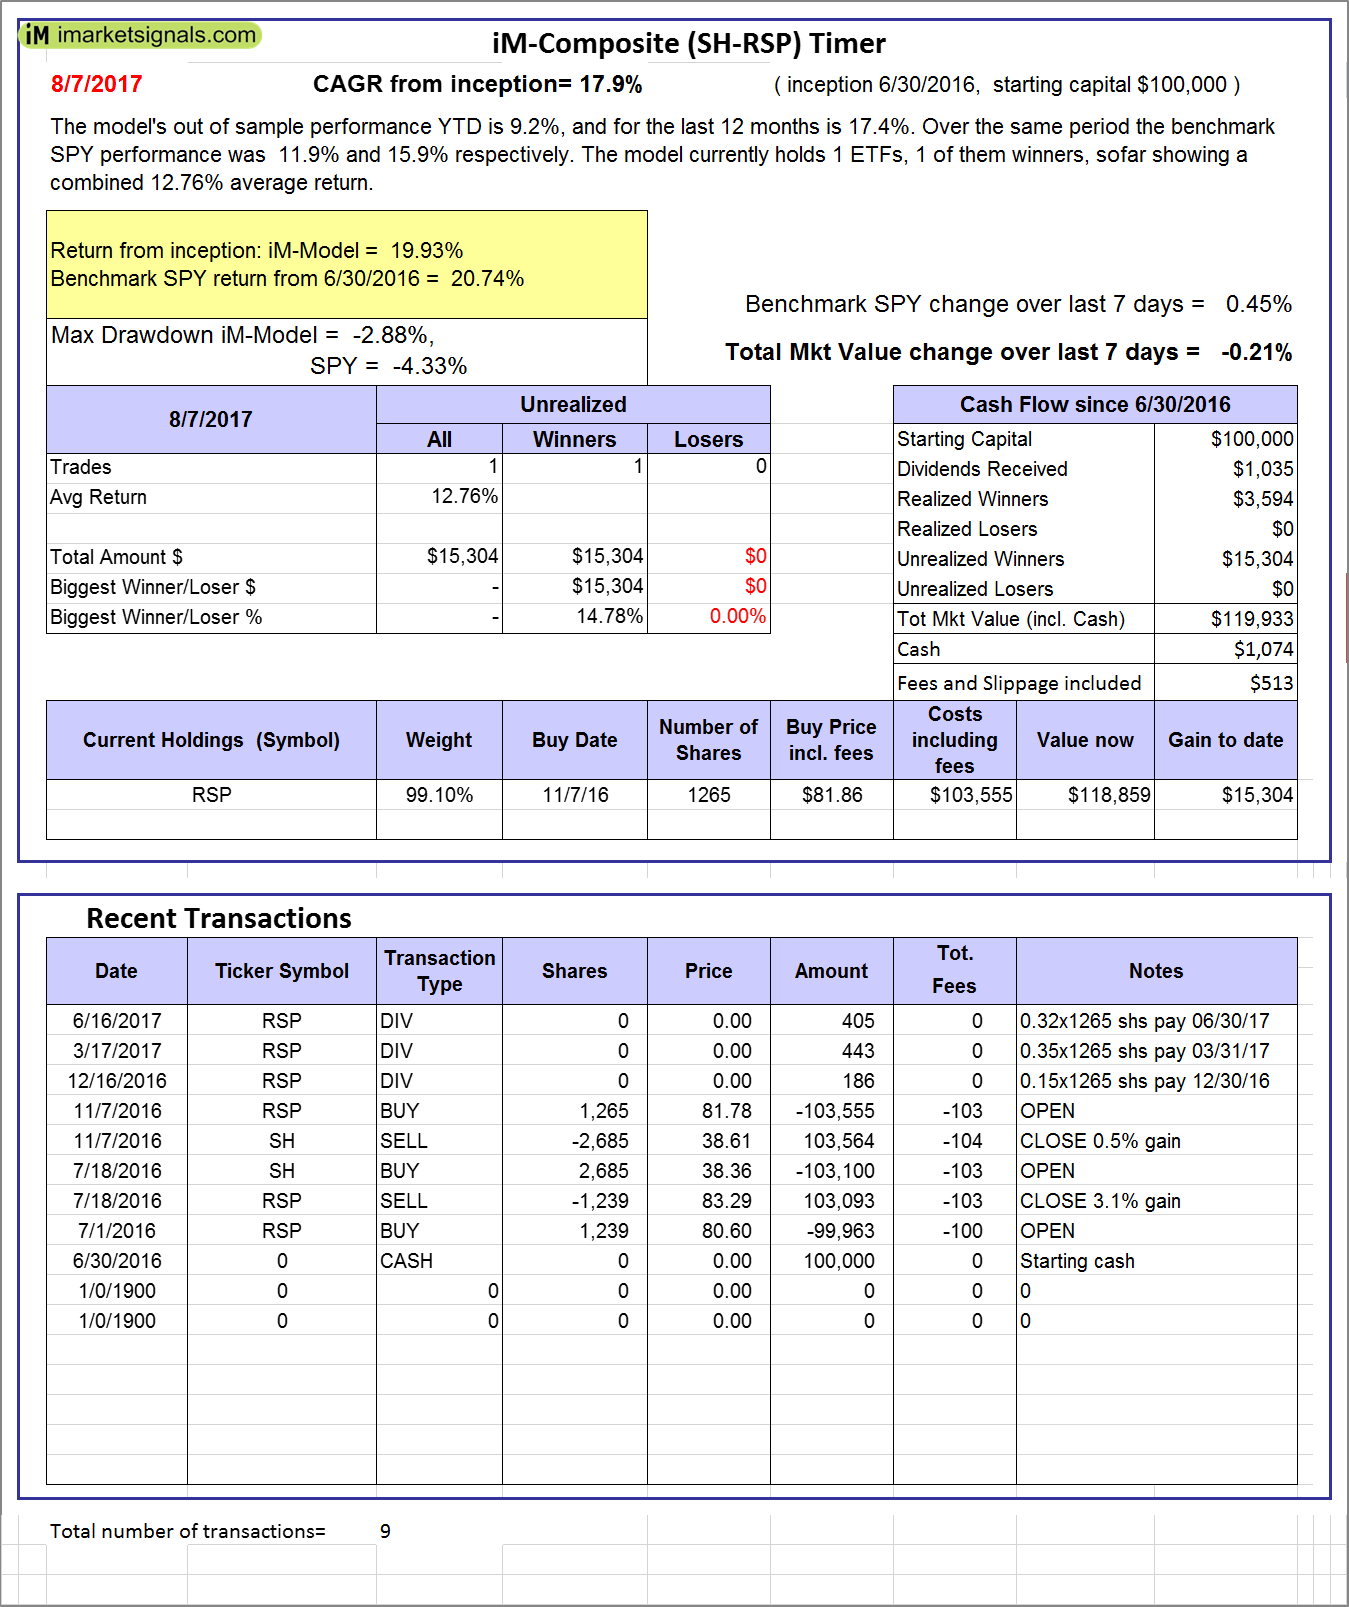 |
iM-Composite (SH-RSP) Timer: The model’s out of sample performance YTD is 9.2%, and for the last 12 months is 17.4%. Over the same period the benchmark SPY performance was 11.9% and 15.9% respectively. Over the previous week the market value of the iM-Composite (SH-RSP) Timer gained -0.21% at a time when SPY gained 0.45%. A starting capital of $100,000 at inception on 6/30/2016 would have grown to $119,933 which includes $1,074 cash and excludes $513 spent on fees and slippage. |
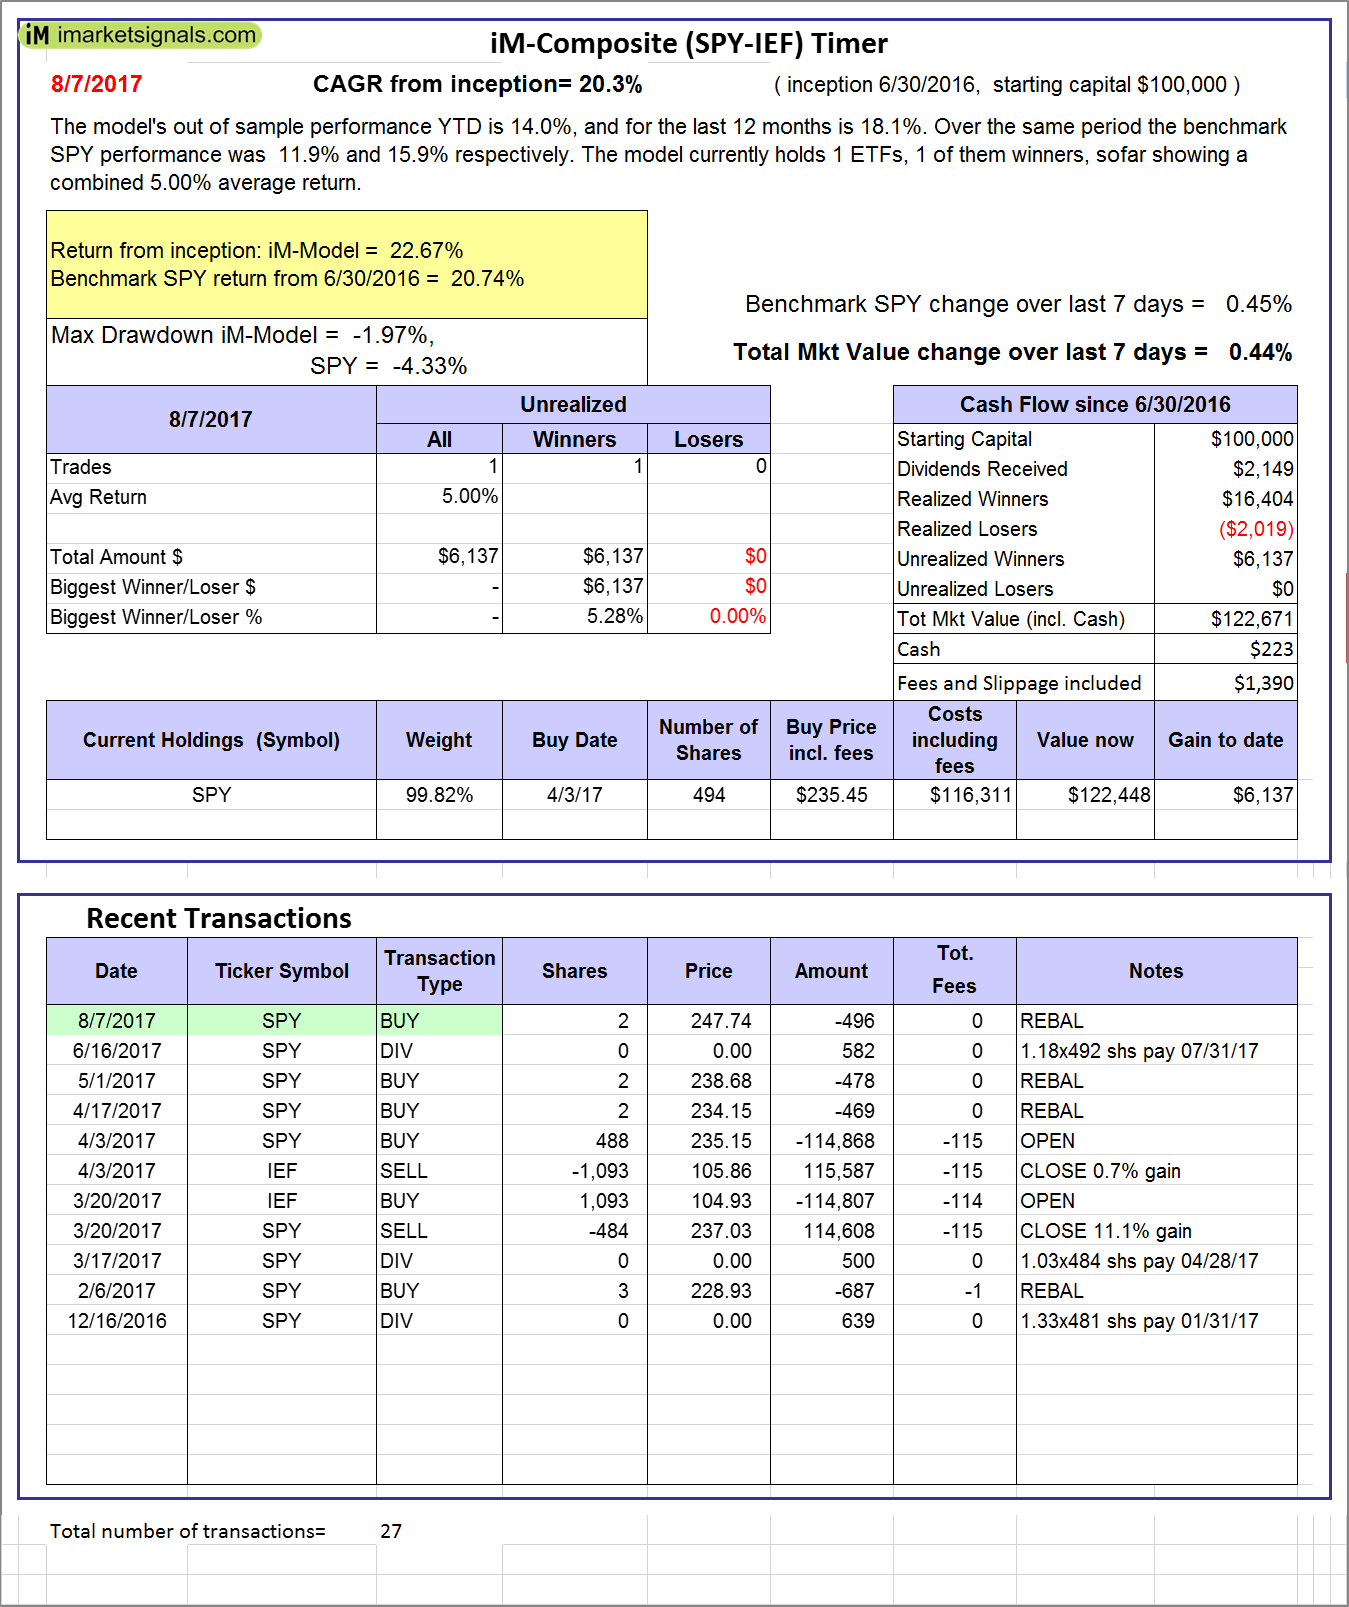 |
iM-Composite (SPY-IEF) Timer: The model’s out of sample performance YTD is 14.0%, and for the last 12 months is 18.1%. Over the same period the benchmark SPY performance was 11.9% and 15.9% respectively. Over the previous week the market value of the iM-Composite (SPY-IEF) Timer gained 0.44% at a time when SPY gained 0.45%. A starting capital of $100,000 at inception on 6/30/2016 would have grown to $122,671 which includes $223 cash and excludes $1,390 spent on fees and slippage. |
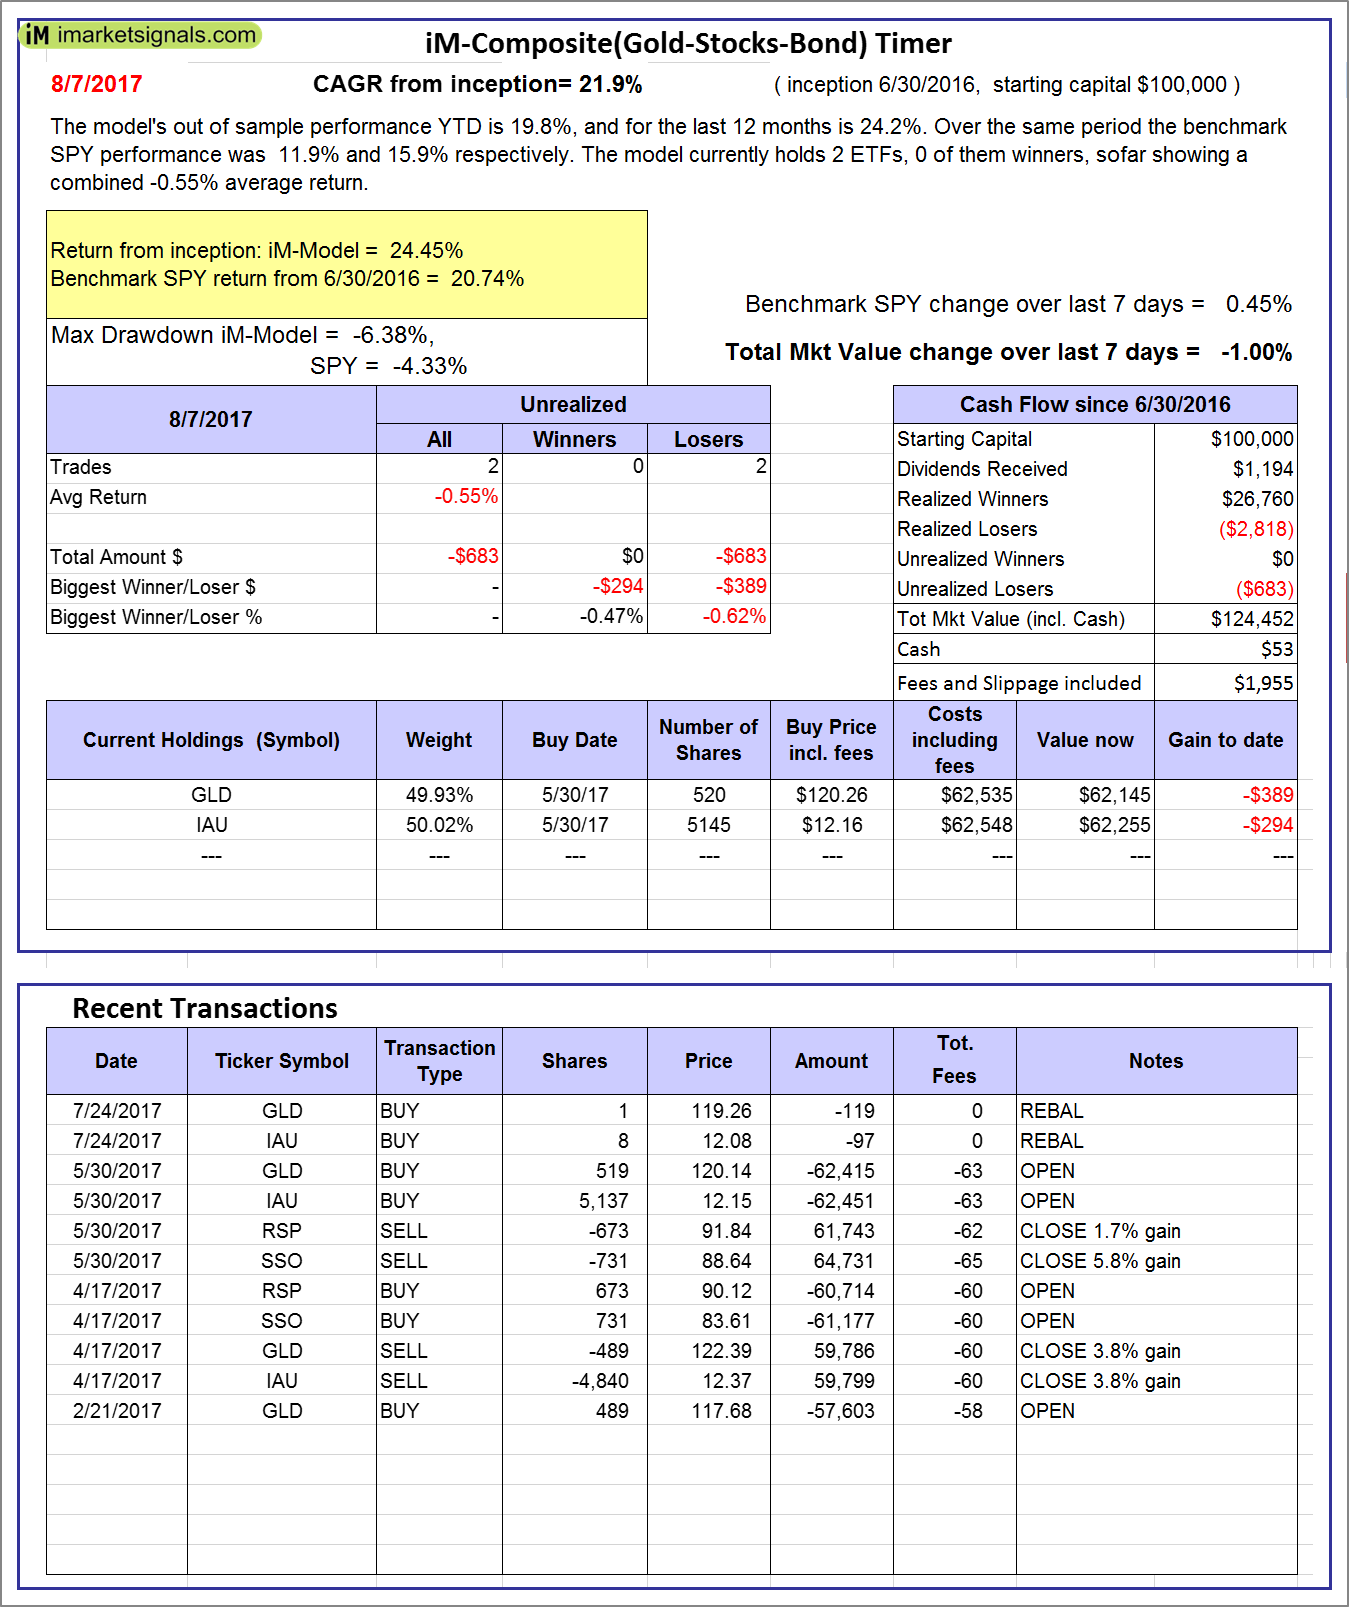 |
iM-Composite(Gold-Stocks-Bond) Timer: The model’s out of sample performance YTD is 19.8%, and for the last 12 months is 24.2%. Over the same period the benchmark SPY performance was 11.9% and 15.9% respectively. Over the previous week the market value of the iM-Composite(Gold-Stocks-Bond) Timer gained -1.00% at a time when SPY gained 0.45%. A starting capital of $100,000 at inception on 6/30/2016 would have grown to $124,452 which includes $53 cash and excludes $1,955 spent on fees and slippage. |
 |
iM-Low Turnover Composite Timer Combo: The model’s out of sample performance from inception is 2.8%. The benchmark SPY performance over the same period is 6.5%. Over the previous week the market value of the iM-Low Turnover Composite Timer Combo gained -0.18% at a time when SPY gained 0.45%. A starting capital of $100,000 at inception on 3/24/27 would have grown to $102,815 which includes $645 cash and excludes $69 spent on fees and slippage. |
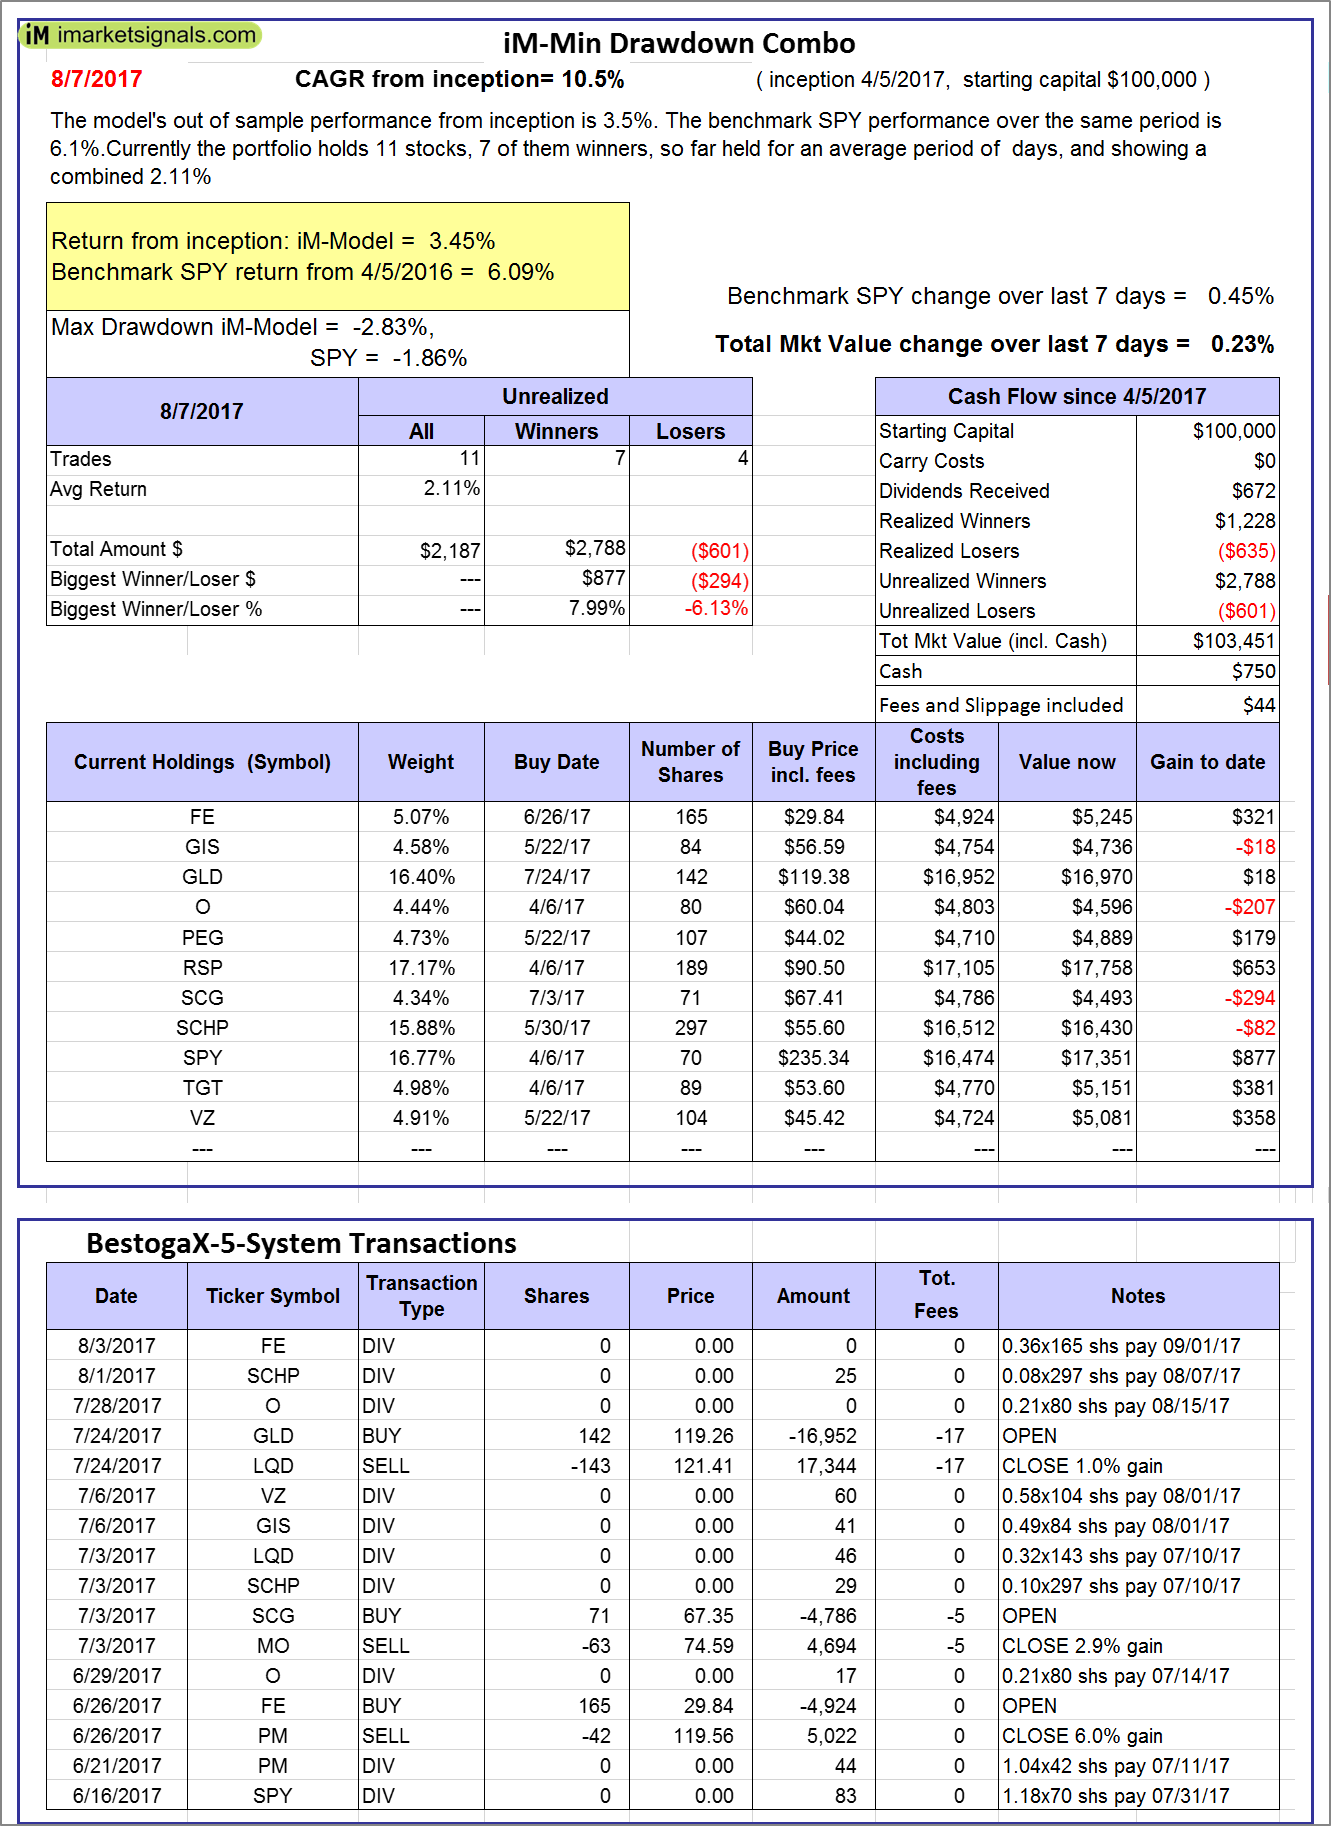 |
iM-Min Drawdown Combo: The model’s out of sample performance from inception is 3.5%. The benchmark SPY performance over the same period is 6.1%. Over the previous week the market value of the iM-Min Drawdown Combo gained 0.23% at a time when SPY gained 0.45%. A starting capital of $100,000 at inception on 4/5/2017 would have grown to $103,451 which includes $750 cash and excludes $44 spent on fees and slippage. |
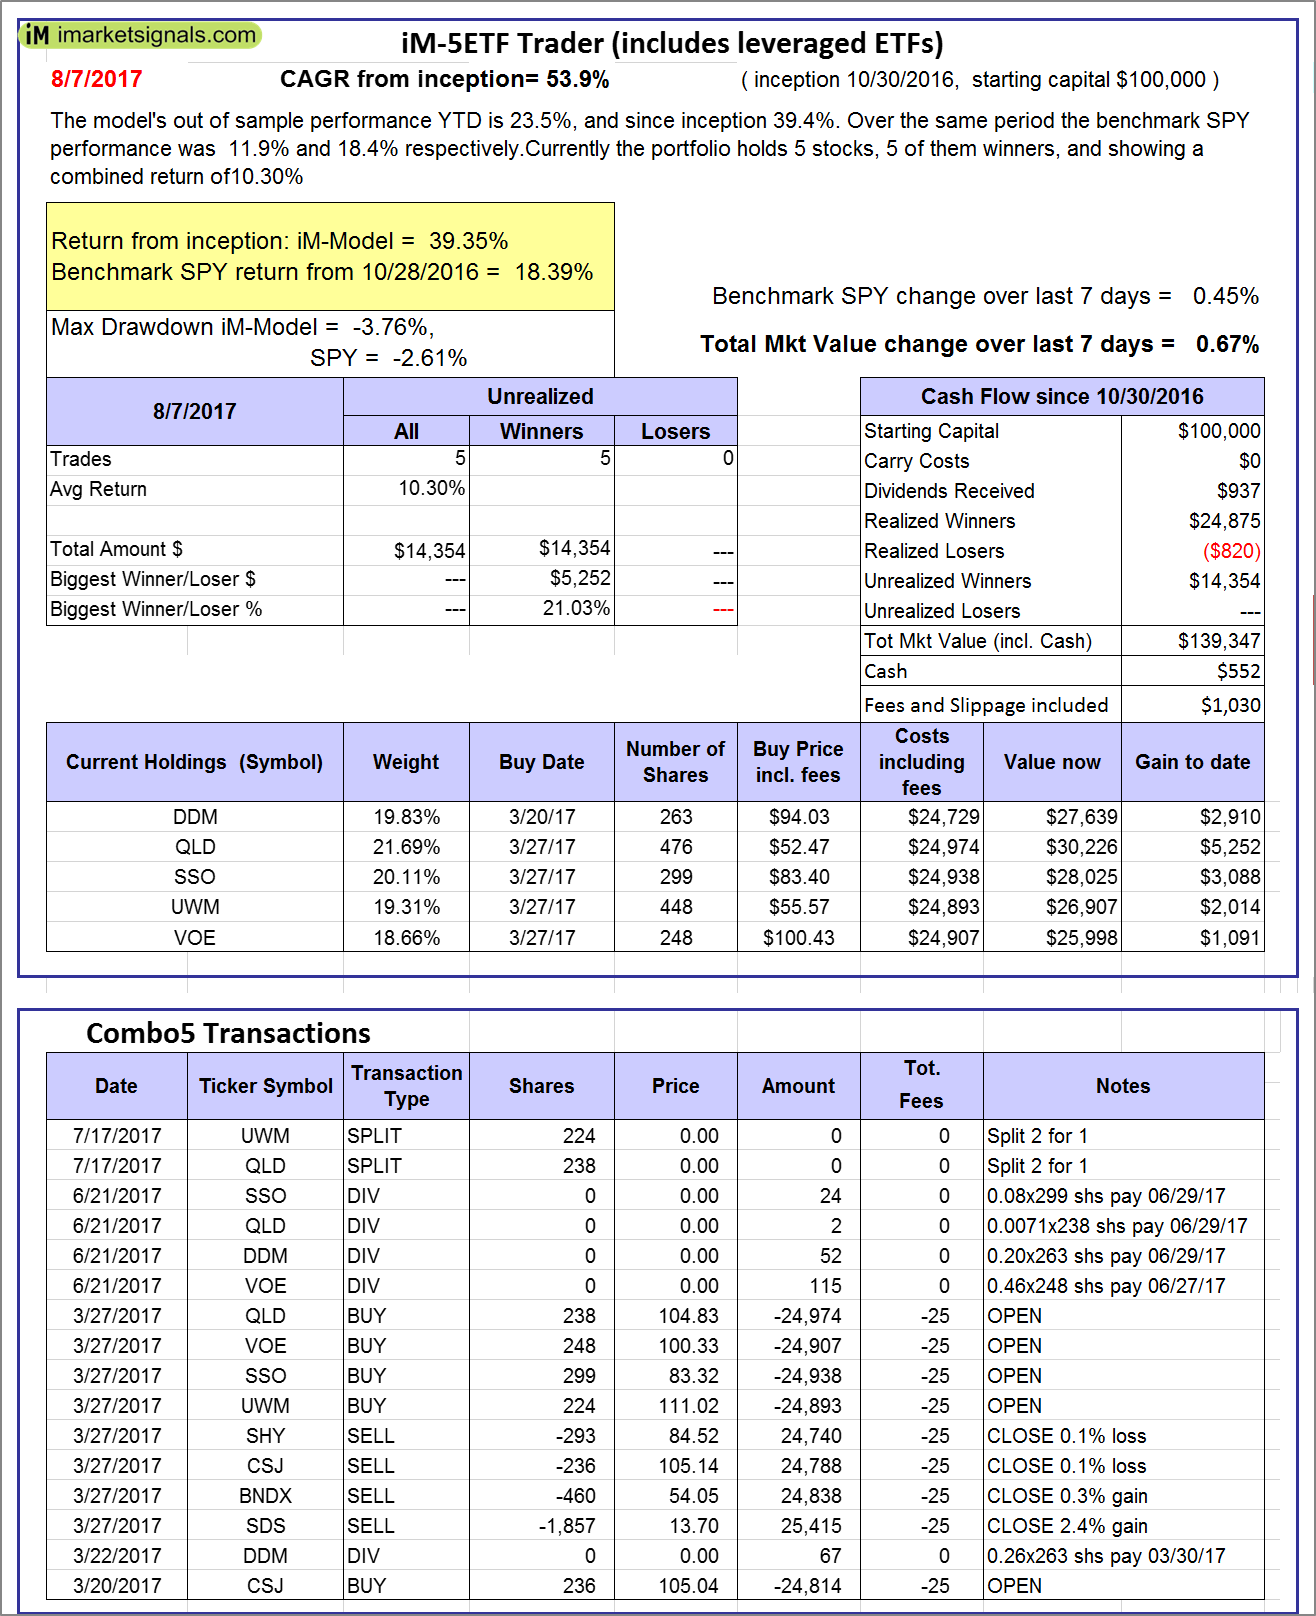 |
iM-5ETF Trader (includes leveraged ETFs): The model’s out of sample performance YTD is 12.4%, and since inception 15.6%. Over the same period the benchmark SPY performance was 11.9% and 18.4% respectively. Over the previous week the market value of the iM-5ETF Trader (includes leveraged ETFs) gained 0.67% at a time when SPY gained 0.45%. A starting capital of $100,000 at inception on 10/30/2016 would have grown to $139,347 which includes $552 cash and excludes $1,030 spent on fees and slippage. |
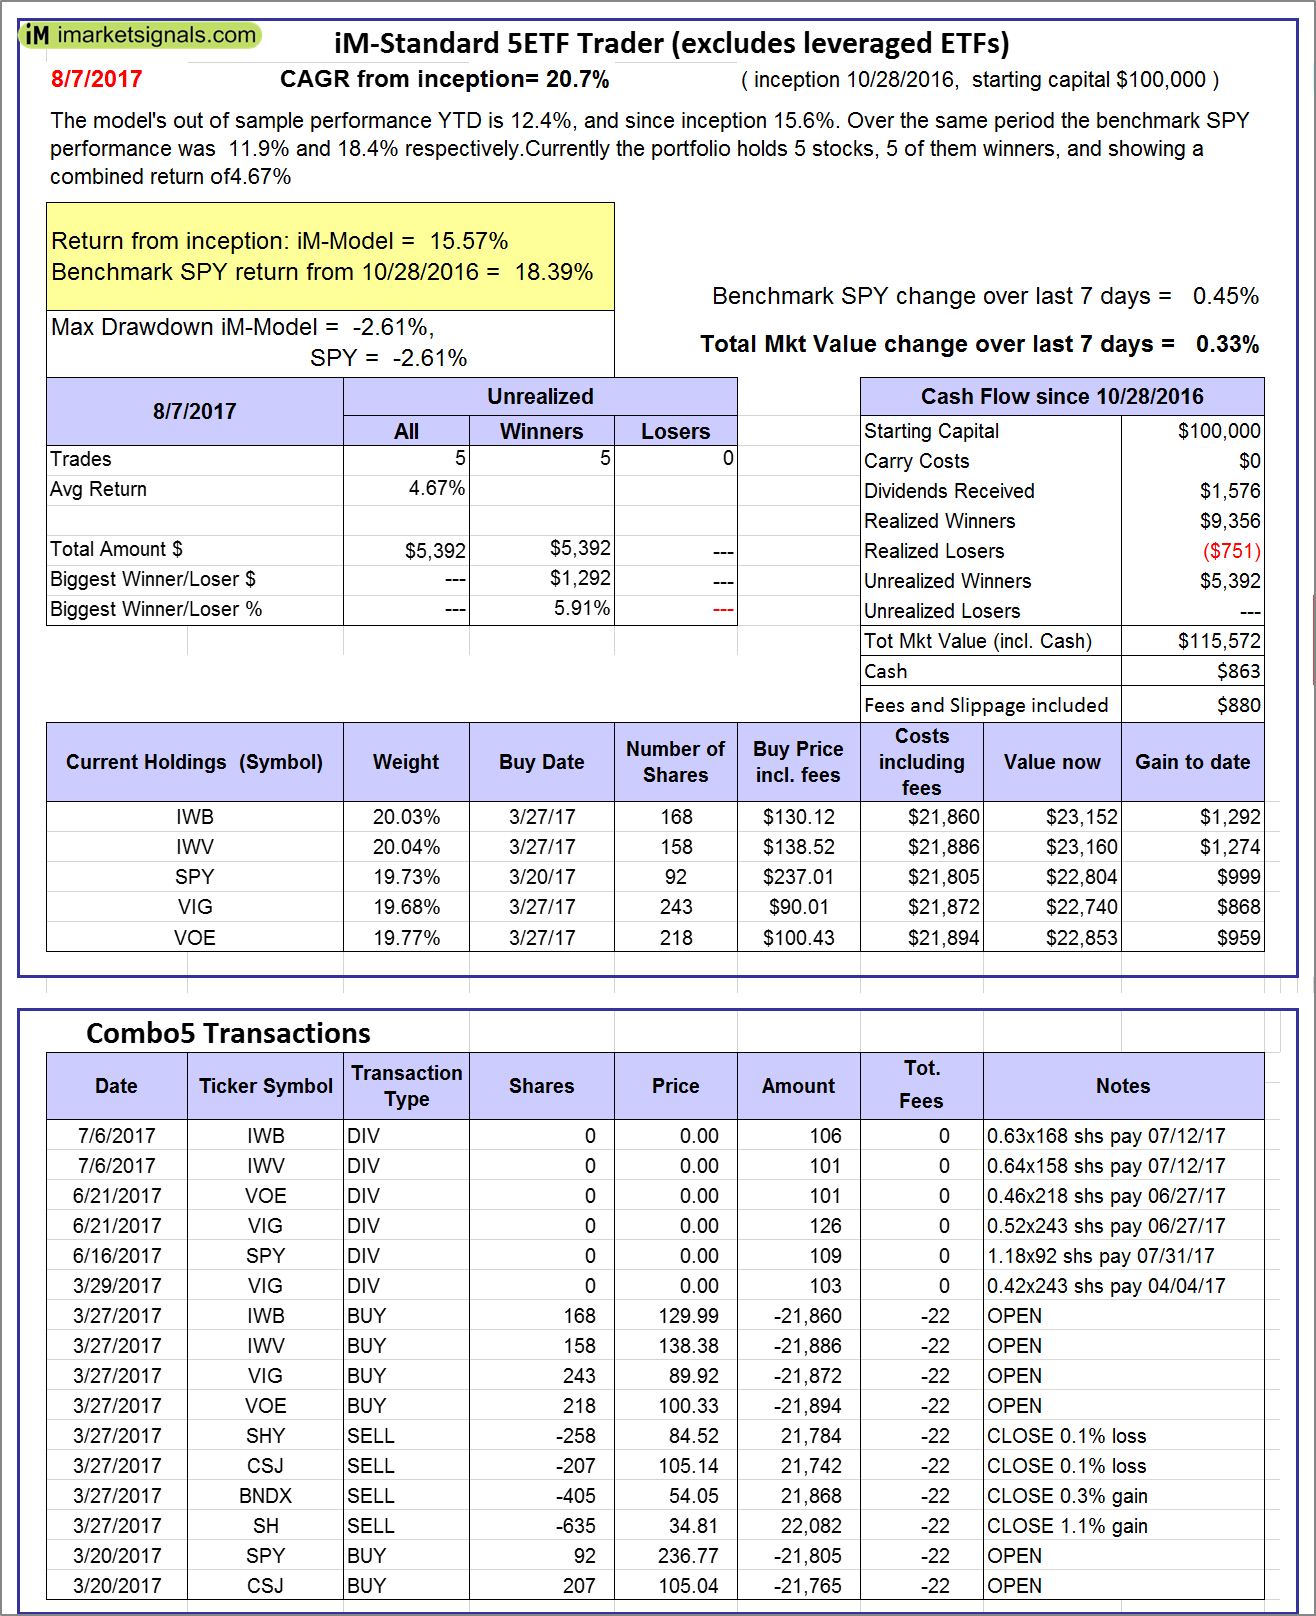 |
iM-Standard 5ETF Trader (excludes leveraged ETFs): The model’s out of sample performance YTD is 12.4%, and since inception 15.6%. Over the same period the benchmark SPY performance was 11.9% and 18.4% respectively. Over the previous week the market value of the iM-Standard 5ETF Trader (excludes leveraged ETFs) gained 0.33% at a time when SPY gained 0.45%. A starting capital of $100,000 at inception on 10/30/2016 would have grown to $115,572 which includes $863 cash and excludes $880 spent on fees and slippage. |
Posted in pmp SPY-SH

With reference to Section 202(a)(11)(D) of the Investment Advisers Act:
We are Engineers and not Investment Advisers,
read more ...
By the mere act of reading this page and navigating this site you acknowledge, agree to, and abide by the
Terms of Use / Disclaimer