
  |
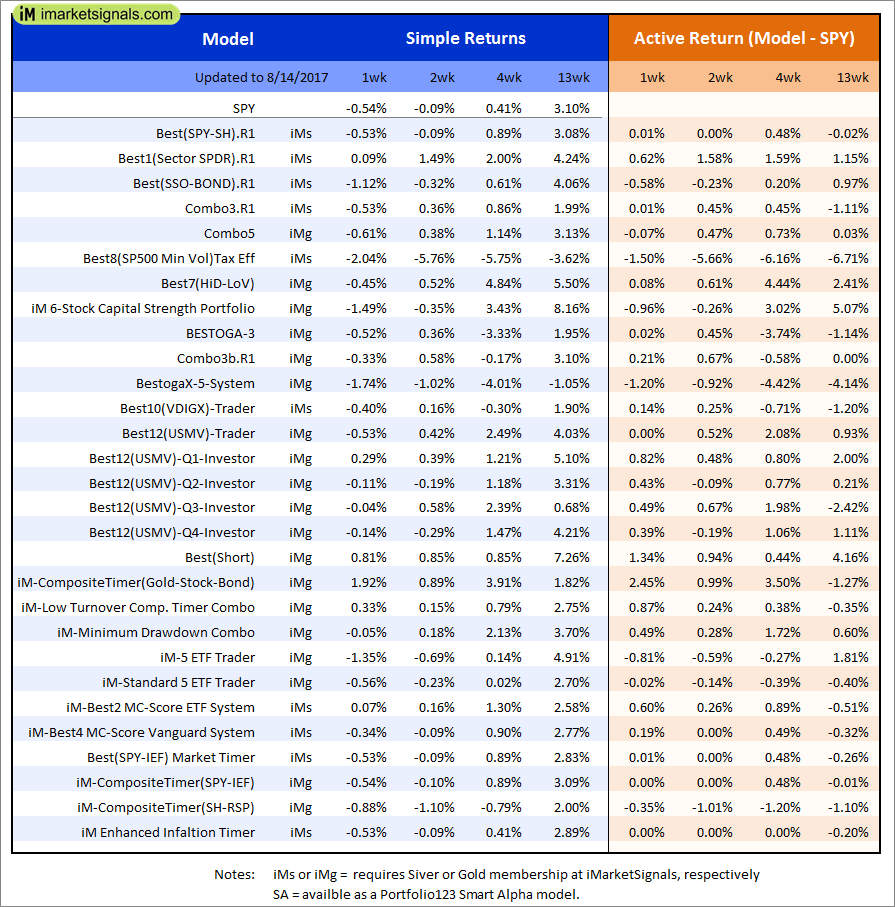
Out of sample performance summary of our models for the past 1, 2, 4 and 13 week periods. The active active return indicates how the models over- or underperformed the benchmark ETF SPY. Also the YTD, and the 1-, 3-, 5- and 10-year annualized returns are shown in the second table |
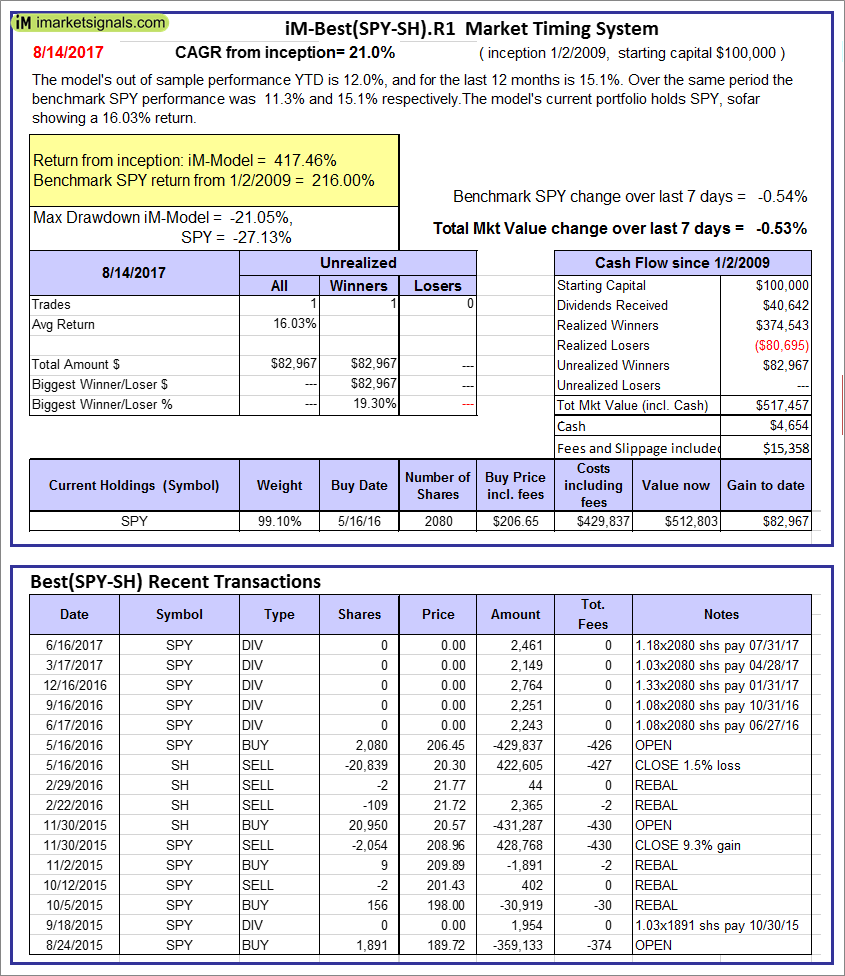 |
iM-Best(SPY-SH).R1: The model’s out of sample performance YTD is 12.0%, and for the last 12 months is 15.1%. Over the same period the benchmark SPY performance was 11.3% and 15.1% respectively. Over the previous week the market value of Best(SPY-SH) gained -0.53% at a time when SPY gained -0.54%. A starting capital of $100,000 at inception on 1/2/2009 would have grown to $517,457 which includes $4,654 cash and excludes $15,358 spent on fees and slippage. |
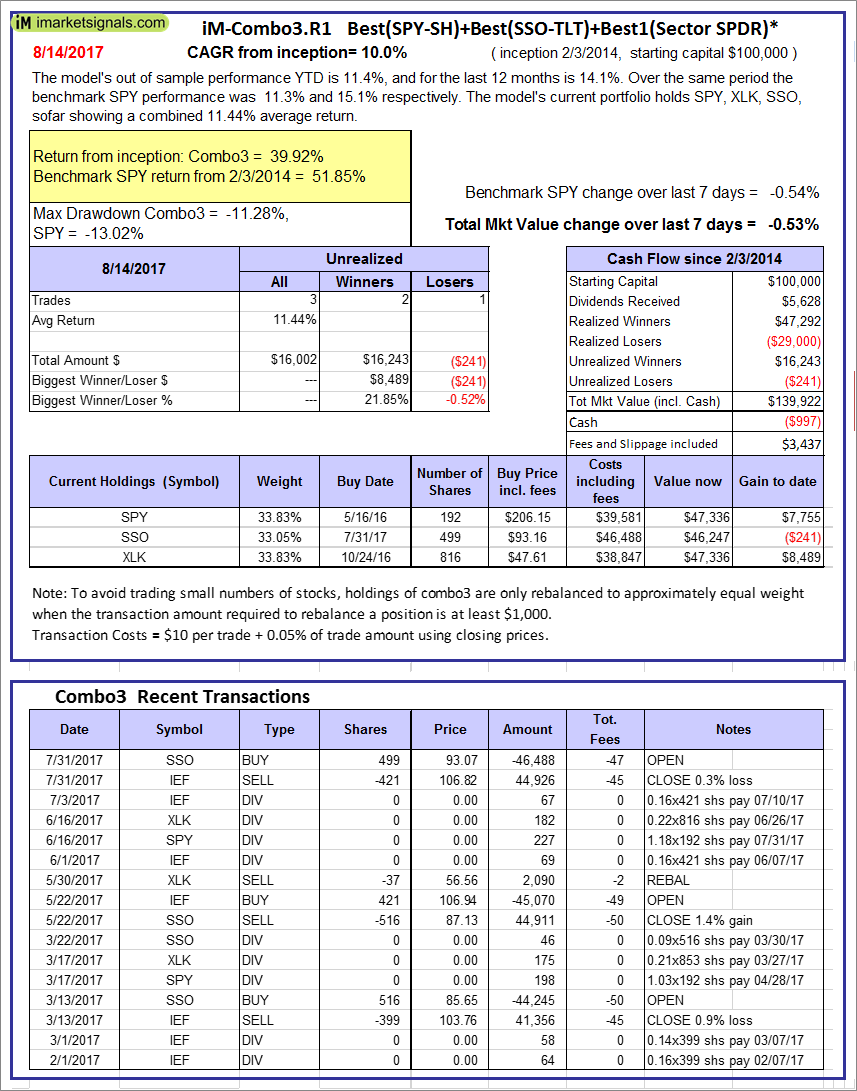 |
iM-Combo3.R1: The model’s out of sample performance YTD is 11.4%, and for the last 12 months is 14.1%. Over the same period the benchmark SPY performance was 11.3% and 15.1% respectively. Over the previous week the market value of iM-Combo3.R1 gained -0.53% at a time when SPY gained -0.54%. A starting capital of $100,000 at inception on 2/3/2014 would have grown to $139,922 which includes -$997 cash and excludes $3,437 spent on fees and slippage. |
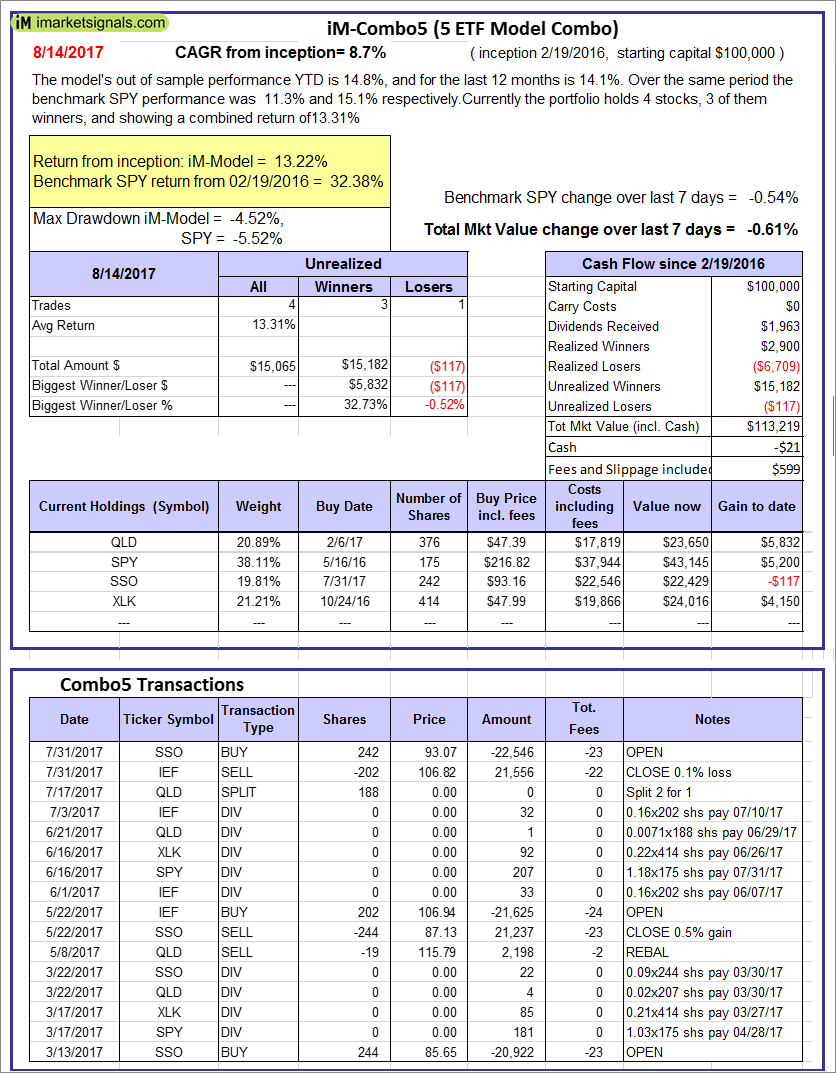 |
iM-Combo5: The model’s out of sample performance YTD is 14.8%, and for the last 12 months is 14.1%. Over the same period the benchmark SPY performance was 11.3% and 15.1% respectively. Over the previous week the market value of iM-Combo5 gained -0.61% at a time when SPY gained -0.54%. A starting capital of $100,000 at inception on 2/22/2016 would have grown to $113,219 which includes -$21 cash and excludes $599 spent on fees and slippage. |
 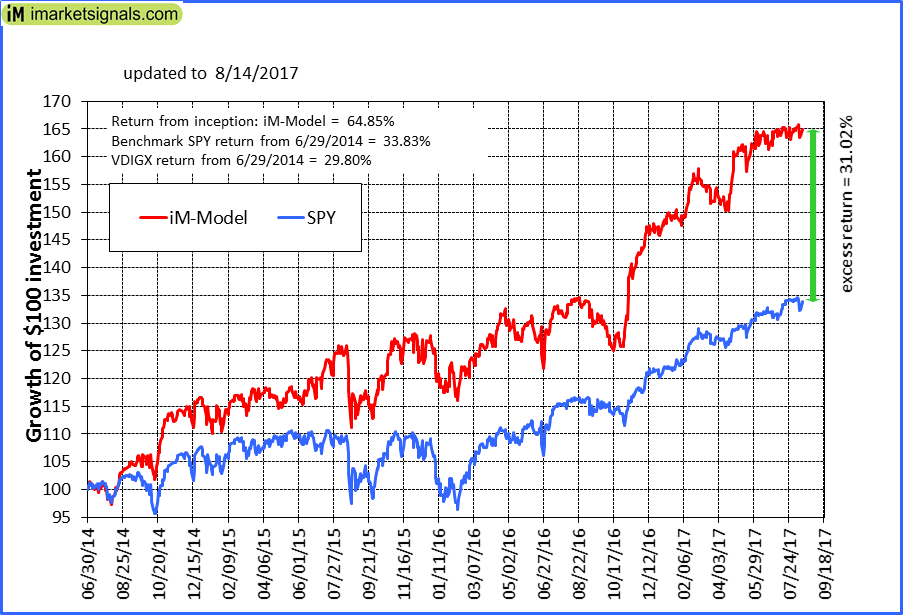 |
iM-Best10(VDIGX)-Trader: The model’s out of sample performance YTD is 13.1%, and for the last 12 months is 23.0%. Over the same period the benchmark SPY performance was 11.3% and 15.1% respectively. Since inception, on 7/1/2014, the model gained 64.85% while the benchmark SPY gained 33.83% and VDIGX gained 29.80% over the same period. Over the previous week the market value of iM-Best10(VDIGX) gained -0.40% at a time when SPY gained -0.54%. A starting capital of $100,000 at inception on 7/1/2014 would have grown to $163,751 which includes $6,027 cash and excludes $1,588 spent on fees and slippage. |
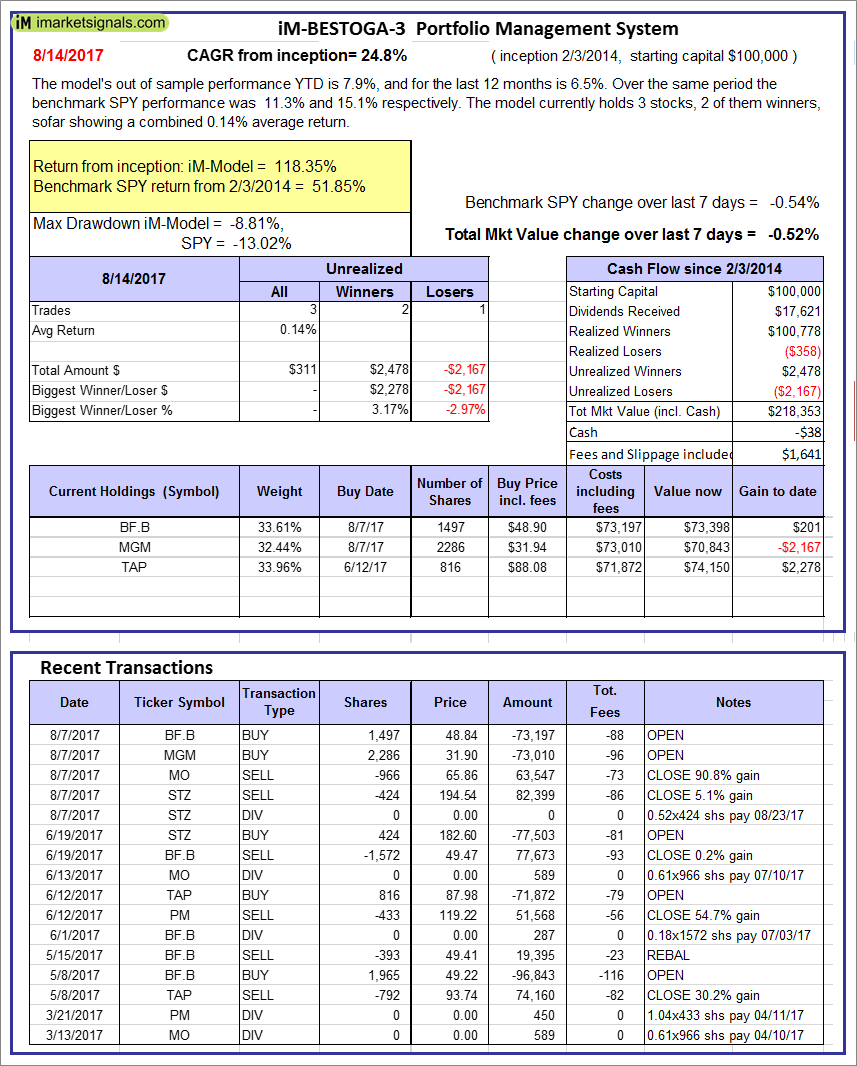 |
iM-BESTOGA-3: The model’s out of sample performance YTD is 7.9%, and for the last 12 months is 6.5%. Over the same period the benchmark SPY performance was 11.3% and 15.1% respectively. Over the previous week the market value of iM-BESTOGA-3 gained -0.52% at a time when SPY gained -0.54%. A starting capital of $100,000 at inception on 2/3/2014 would have grown to $218,353 which includes -$38 cash and excludes $1,641 spent on fees and slippage. |
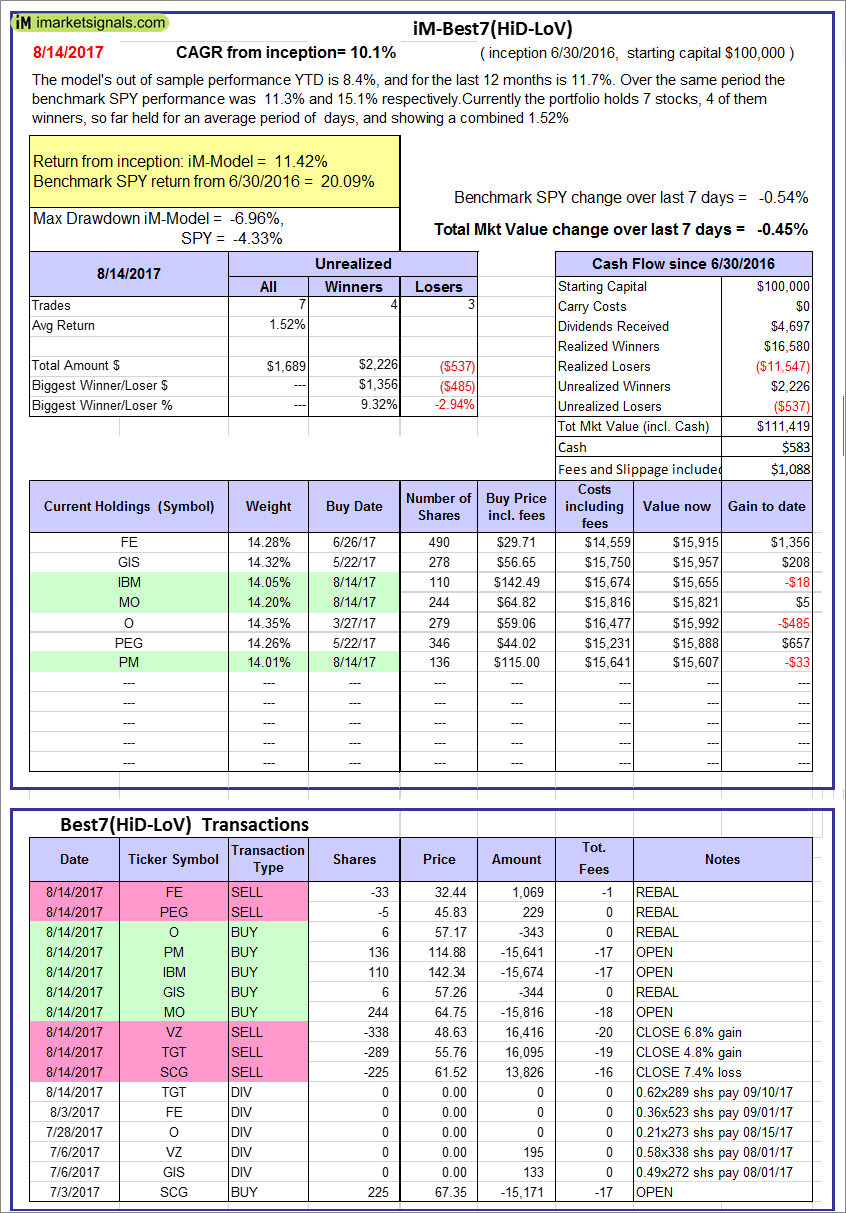 |
iM-Best7(HiD-LoV): The model’s out of sample performance YTD is 8.4%, and for the last 12 months is 11.7%. Over the same period the benchmark SPY performance was 11.3% and 15.1% respectively. Over the previous week the market value of iM-BESTOGA-3 gained -0.45% at a time when SPY gained -0.54%. A starting capital of $100,000 at inception on 6/30/2016 would have grown to $111,419 which includes $583 cash and excludes $1,088 spent on fees and slippage. |
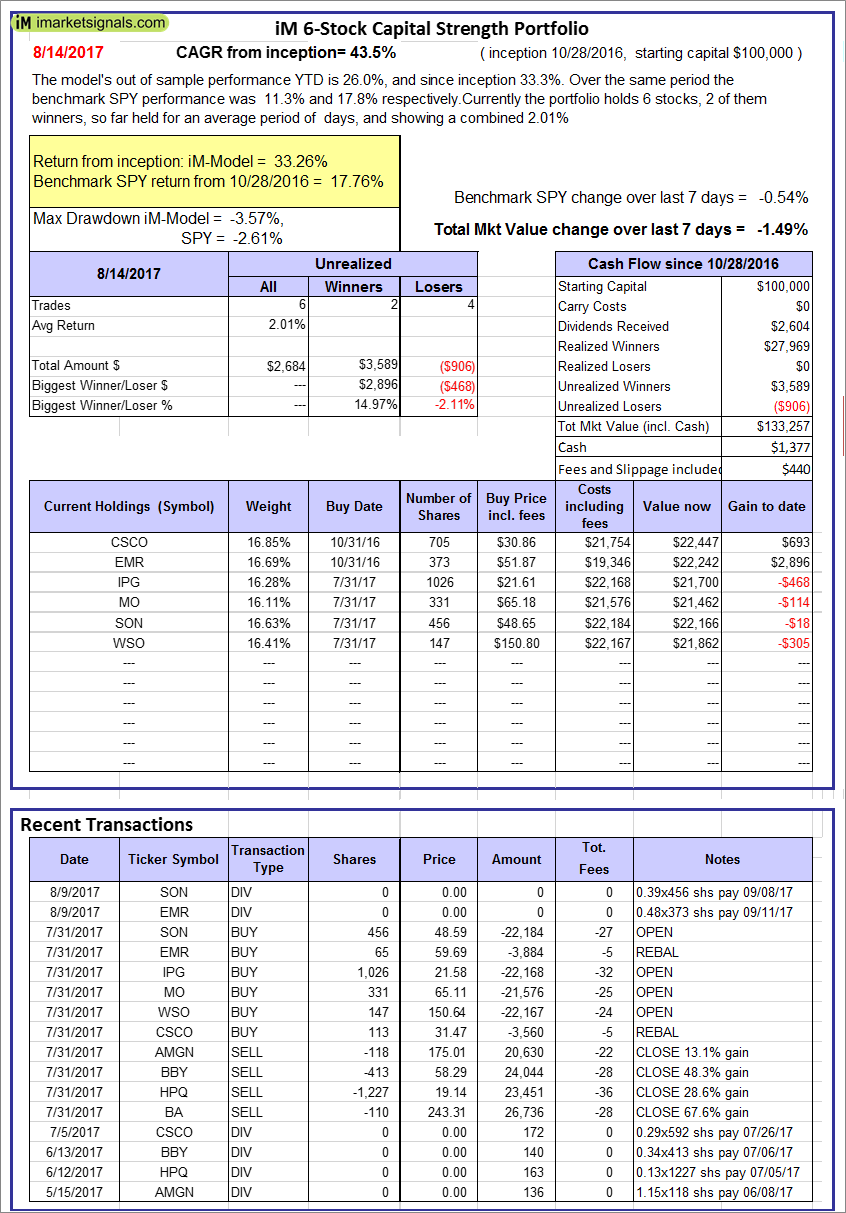 |
iM 6-Stock Capital Strength Portfolio: The model’s out of sample performance YTD is 26.0%, and since inception 33.3%. Over the same period the benchmark SPY performance was 11.3% and 17.8% respectively. Over the previous week the market value of the iM 6-Stock Capital Strength Portfolio gained -1.49% at a time when SPY gained -0.54%. A starting capital of $100,000 at inception on 10/28/2016 would have grown to $133,257 which includes $1,377 cash and excludes $440 spent on fees and slippage. |
 |
iM-BestogaX5-System: The model’s out of sample performance YTD is 7.9%, and for the last 12 months is 11.1%. Over the same period the benchmark SPY performance was 11.3% and 15.1% respectively. Over the previous week the market value of iM-Best8(S&P 500)Tax-Eff. gained -1.74% at a time when SPY gained -0.54%. A starting capital of $100,000 at inception on 3/28/2016 would have grown to $106,339 which includes $146 cash and excludes $786 spent on fees and slippage. |
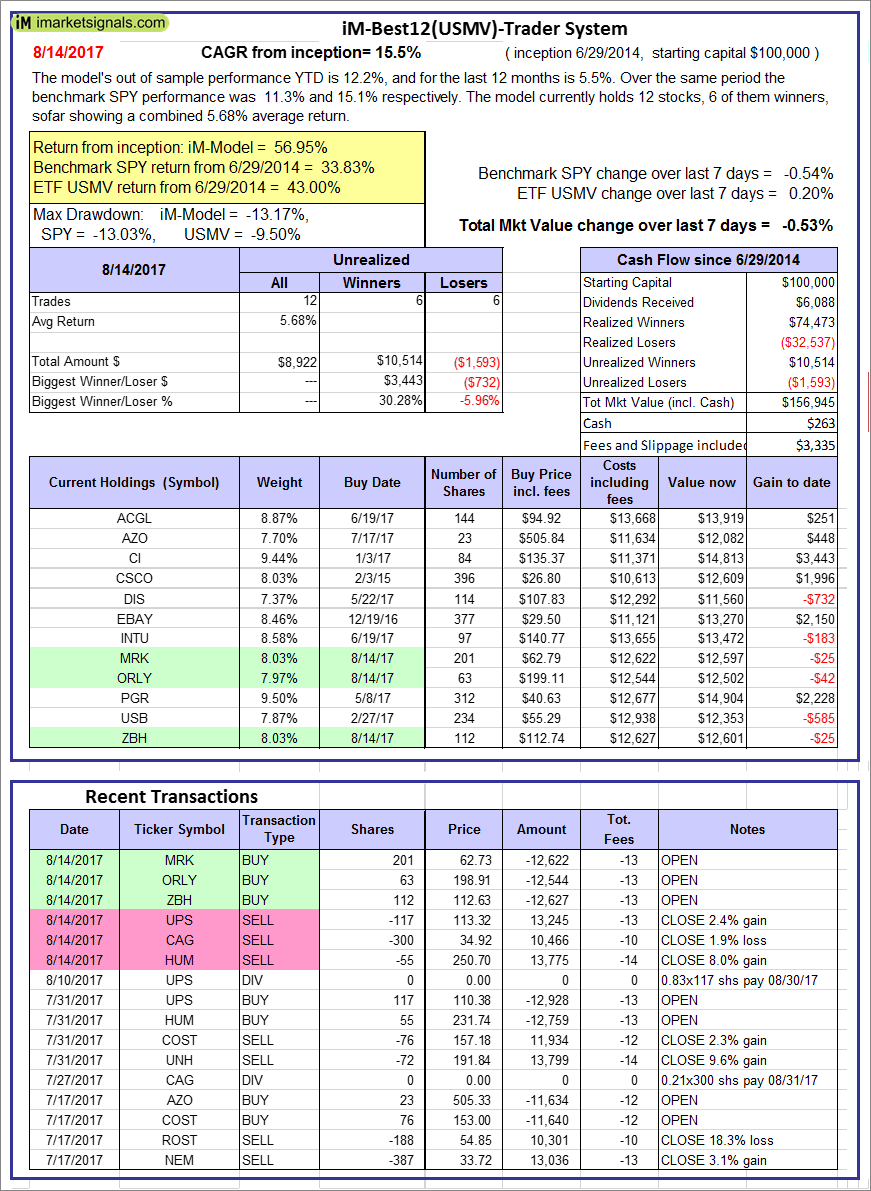 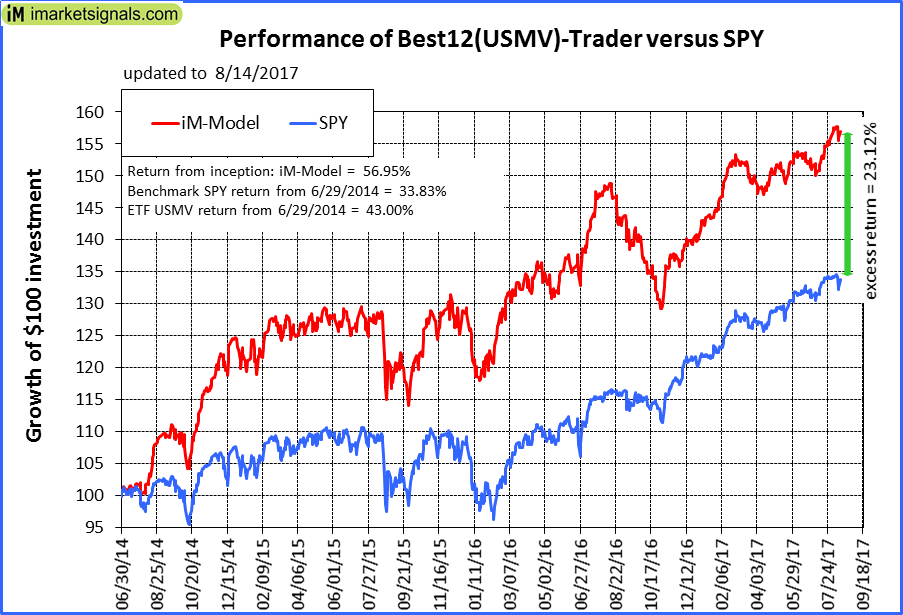 |
iM-Best12(USMV)-Trader: The model’s out of sample performance YTD is 12.2%, and for the last 12 months is 5.5%. Over the same period the benchmark SPY performance was 11.3% and 15.1% respectively. Since inception, on 6/30/2014, the model gained 56.95% while the benchmark SPY gained 33.83% and the ETF USMV gained 43.00% over the same period. Over the previous week the market value of iM-Best12(USMV)-Trader gained -0.53% at a time when SPY gained -0.54%. A starting capital of $100,000 at inception on 6/30/2014 would have grown to $156,945 which includes $263 cash and excludes $3,335 spent on fees and slippage. |
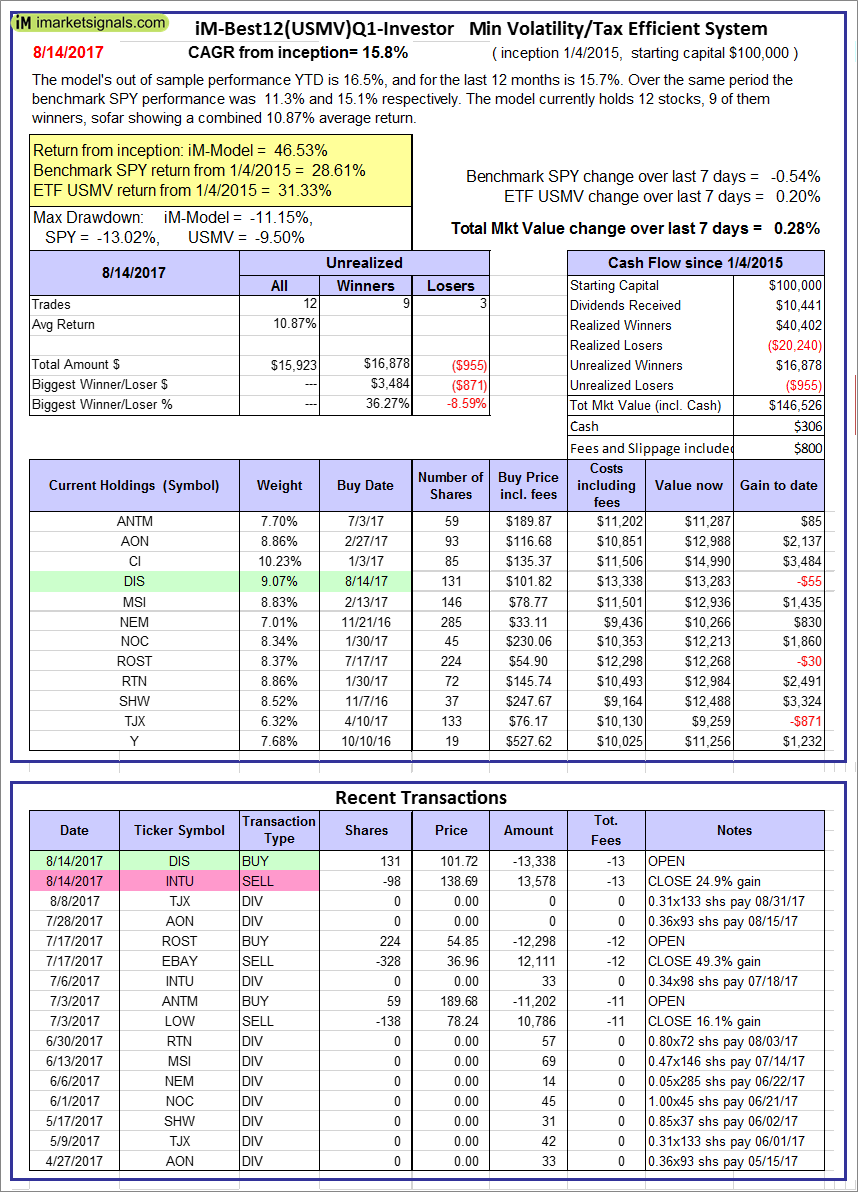 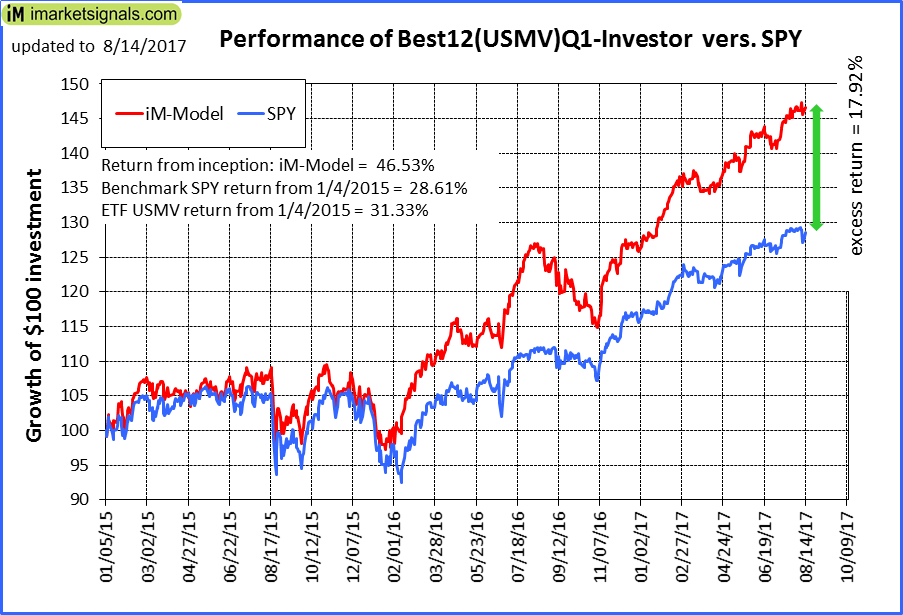 |
iM-Best12(USMV)Q1-Investor: The model’s out of sample performance YTD is 16.5%, and for the last 12 months is 15.7%. Over the same period the benchmark SPY performance was 11.3% and 15.1% respectively. Since inception, on 1/5/2015, the model gained 46.53% while the benchmark SPY gained 28.61% and the ETF USMV gained 31.33% over the same period. Over the previous week the market value of iM-Best12(USMV)Q1 gained 0.28% at a time when SPY gained -0.54%. A starting capital of $100,000 at inception on 1/5/2015 would have grown to $146,526 which includes $306 cash and excludes $800 spent on fees and slippage. |
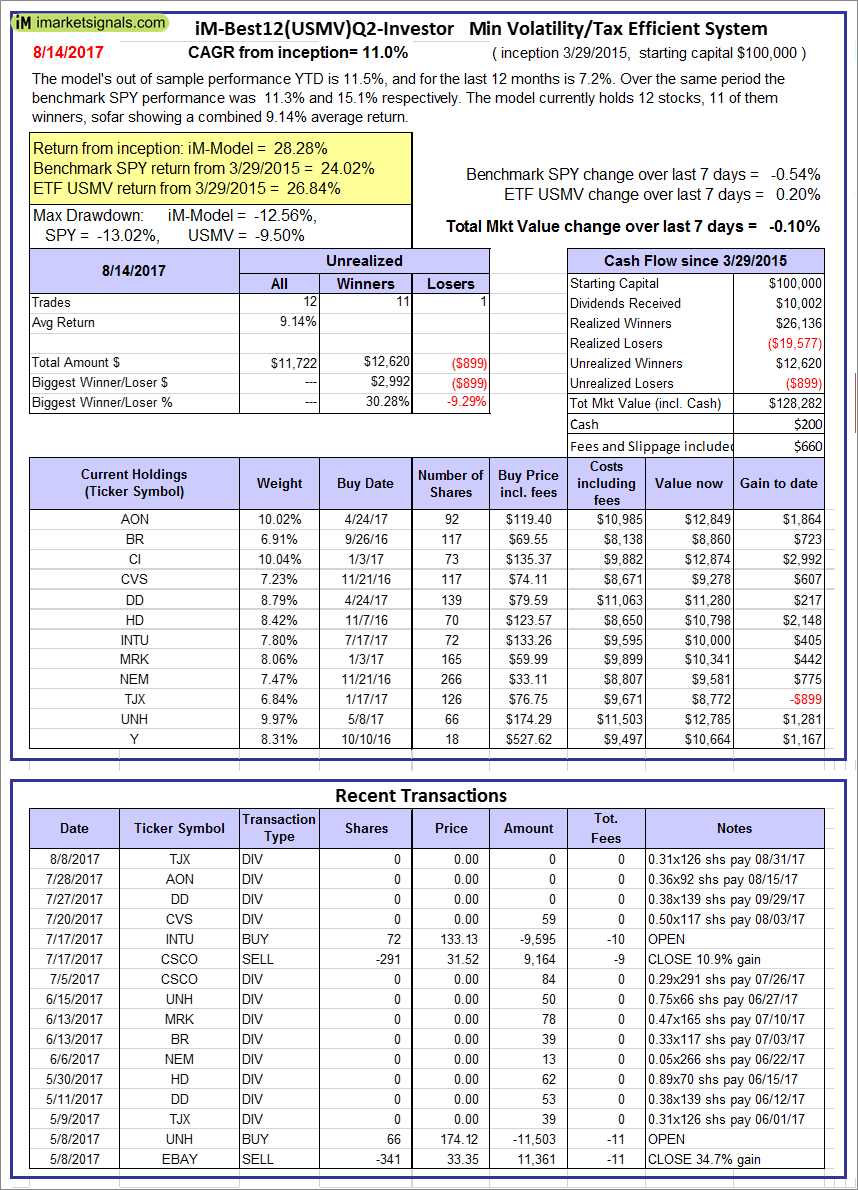 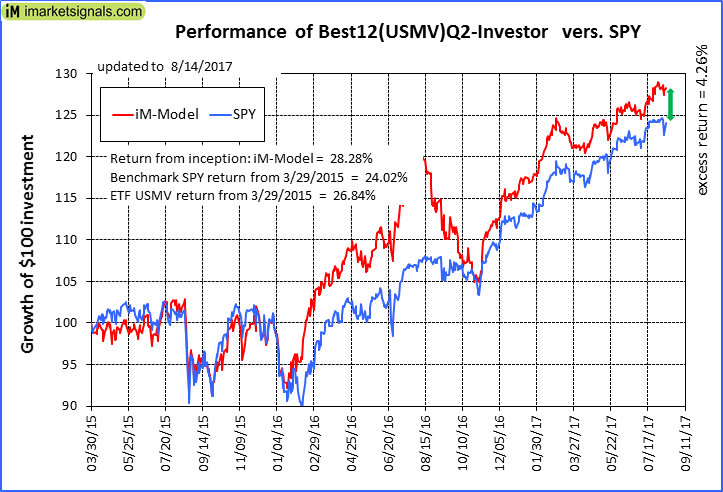 |
iM-Best12(USMV)Q2-Investor: The model’s out of sample performance YTD is 11.5%, and for the last 12 months is 7.2%. Over the same period the benchmark SPY performance was 11.3% and 15.1% respectively. Since inception, on 3/30/2015, the model gained 28.28% while the benchmark SPY gained 24.02% and the ETF USMV gained 26.84% over the same period. Over the previous week the market value of iM-Best12(USMV)Q2 gained -0.10% at a time when SPY gained -0.54%. A starting capital of $100,000 at inception on 3/30/2015 would have grown to $128,282 which includes $200 cash and excludes $660 spent on fees and slippage. |
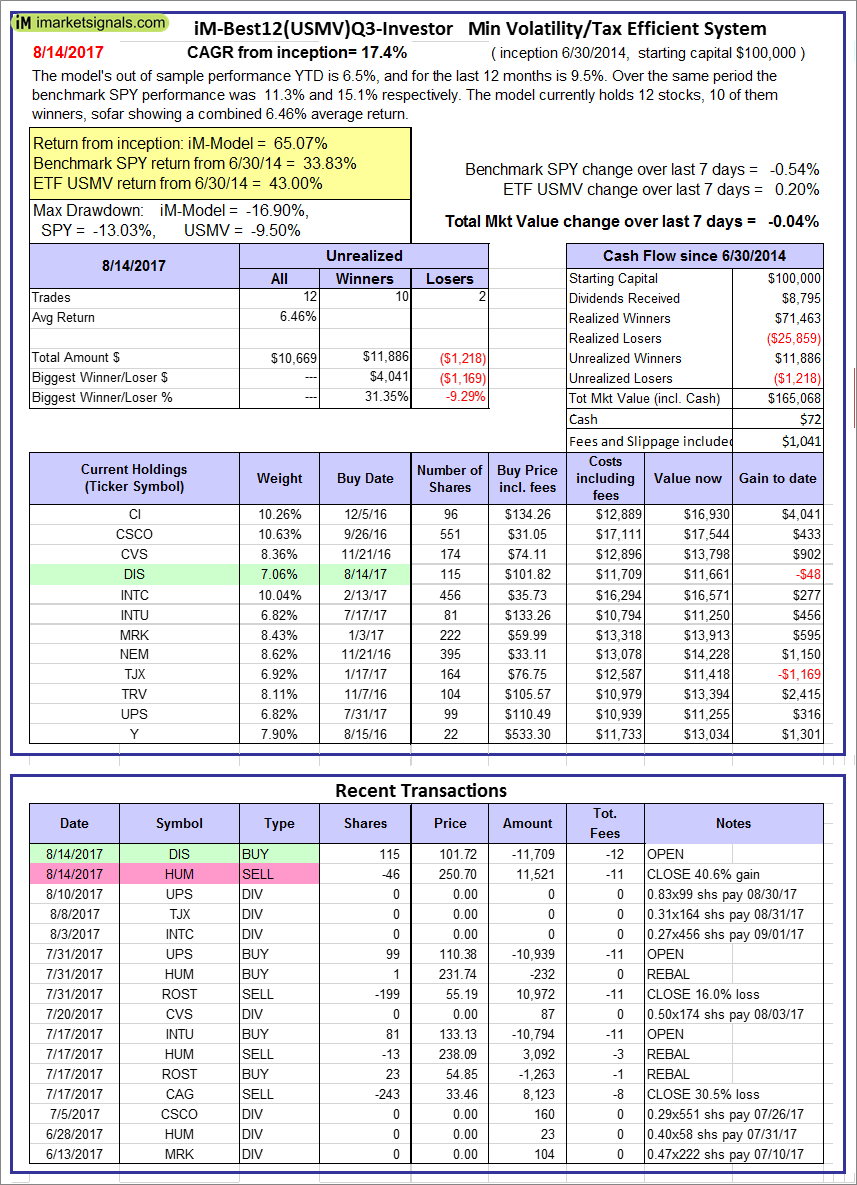 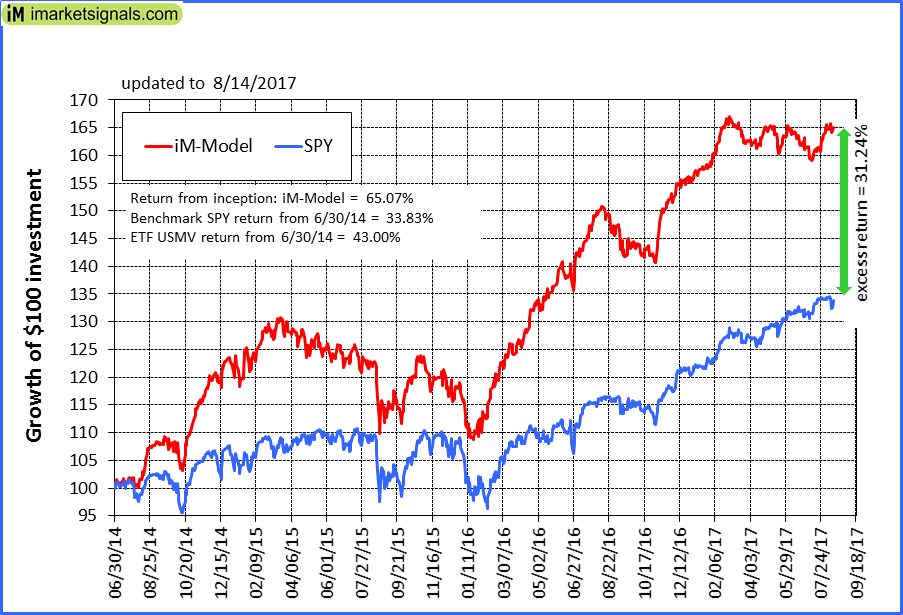 |
iM-Best12(USMV)Q3-Investor: The model’s out of sample performance YTD is 6.5%, and for the last 12 months is 9.5%. Over the same period the benchmark SPY performance was 11.3% and 15.1% respectively. Since inception, on 7/1/2014, the model gained 65.07% while the benchmark SPY gained 33.83% and the ETF USMV gained 43.00% over the same period. Over the previous week the market value of iM-Best12(USMV)Q3 gained -0.04% at a time when SPY gained -0.54%. A starting capital of $100,000 at inception on 7/1/2014 would have grown to $165,068 which includes $72 cash and excludes $1,041 spent on fees and slippage. |
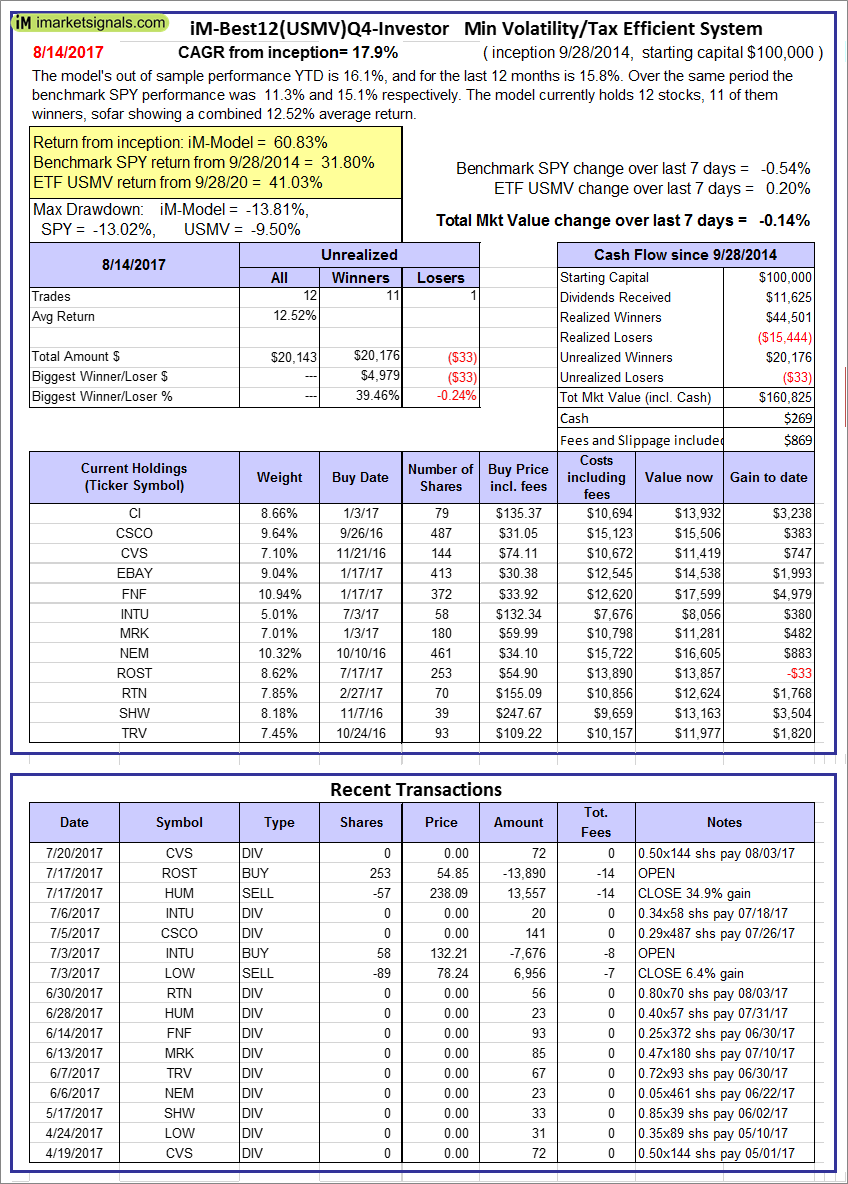  |
iM-Best12(USMV)Q4-Investor: Since inception, on 9/29/2014, the model gained 60.83% while the benchmark SPY gained 31.80% and the ETF USMV gained 41.03% over the same period. Over the previous week the market value of iM-Best12(USMV)Q4 gained -0.14% at a time when SPY gained -0.54%. A starting capital of $100,000 at inception on 9/29/2014 would have grown to $160,825 which includes $269 cash and excludes $869 spent on fees and slippage. |
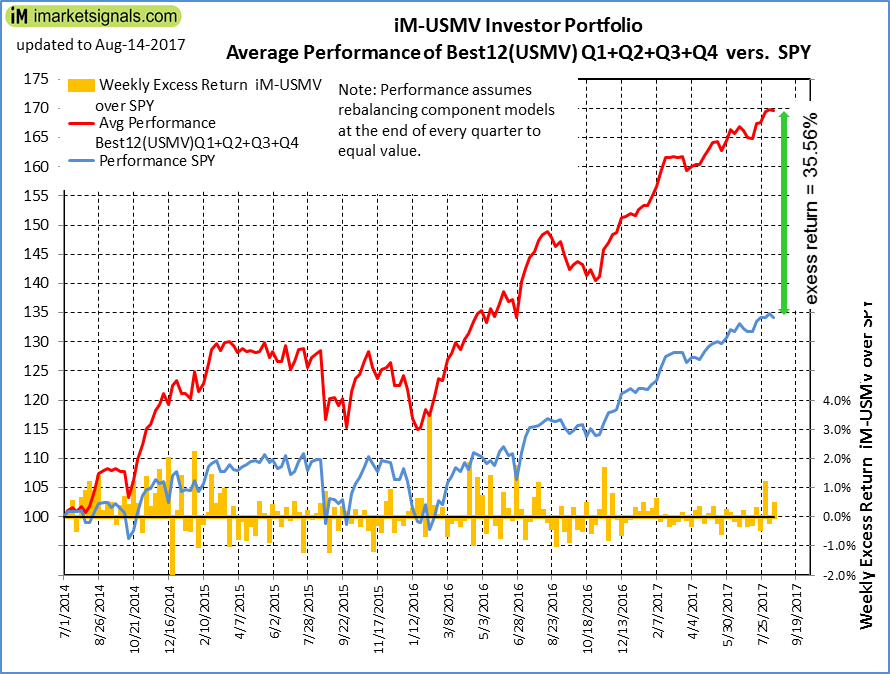 |
Average Performance of iM-Best12(USMV)Q1+Q2+Q3+Q4-Investor resulted in an excess return of 35.56% over SPY. (see iM-USMV Investor Portfolio) |
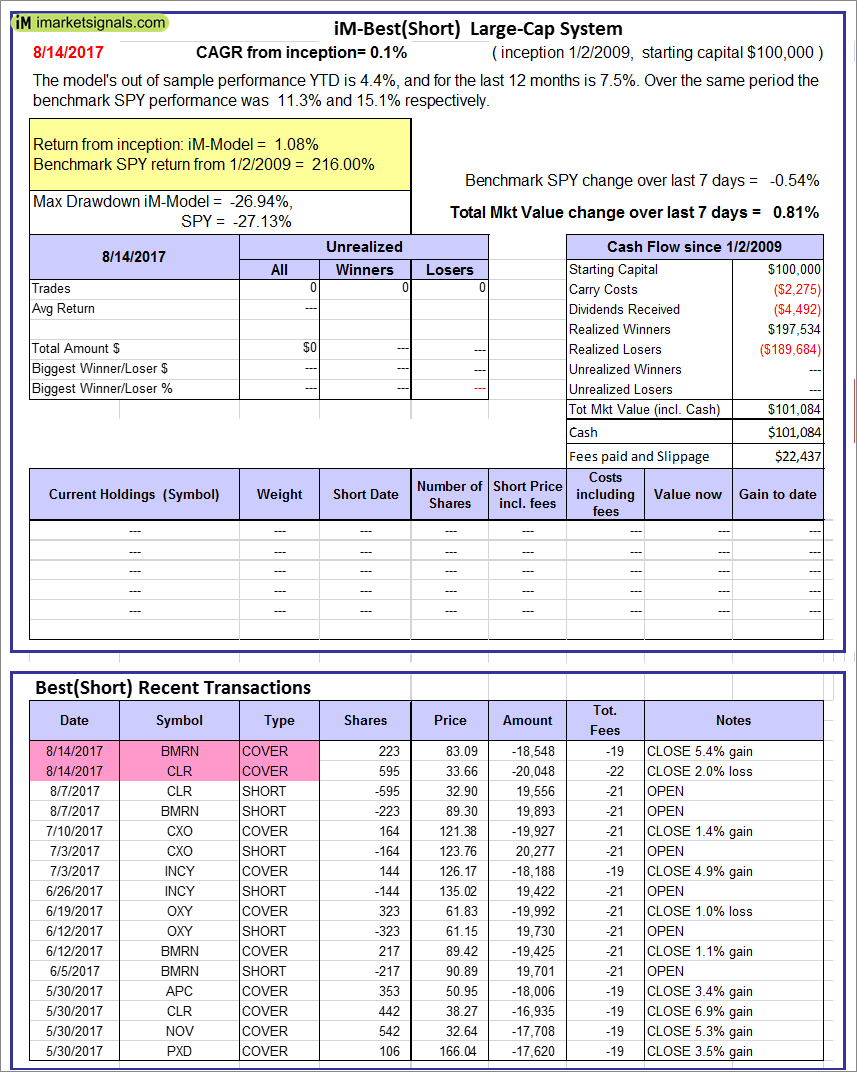 |
iM-Best(Short): The model’s out of sample performance YTD is 4.4%, and for the last 12 months is 7.5%. Over the same period the benchmark SPY performance was 11.3% and 15.1% respectively. Over the previous week the market value of iM-Best(Short) gained 0.81% at a time when SPY gained -0.54%. Over the period 1/2/2009 to 8/14/2017 the starting capital of $100,000 would have grown to $101,084 which includes $101,084 cash and excludes $22,437 spent on fees and slippage. |
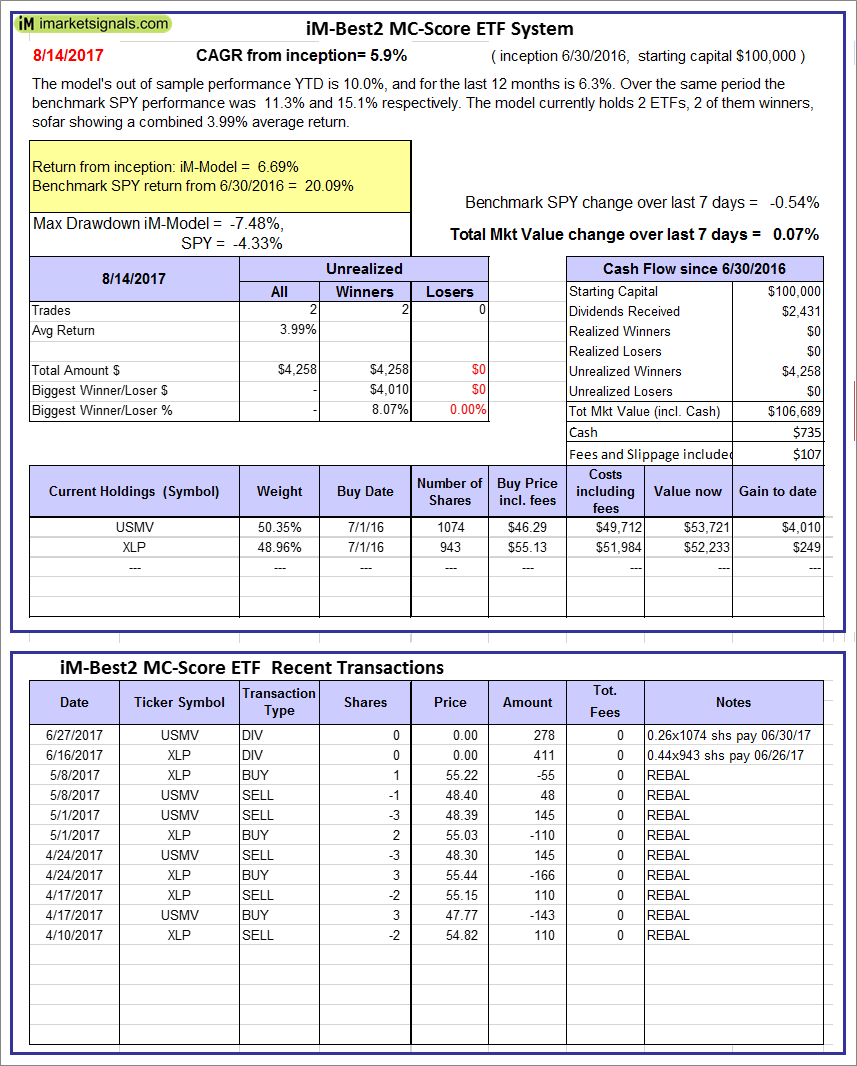 |
iM-Best2 MC-Score ETF System: The model’s out of sample performance YTD is 10.0%, and for the last 12 months is 6.3%. Over the same period the benchmark SPY performance was 11.3% and 15.1% respectively. Over the previous week the market value of the iM-Best2 MC-Score ETF System gained 0.07% at a time when SPY gained -0.54%. A starting capital of $100,000 at inception on 6/30/2016 would have grown to $106,689 which includes $735 cash and excludes $107 spent on fees and slippage. |
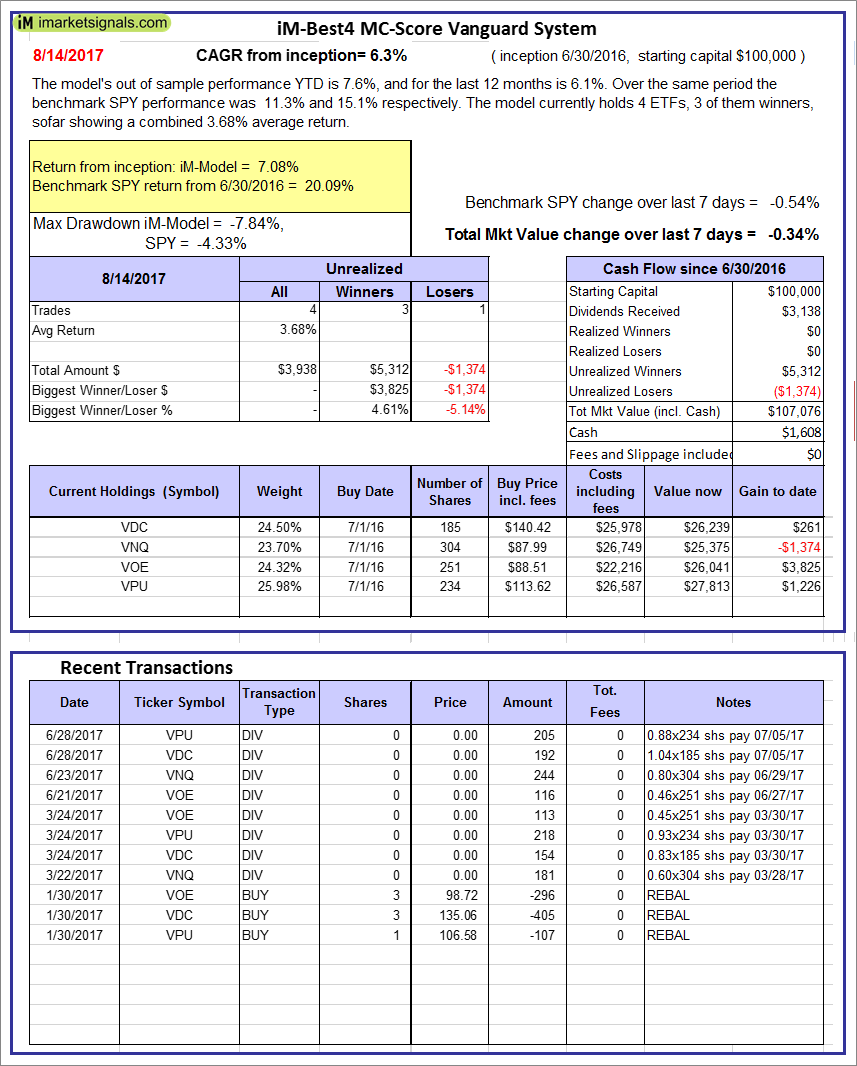 |
iM-Best4 MC-Score Vanguard System: The model’s out of sample performance YTD is 7.6%, and for the last 12 months is 6.1%. Over the same period the benchmark SPY performance was 11.3% and 15.1% respectively. Over the previous week the market value of the iM-Best4 MC-Score Vanguard System gained -0.34% at a time when SPY gained -0.54%. A starting capital of $100,000 at inception on 6/30/2016 would have grown to $107,076 which includes $1,608 cash and excludes $00 spent on fees and slippage. |
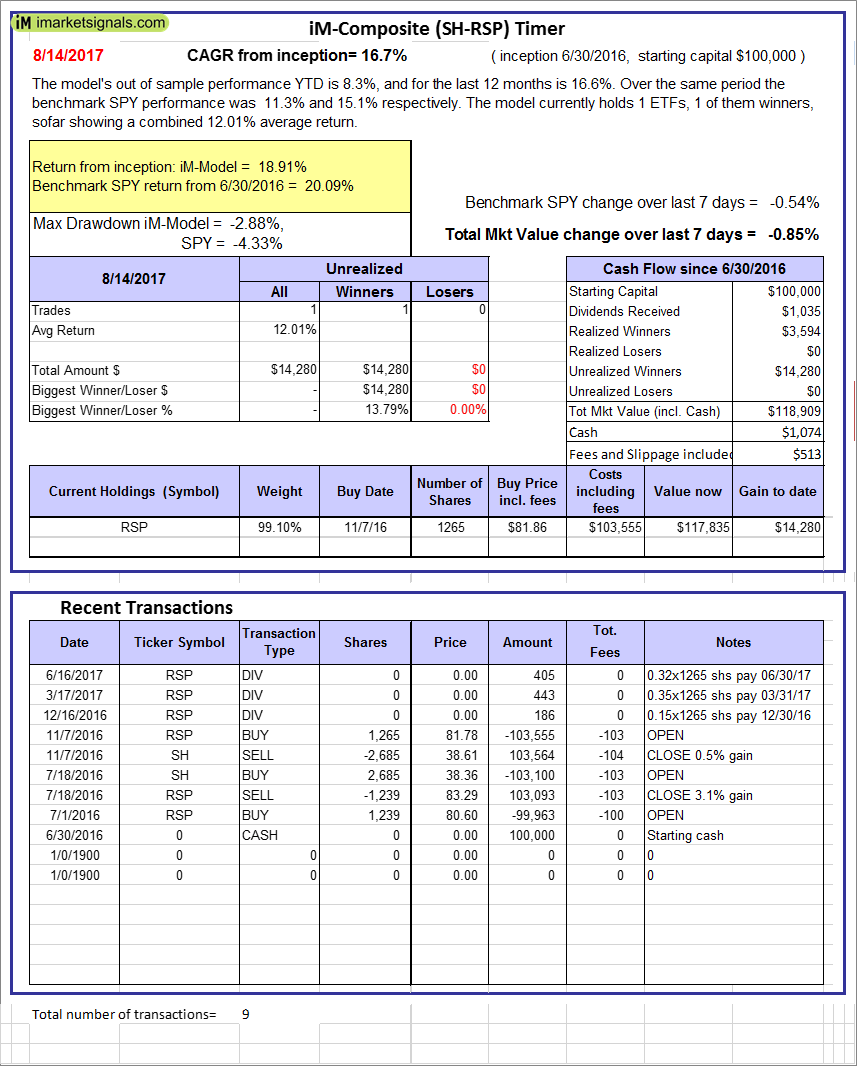 |
iM-Composite (SH-RSP) Timer: The model’s out of sample performance YTD is 8.3%, and for the last 12 months is 16.6%. Over the same period the benchmark SPY performance was 11.3% and 15.1% respectively. Over the previous week the market value of the iM-Composite (SH-RSP) Timer gained -0.85% at a time when SPY gained -0.54%. A starting capital of $100,000 at inception on 6/30/2016 would have grown to $118,909 which includes $1,074 cash and excludes $513 spent on fees and slippage. |
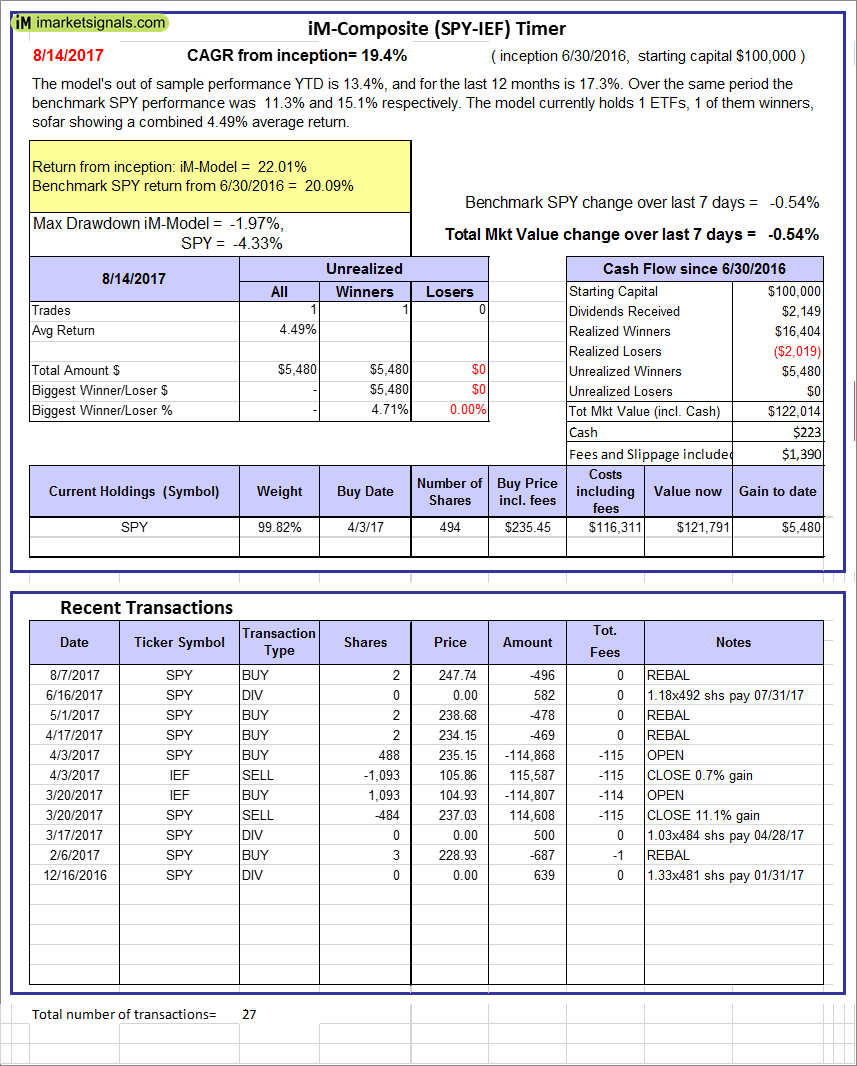 |
iM-Composite (SPY-IEF) Timer: The model’s out of sample performance YTD is 13.4%, and for the last 12 months is 17.3%. Over the same period the benchmark SPY performance was 11.3% and 15.1% respectively. Over the previous week the market value of the iM-Composite (SPY-IEF) Timer gained -0.54% at a time when SPY gained -0.54%. A starting capital of $100,000 at inception on 6/30/2016 would have grown to $122,014 which includes $223 cash and excludes $1,390 spent on fees and slippage. |
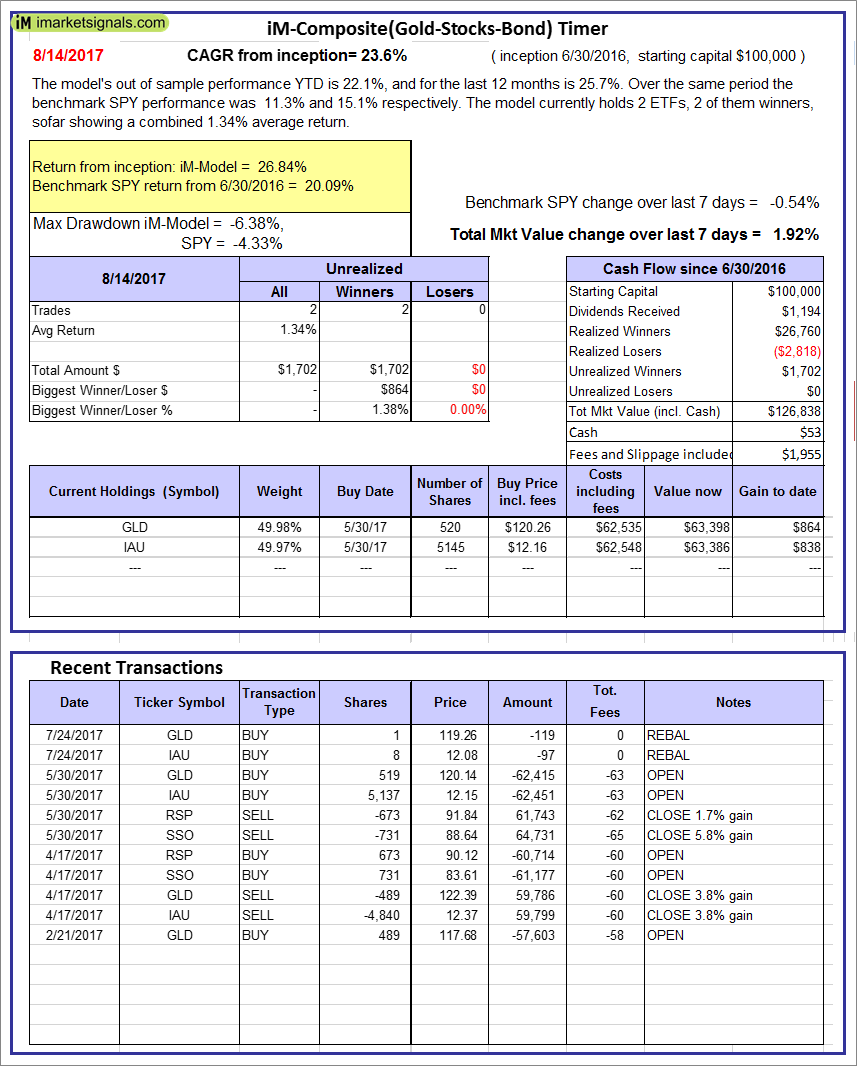 |
iM-Composite(Gold-Stocks-Bond) Timer: The model’s out of sample performance YTD is 22.1%, and for the last 12 months is 25.7%. Over the same period the benchmark SPY performance was 11.3% and 15.1% respectively. Over the previous week the market value of the iM-Composite(Gold-Stocks-Bond) Timer gained 1.92% at a time when SPY gained -0.54%. A starting capital of $100,000 at inception on 6/30/2016 would have grown to $126,838 which includes $53 cash and excludes $1,955 spent on fees and slippage. |
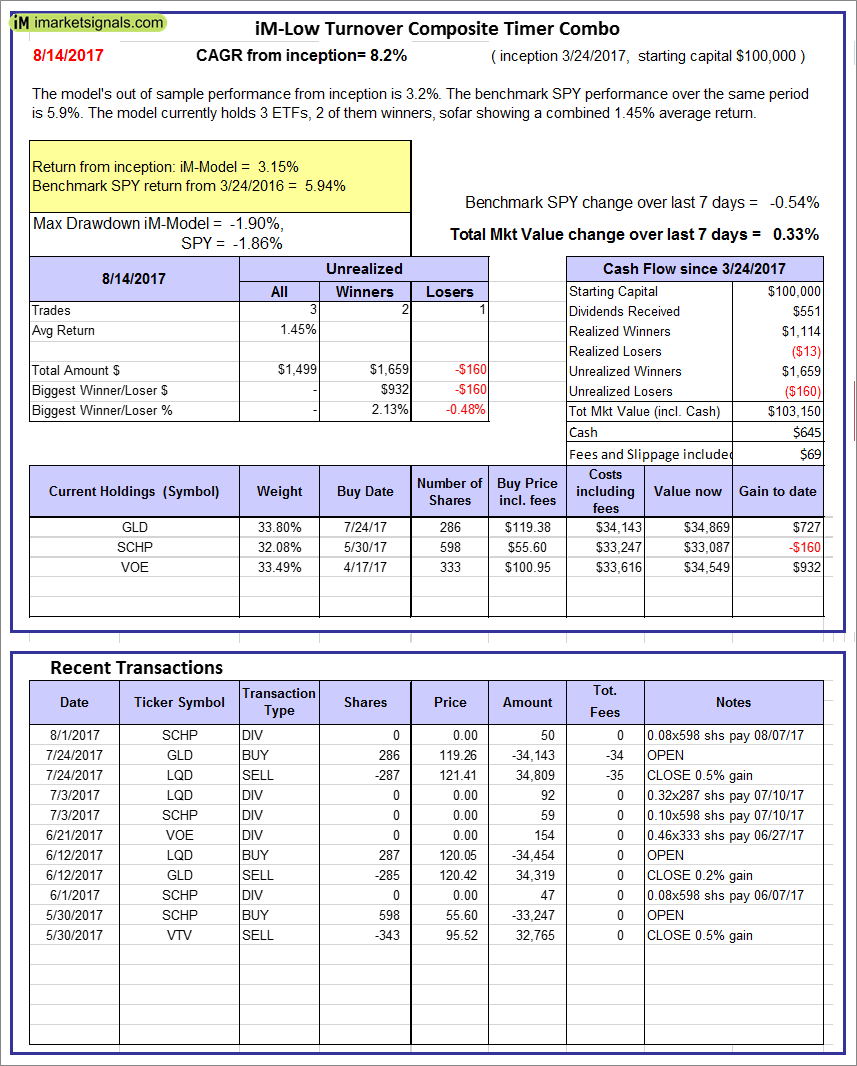 |
iM-Low Turnover Composite Timer Combo: The model’s out of sample performance from inception is 3.2%. The benchmark SPY performance over the same period is 5.9%. Over the previous week the market value of the iM-Low Turnover Composite Timer Combo gained 0.33% at a time when SPY gained -0.54%. A starting capital of $100,000 at inception on 3/24/27 would have grown to $103,150 which includes $645 cash and excludes $69 spent on fees and slippage. |
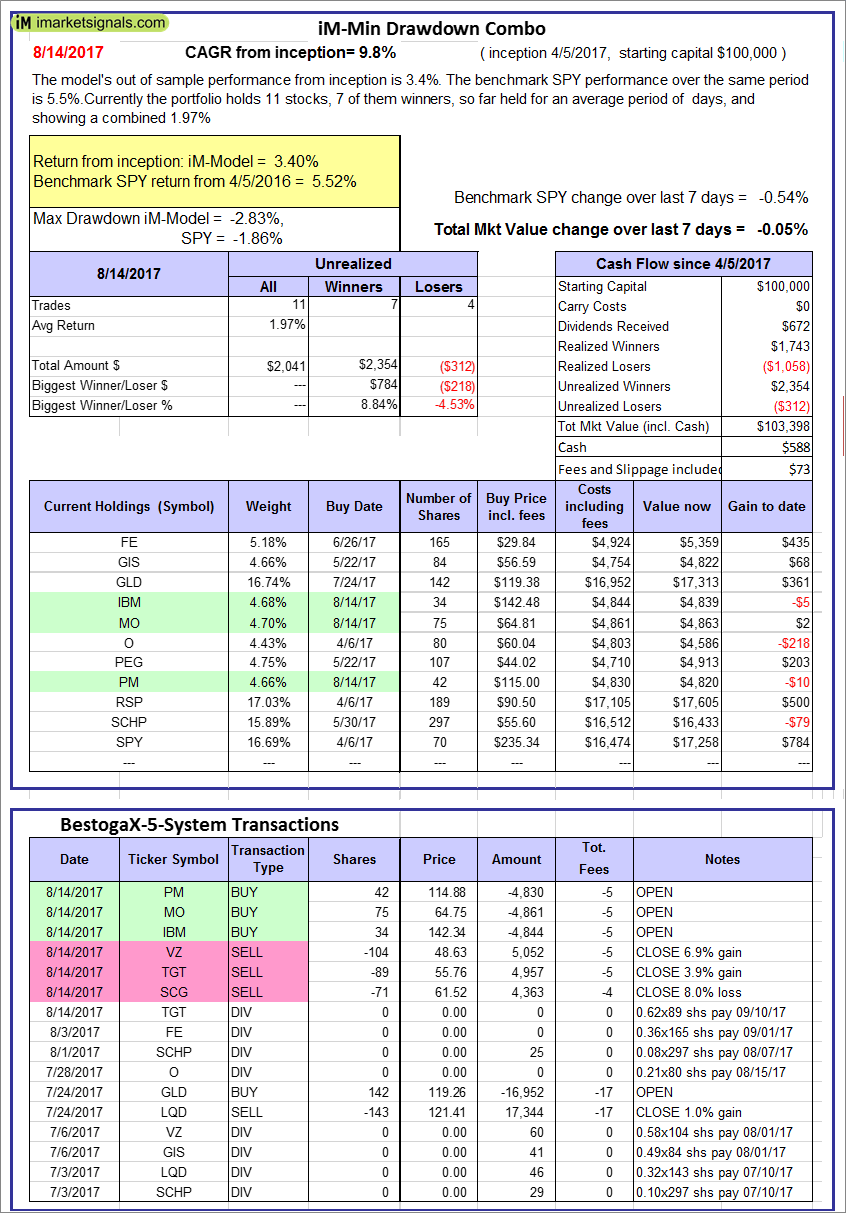 |
iM-Min Drawdown Combo: The model’s out of sample performance from inception is 3.4%. The benchmark SPY performance over the same period is 5.5%. Over the previous week the market value of the iM-Min Drawdown Combo gained -0.05% at a time when SPY gained -0.54%. A starting capital of $100,000 at inception on 4/5/2017 would have grown to $103,398 which includes $588 cash and excludes $73 spent on fees and slippage. |
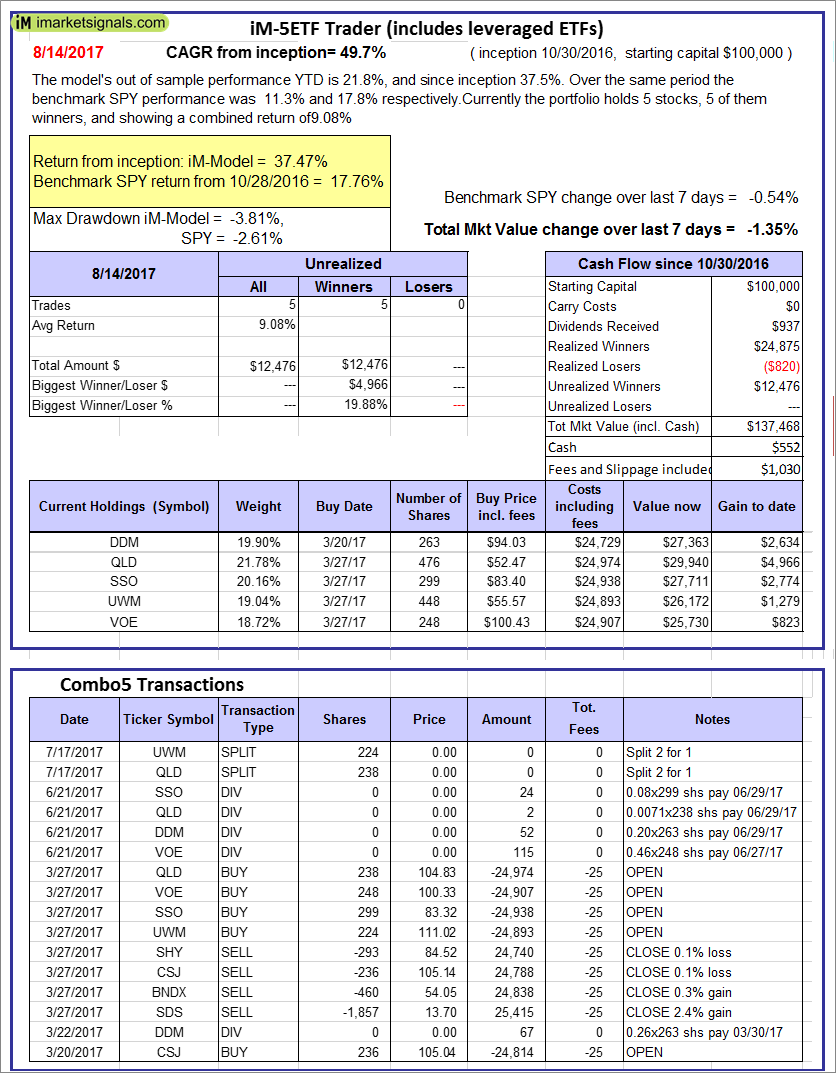 |
iM-5ETF Trader (includes leveraged ETFs): The model’s out of sample performance YTD is 11.8%, and since inception 14.9%. Over the same period the benchmark SPY performance was 11.3% and 17.8% respectively. Over the previous week the market value of the iM-5ETF Trader (includes leveraged ETFs) gained -1.35% at a time when SPY gained -0.54%. A starting capital of $100,000 at inception on 10/30/2016 would have grown to $137,468 which includes $552 cash and excludes $1,030 spent on fees and slippage. |
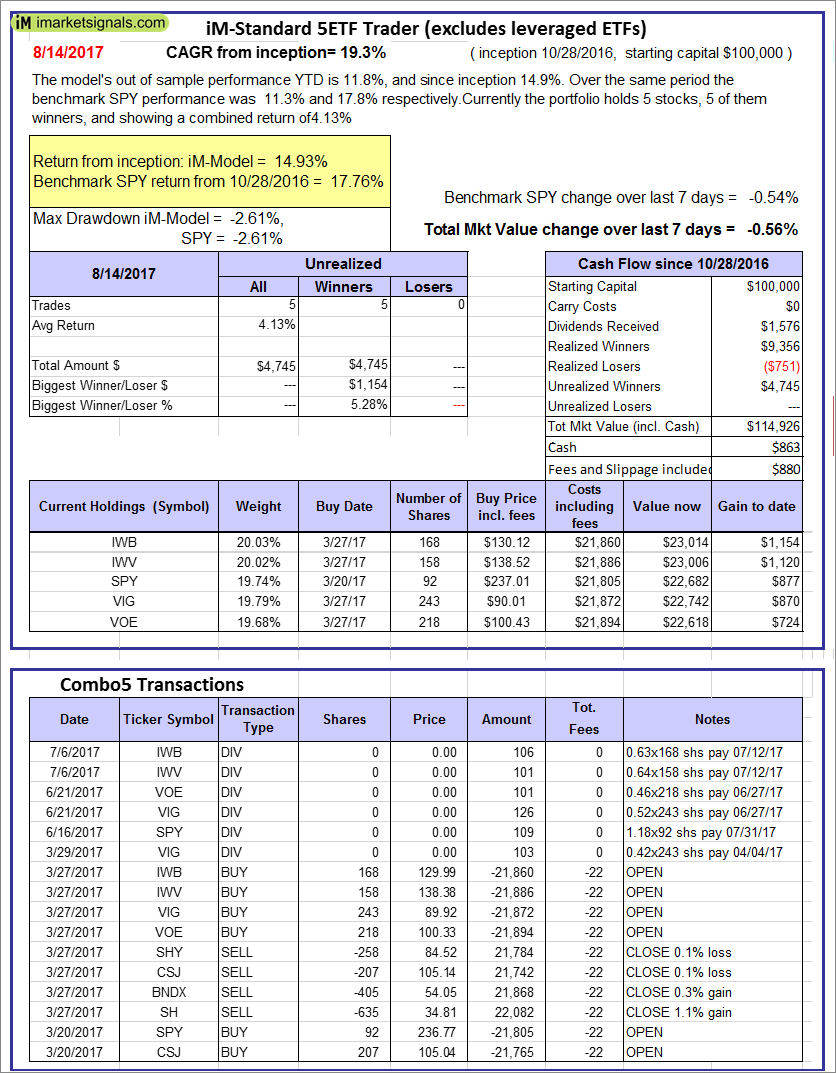 |
iM-Standard 5ETF Trader (excludes leveraged ETFs): The model’s out of sample performance YTD is 11.8%, and since inception 14.9%. Over the same period the benchmark SPY performance was 11.3% and 17.8% respectively. Over the previous week the market value of the iM-Standard 5ETF Trader (excludes leveraged ETFs) gained -0.56% at a time when SPY gained -0.54%. A starting capital of $100,000 at inception on 10/30/2016 would have grown to $114,926 which includes $863 cash and excludes $880 spent on fees and slippage. |
iM-Best Reports – 8/14/2017
Posted in pmp SPY-SH
Leave a Reply
You must be logged in to post a comment.