  |
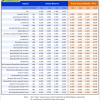
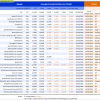
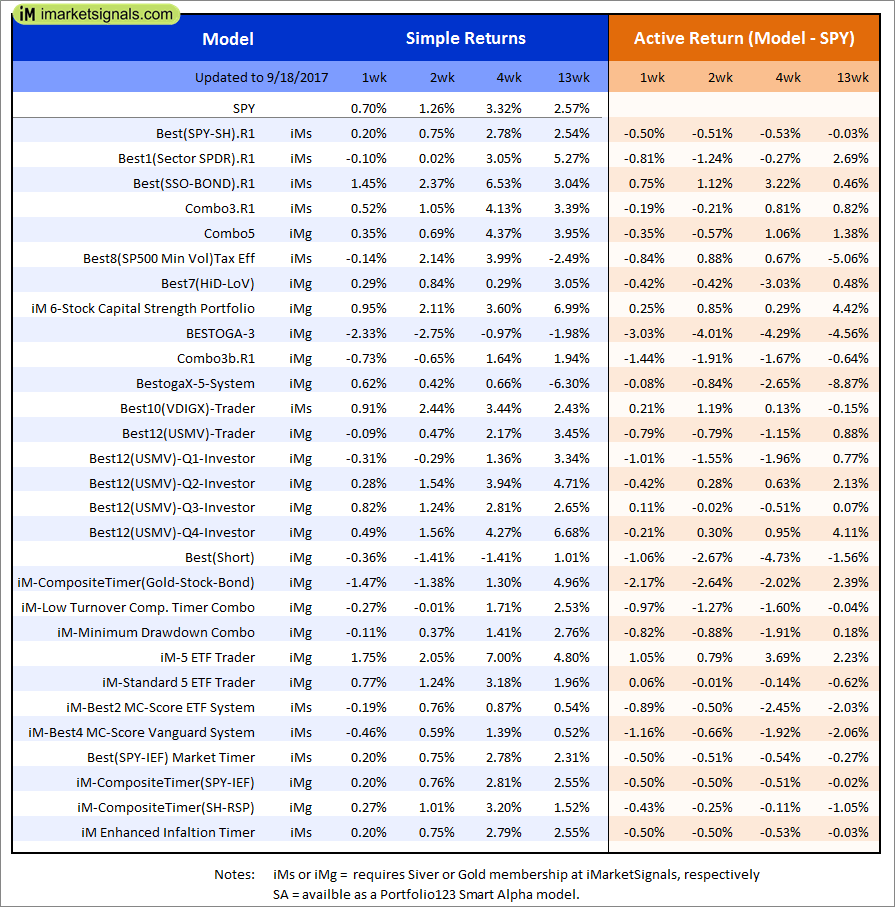
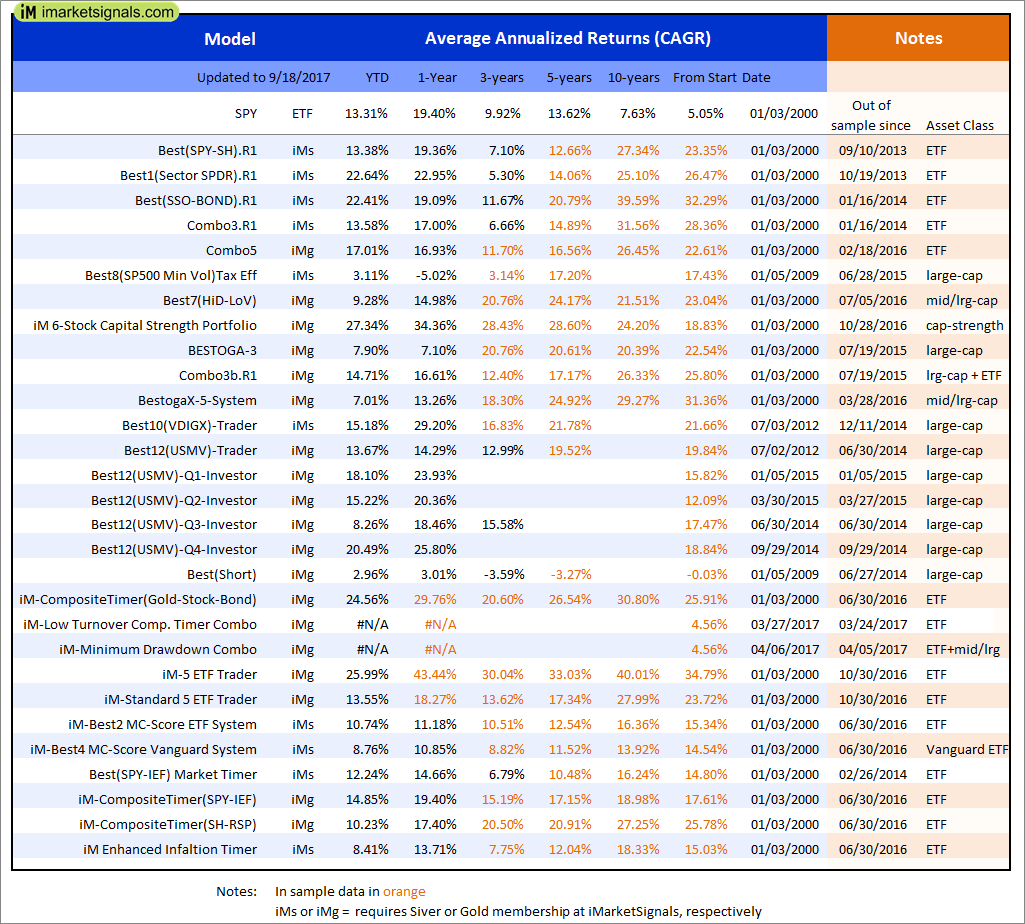
Out of sample performance summary of our models for the past 1, 2, 4 and 13 week periods. The active active return indicates how the models over- or underperformed the benchmark ETF SPY. Also the YTD, and the 1-, 3-, 5- and 10-year annualized returns are shown in the second table |
|
|
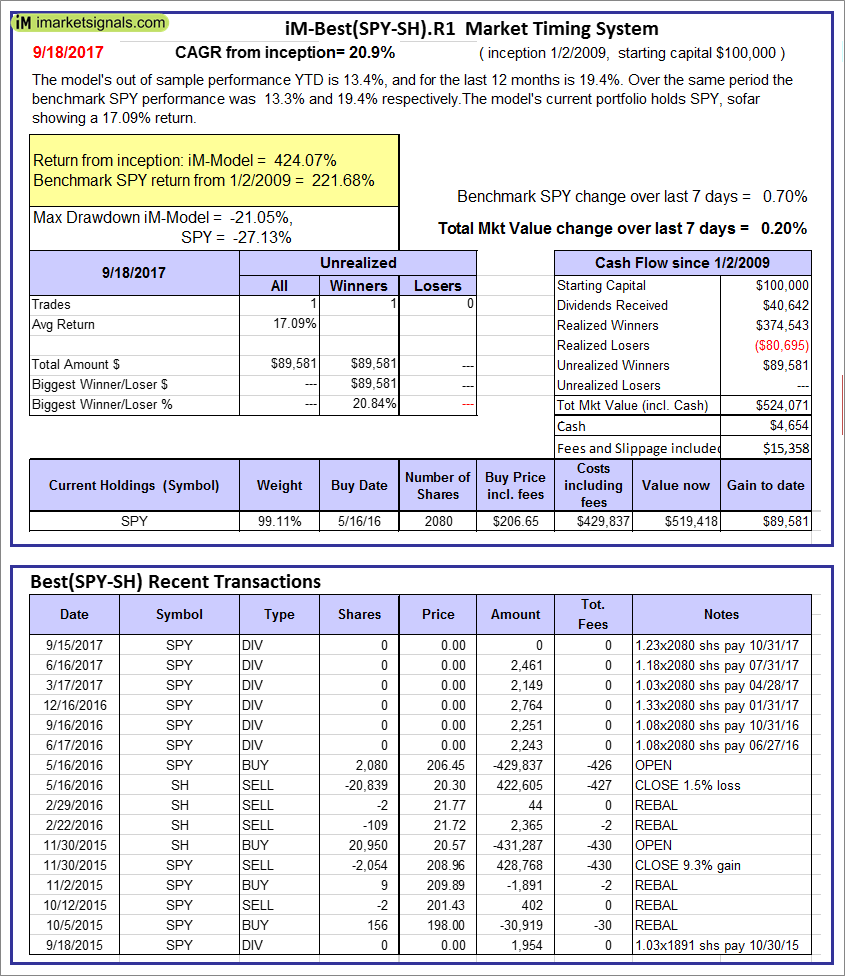
iM-Best(SPY-SH).R1: The model’s out of sample performance YTD is 13.4%, and for the last 12 months is 19.4%. Over the same period the benchmark SPY performance was 13.3% and 19.4% respectively. Over the previous week the market value of Best(SPY-SH) gained 0.20% at a time when SPY gained 0.70%. A starting capital of $100,000 at inception on 1/2/2009 would have grown to $524,071 which includes $4,654 cash and excludes $15,358 spent on fees and slippage. |
|
|
iM-Combo3.R1: The model’s out of sample performance YTD is 13.6%, and for the last 12 months is 17.0%. Over the same period the benchmark SPY performance was 13.3% and 19.4% respectively. Over the previous week the market value of iM-Combo3.R1 gained 0.52% at a time when SPY gained 0.70%. A starting capital of $100,000 at inception on 2/3/2014 would have grown to $142,716 which includes -$997 cash and excludes $3,437 spent on fees and slippage. |
|
|
iM-Combo5: The model’s out of sample performance YTD is 17.0%, and for the last 12 months is 16.9%. Over the same period the benchmark SPY performance was 13.3% and 19.4% respectively. Over the previous week the market value of iM-Combo5 gained 0.35% at a time when SPY gained 0.70%. A starting capital of $100,000 at inception on 2/22/2016 would have grown to $115,412 which includes -$21 cash and excludes $599 spent on fees and slippage. |
|
|
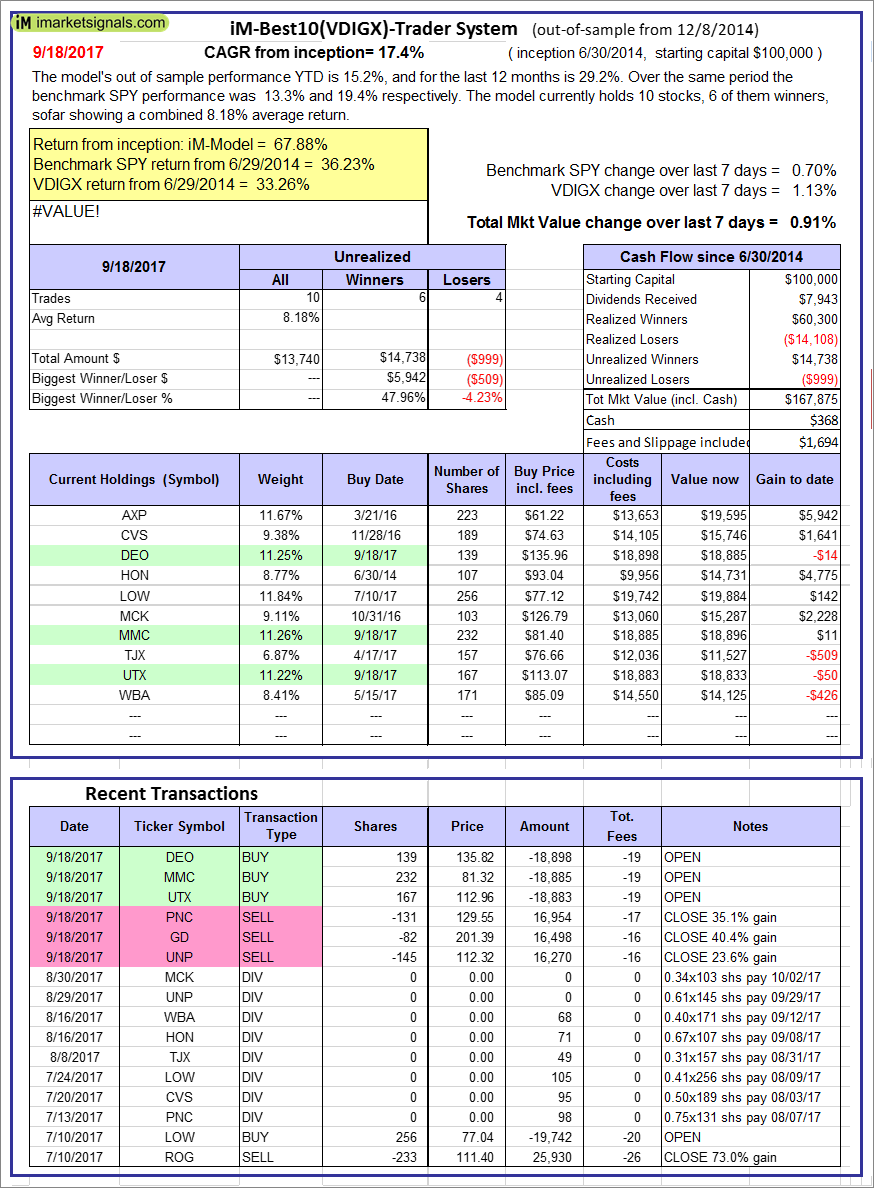
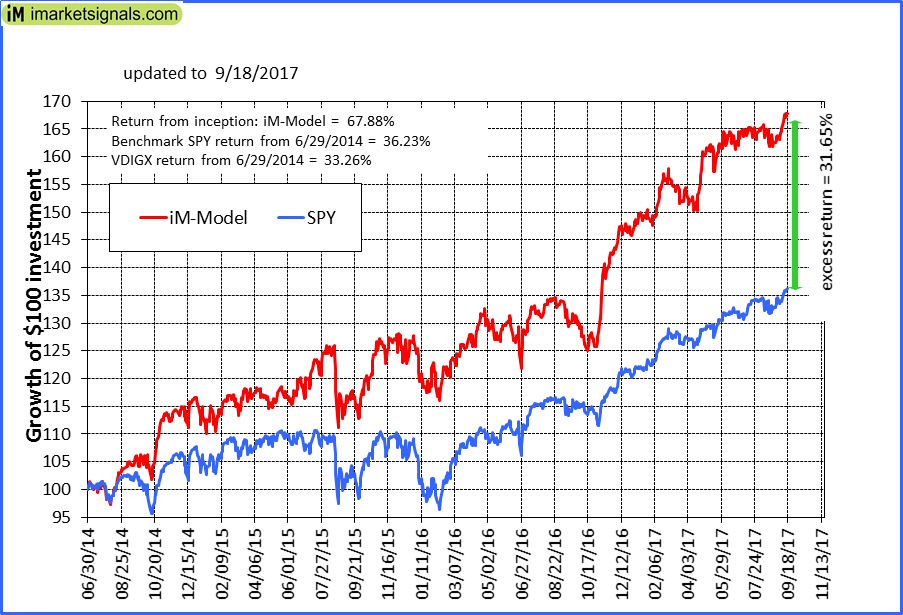
iM-Best10(VDIGX)-Trader: The model’s out of sample performance YTD is 15.2%, and for the last 12 months is 29.2%. Over the same period the benchmark SPY performance was 13.3% and 19.4% respectively. Since inception, on 7/1/2014, the model gained 67.88% while the benchmark SPY gained 36.23% and VDIGX gained 33.26% over the same period. Over the previous week the market value of iM-Best10(VDIGX) gained 0.91% at a time when SPY gained 0.70%. A starting capital of $100,000 at inception on 7/1/2014 would have grown to $167,875 which includes $368 cash and excludes $1,694 spent on fees and slippage. |
|
|
iM-BESTOGA-3: The model’s out of sample performance YTD is 7.9%, and for the last 12 months is 7.1%. Over the same period the benchmark SPY performance was 13.3% and 19.4% respectively. Over the previous week the market value of iM-BESTOGA-3 gained -2.33% at a time when SPY gained 0.70%. A starting capital of $100,000 at inception on 2/3/2014 would have grown to $218,357 which includes $207 cash and excludes $1,818 spent on fees and slippage. |
|
|
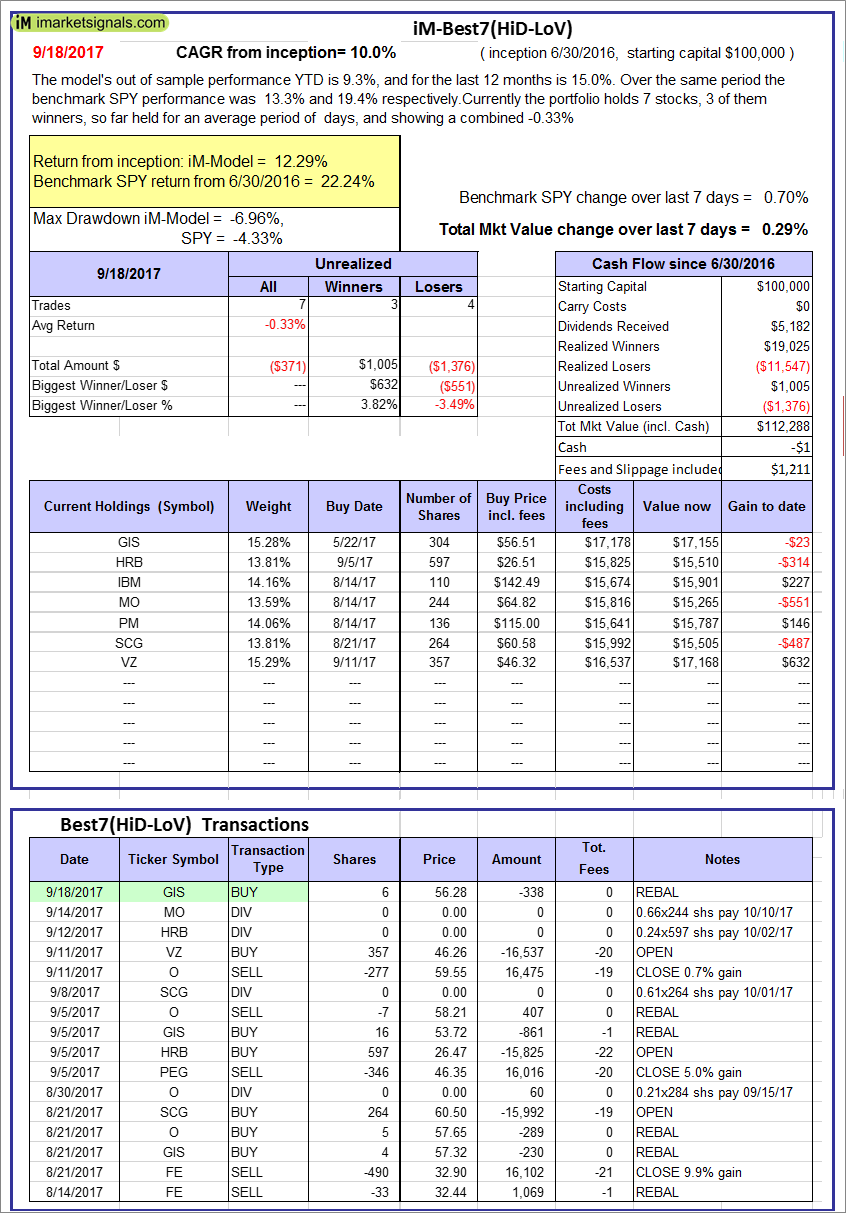
iM-Best7(HiD-LoV): The model’s out of sample performance YTD is 9.3%, and for the last 12 months is 15.0%. Over the same period the benchmark SPY performance was 13.3% and 19.4% respectively. Over the previous week the market value of iM-BESTOGA-3 gained 0.29% at a time when SPY gained 0.70%. A starting capital of $100,000 at inception on 6/30/2016 would have grown to $112,288 which includes -$1 cash and excludes $1,211 spent on fees and slippage. |
|
|
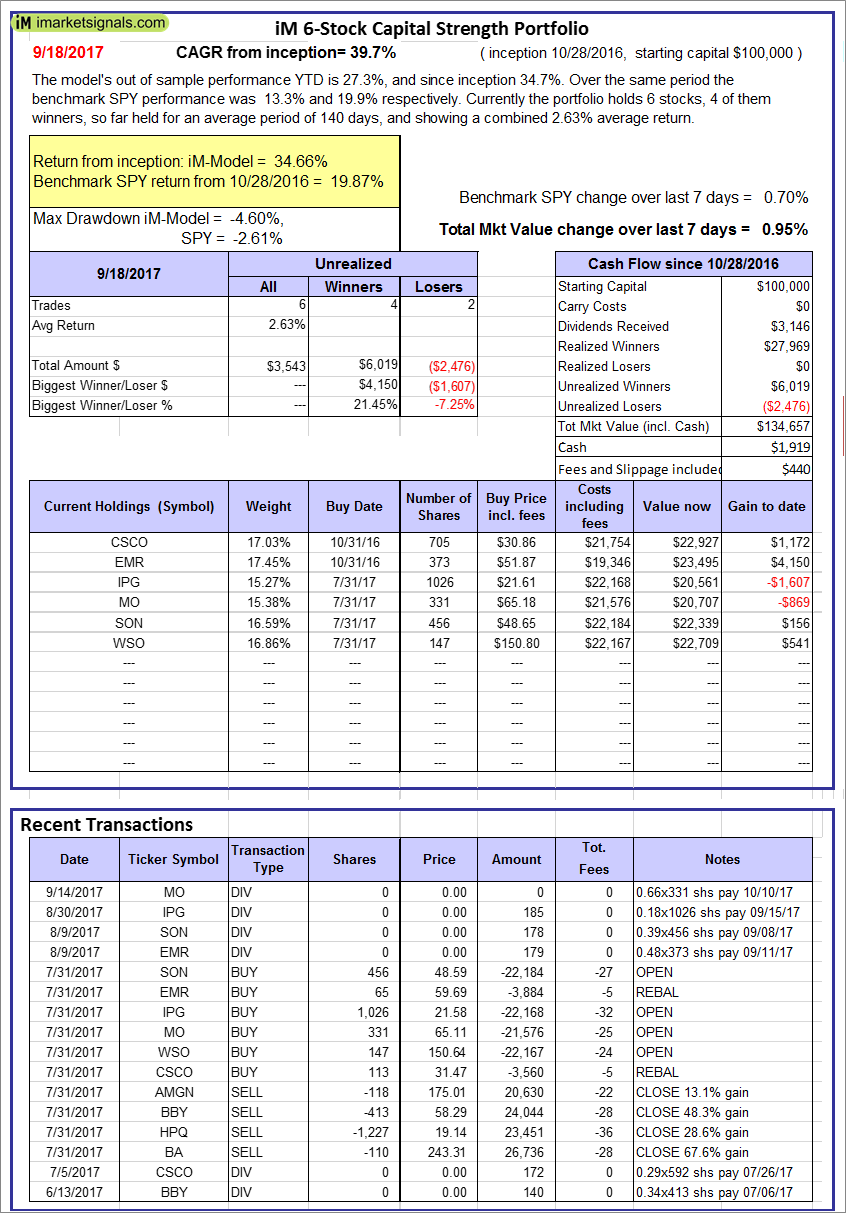
iM 6-Stock Capital Strength Portfolio: The model’s out of sample performance YTD is 27.3%, and since inception 34.7%. Over the same period the benchmark SPY performance was 13.3% and 19.9% respectively. Over the previous week the market value of the iM 6-Stock Capital Strength Portfolio gained 0.95% at a time when SPY gained 0.70%. A starting capital of $100,000 at inception on 10/28/2016 would have grown to $134,657 which includes $1,919 cash and excludes $440 spent on fees and slippage. |
|
|
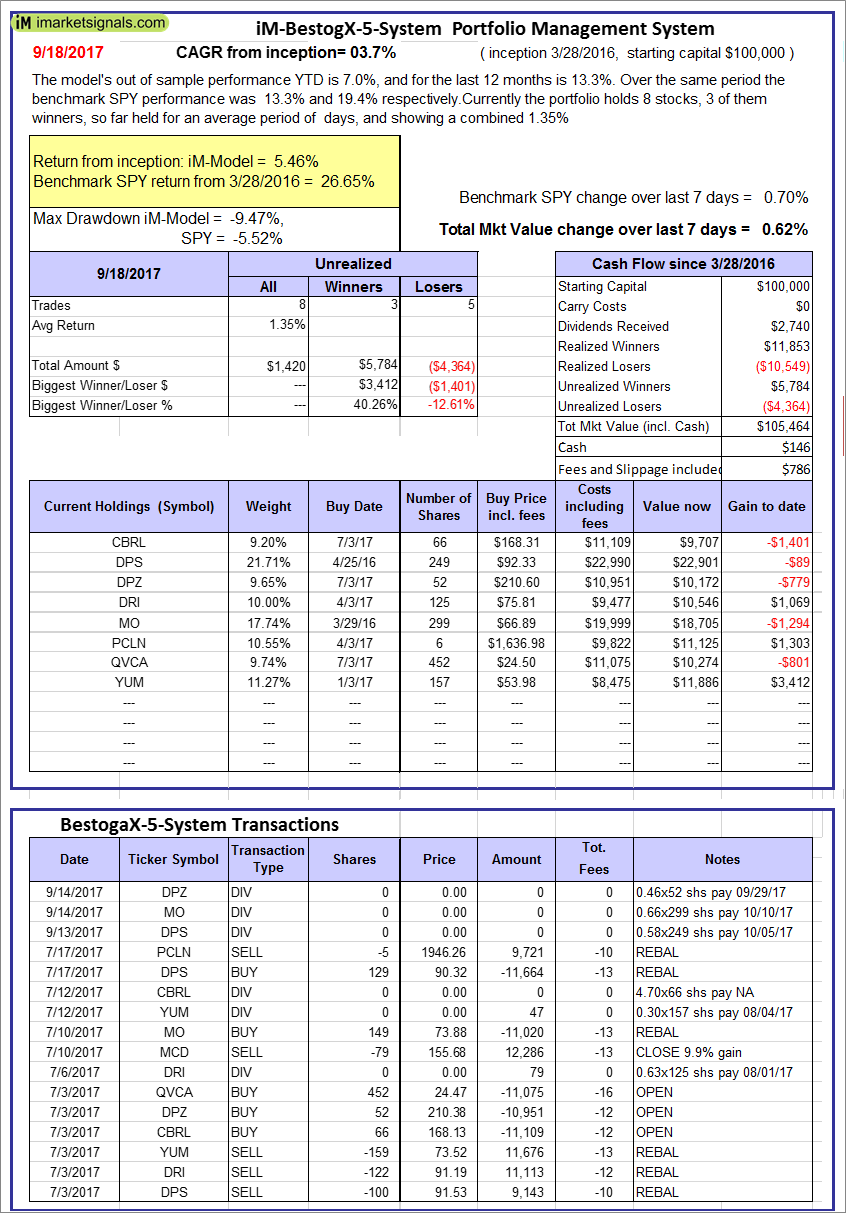
iM-BestogaX5-System: The model’s out of sample performance YTD is 7.0%, and for the last 12 months is 13.3%. Over the same period the benchmark SPY performance was 13.3% and 19.4% respectively. Over the previous week the market value of iM-Best8(S&P 500)Tax-Eff. gained 0.62% at a time when SPY gained 0.70%. A starting capital of $100,000 at inception on 3/28/2016 would have grown to $105,464 which includes $146 cash and excludes $786 spent on fees and slippage. |
|
|
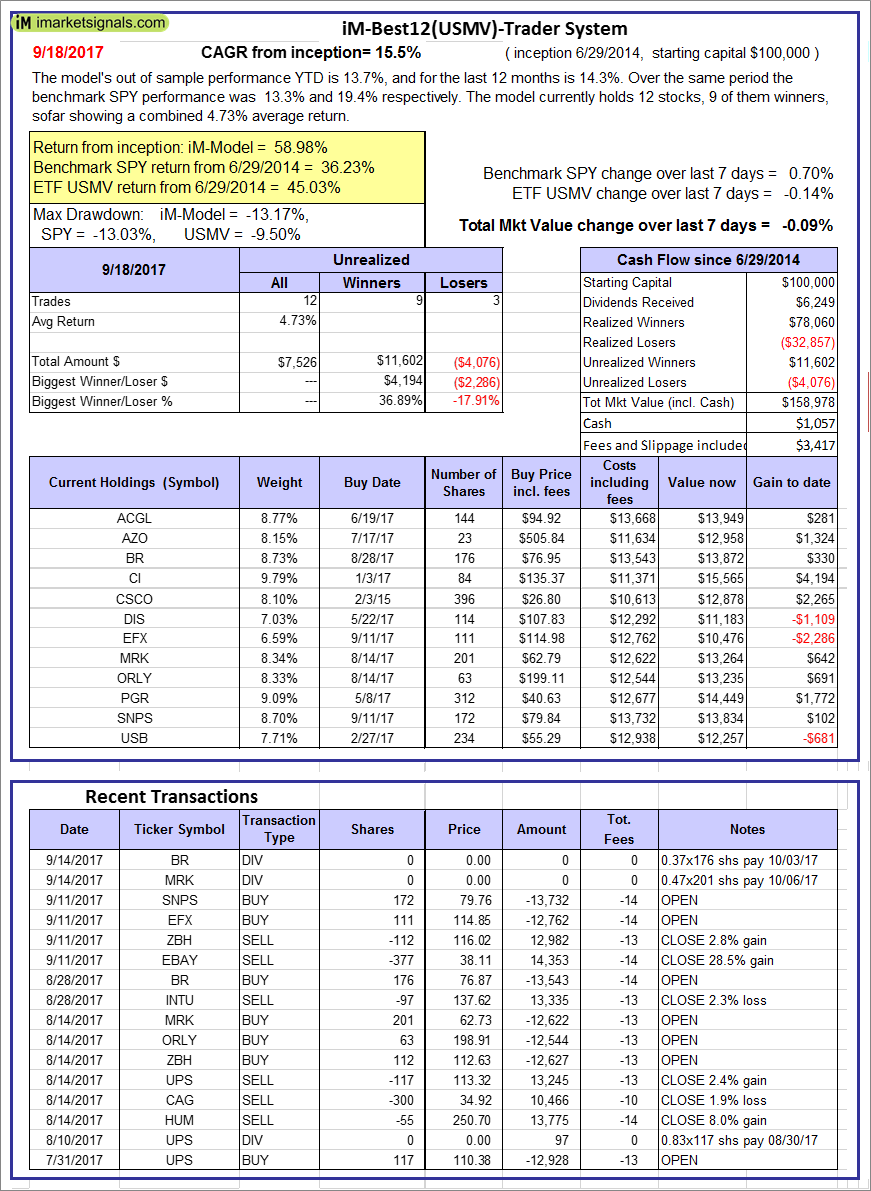
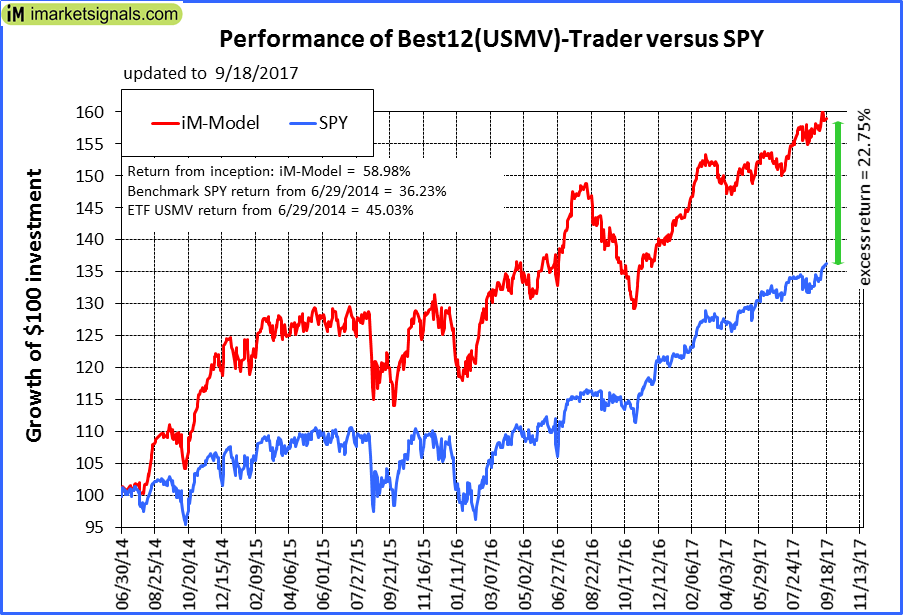
iM-Best12(USMV)-Trader: The model’s out of sample performance YTD is 13.7%, and for the last 12 months is 14.3%. Over the same period the benchmark SPY performance was 13.3% and 19.4% respectively. Since inception, on 6/30/2014, the model gained 58.98% while the benchmark SPY gained 36.23% and the ETF USMV gained 45.03% over the same period. Over the previous week the market value of iM-Best12(USMV)-Trader gained -0.09% at a time when SPY gained 0.70%. A starting capital of $100,000 at inception on 6/30/2014 would have grown to $158,978 which includes $1,057 cash and excludes $3,417 spent on fees and slippage. |
|
|
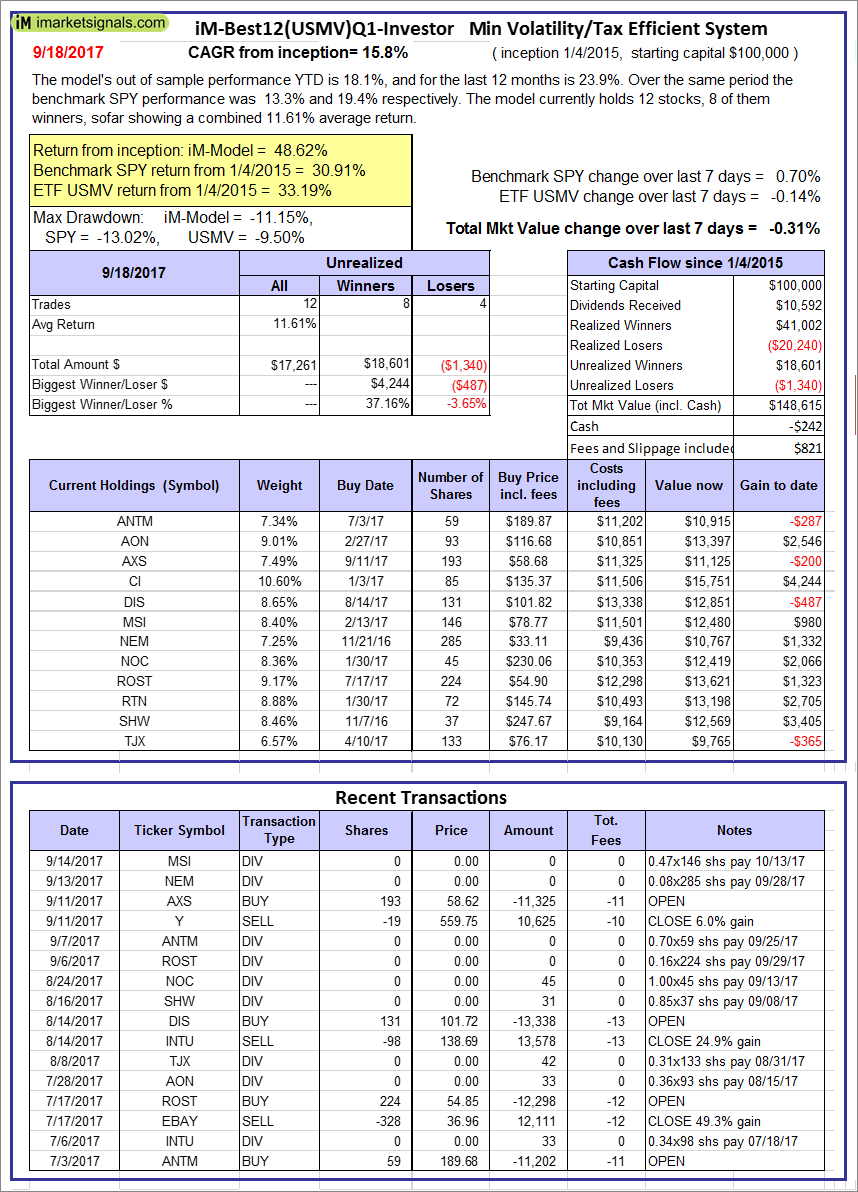
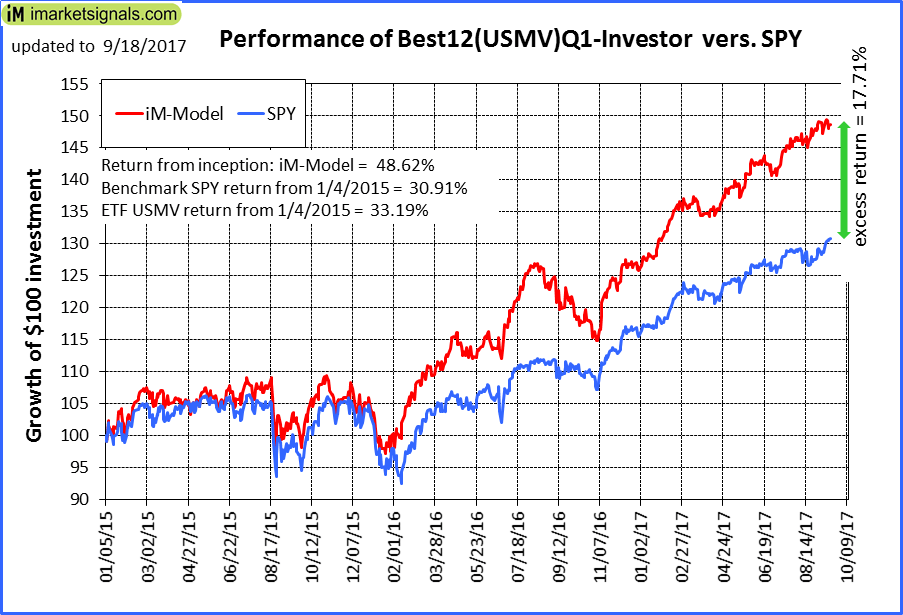
iM-Best12(USMV)Q1-Investor: The model’s out of sample performance YTD is 18.1%, and for the last 12 months is 23.9%. Over the same period the benchmark SPY performance was 13.3% and 19.4% respectively. Since inception, on 1/5/2015, the model gained 48.62% while the benchmark SPY gained 30.91% and the ETF USMV gained 33.19% over the same period. Over the previous week the market value of iM-Best12(USMV)Q1 gained -0.31% at a time when SPY gained 0.70%. A starting capital of $100,000 at inception on 1/5/2015 would have grown to $148,615 which includes -$242 cash and excludes $821 spent on fees and slippage. |
|
|
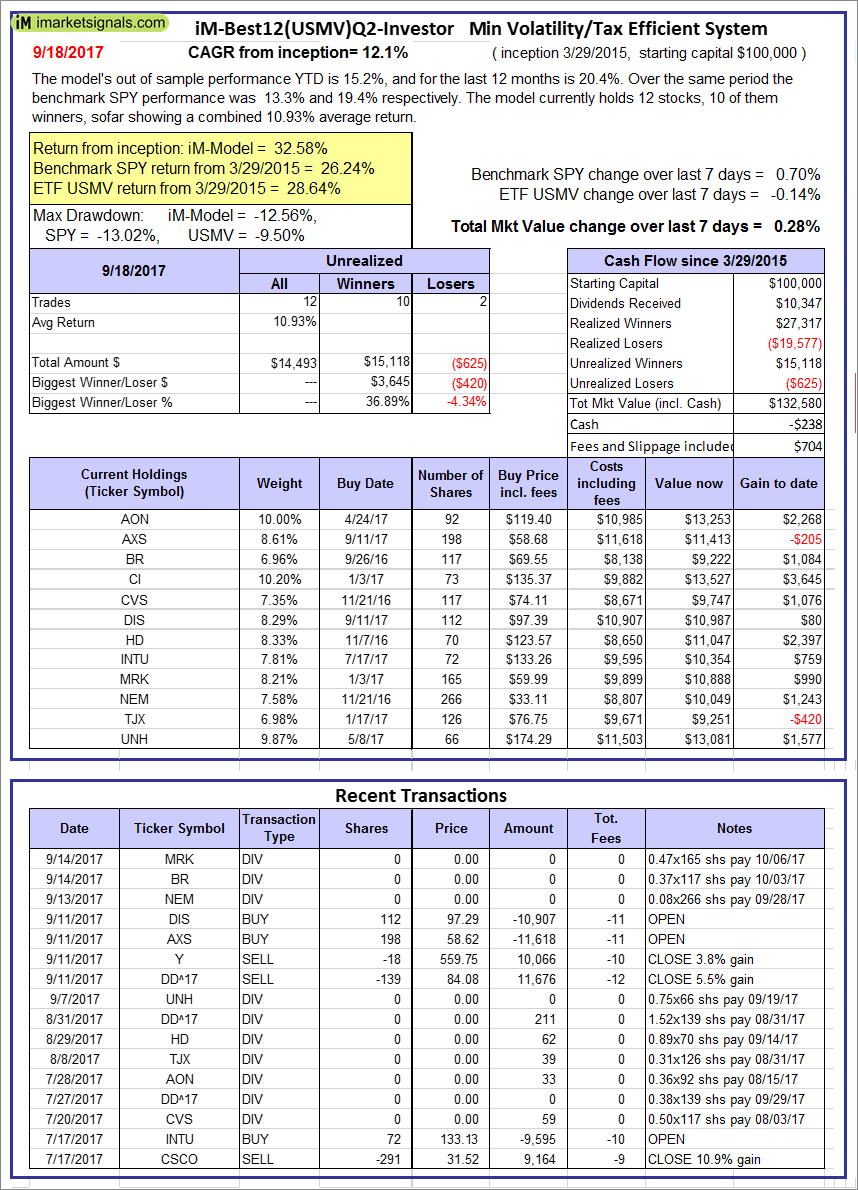
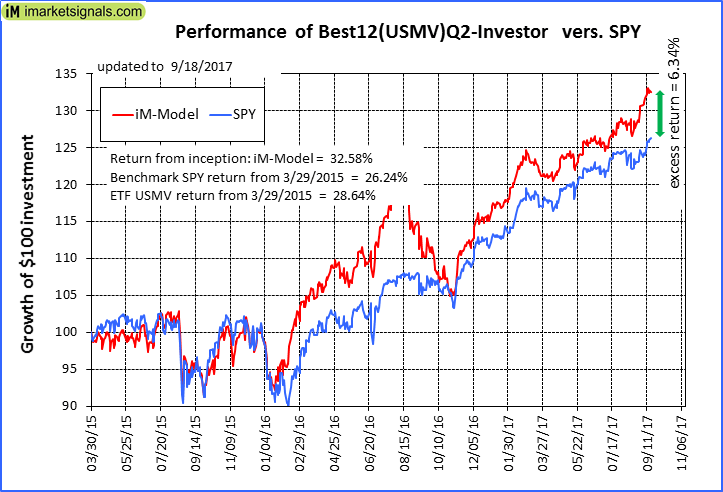
iM-Best12(USMV)Q2-Investor: The model’s out of sample performance YTD is 15.2%, and for the last 12 months is 20.4%. Over the same period the benchmark SPY performance was 13.3% and 19.4% respectively. Since inception, on 3/30/2015, the model gained 32.58% while the benchmark SPY gained 26.24% and the ETF USMV gained 28.64% over the same period. Over the previous week the market value of iM-Best12(USMV)Q2 gained 0.28% at a time when SPY gained 0.70%. A starting capital of $100,000 at inception on 3/30/2015 would have grown to $132,580 which includes -$238 cash and excludes $704 spent on fees and slippage. |
|
|
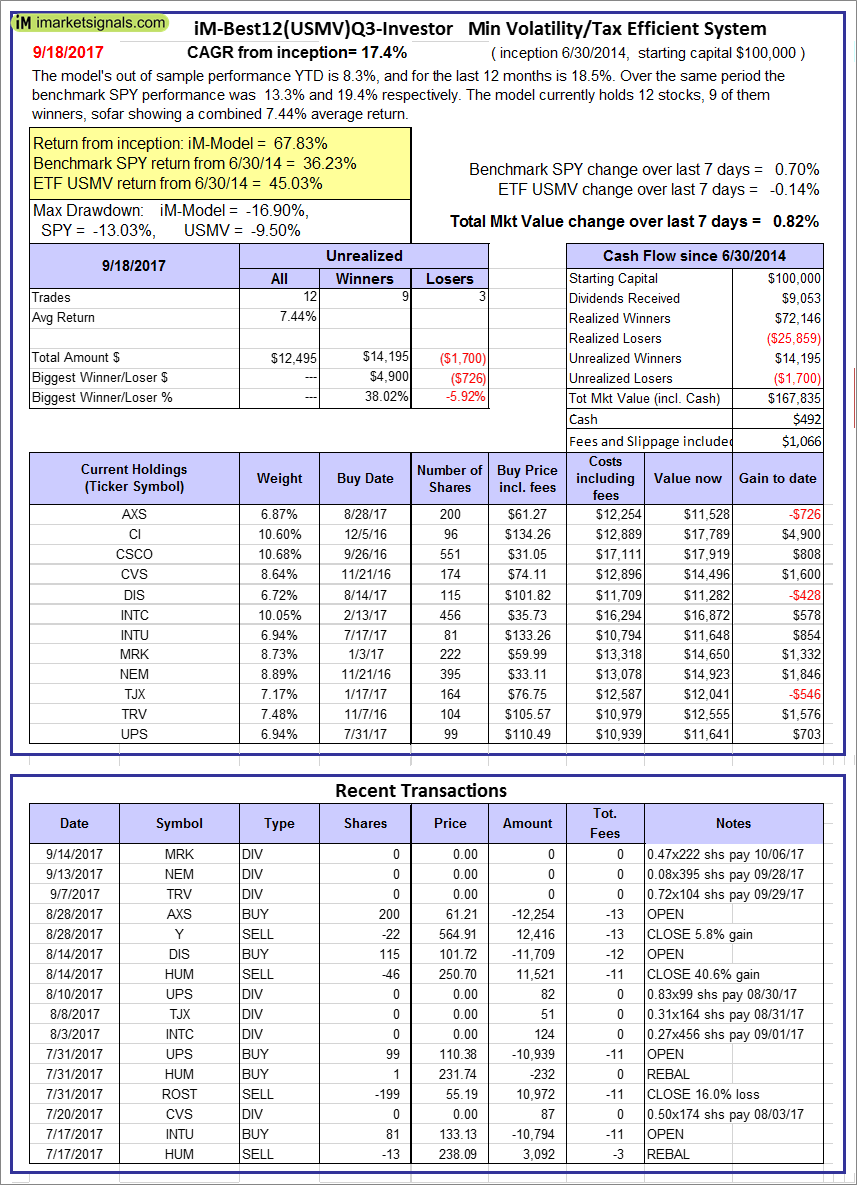
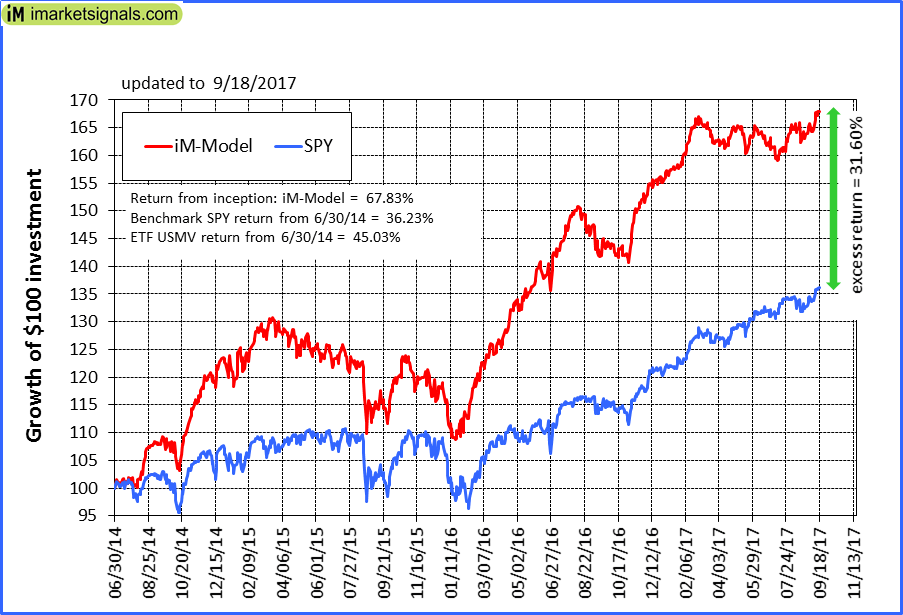
iM-Best12(USMV)Q3-Investor: The model’s out of sample performance YTD is 8.3%, and for the last 12 months is 18.5%. Over the same period the benchmark SPY performance was 13.3% and 19.4% respectively. Since inception, on 7/1/2014, the model gained 67.83% while the benchmark SPY gained 36.23% and the ETF USMV gained 45.03% over the same period. Over the previous week the market value of iM-Best12(USMV)Q3 gained 0.82% at a time when SPY gained 0.70%. A starting capital of $100,000 at inception on 7/1/2014 would have grown to $167,835 which includes $492 cash and excludes $1,066 spent on fees and slippage. |
|
|
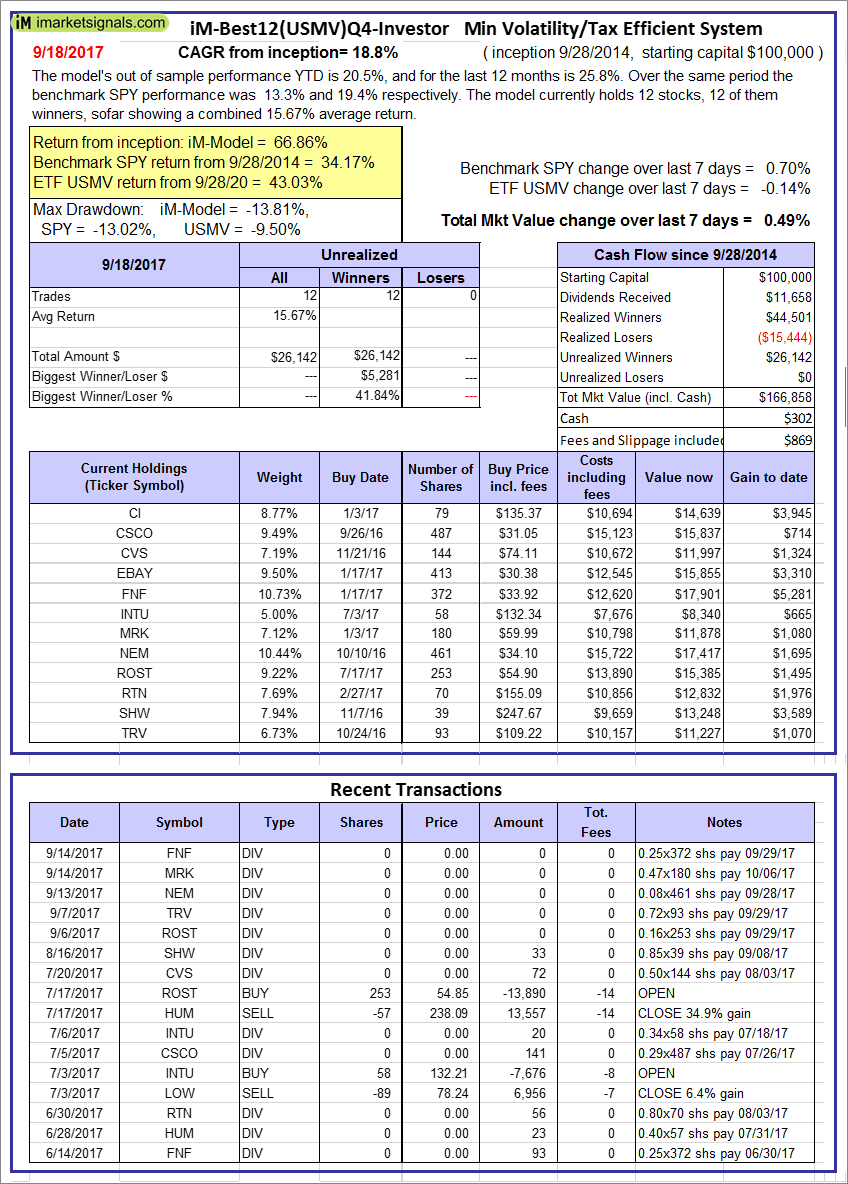
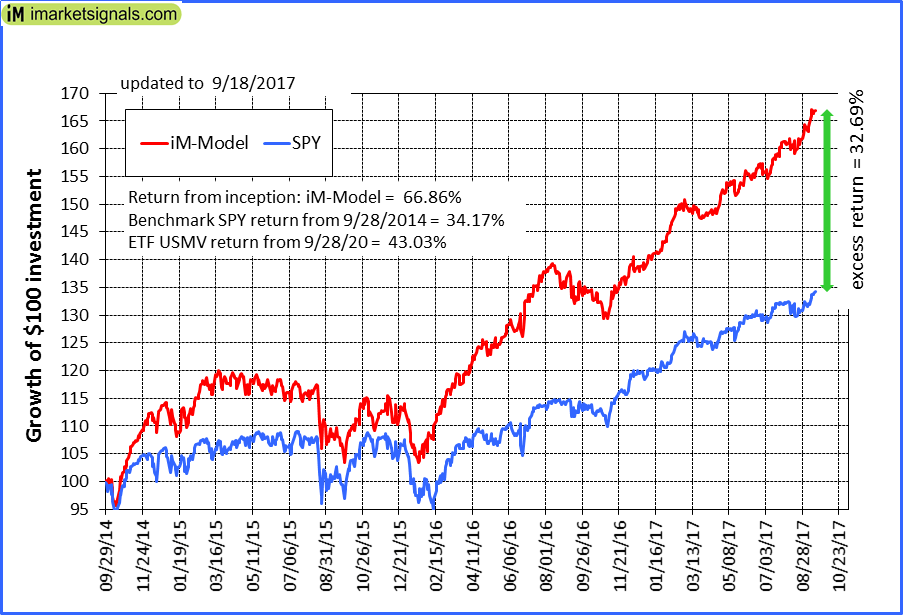
iM-Best12(USMV)Q4-Investor: Since inception, on 9/29/2014, the model gained 66.86% while the benchmark SPY gained 34.17% and the ETF USMV gained 43.03% over the same period. Over the previous week the market value of iM-Best12(USMV)Q4 gained 0.49% at a time when SPY gained 0.70%. A starting capital of $100,000 at inception on 9/29/2014 would have grown to $166,858 which includes $302 cash and excludes $869 spent on fees and slippage. |
|
|
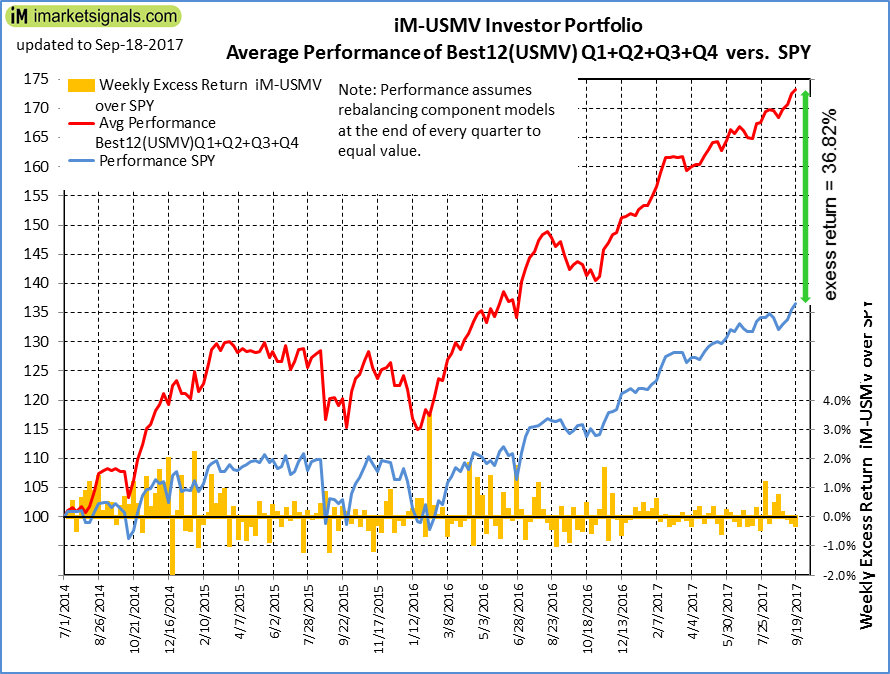
Average Performance of iM-Best12(USMV)Q1+Q2+Q3+Q4-Investor resulted in an excess return of 36.82% over SPY. (see iM-USMV Investor Portfolio) |
|
|
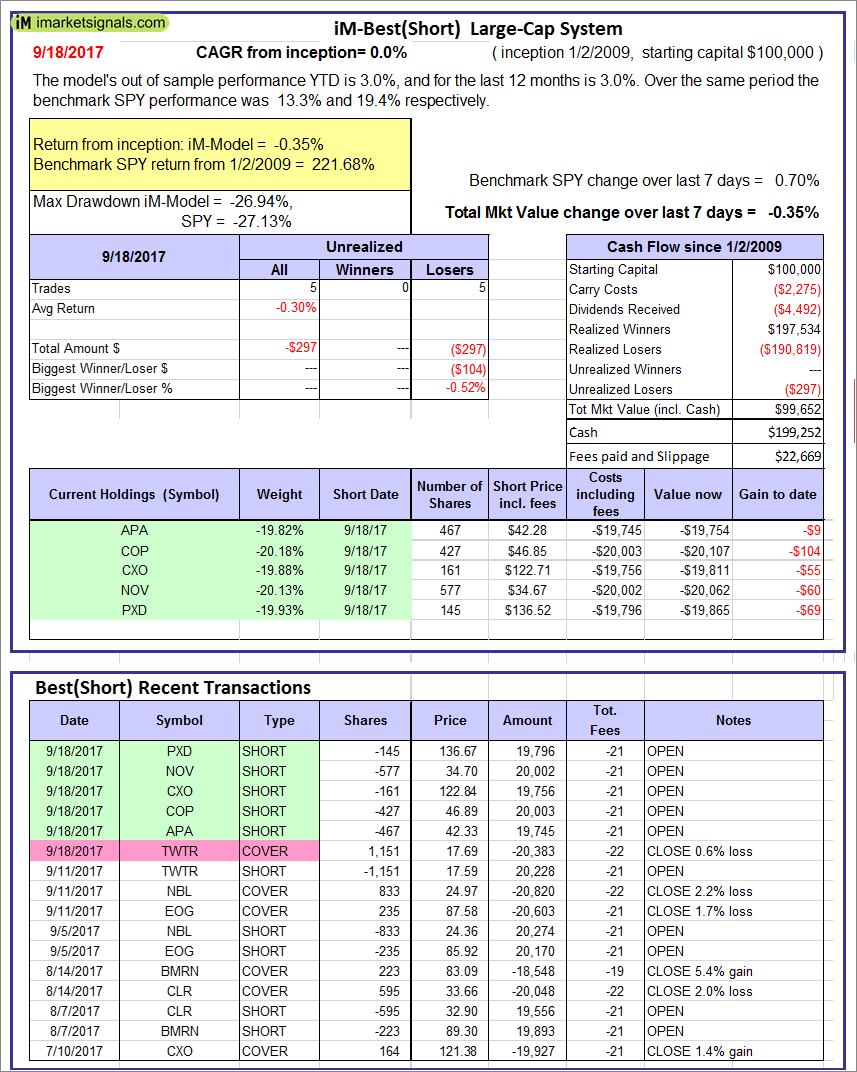
iM-Best(Short): The model’s out of sample performance YTD is 3.0%, and for the last 12 months is 3.0%. Over the same period the benchmark SPY performance was 13.3% and 19.4% respectively. Over the previous week the market value of iM-Best(Short) gained -0.35% at a time when SPY gained 0.70%. Over the period 1/2/2009 to 9/18/2017 the starting capital of $100,000 would have grown to $99,652 which includes $199,252 cash and excludes $22,669 spent on fees and slippage. |
|
|
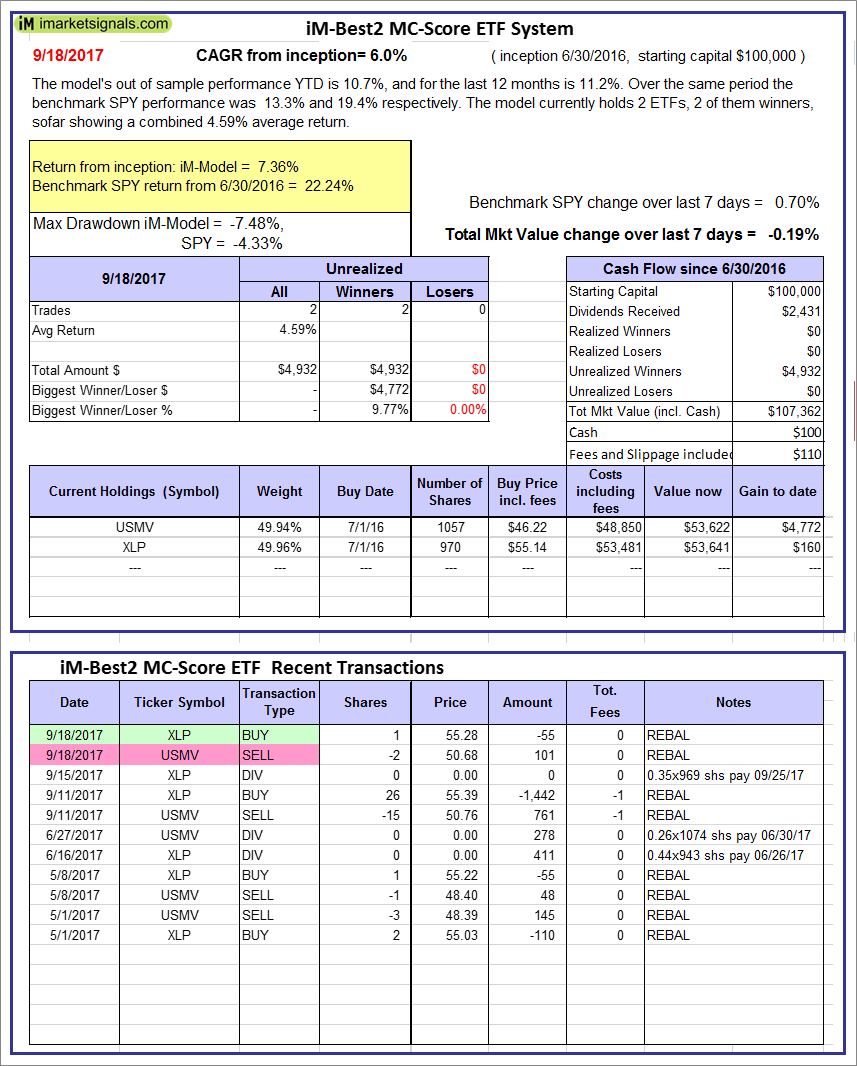
iM-Best2 MC-Score ETF System: The model’s out of sample performance YTD is 10.7%, and for the last 12 months is 11.2%. Over the same period the benchmark SPY performance was 13.3% and 19.4% respectively. Over the previous week the market value of the iM-Best2 MC-Score ETF System gained -0.19% at a time when SPY gained 0.70%. A starting capital of $100,000 at inception on 6/30/2016 would have grown to $107,362 which includes $100 cash and excludes $110 spent on fees and slippage. |
|
|
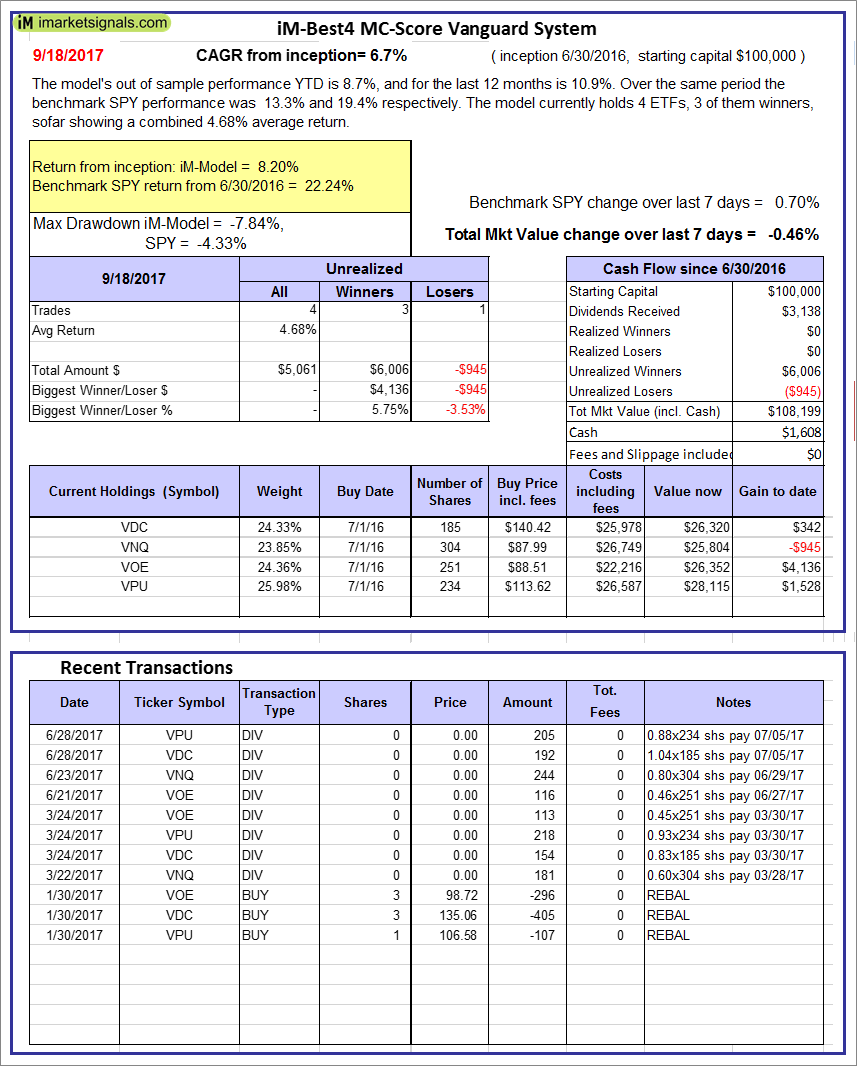
iM-Best4 MC-Score Vanguard System: The model’s out of sample performance YTD is 8.7%, and for the last 12 months is 10.9%. Over the same period the benchmark SPY performance was 13.3% and 19.4% respectively. Over the previous week the market value of the iM-Best4 MC-Score Vanguard System gained -0.46% at a time when SPY gained 0.70%. A starting capital of $100,000 at inception on 6/30/2016 would have grown to $108,199 which includes $1,608 cash and excludes $00 spent on fees and slippage. |
|
|
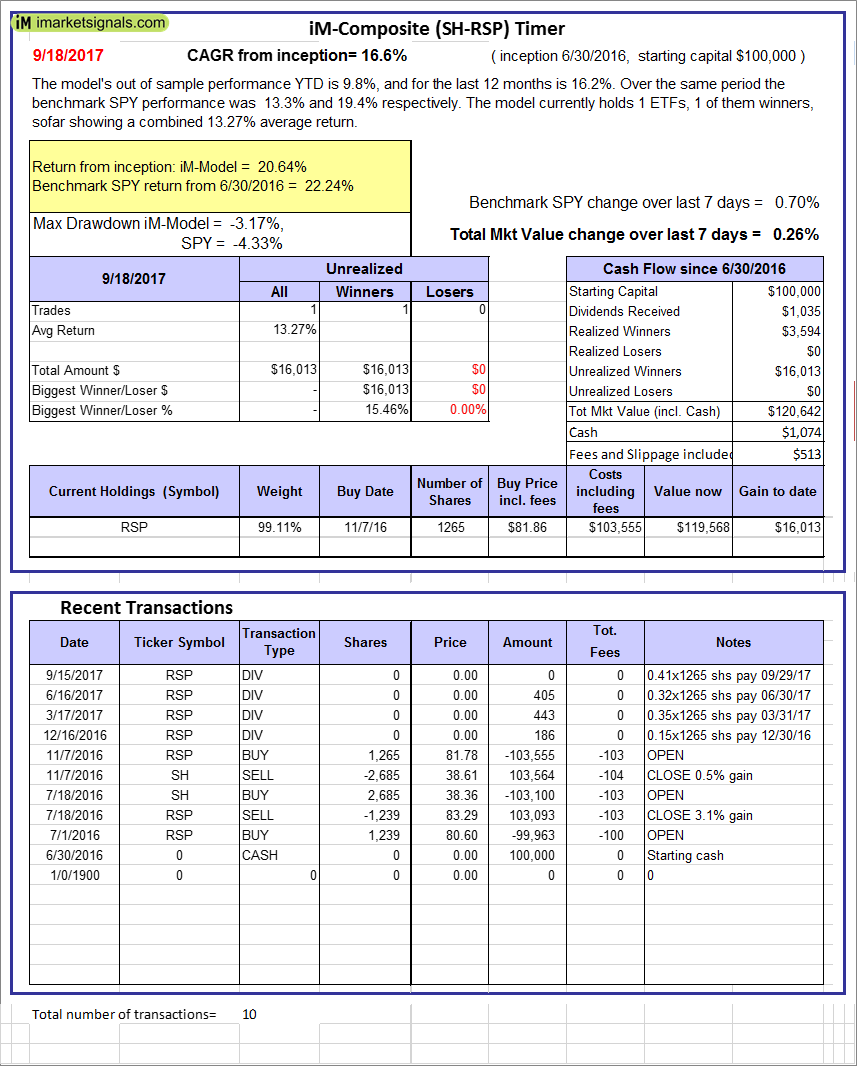
iM-Composite (SH-RSP) Timer: The model’s out of sample performance YTD is 9.8%, and for the last 12 months is 16.2%. Over the same period the benchmark SPY performance was 13.3% and 19.4% respectively. Over the previous week the market value of the iM-Composite (SH-RSP) Timer gained 0.26% at a time when SPY gained 0.70%. A starting capital of $100,000 at inception on 6/30/2016 would have grown to $120,642 which includes $1,074 cash and excludes $513 spent on fees and slippage. |
|
|
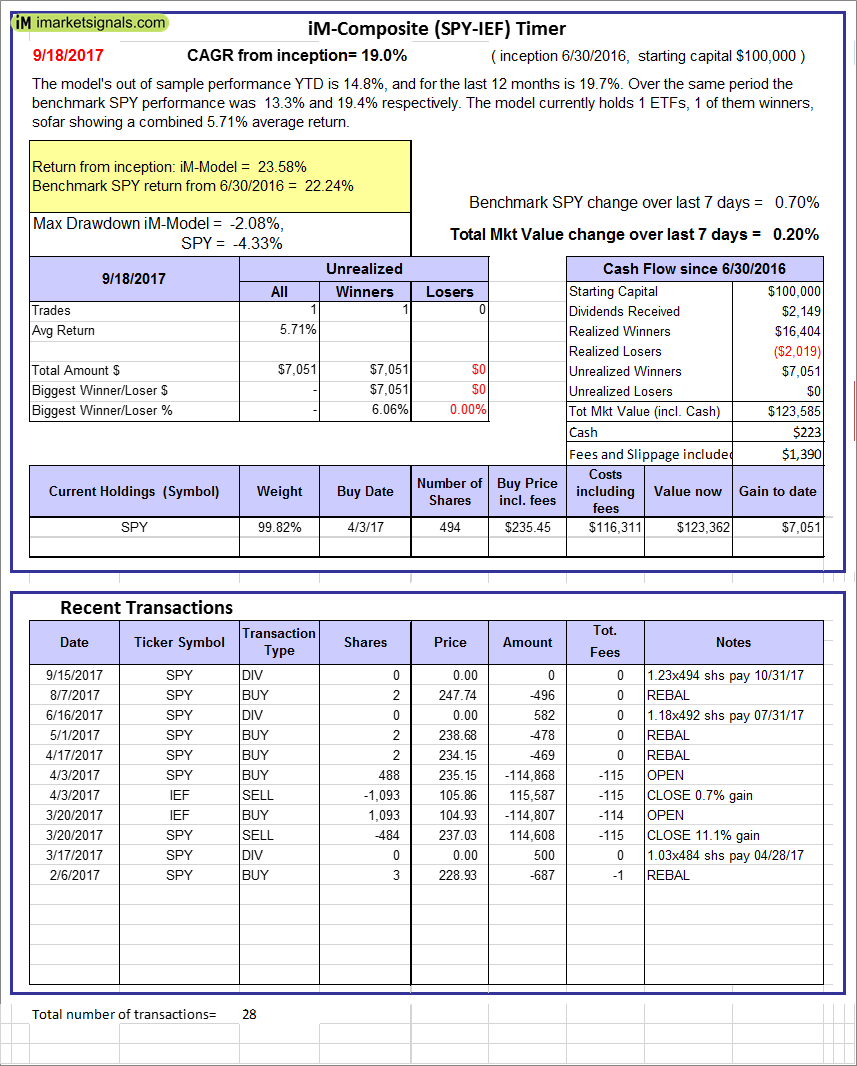
iM-Composite (SPY-IEF) Timer: The model’s out of sample performance YTD is 14.8%, and for the last 12 months is 19.7%. Over the same period the benchmark SPY performance was 13.3% and 19.4% respectively. Over the previous week the market value of the iM-Composite (SPY-IEF) Timer gained 0.20% at a time when SPY gained 0.70%. A starting capital of $100,000 at inception on 6/30/2016 would have grown to $123,585 which includes $223 cash and excludes $1,390 spent on fees and slippage. |
|
|
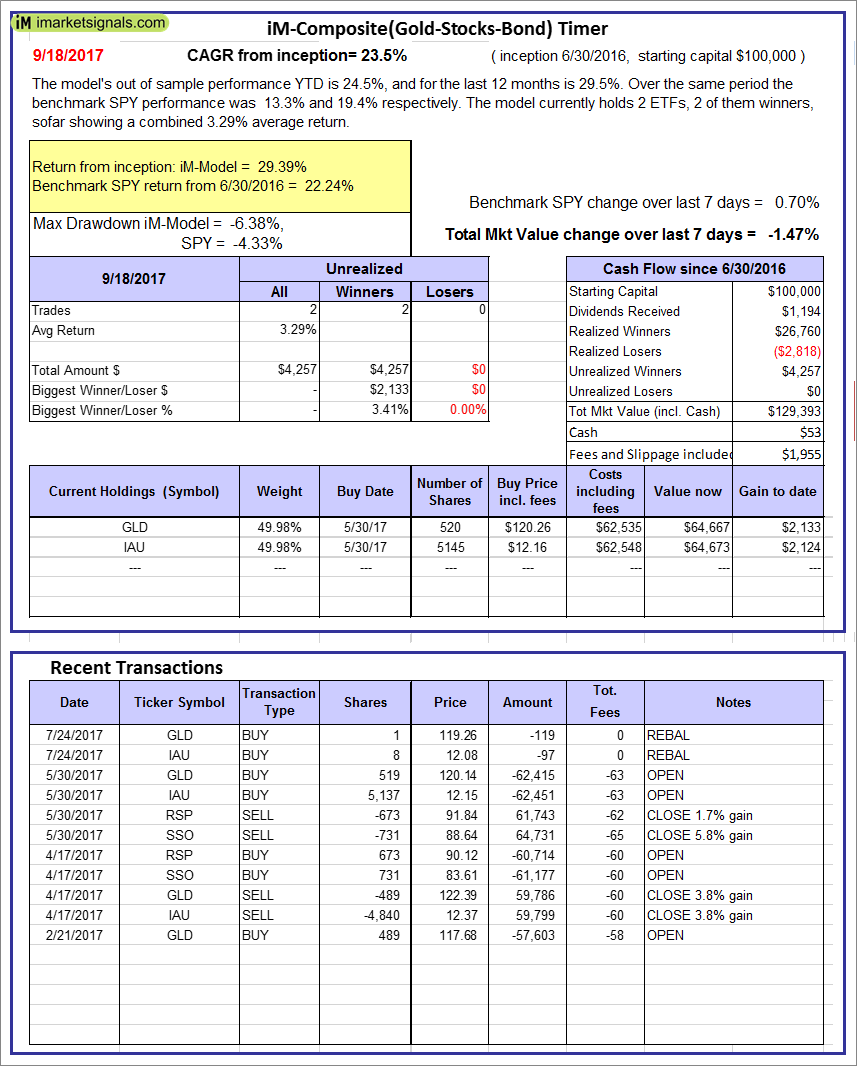
iM-Composite(Gold-Stocks-Bond) Timer: The model’s out of sample performance YTD is 24.5%, and for the last 12 months is 29.5%. Over the same period the benchmark SPY performance was 13.3% and 19.4% respectively. Over the previous week the market value of the iM-Composite(Gold-Stocks-Bond) Timer gained -1.47% at a time when SPY gained 0.70%. A starting capital of $100,000 at inception on 6/30/2016 would have grown to $129,393 which includes $53 cash and excludes $1,955 spent on fees and slippage. |
|
|
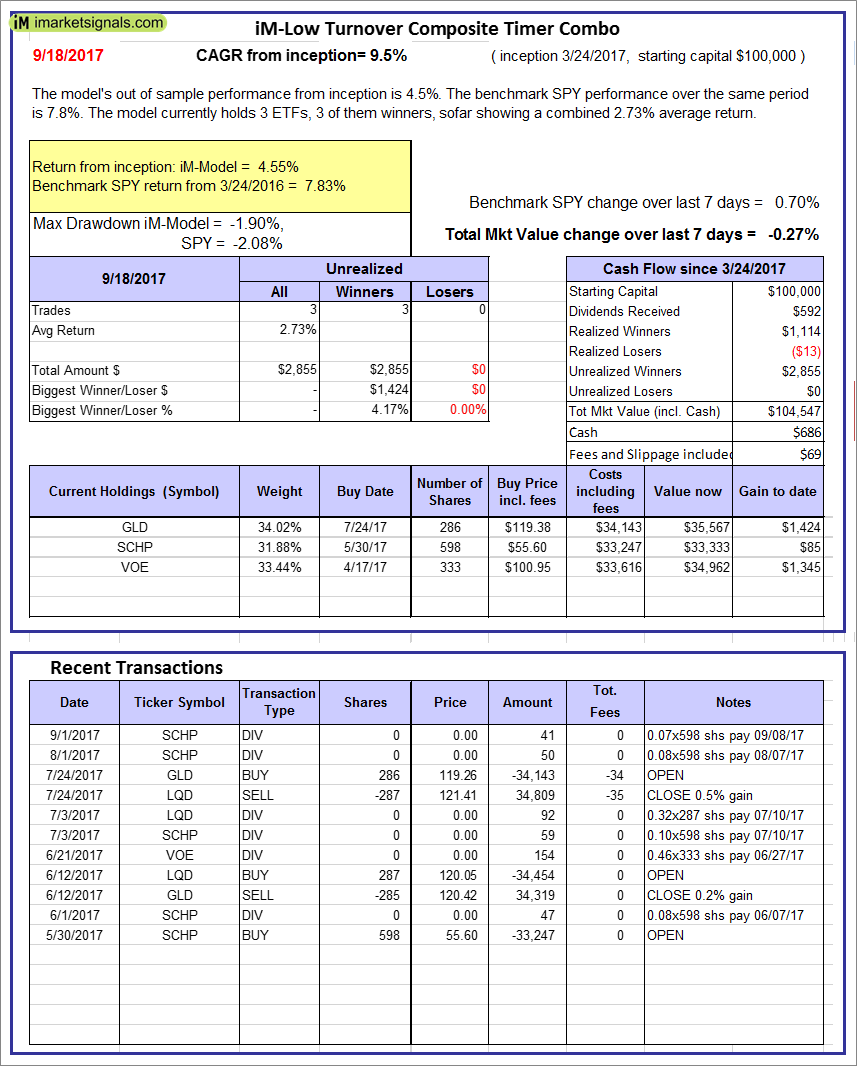
iM-Low Turnover Composite Timer Combo: The model’s out of sample performance from inception is 4.5%. The benchmark SPY performance over the same period is 7.8%. Over the previous week the market value of the iM-Low Turnover Composite Timer Combo gained -0.27% at a time when SPY gained 0.70%. A starting capital of $100,000 at inception on 3/24/27 would have grown to $104,547 which includes $686 cash and excludes $69 spent on fees and slippage. |
|
|
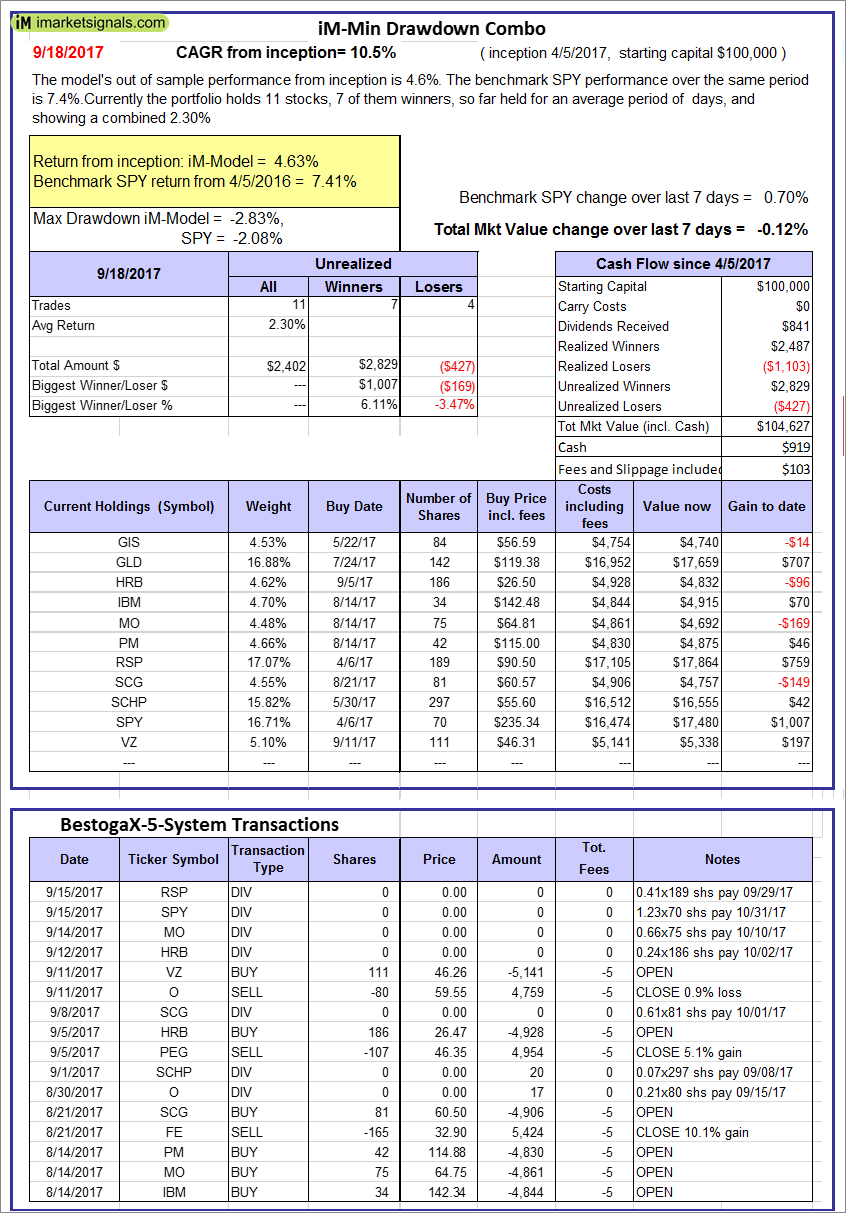
iM-Min Drawdown Combo: The model’s out of sample performance from inception is 4.6%. The benchmark SPY performance over the same period is 7.4%. Over the previous week the market value of the iM-Min Drawdown Combo gained -0.12% at a time when SPY gained 0.70%. A starting capital of $100,000 at inception on 4/5/2017 would have grown to $104,627 which includes $919 cash and excludes $103 spent on fees and slippage. |
|
|
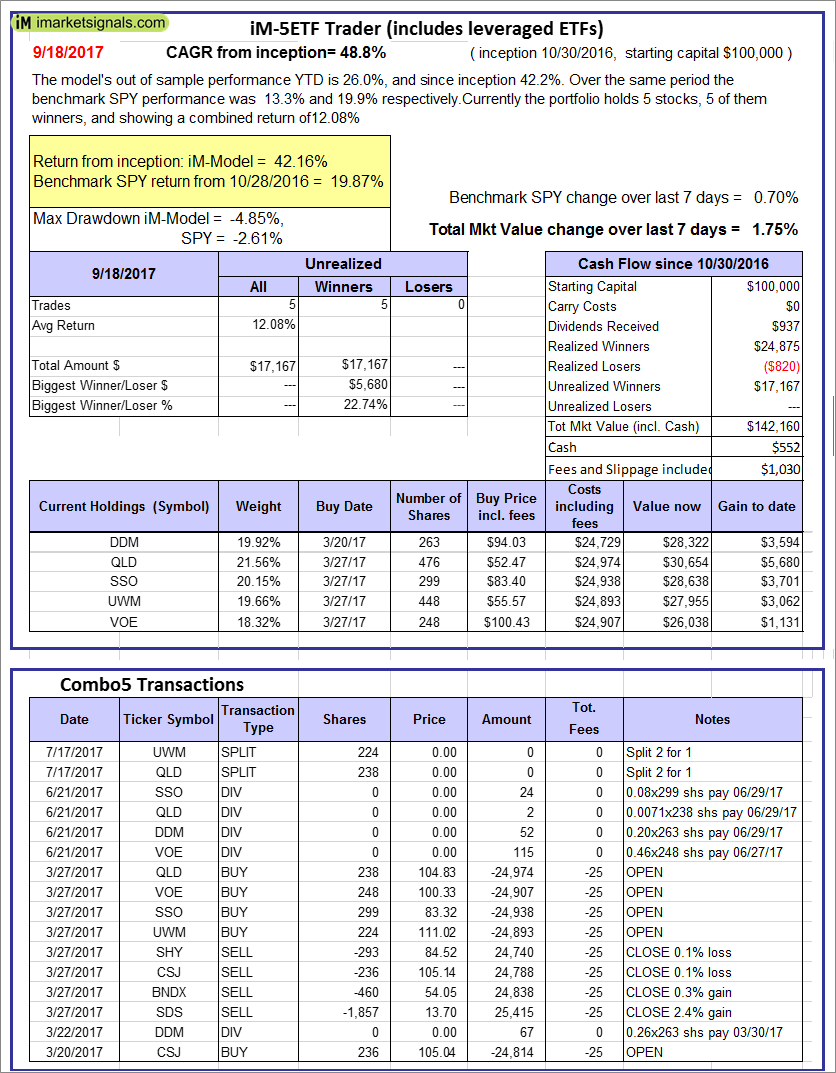
iM-5ETF Trader (includes leveraged ETFs): The model’s out of sample performance YTD is 13.5%, and since inception 16.7%. Over the same period the benchmark SPY performance was 13.3% and 19.9% respectively. Over the previous week the market value of the iM-5ETF Trader (includes leveraged ETFs) gained 1.75% at a time when SPY gained 0.70%. A starting capital of $100,000 at inception on 10/30/2016 would have grown to $142,160 which includes $552 cash and excludes $1,030 spent on fees and slippage. |
|
|
iM-Standard 5ETF Trader (excludes leveraged ETFs): The model’s out of sample performance YTD is 13.5%, and since inception 16.7%. Over the same period the benchmark SPY performance was 13.3% and 19.9% respectively. Over the previous week the market value of the iM-Standard 5ETF Trader (excludes leveraged ETFs) gained 0.76% at a time when SPY gained 0.70%. A starting capital of $100,000 at inception on 10/30/2016 would have grown to $116,717 which includes $863 cash and excludes $880 spent on fees and slippage. |


Leave a Reply
You must be logged in to post a comment.