
  |
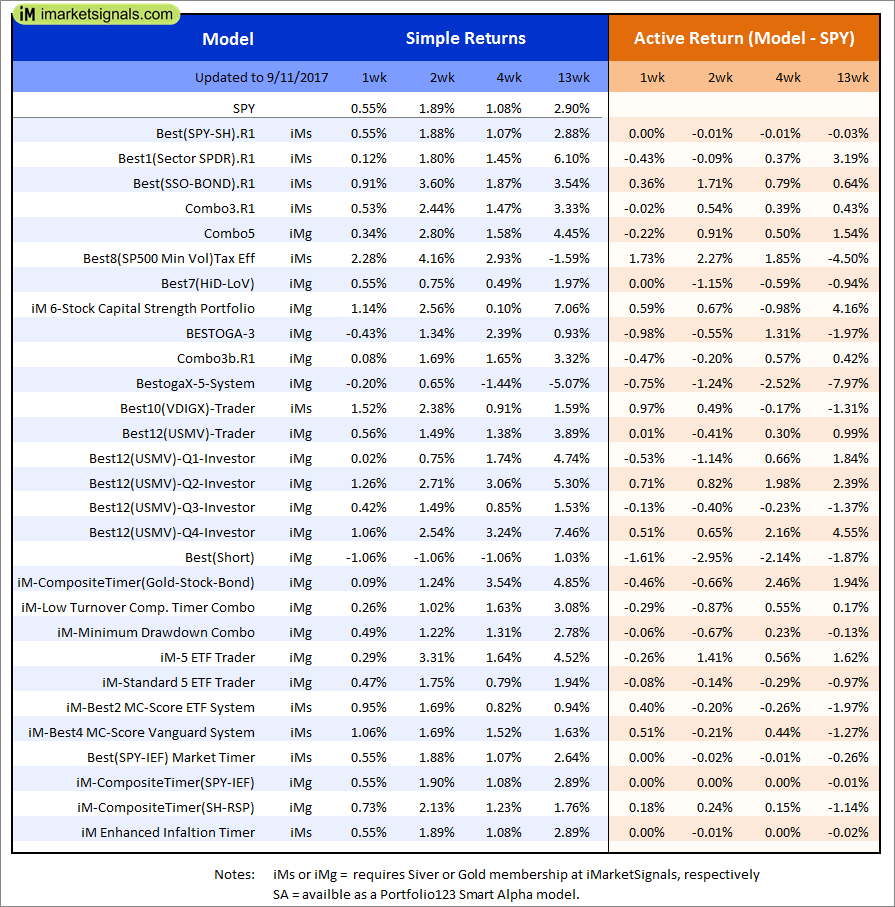
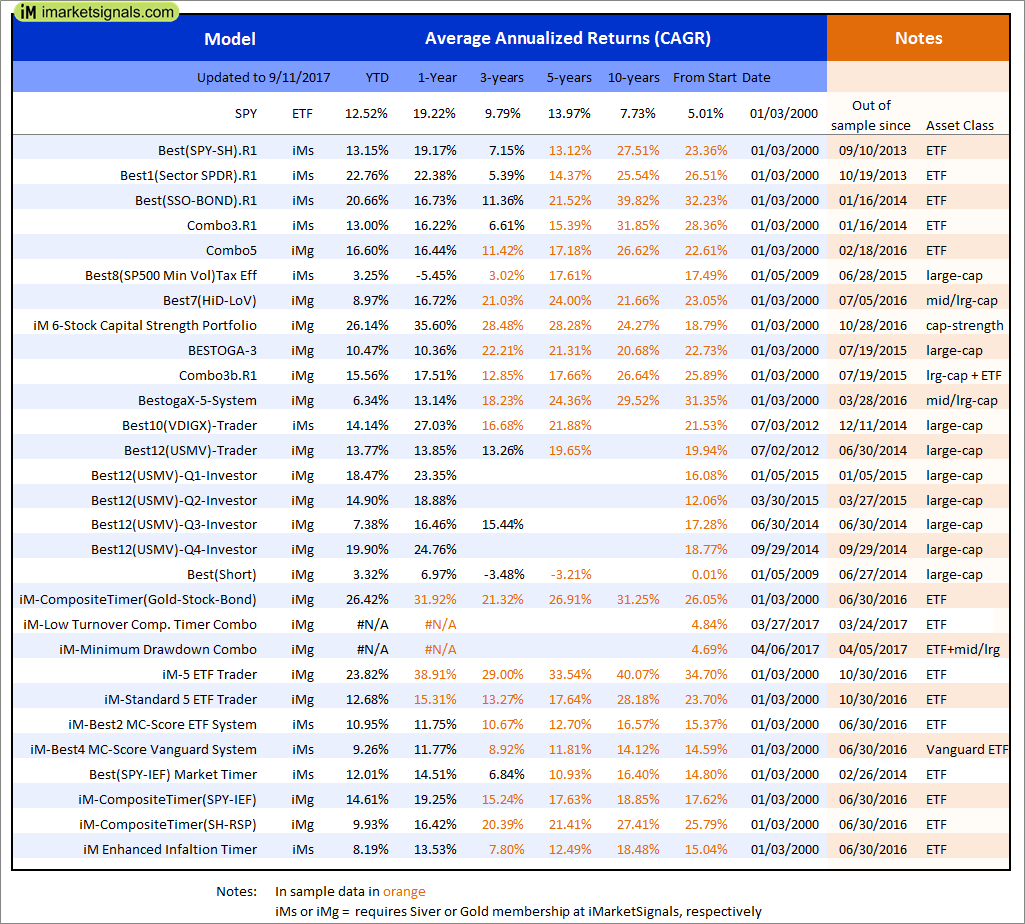
Out of sample performance summary of our models for the past 1, 2, 4 and 13 week periods. The active active return indicates how the models over- or underperformed the benchmark ETF SPY. Also the YTD, and the 1-, 3-, 5- and 10-year annualized returns are shown in the second table |
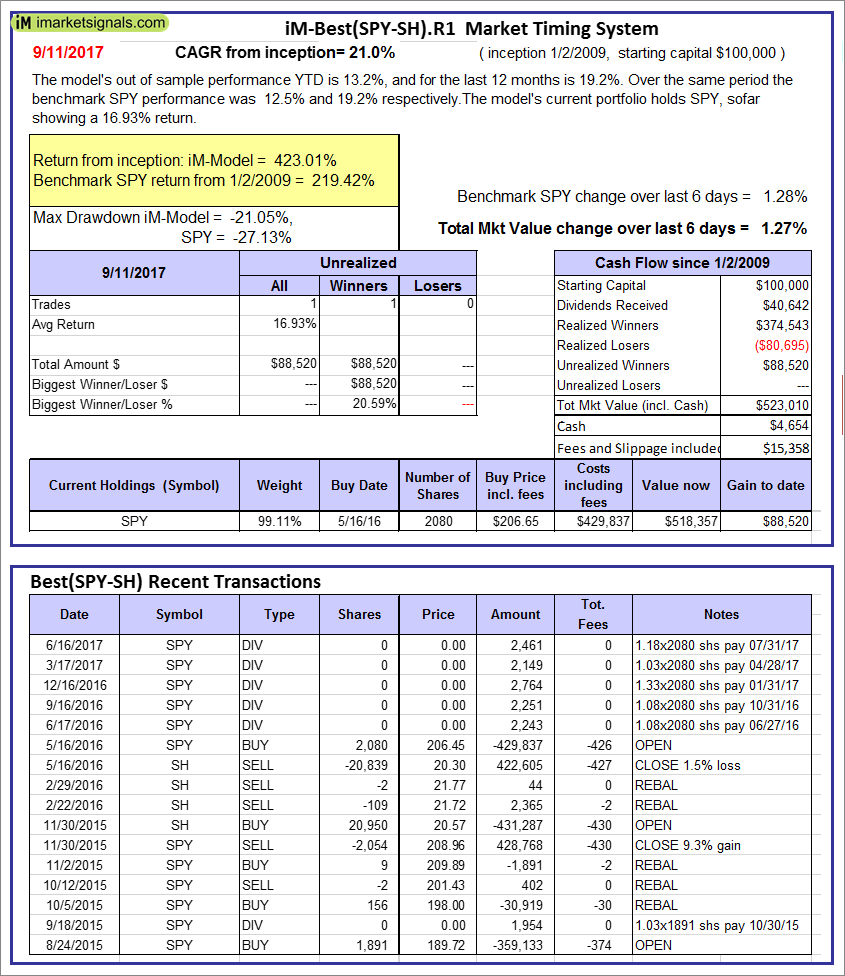 |
iM-Best(SPY-SH).R1: The model’s out of sample performance YTD is 13.2%, and for the last 12 months is 19.2%. Over the same period the benchmark SPY performance was 12.5% and 19.2% respectively. Over the previous week the market value of Best(SPY-SH) gained 1.27% at a time when SPY gained 1.28%. A starting capital of $100,000 at inception on 1/2/2009 would have grown to $523,010 which includes $4,654 cash and excludes $15,358 spent on fees and slippage. |
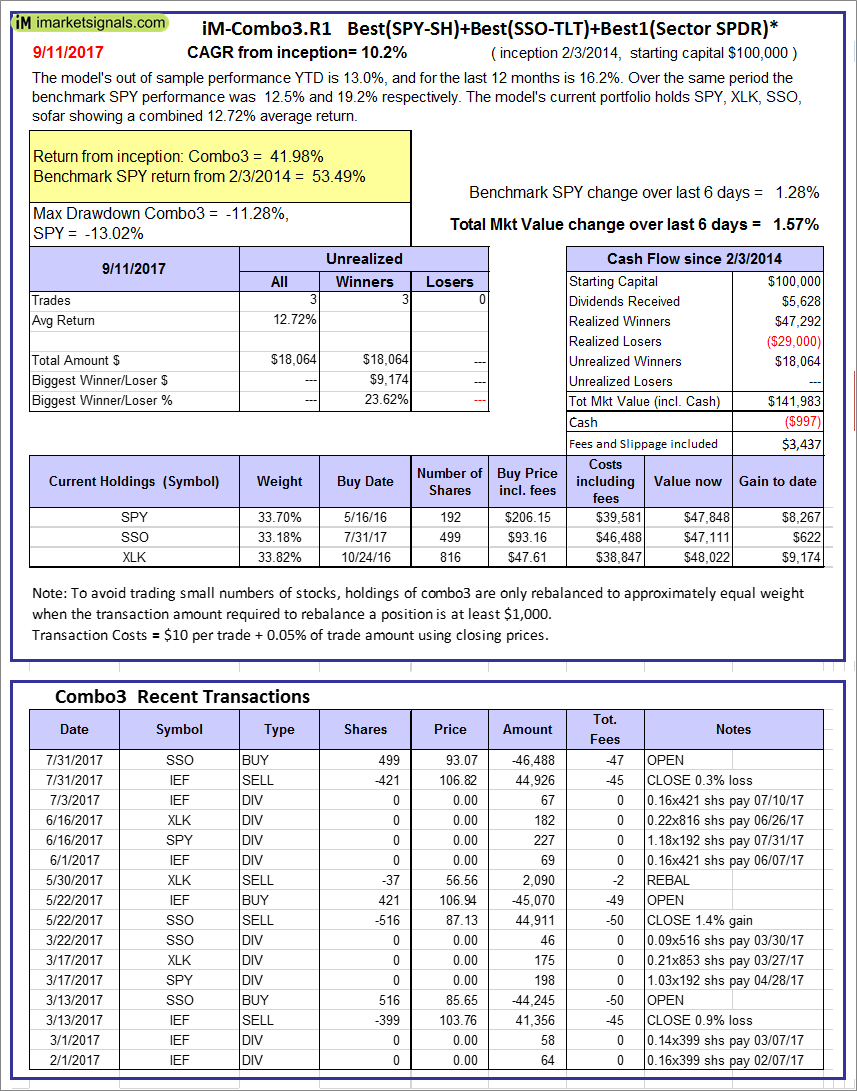 |
iM-Combo3.R1: The model’s out of sample performance YTD is 13.0%, and for the last 12 months is 16.2%. Over the same period the benchmark SPY performance was 12.5% and 19.2% respectively. Over the previous week the market value of iM-Combo3.R1 gained 1.57% at a time when SPY gained 1.28%. A starting capital of $100,000 at inception on 2/3/2014 would have grown to $141,983 which includes -$997 cash and excludes $3,437 spent on fees and slippage. |
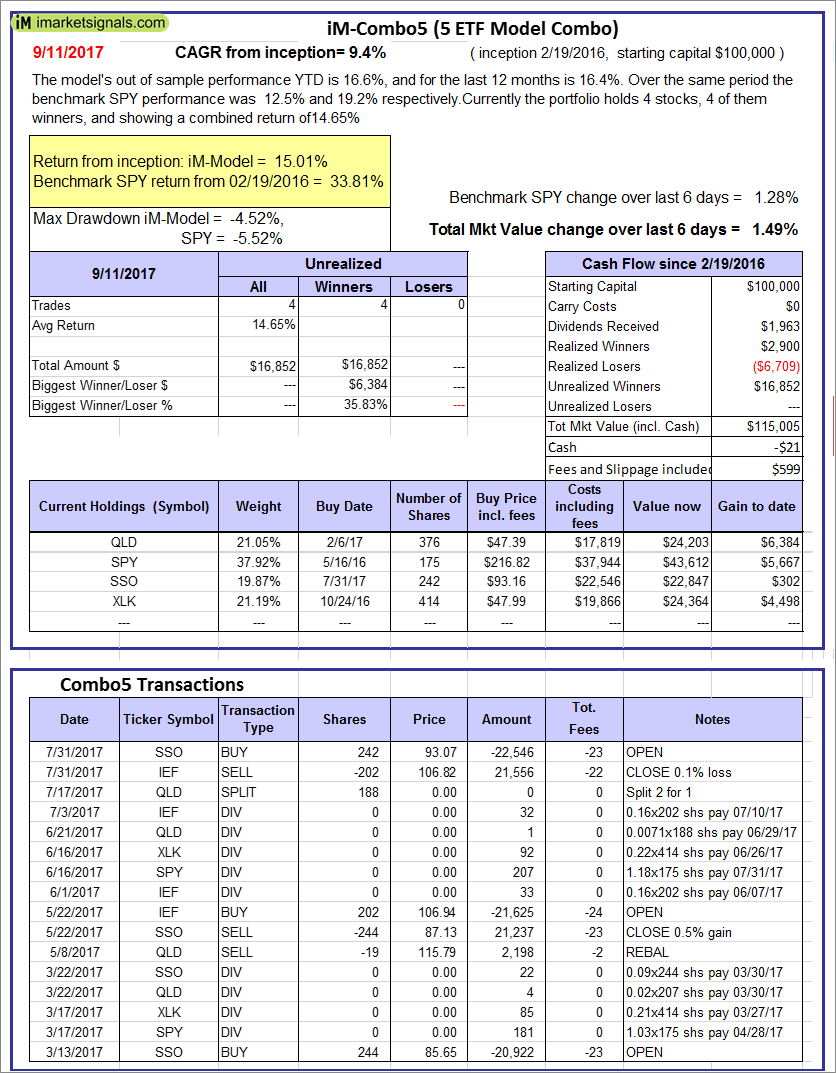 |
iM-Combo5: The model’s out of sample performance YTD is 16.6%, and for the last 12 months is 16.4%. Over the same period the benchmark SPY performance was 12.5% and 19.2% respectively. Over the previous week the market value of iM-Combo5 gained 1.49% at a time when SPY gained 1.28%. A starting capital of $100,000 at inception on 2/22/2016 would have grown to $115,005 which includes -$21 cash and excludes $599 spent on fees and slippage. |
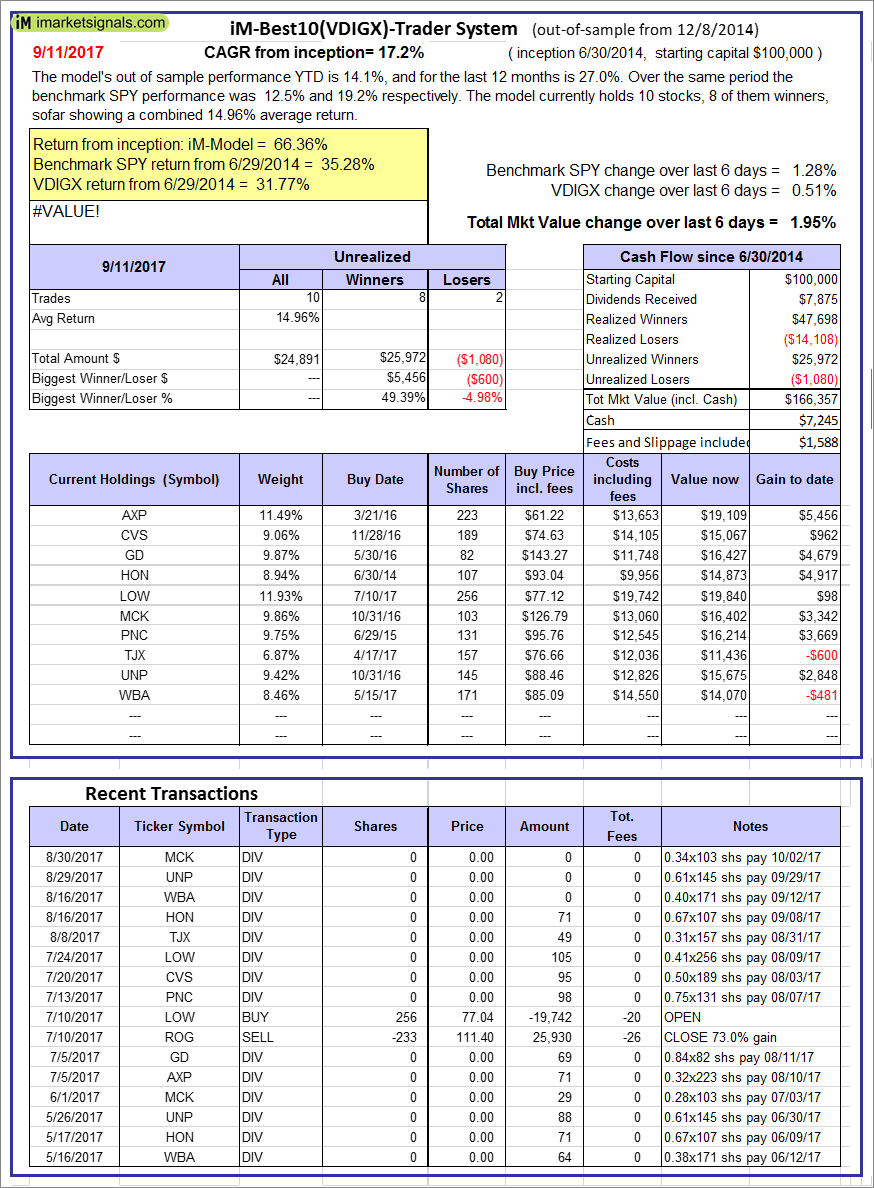 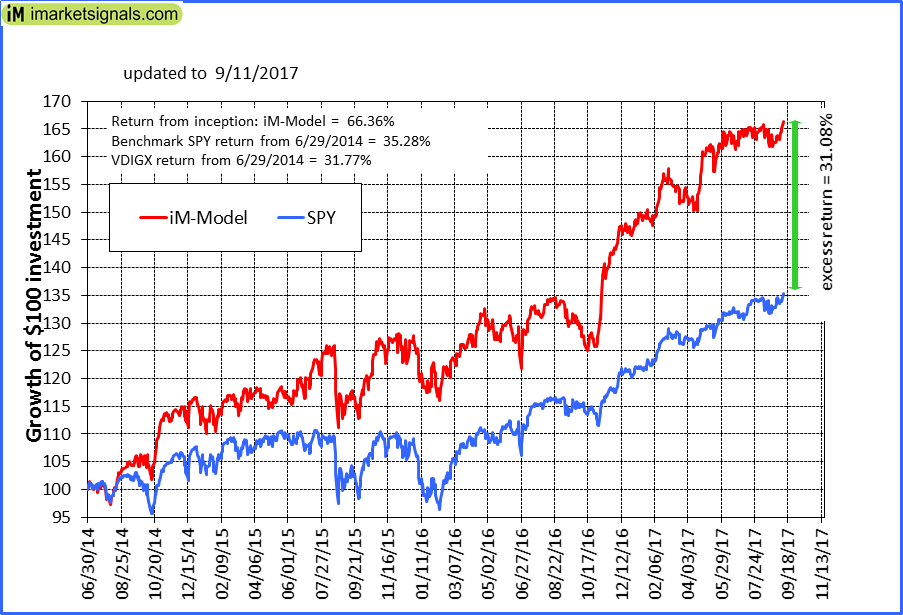 |
iM-Best10(VDIGX)-Trader: The model’s out of sample performance YTD is 14.1%, and for the last 12 months is 27.0%. Over the same period the benchmark SPY performance was 12.5% and 19.2% respectively. Since inception, on 7/1/2014, the model gained 66.36% while the benchmark SPY gained 35.28% and VDIGX gained 31.77% over the same period. Over the previous week the market value of iM-Best10(VDIGX) gained 1.95% at a time when SPY gained 1.28%. A starting capital of $100,000 at inception on 7/1/2014 would have grown to $166,357 which includes $7,245 cash and excludes $1,588 spent on fees and slippage. |
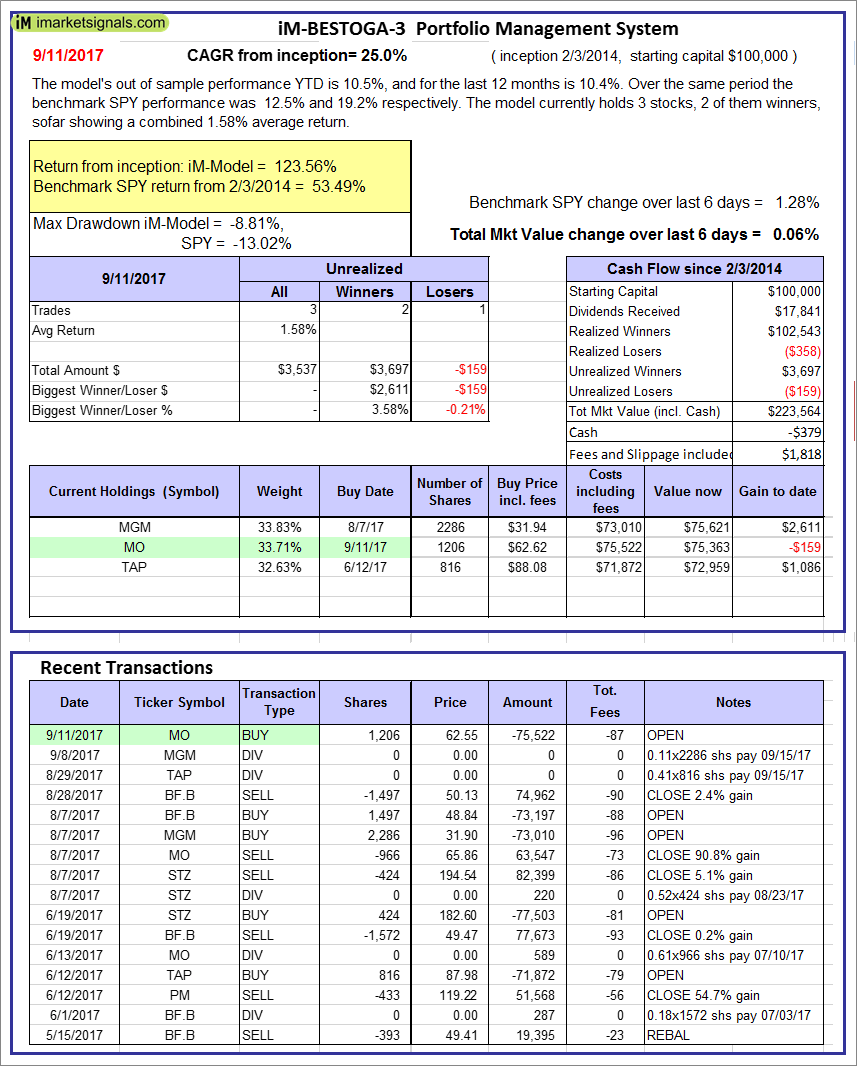 |
iM-BESTOGA-3: The model’s out of sample performance YTD is 10.5%, and for the last 12 months is 10.4%. Over the same period the benchmark SPY performance was 12.5% and 19.2% respectively. Over the previous week the market value of iM-BESTOGA-3 gained 0.06% at a time when SPY gained 1.28%. A starting capital of $100,000 at inception on 2/3/2014 would have grown to $223,564 which includes -$379 cash and excludes $1,818 spent on fees and slippage. |
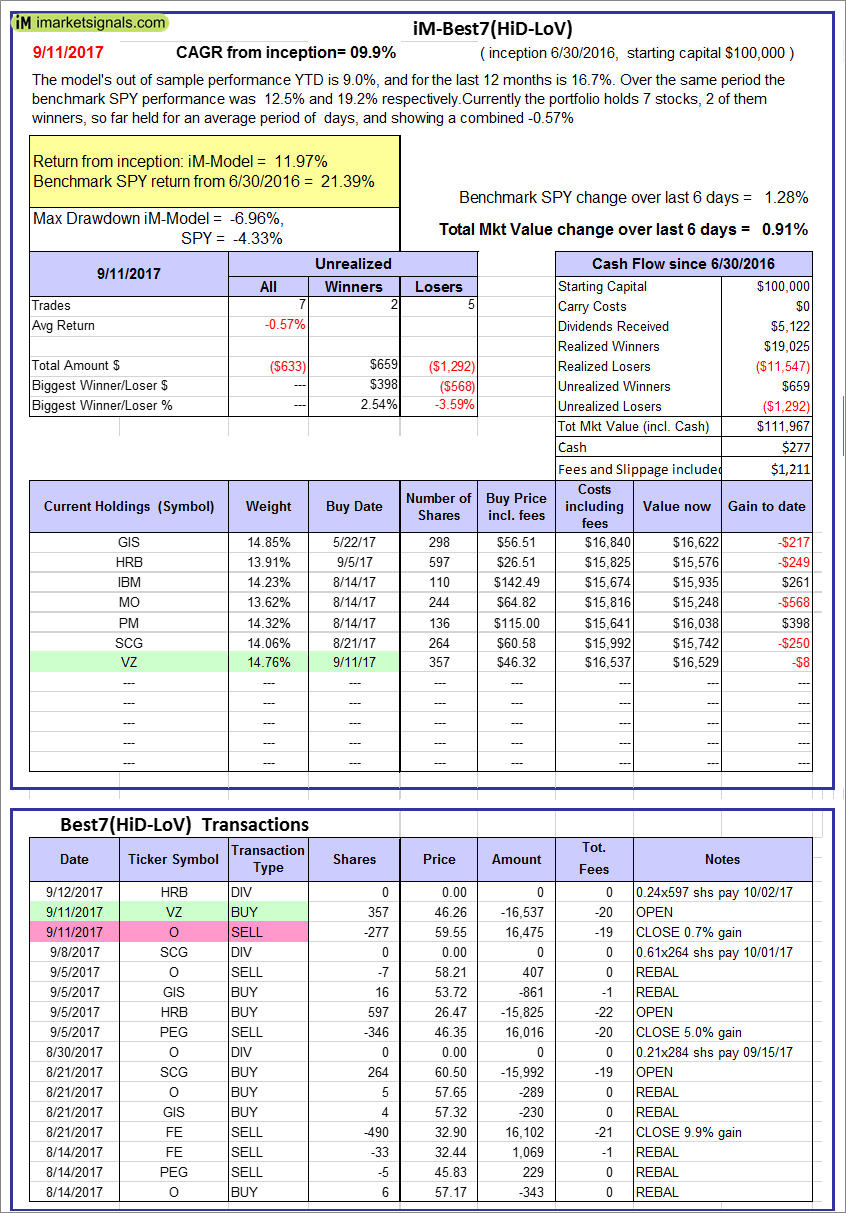 |
iM-Best7(HiD-LoV): The model’s out of sample performance YTD is 9.0%, and for the last 12 months is 16.7%. Over the same period the benchmark SPY performance was 12.5% and 19.2% respectively. Over the previous week the market value of iM-BESTOGA-3 gained 0.91% at a time when SPY gained 1.28%. A starting capital of $100,000 at inception on 6/30/2016 would have grown to $111,967 which includes $277 cash and excludes $1,211 spent on fees and slippage. |
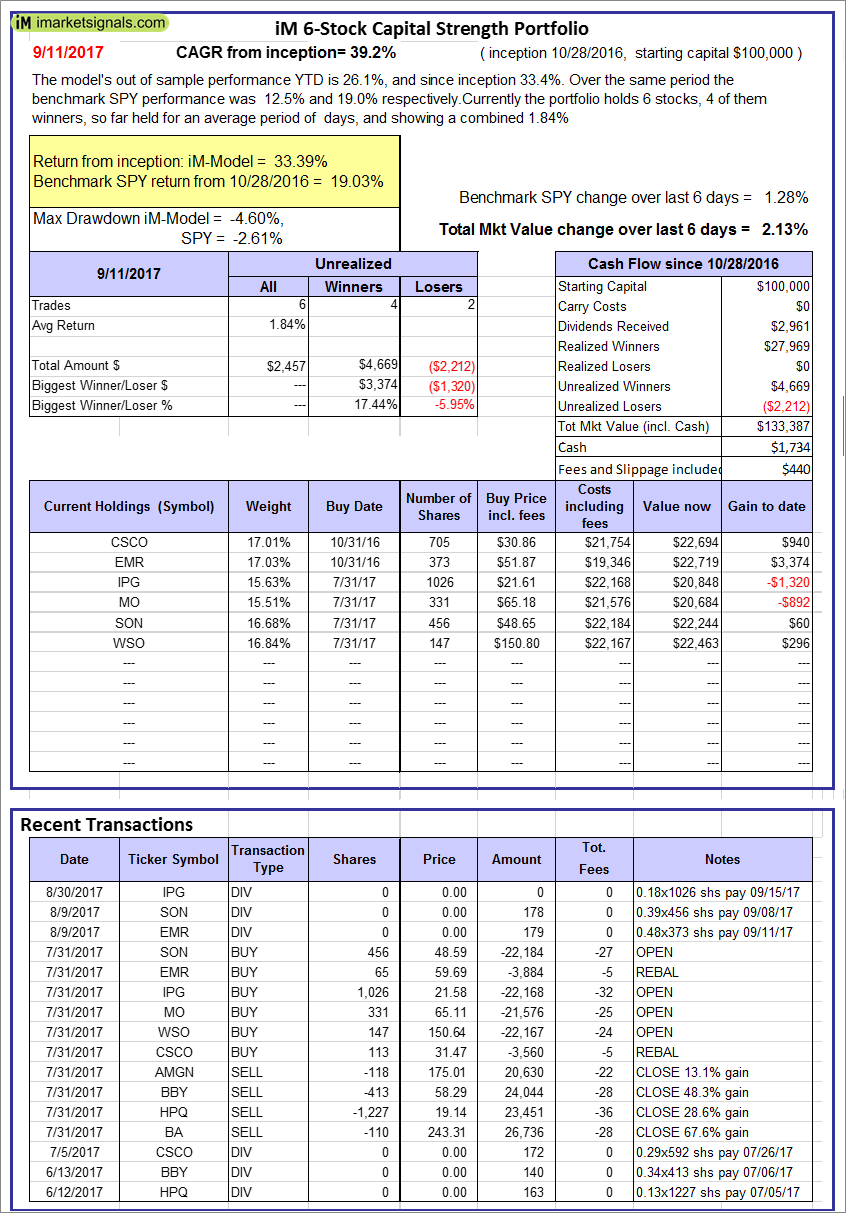 |
iM 6-Stock Capital Strength Portfolio: The model’s out of sample performance YTD is 26.1%, and since inception 33.4%. Over the same period the benchmark SPY performance was 12.5% and 19.0% respectively. Over the previous week the market value of the iM 6-Stock Capital Strength Portfolio gained 2.13% at a time when SPY gained 1.28%. A starting capital of $100,000 at inception on 10/28/2016 would have grown to $133,387 which includes $1,734 cash and excludes $440 spent on fees and slippage. |
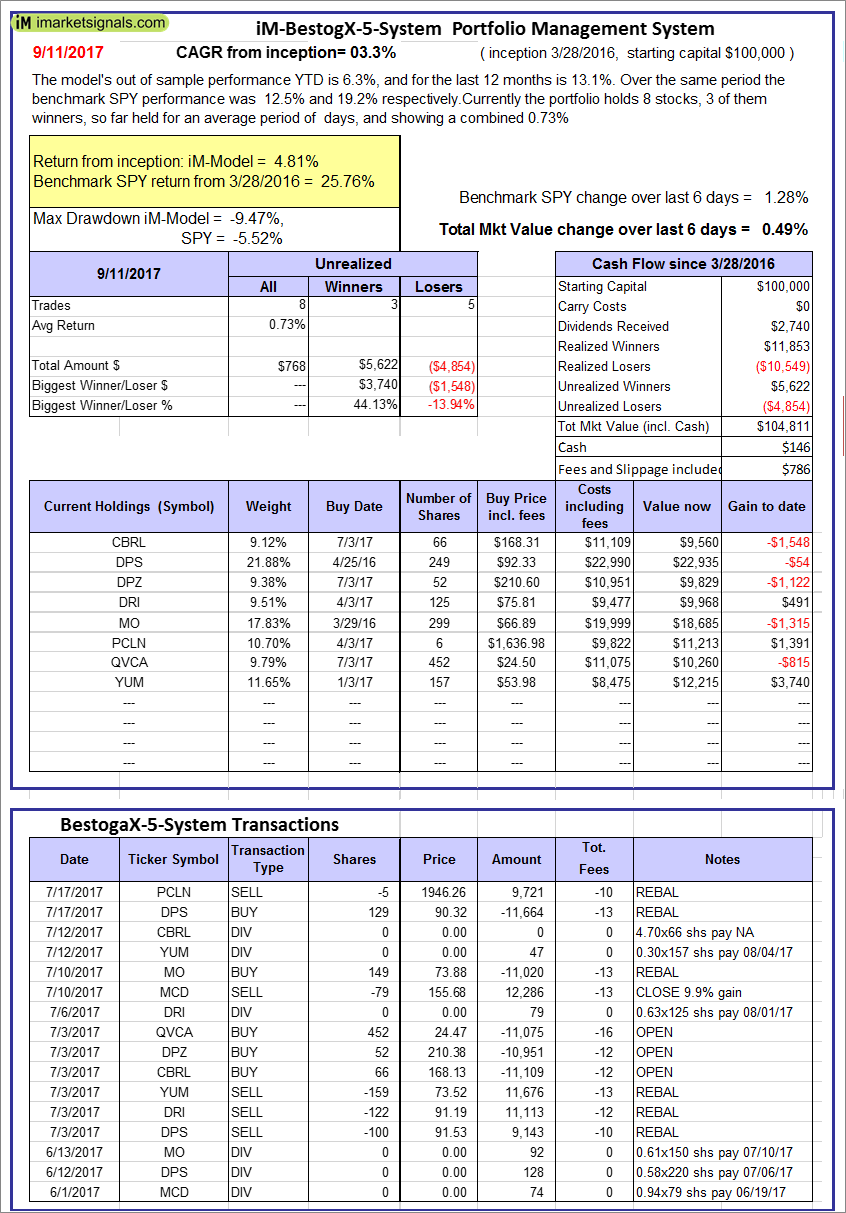 |
iM-BestogaX5-System: The model’s out of sample performance YTD is 6.3%, and for the last 12 months is 13.1%. Over the same period the benchmark SPY performance was 12.5% and 19.2% respectively. Over the previous week the market value of iM-Best8(S&P 500)Tax-Eff. gained 0.49% at a time when SPY gained 1.28%. A starting capital of $100,000 at inception on 3/28/2016 would have grown to $104,811 which includes $146 cash and excludes $786 spent on fees and slippage. |
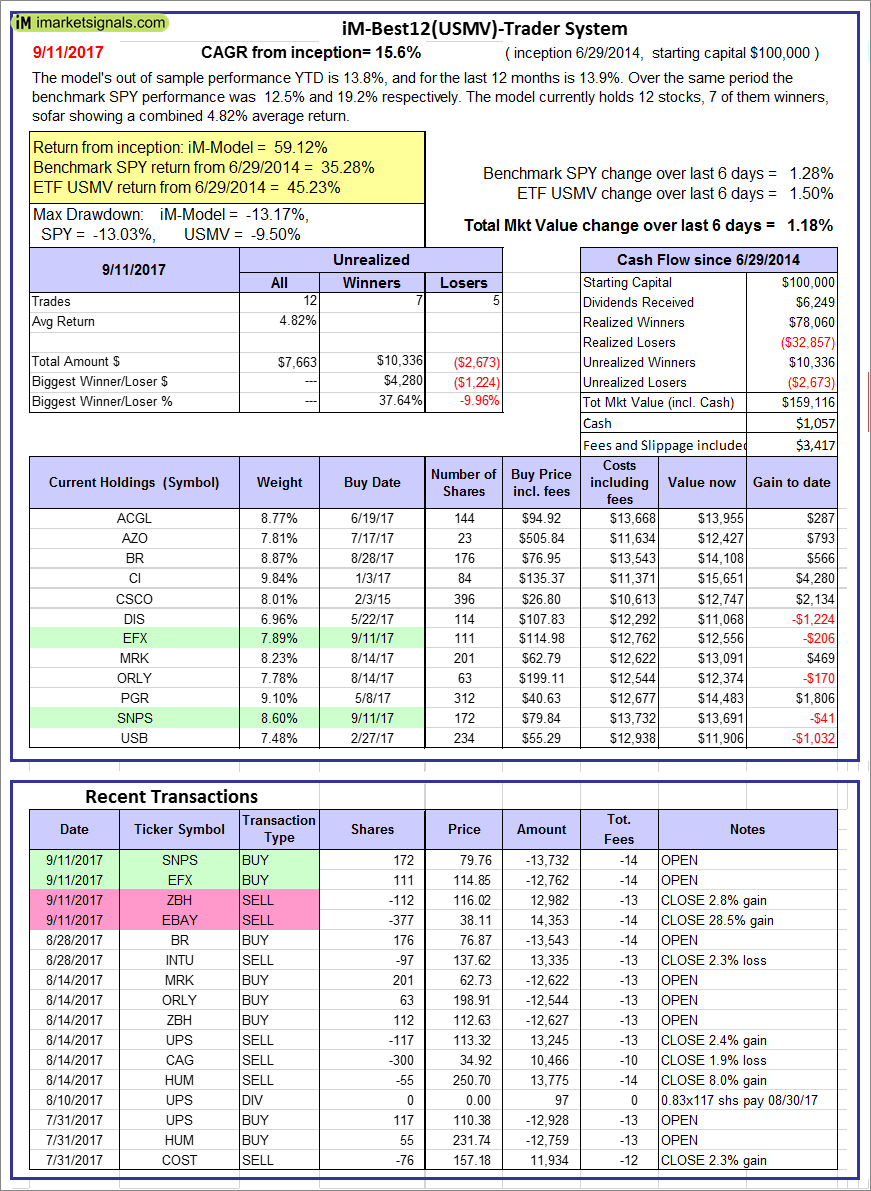 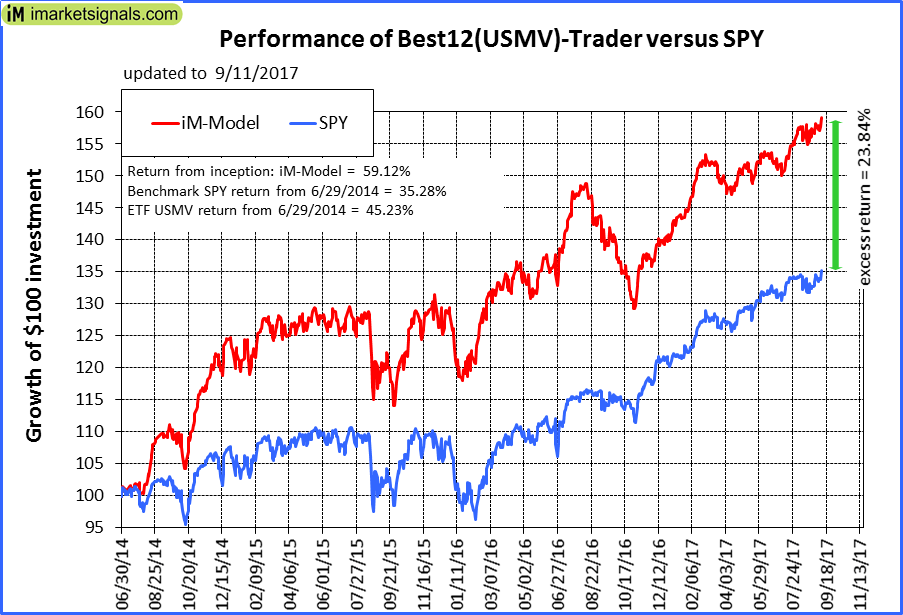 |
iM-Best12(USMV)-Trader: The model’s out of sample performance YTD is 13.8%, and for the last 12 months is 13.9%. Over the same period the benchmark SPY performance was 12.5% and 19.2% respectively. Since inception, on 6/30/2014, the model gained 59.12% while the benchmark SPY gained 35.28% and the ETF USMV gained 45.23% over the same period. Over the previous week the market value of iM-Best12(USMV)-Trader gained 1.18% at a time when SPY gained 1.28%. A starting capital of $100,000 at inception on 6/30/2014 would have grown to $159,116 which includes $1,057 cash and excludes $3,417 spent on fees and slippage. |
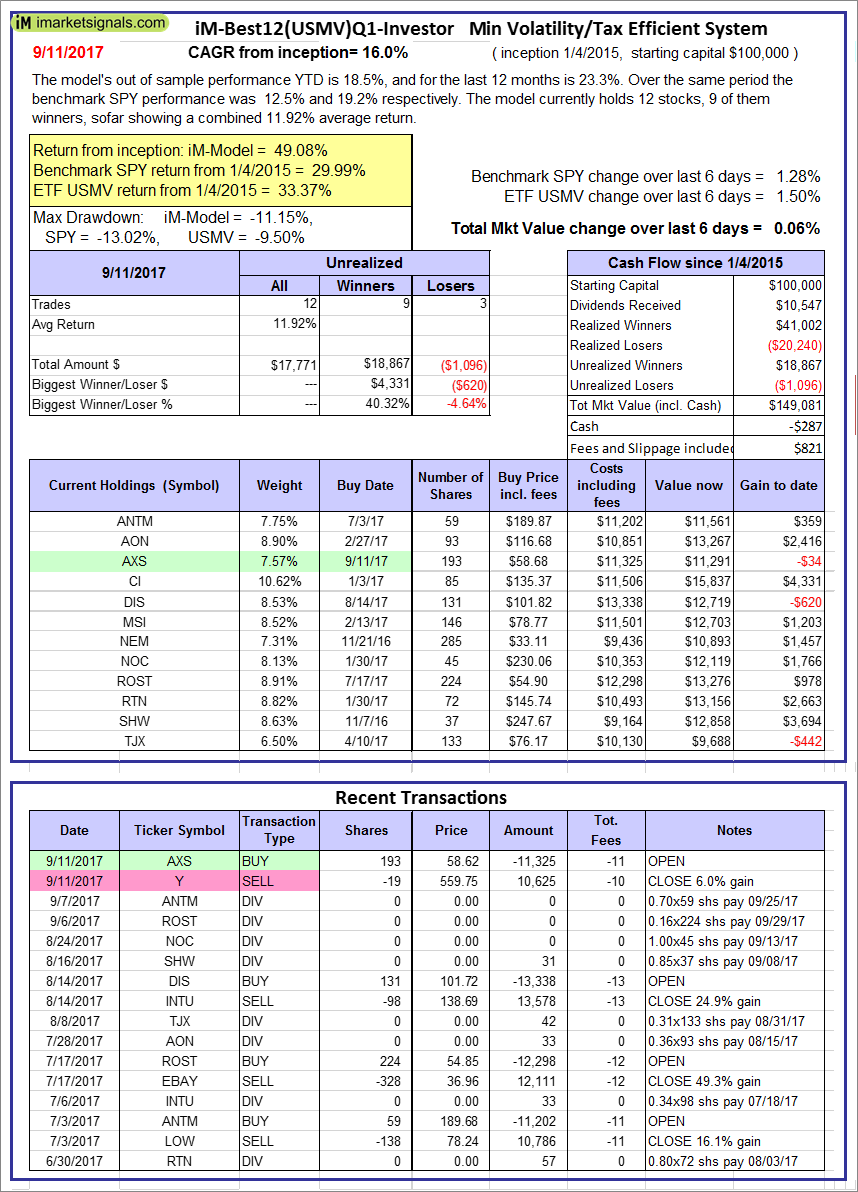 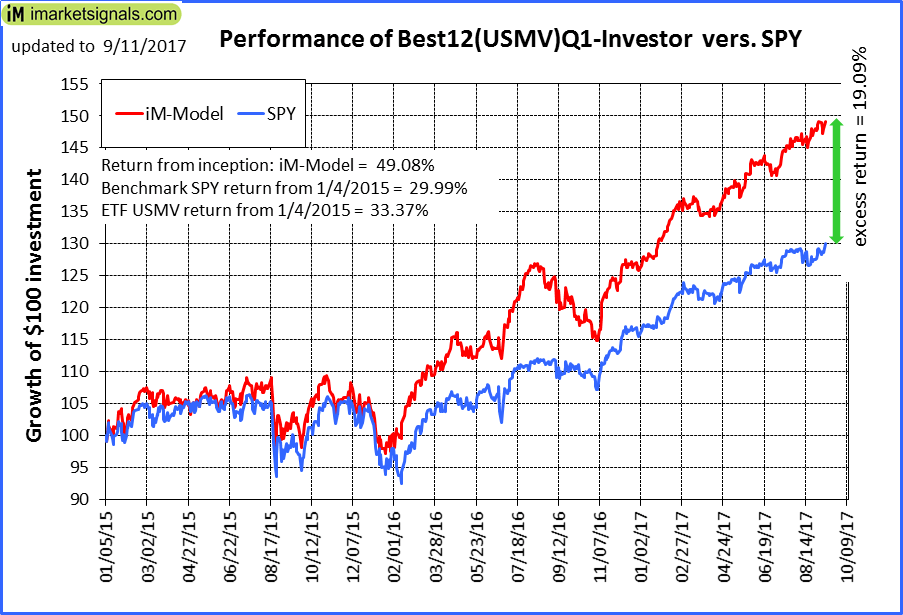 |
iM-Best12(USMV)Q1-Investor: The model’s out of sample performance YTD is 18.5%, and for the last 12 months is 23.3%. Over the same period the benchmark SPY performance was 12.5% and 19.2% respectively. Since inception, on 1/5/2015, the model gained 49.08% while the benchmark SPY gained 29.99% and the ETF USMV gained 33.37% over the same period. Over the previous week the market value of iM-Best12(USMV)Q1 gained 0.06% at a time when SPY gained 1.28%. A starting capital of $100,000 at inception on 1/5/2015 would have grown to $149,081 which includes -$287 cash and excludes $821 spent on fees and slippage. |
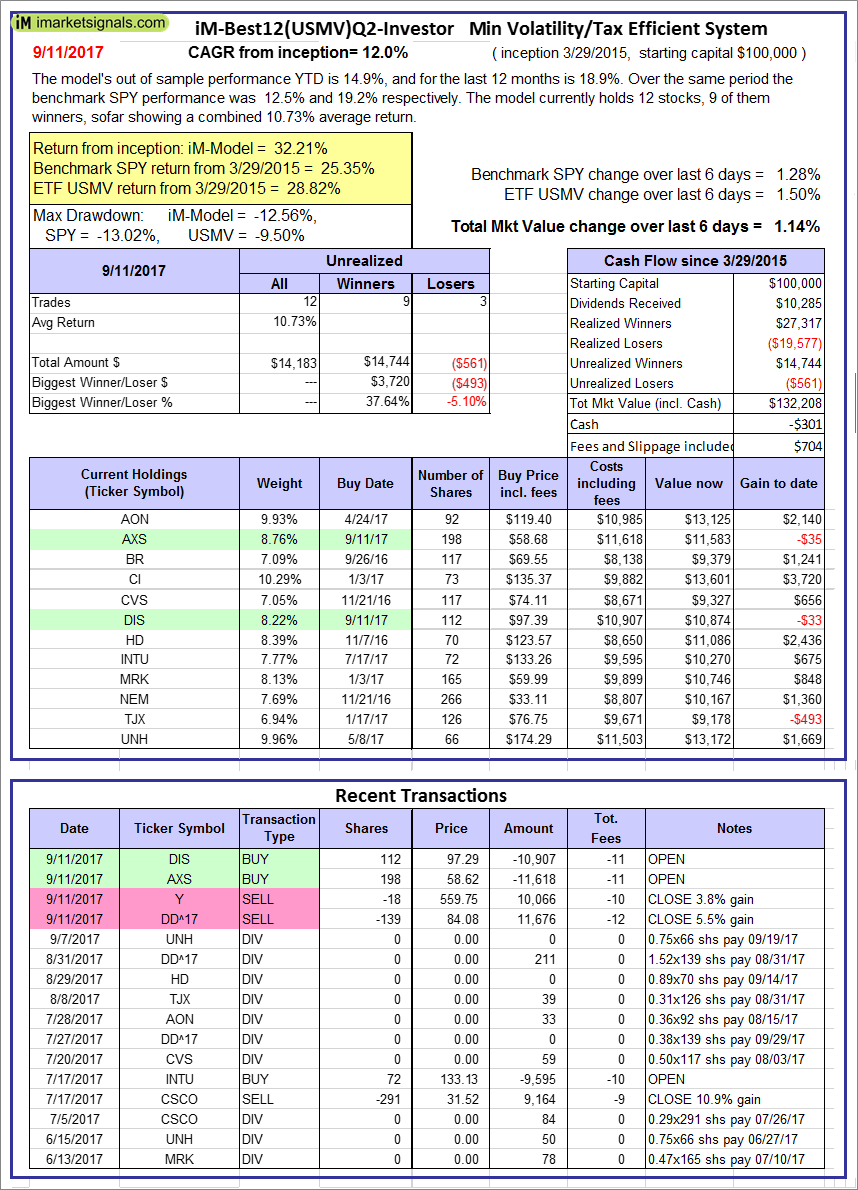 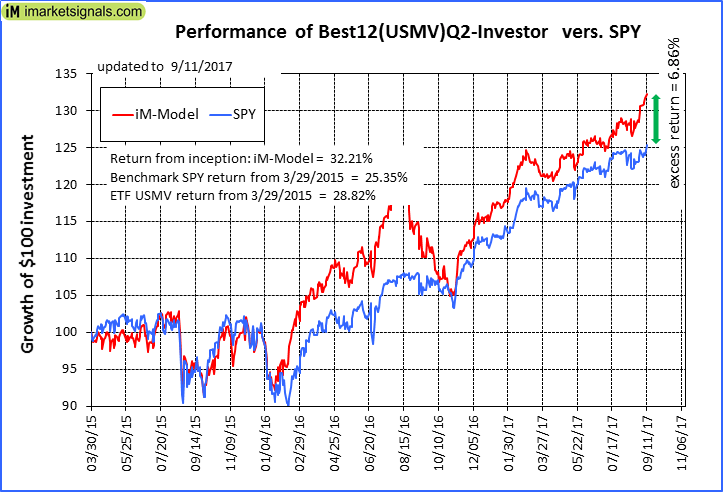 |
iM-Best12(USMV)Q2-Investor: The model’s out of sample performance YTD is 14.9%, and for the last 12 months is 18.9%. Over the same period the benchmark SPY performance was 12.5% and 19.2% respectively. Since inception, on 3/30/2015, the model gained 32.21% while the benchmark SPY gained 25.35% and the ETF USMV gained 28.82% over the same period. Over the previous week the market value of iM-Best12(USMV)Q2 gained 1.14% at a time when SPY gained 1.28%. A starting capital of $100,000 at inception on 3/30/2015 would have grown to $132,208 which includes -$301 cash and excludes $704 spent on fees and slippage. |
 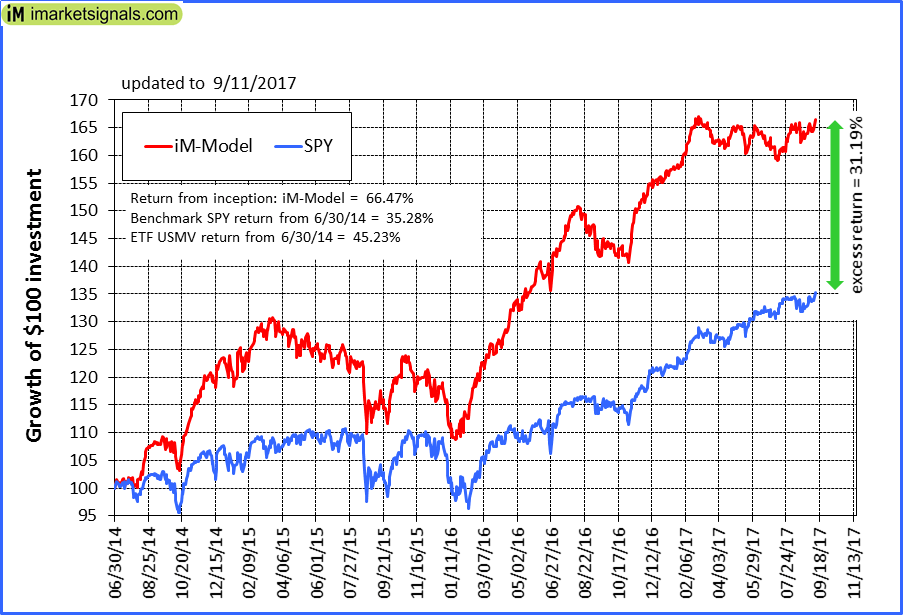 |
iM-Best12(USMV)Q3-Investor: The model’s out of sample performance YTD is 7.4%, and for the last 12 months is 16.5%. Over the same period the benchmark SPY performance was 12.5% and 19.2% respectively. Since inception, on 7/1/2014, the model gained 66.47% while the benchmark SPY gained 35.28% and the ETF USMV gained 45.23% over the same period. Over the previous week the market value of iM-Best12(USMV)Q3 gained 1.34% at a time when SPY gained 1.28%. A starting capital of $100,000 at inception on 7/1/2014 would have grown to $166,469 which includes $492 cash and excludes $1,066 spent on fees and slippage. |
  |
iM-Best12(USMV)Q4-Investor: Since inception, on 9/29/2014, the model gained 66.04% while the benchmark SPY gained 33.23% and the ETF USMV gained 43.22% over the same period. Over the previous week the market value of iM-Best12(USMV)Q4 gained 1.70% at a time when SPY gained 1.28%. A starting capital of $100,000 at inception on 9/29/2014 would have grown to $166,036 which includes $302 cash and excludes $869 spent on fees and slippage. |
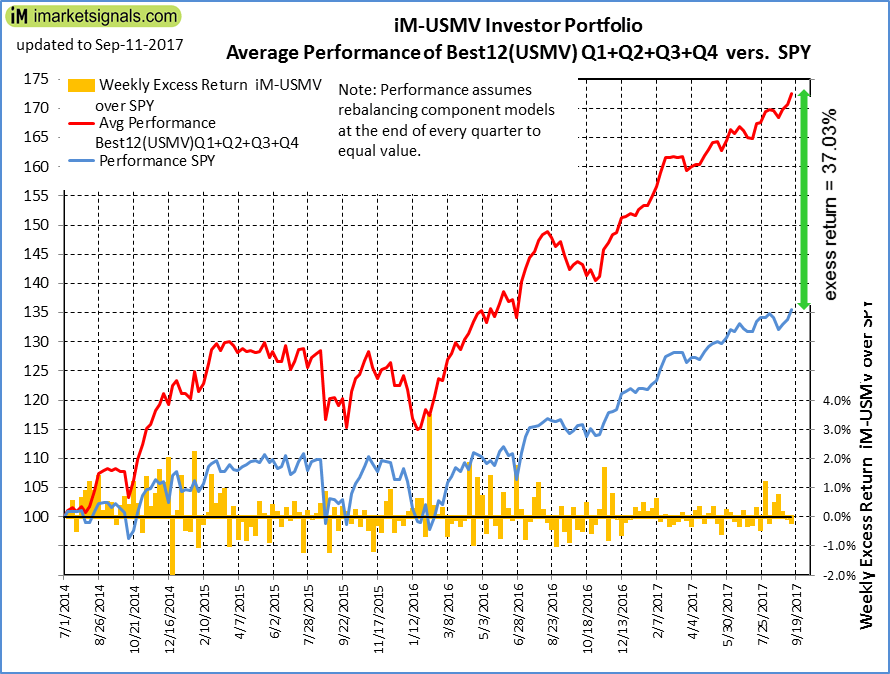 |
Average Performance of iM-Best12(USMV)Q1+Q2+Q3+Q4-Investor resulted in an excess return of 37.03% over SPY. (see iM-USMV Investor Portfolio) |
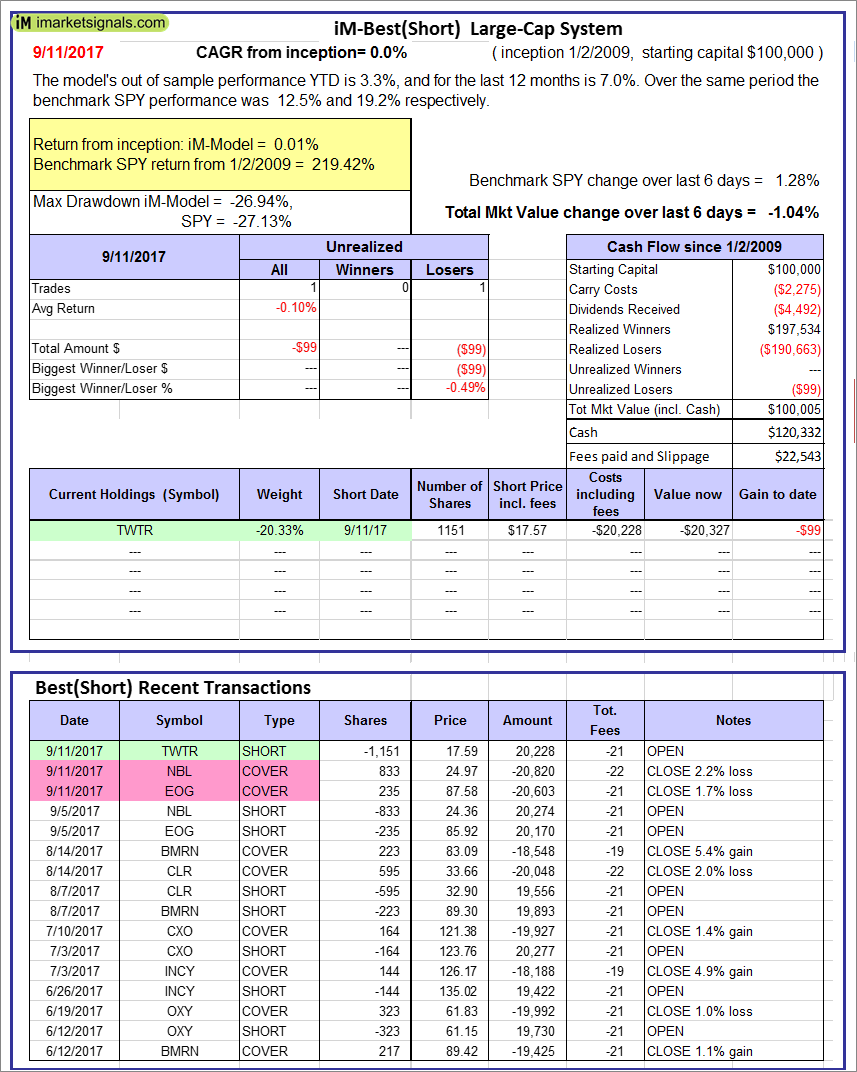 |
iM-Best(Short): The model’s out of sample performance YTD is 3.3%, and for the last 12 months is 7.0%. Over the same period the benchmark SPY performance was 12.5% and 19.2% respectively. Over the previous week the market value of iM-Best(Short) gained -1.04% at a time when SPY gained 1.28%. Over the period 1/2/2009 to 9/11/2017 the starting capital of $100,000 would have grown to $100,005 which includes $120,332 cash and excludes $22,543 spent on fees and slippage. |
 |
iM-Best2 MC-Score ETF System: The model’s out of sample performance YTD is 10.9%, and for the last 12 months is 11.7%. Over the same period the benchmark SPY performance was 12.5% and 19.2% respectively. Over the previous week the market value of the iM-Best2 MC-Score ETF System gained 1.09% at a time when SPY gained 1.28%. A starting capital of $100,000 at inception on 6/30/2016 would have grown to $107,563 which includes $54 cash and excludes $110 spent on fees and slippage. |
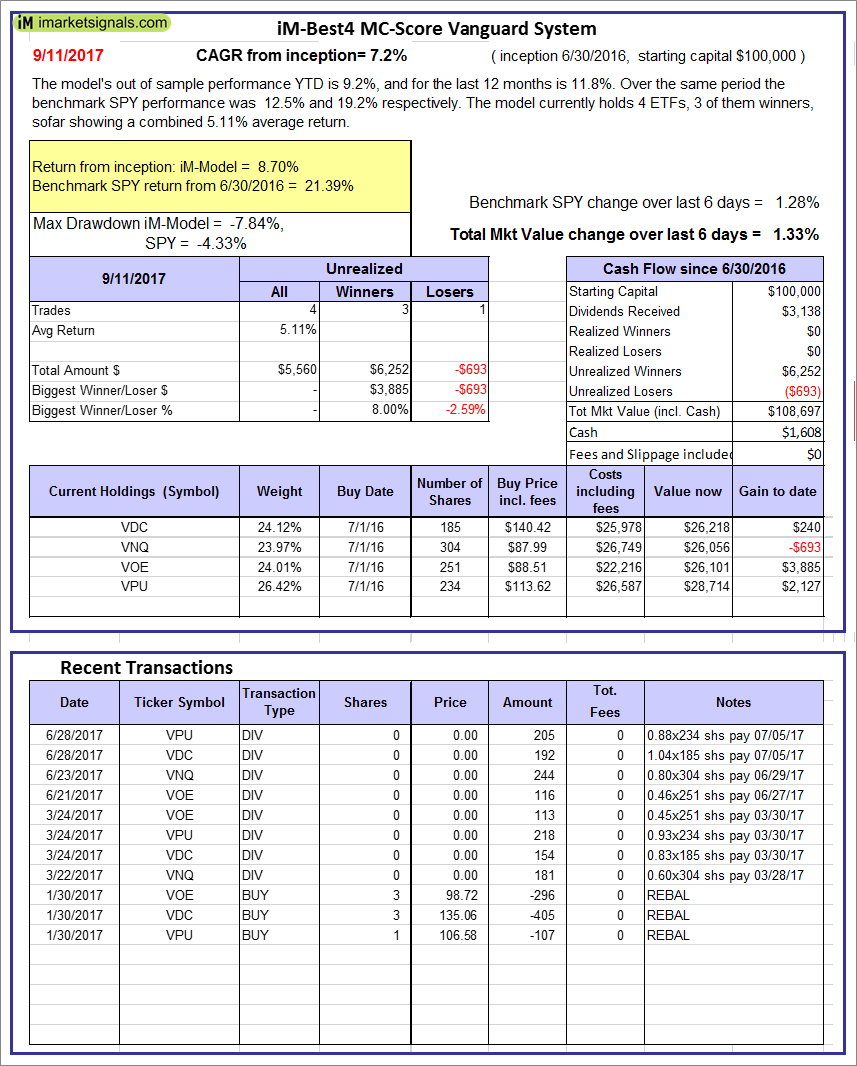 |
iM-Best4 MC-Score Vanguard System: The model’s out of sample performance YTD is 9.2%, and for the last 12 months is 11.8%. Over the same period the benchmark SPY performance was 12.5% and 19.2% respectively. Over the previous week the market value of the iM-Best4 MC-Score Vanguard System gained 1.33% at a time when SPY gained 1.28%. A starting capital of $100,000 at inception on 6/30/2016 would have grown to $108,697 which includes $1,608 cash and excludes $00 spent on fees and slippage. |
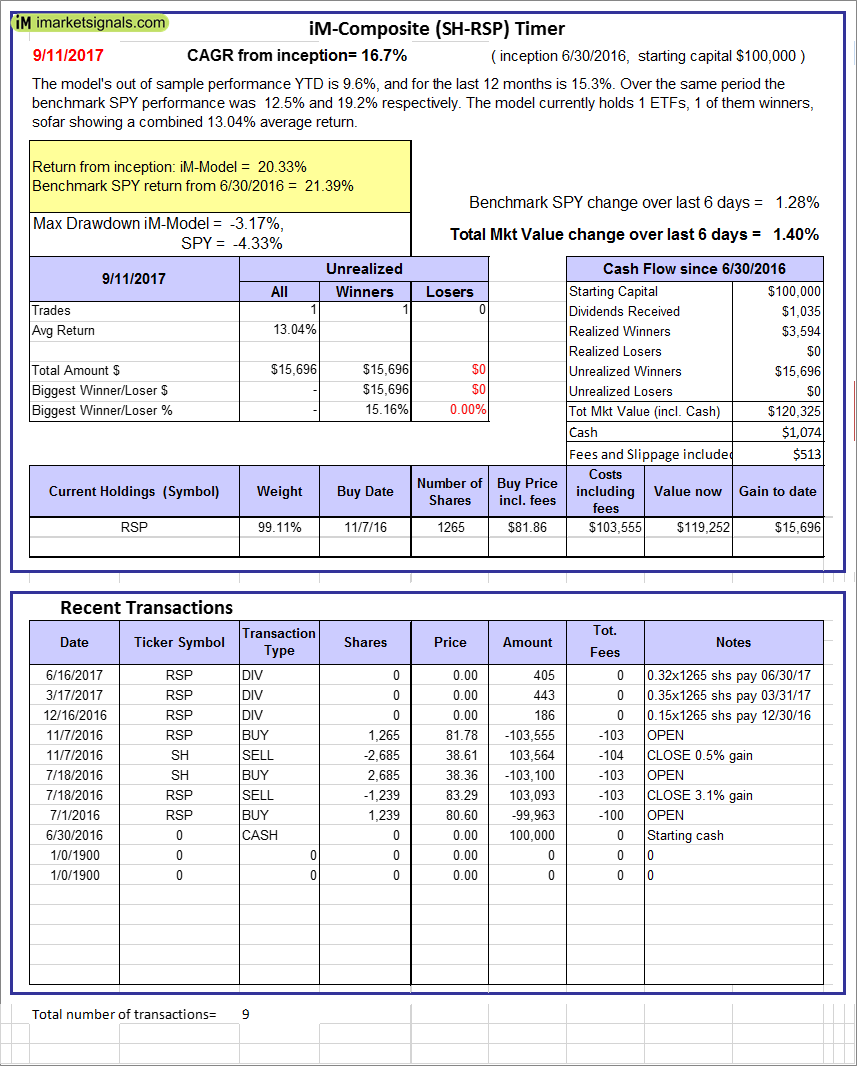 |
iM-Composite (SH-RSP) Timer: The model’s out of sample performance YTD is 9.6%, and for the last 12 months is 15.3%. Over the same period the benchmark SPY performance was 12.5% and 19.2% respectively. Over the previous week the market value of the iM-Composite (SH-RSP) Timer gained 1.40% at a time when SPY gained 1.28%. A starting capital of $100,000 at inception on 6/30/2016 would have grown to $120,325 which includes $1,074 cash and excludes $513 spent on fees and slippage. |
 |
iM-Composite (SPY-IEF) Timer: The model’s out of sample performance YTD is 14.6%, and for the last 12 months is 19.6%. Over the same period the benchmark SPY performance was 12.5% and 19.2% respectively. Over the previous week the market value of the iM-Composite (SPY-IEF) Timer gained 1.28% at a time when SPY gained 1.28%. A starting capital of $100,000 at inception on 6/30/2016 would have grown to $123,333 which includes $223 cash and excludes $1,390 spent on fees and slippage. |
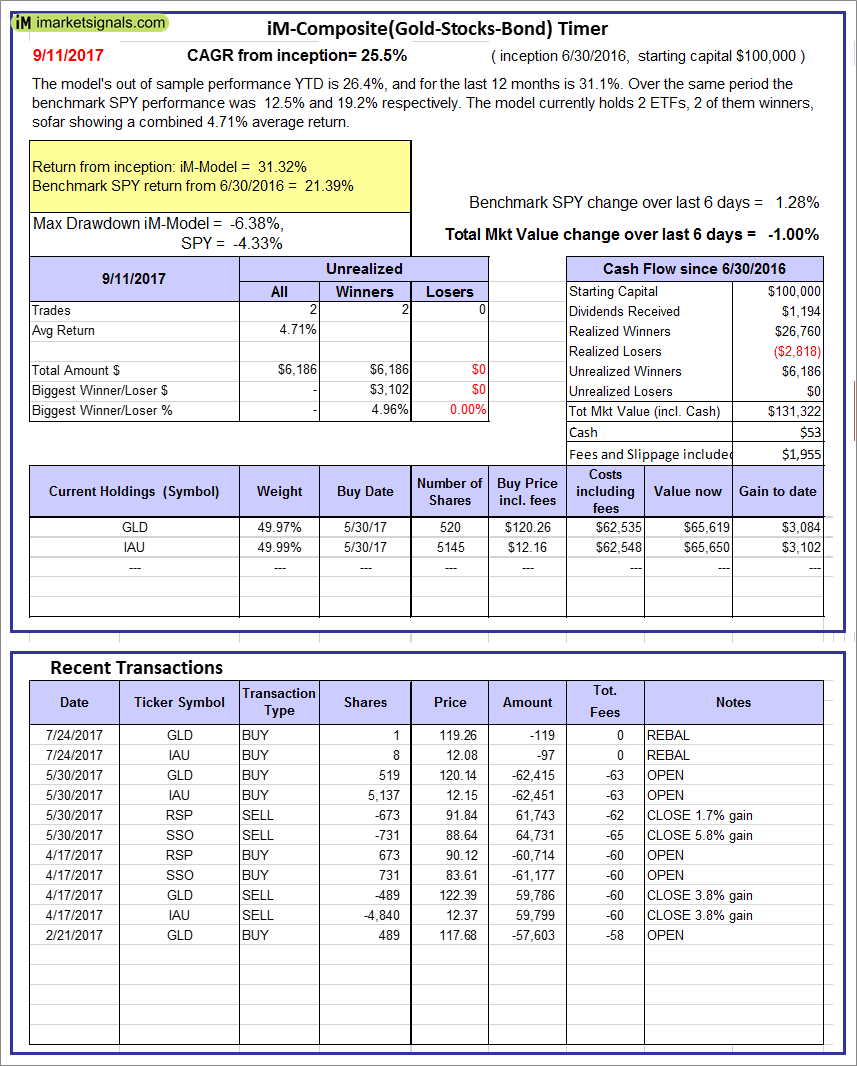 |
iM-Composite(Gold-Stocks-Bond) Timer: The model’s out of sample performance YTD is 26.4%, and for the last 12 months is 31.1%. Over the same period the benchmark SPY performance was 12.5% and 19.2% respectively. Over the previous week the market value of the iM-Composite(Gold-Stocks-Bond) Timer gained -1.00% at a time when SPY gained 1.28%. A starting capital of $100,000 at inception on 6/30/2016 would have grown to $131,322 which includes $53 cash and excludes $1,955 spent on fees and slippage. |
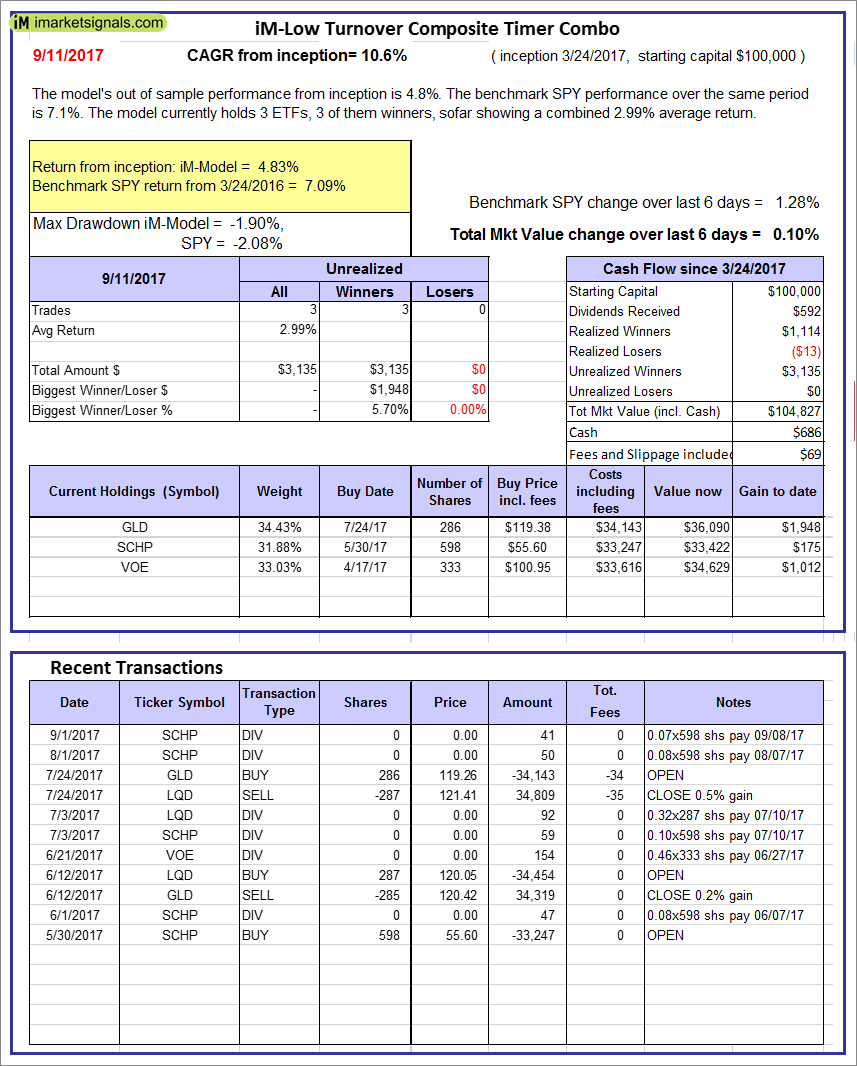 |
iM-Low Turnover Composite Timer Combo: The model’s out of sample performance from inception is 4.8%. The benchmark SPY performance over the same period is 7.1%. Over the previous week the market value of the iM-Low Turnover Composite Timer Combo gained 0.10% at a time when SPY gained 1.28%. A starting capital of $100,000 at inception on 3/24/27 would have grown to $104,827 which includes $686 cash and excludes $69 spent on fees and slippage. |
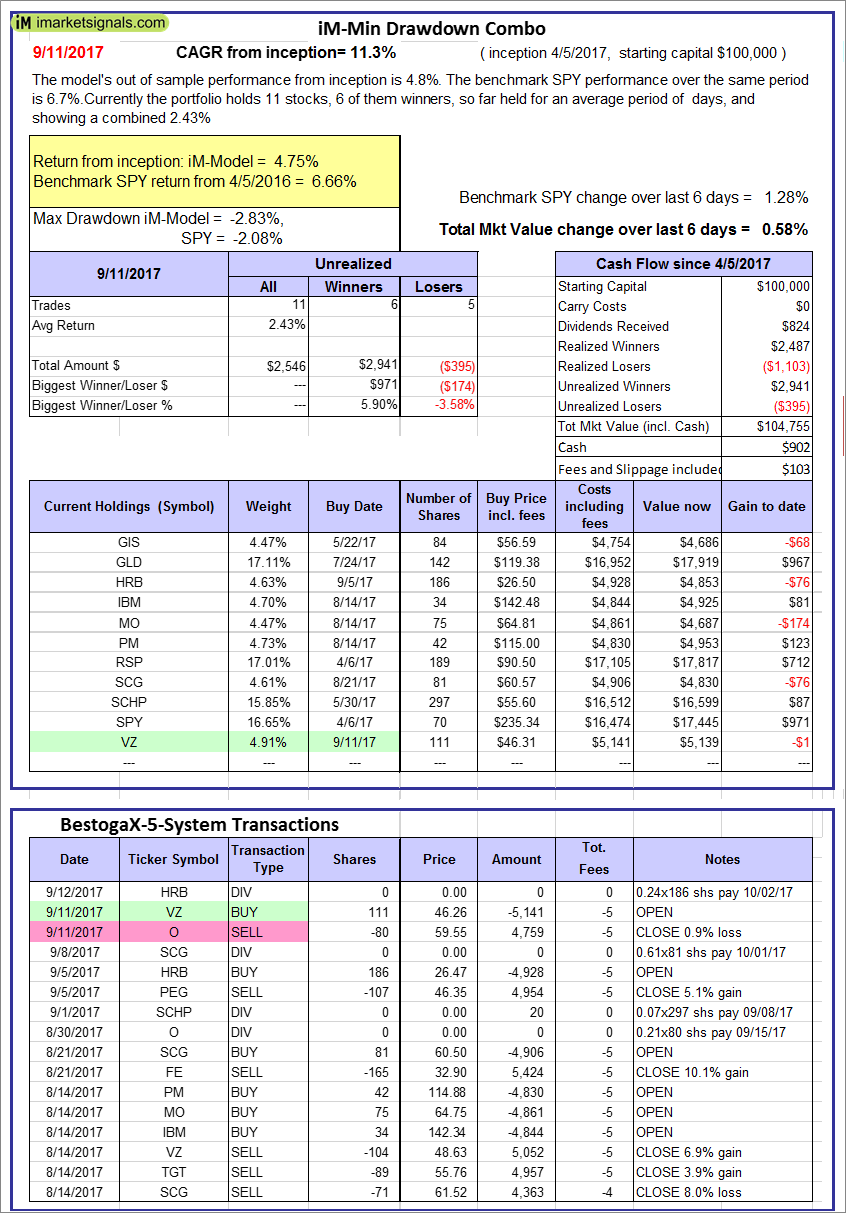 |
iM-Min Drawdown Combo: The model’s out of sample performance from inception is 4.8%. The benchmark SPY performance over the same period is 6.7%. Over the previous week the market value of the iM-Min Drawdown Combo gained 0.58% at a time when SPY gained 1.28%. A starting capital of $100,000 at inception on 4/5/2017 would have grown to $104,755 which includes $902 cash and excludes $103 spent on fees and slippage. |
 |
iM-5ETF Trader (includes leveraged ETFs): The model’s out of sample performance YTD is 12.7%, and since inception 15.8%. Over the same period the benchmark SPY performance was 12.5% and 19.0% respectively. Over the previous week the market value of the iM-5ETF Trader (includes leveraged ETFs) gained 2.01% at a time when SPY gained 1.28%. A starting capital of $100,000 at inception on 10/30/2016 would have grown to $139,716 which includes $552 cash and excludes $1,030 spent on fees and slippage. |
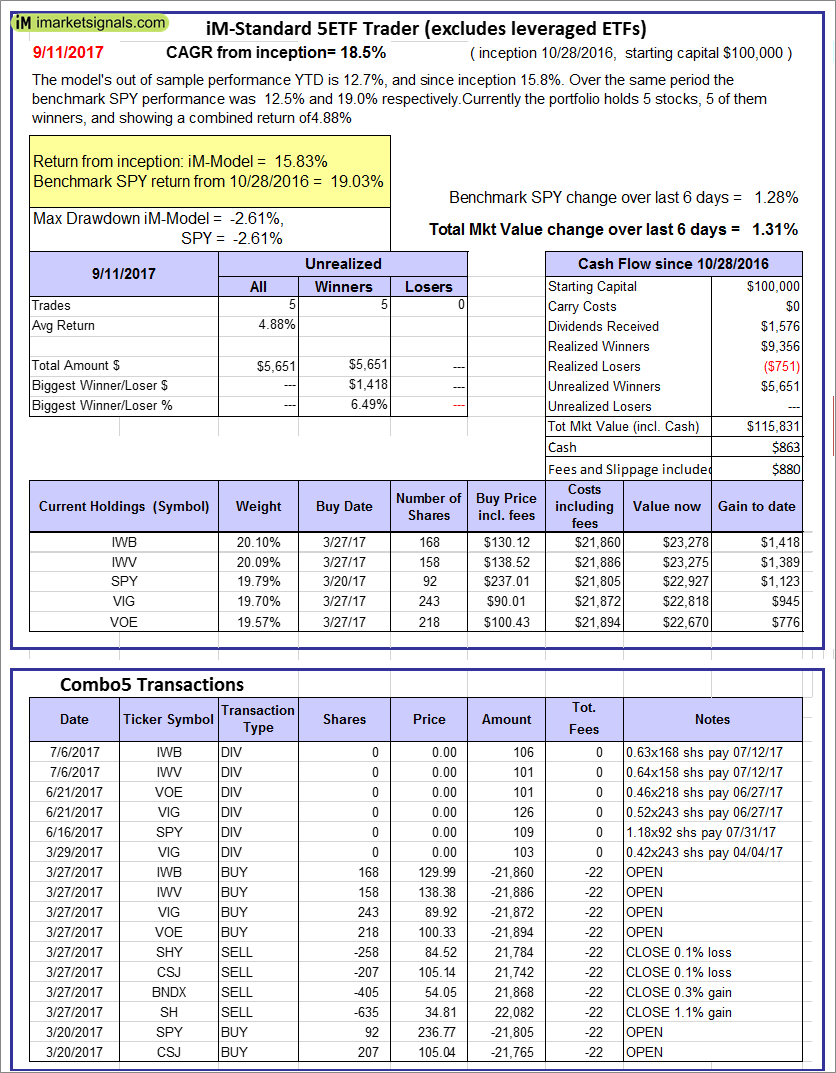 |
iM-Standard 5ETF Trader (excludes leveraged ETFs): The model’s out of sample performance YTD is 12.7%, and since inception 15.8%. Over the same period the benchmark SPY performance was 12.5% and 19.0% respectively. Over the previous week the market value of the iM-Standard 5ETF Trader (excludes leveraged ETFs) gained 1.31% at a time when SPY gained 1.28%. A starting capital of $100,000 at inception on 10/30/2016 would have grown to $115,831 which includes $863 cash and excludes $880 spent on fees and slippage. |
iM-Best Reports – 9/11/2017
Posted in pmp SPY-SH
Leave a Reply
You must be logged in to post a comment.