
  |
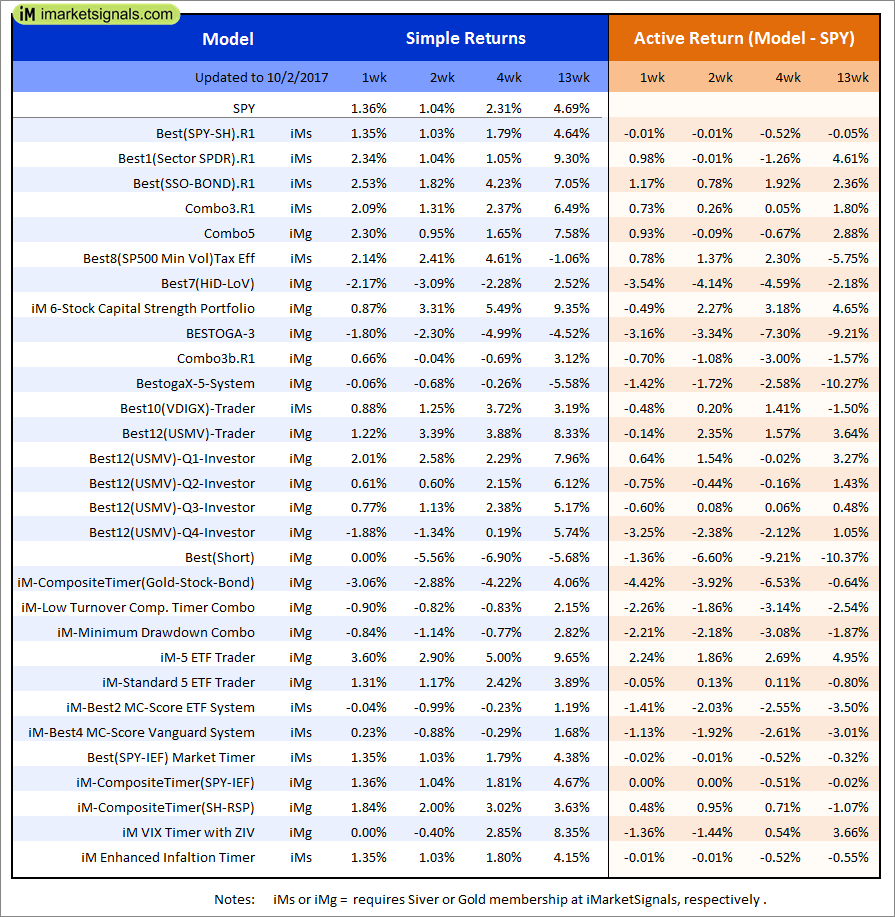
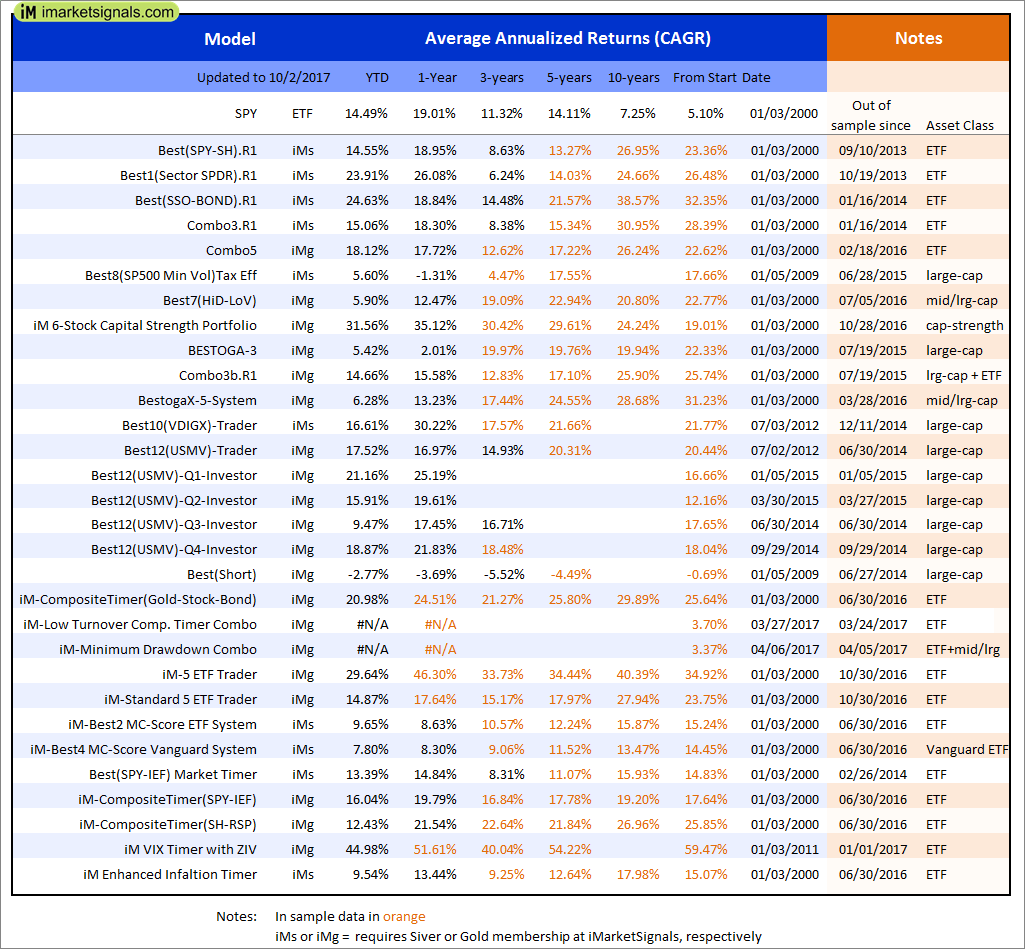
Out of sample performance summary of our models for the past 1, 2, 4 and 13 week periods. The active active return indicates how the models over- or underperformed the benchmark ETF SPY. Also the YTD, and the 1-, 3-, 5- and 10-year annualized returns are shown in the second table |
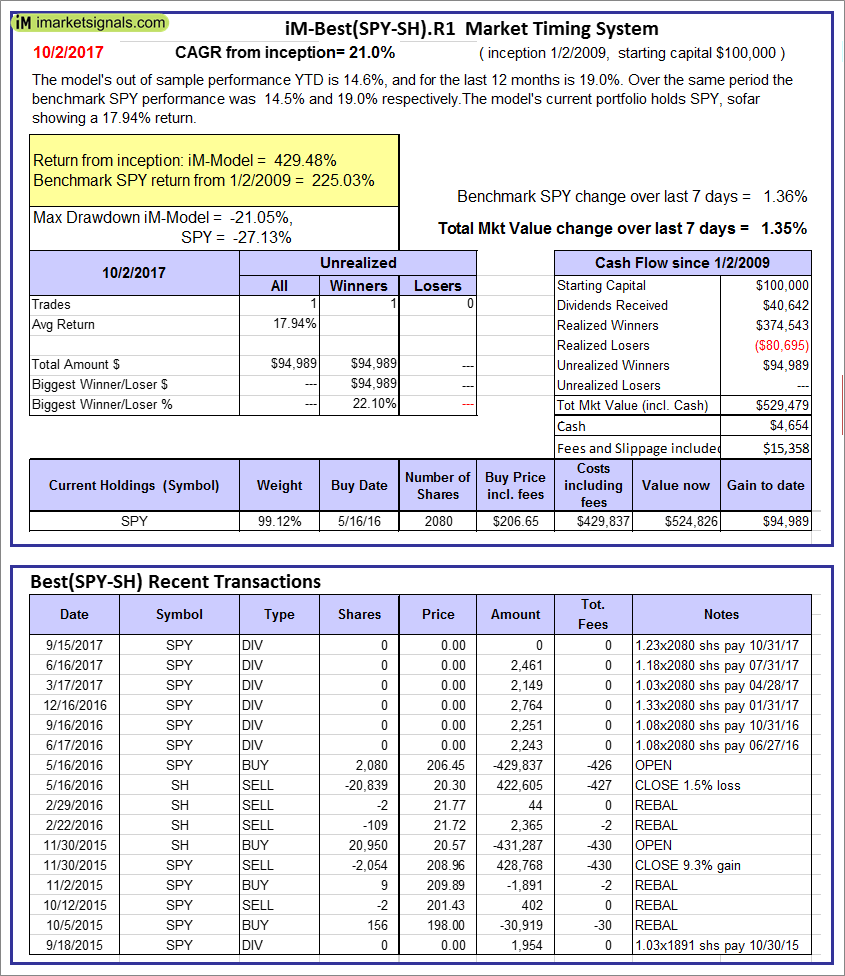 |
iM-Best(SPY-SH).R1: The model’s out of sample performance YTD is 14.6%, and for the last 12 months is 19.0%. Over the same period the benchmark SPY performance was 14.5% and 19.0% respectively. Over the previous week the market value of Best(SPY-SH) gained 1.35% at a time when SPY gained 1.36%. A starting capital of $100,000 at inception on 1/2/2009 would have grown to $529,479 which includes $4,654 cash and excludes $15,358 spent on fees and slippage. |
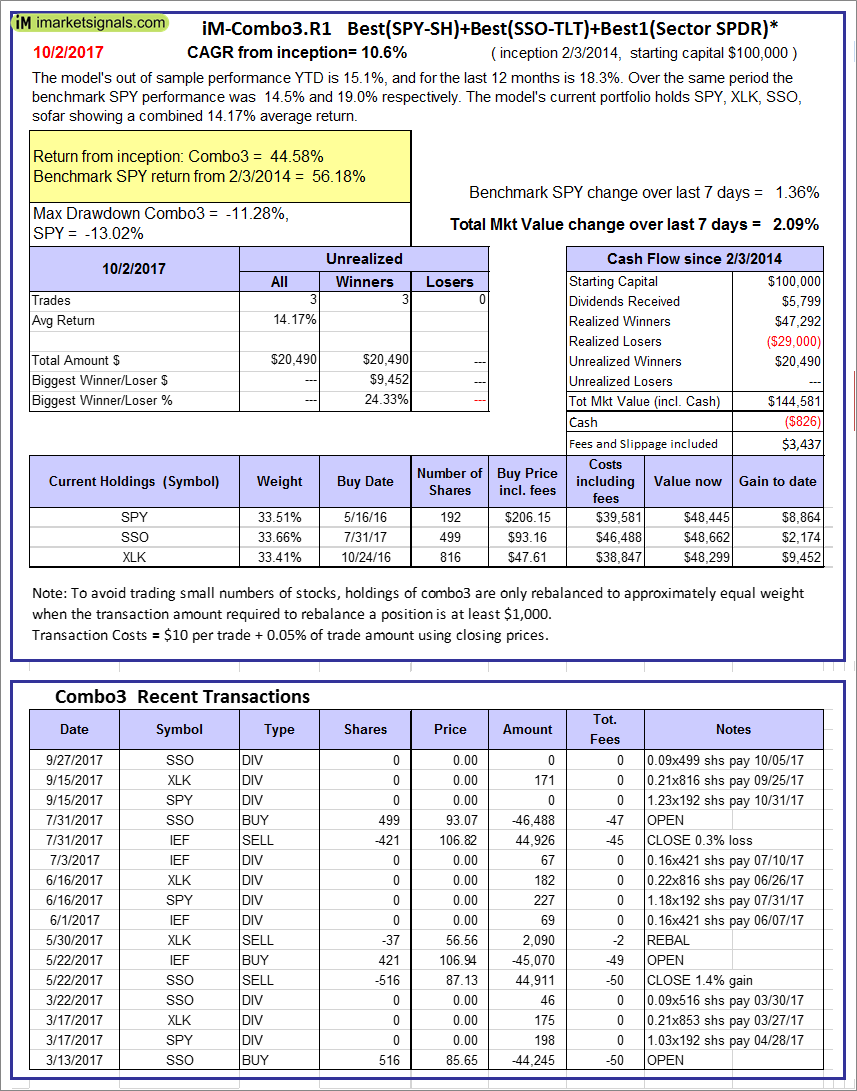 |
iM-Combo3.R1: The model’s out of sample performance YTD is 15.1%, and for the last 12 months is 18.3%. Over the same period the benchmark SPY performance was 14.5% and 19.0% respectively. Over the previous week the market value of iM-Combo3.R1 gained 2.09% at a time when SPY gained 1.36%. A starting capital of $100,000 at inception on 2/3/2014 would have grown to $144,581 which includes -$826 cash and excludes $3,437 spent on fees and slippage. |
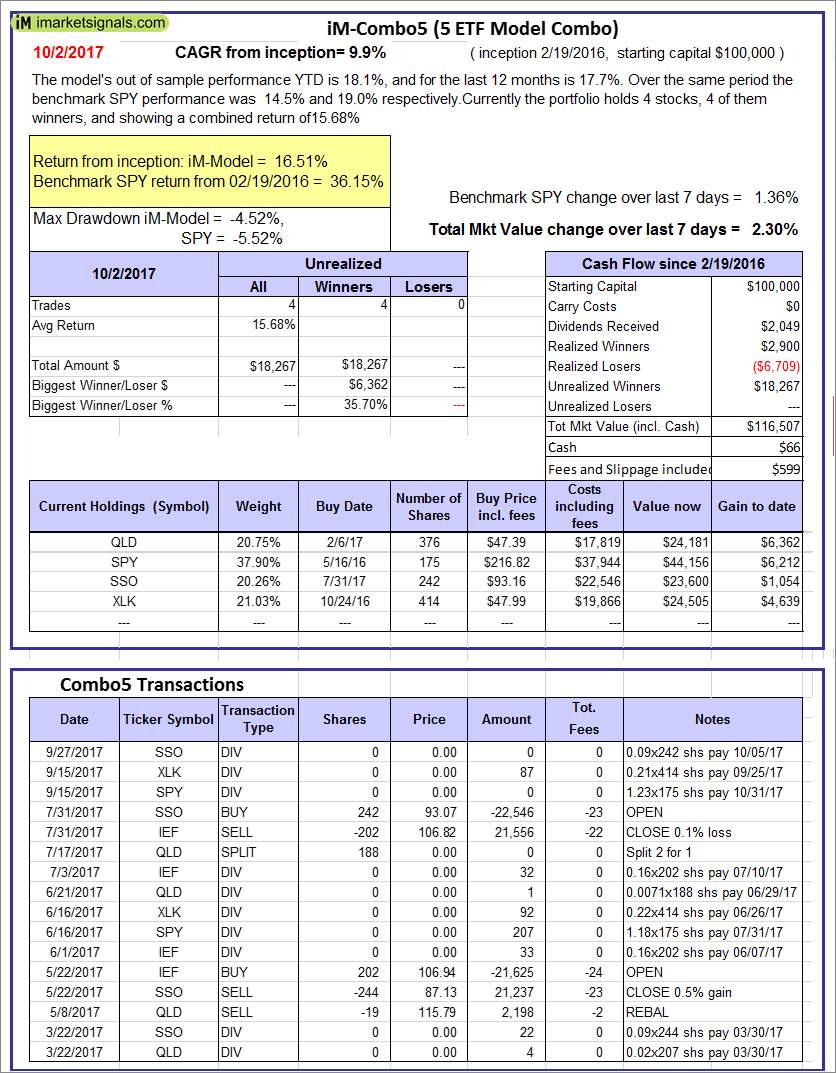 |
iM-Combo5: The model’s out of sample performance YTD is 18.1%, and for the last 12 months is 17.7%. Over the same period the benchmark SPY performance was 14.5% and 19.0% respectively. Over the previous week the market value of iM-Combo5 gained 2.30% at a time when SPY gained 1.36%. A starting capital of $100,000 at inception on 2/22/2016 would have grown to $116,507 which includes $66 cash and excludes $599 spent on fees and slippage. |
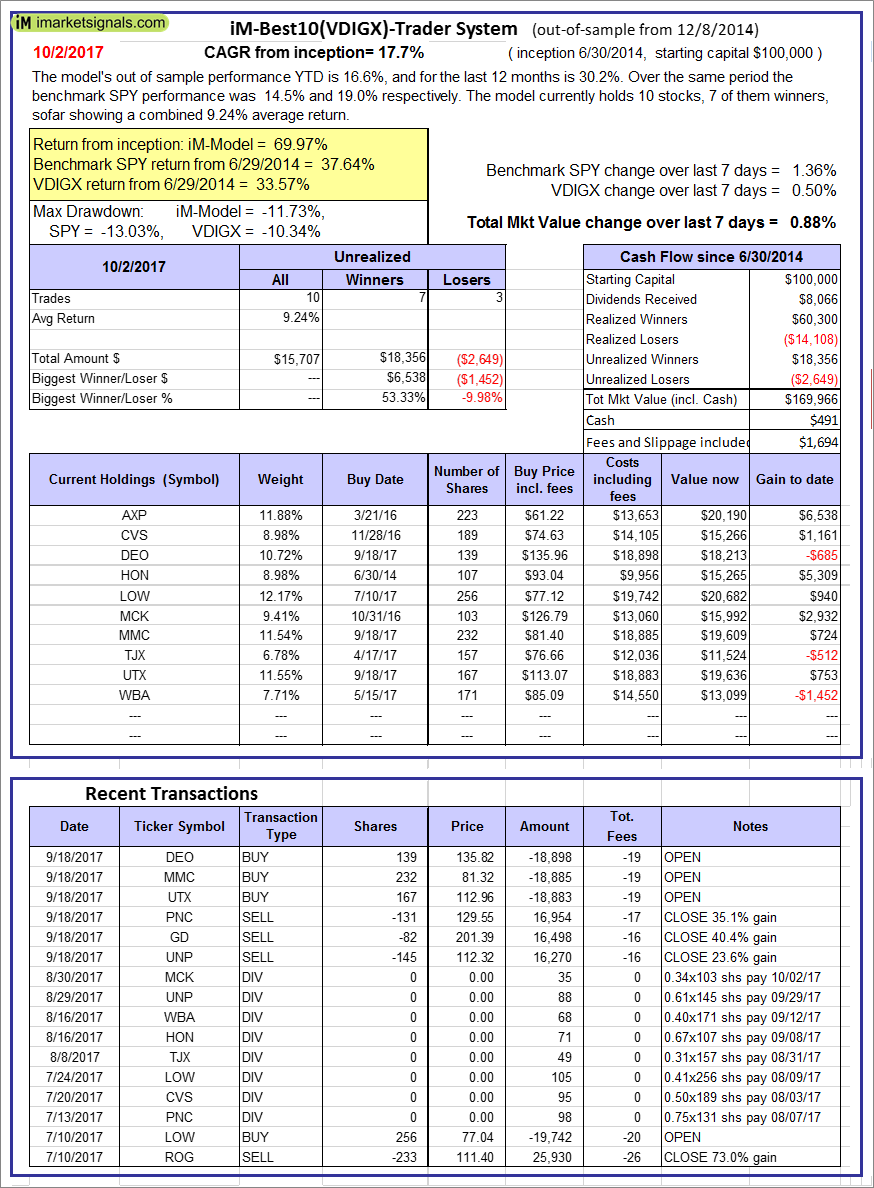 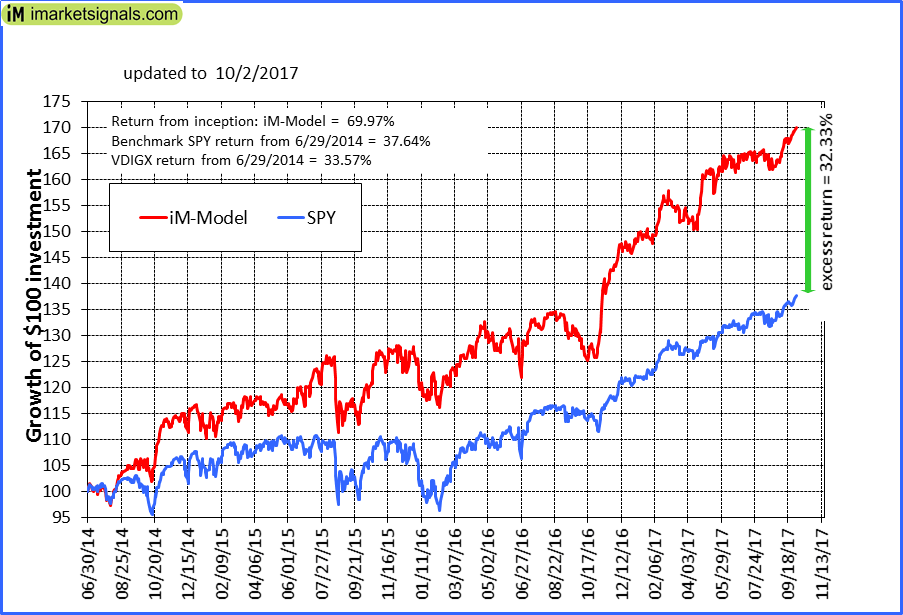 |
iM-Best10(VDIGX)-Trader: The model’s out of sample performance YTD is 16.6%, and for the last 12 months is 30.2%. Over the same period the benchmark SPY performance was 14.5% and 19.0% respectively. Since inception, on 7/1/2014, the model gained 69.97% while the benchmark SPY gained 37.64% and VDIGX gained 33.57% over the same period. Over the previous week the market value of iM-Best10(VDIGX) gained 0.88% at a time when SPY gained 1.36%. A starting capital of $100,000 at inception on 7/1/2014 would have grown to $169,966 which includes $491 cash and excludes $1,694 spent on fees and slippage. |
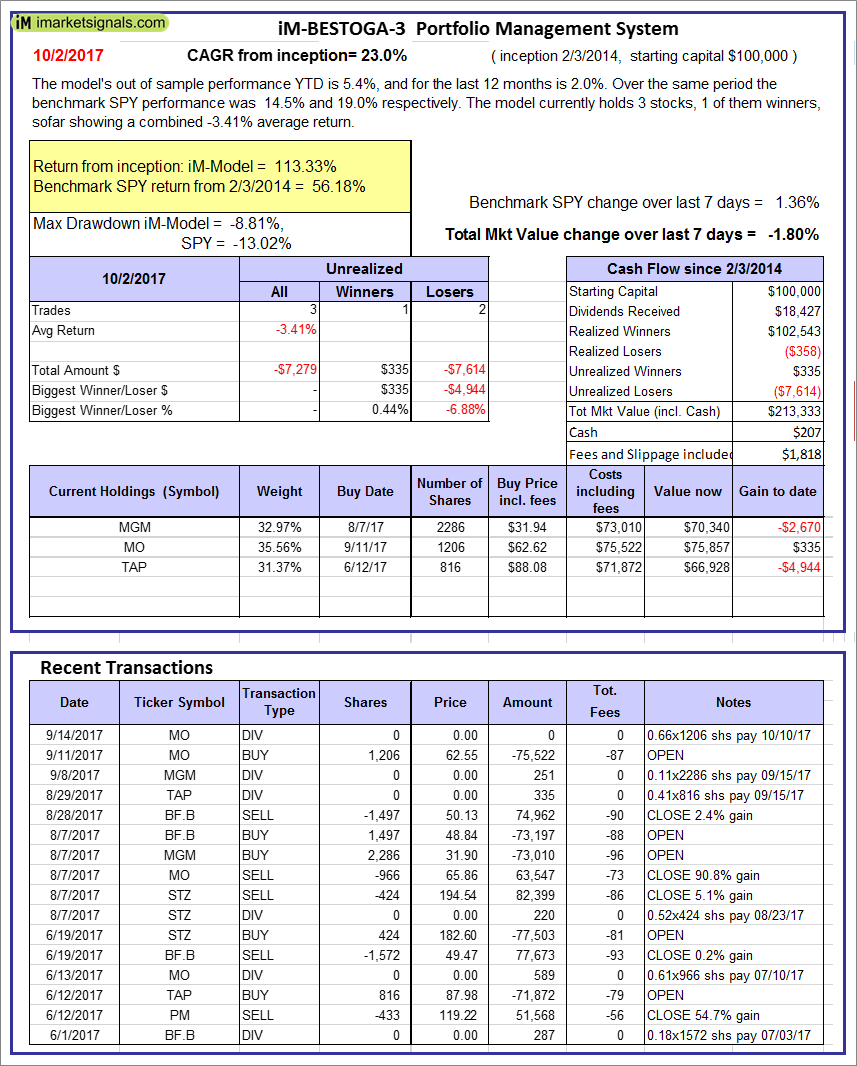 |
iM-BESTOGA-3: The model’s out of sample performance YTD is 5.4%, and for the last 12 months is 2.0%. Over the same period the benchmark SPY performance was 14.5% and 19.0% respectively. Over the previous week the market value of iM-BESTOGA-3 gained -1.80% at a time when SPY gained 1.36%. A starting capital of $100,000 at inception on 2/3/2014 would have grown to $213,333 which includes $207 cash and excludes $1,818 spent on fees and slippage. |
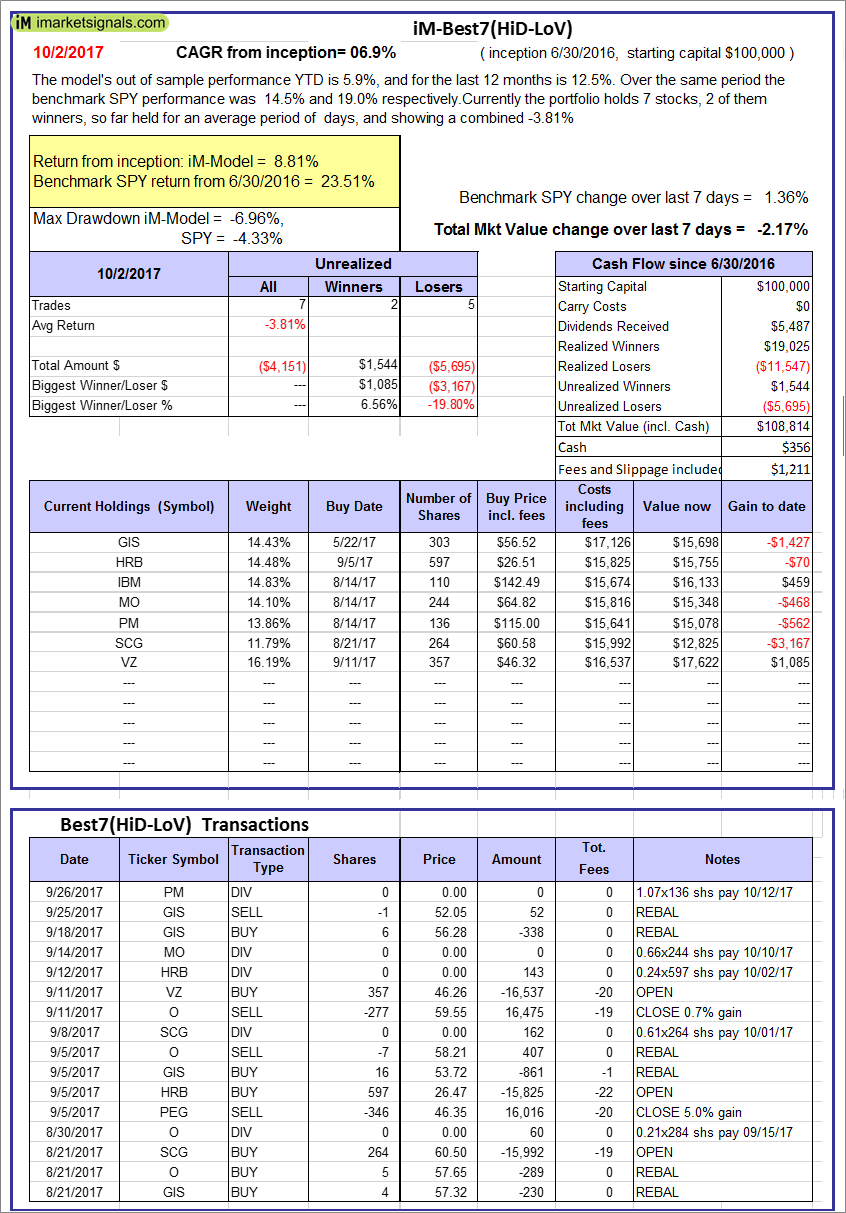 |
iM-Best7(HiD-LoV): The model’s out of sample performance YTD is 5.9%, and for the last 12 months is 12.5%. Over the same period the benchmark SPY performance was 14.5% and 19.0% respectively. Over the previous week the market value of iM-BESTOGA-3 gained -2.17% at a time when SPY gained 1.36%. A starting capital of $100,000 at inception on 6/30/2016 would have grown to $108,814 which includes $356 cash and excludes $1,211 spent on fees and slippage. |
 |
iM 6-Stock Capital Strength Portfolio: The model’s out of sample performance YTD is 31.6%, and since inception 39.1%. Over the same period the benchmark SPY performance was 14.5% and 21.1% respectively. Over the previous week the market value of the iM 6-Stock Capital Strength Portfolio gained 0.87% at a time when SPY gained 1.36%. A starting capital of $100,000 at inception on 10/28/2016 would have grown to $139,120 which includes $1,919 cash and excludes $440 spent on fees and slippage. |
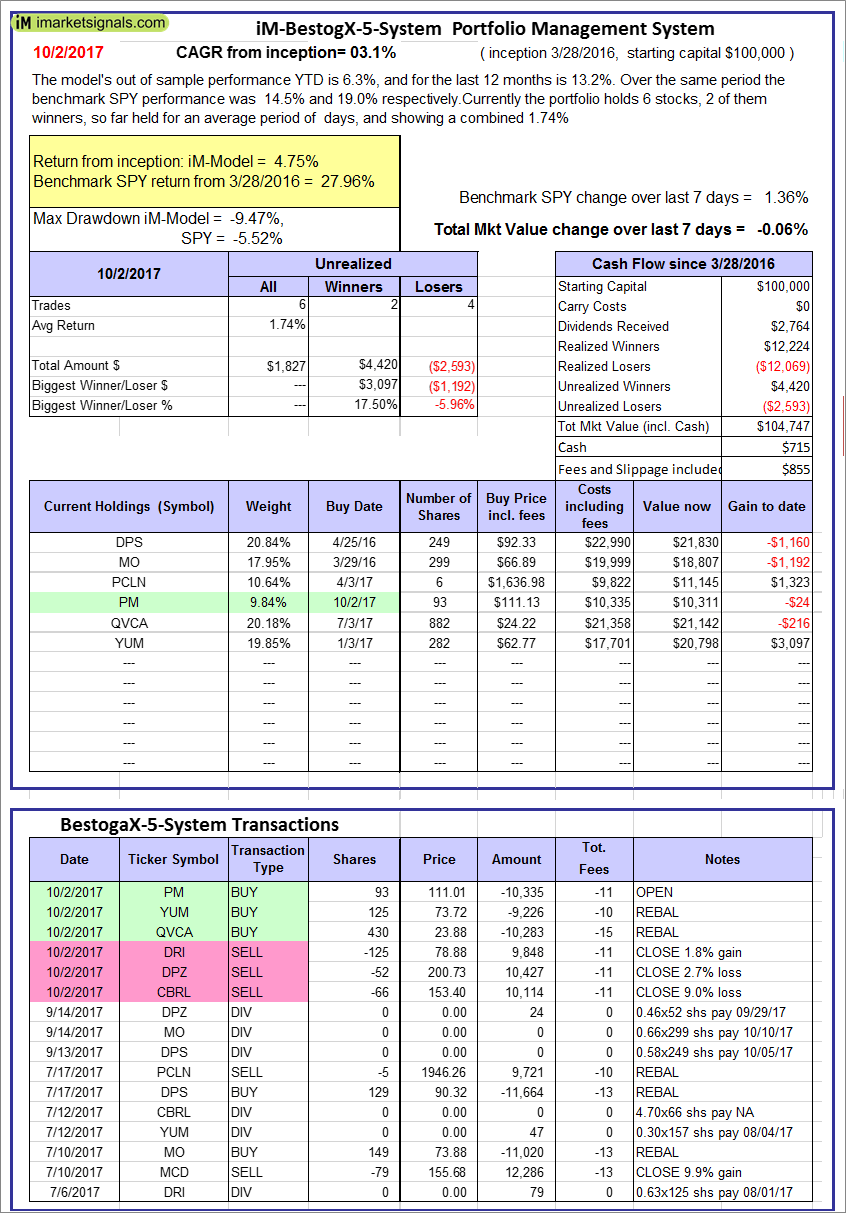 |
iM-BestogaX5-System: The model’s out of sample performance YTD is 6.3%, and for the last 12 months is 13.2%. Over the same period the benchmark SPY performance was 14.5% and 19.0% respectively. Over the previous week the market value of iM-Best8(S&P 500)Tax-Eff. gained -0.06% at a time when SPY gained 1.36%. A starting capital of $100,000 at inception on 3/28/2016 would have grown to $104,747 which includes $715 cash and excludes $855 spent on fees and slippage. |
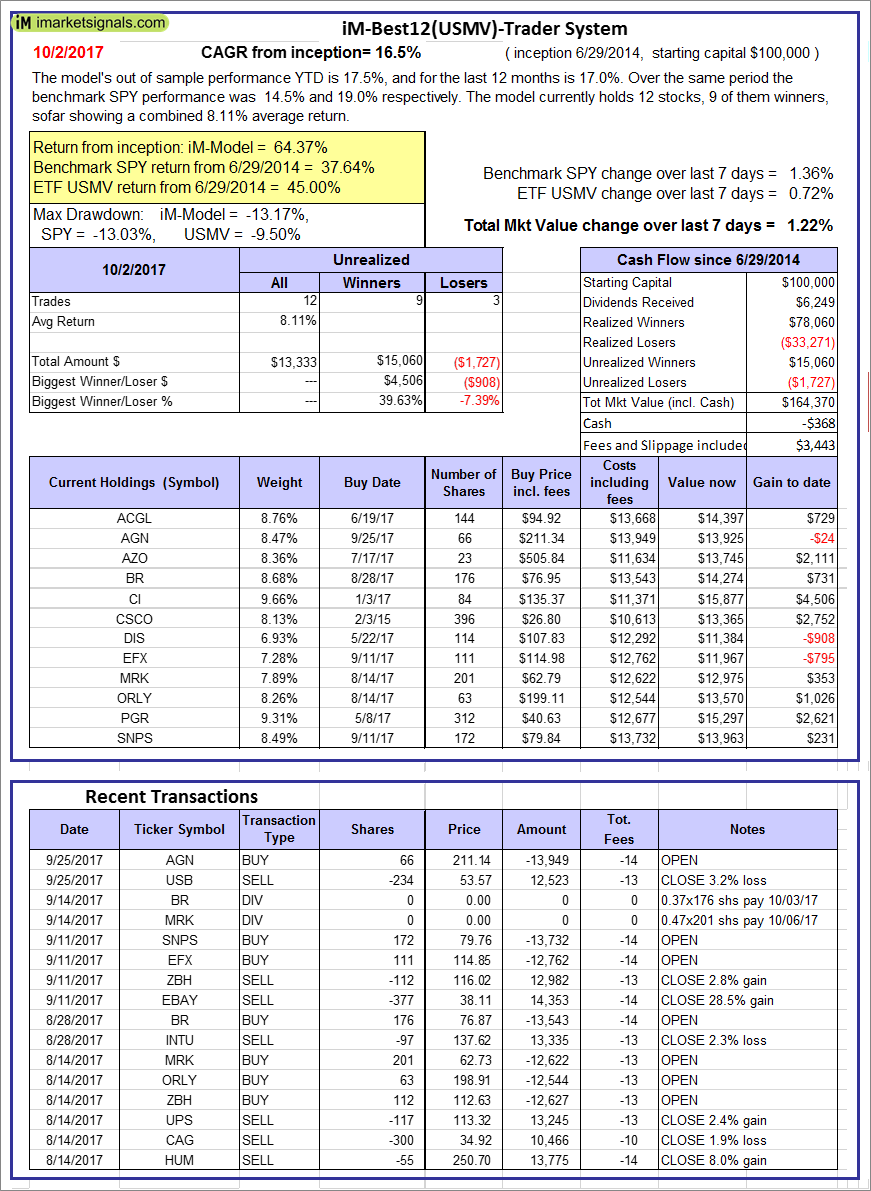 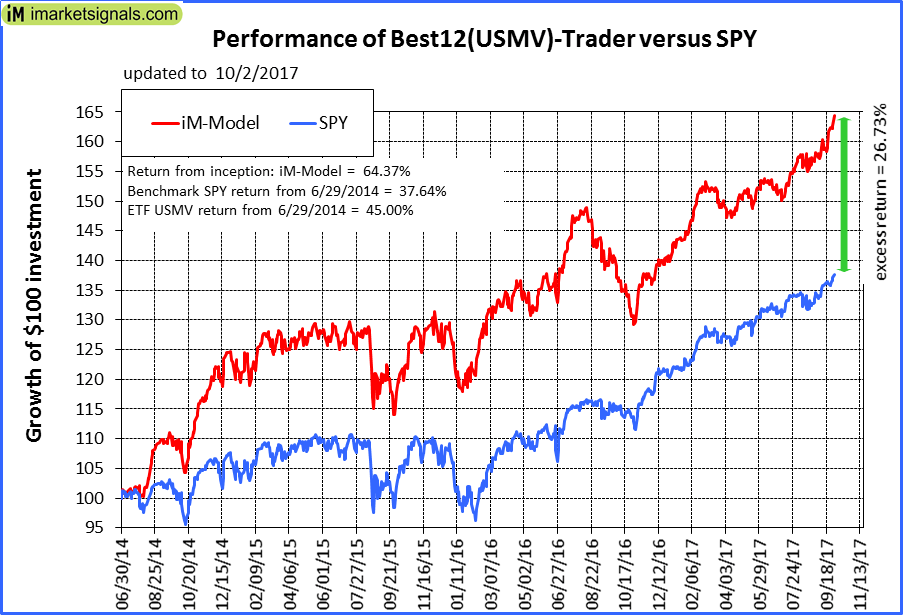 |
iM-Best12(USMV)-Trader: The model’s out of sample performance YTD is 17.5%, and for the last 12 months is 17.0%. Over the same period the benchmark SPY performance was 14.5% and 19.0% respectively. Since inception, on 6/30/2014, the model gained 64.37% while the benchmark SPY gained 37.64% and the ETF USMV gained 45.00% over the same period. Over the previous week the market value of iM-Best12(USMV)-Trader gained 1.22% at a time when SPY gained 1.36%. A starting capital of $100,000 at inception on 6/30/2014 would have grown to $164,370 which includes -$368 cash and excludes $3,443 spent on fees and slippage. |
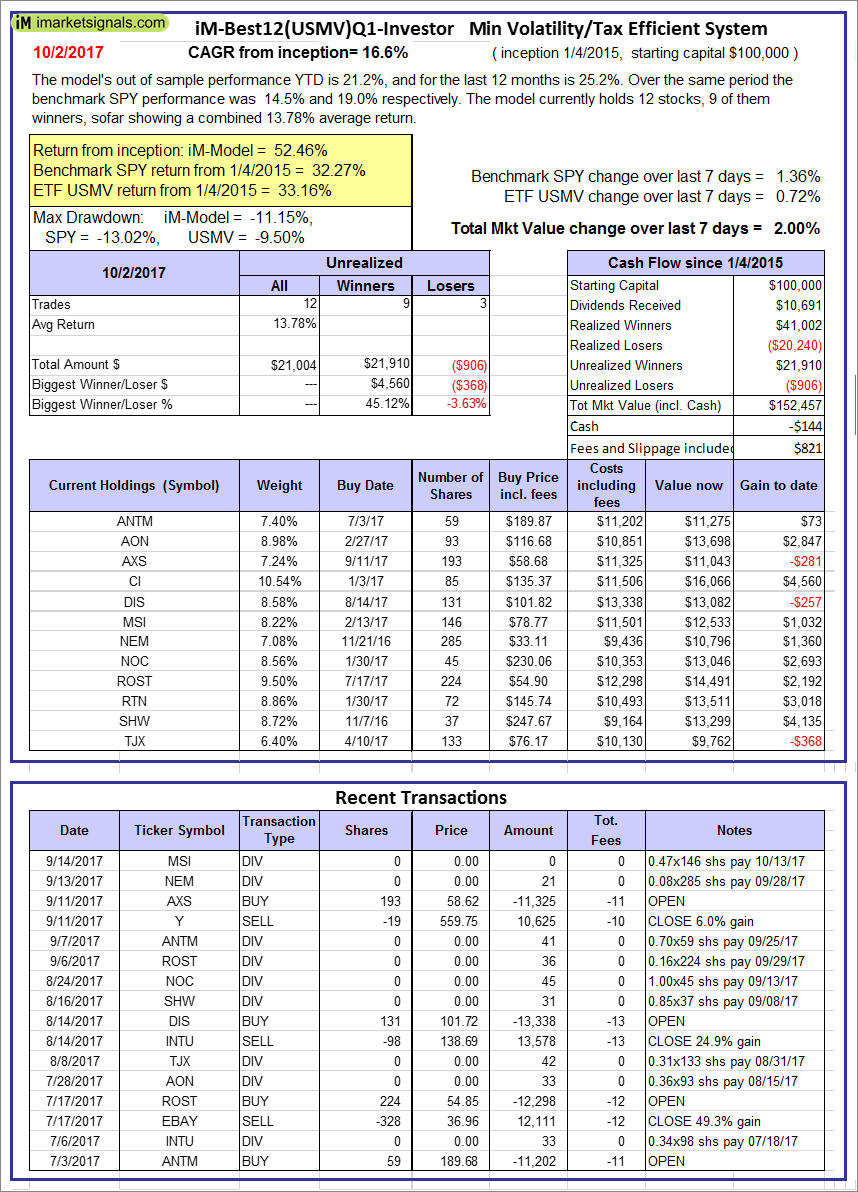 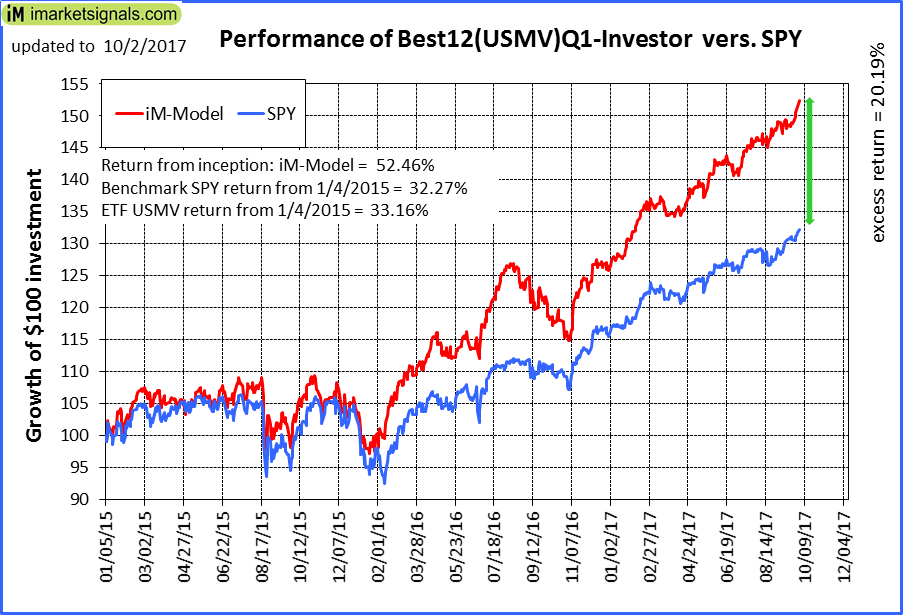 |
iM-Best12(USMV)Q1-Investor: The model’s out of sample performance YTD is 21.2%, and for the last 12 months is 25.2%. Over the same period the benchmark SPY performance was 14.5% and 19.0% respectively. Since inception, on 1/5/2015, the model gained 52.46% while the benchmark SPY gained 32.27% and the ETF USMV gained 33.16% over the same period. Over the previous week the market value of iM-Best12(USMV)Q1 gained 2.00% at a time when SPY gained 1.36%. A starting capital of $100,000 at inception on 1/5/2015 would have grown to $152,457 which includes -$144 cash and excludes $821 spent on fees and slippage. |
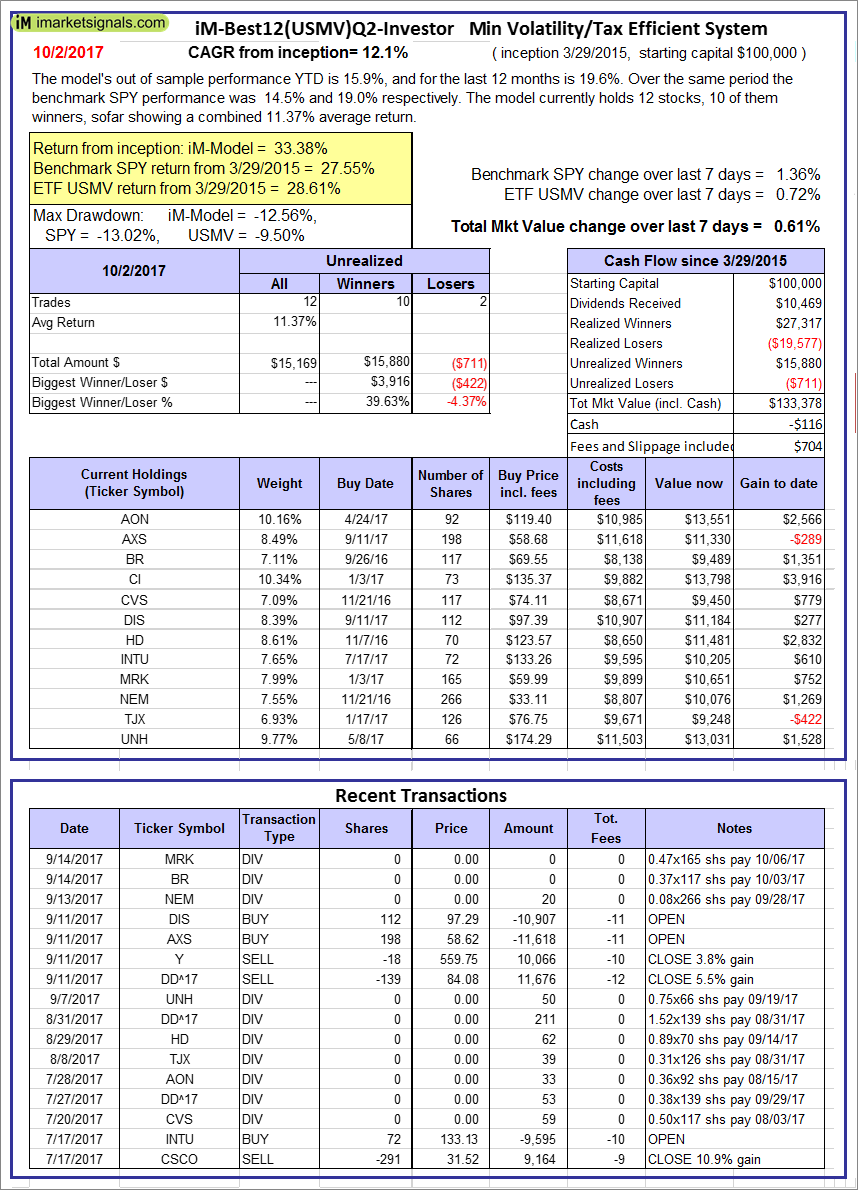 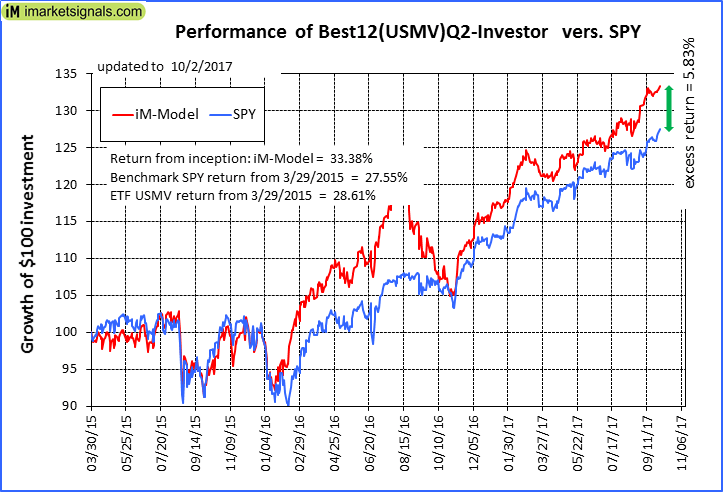 |
iM-Best12(USMV)Q2-Investor: The model’s out of sample performance YTD is 15.9%, and for the last 12 months is 19.6%. Over the same period the benchmark SPY performance was 14.5% and 19.0% respectively. Since inception, on 3/30/2015, the model gained 33.38% while the benchmark SPY gained 27.55% and the ETF USMV gained 28.61% over the same period. Over the previous week the market value of iM-Best12(USMV)Q2 gained 0.61% at a time when SPY gained 1.36%. A starting capital of $100,000 at inception on 3/30/2015 would have grown to $133,378 which includes -$116 cash and excludes $704 spent on fees and slippage. |
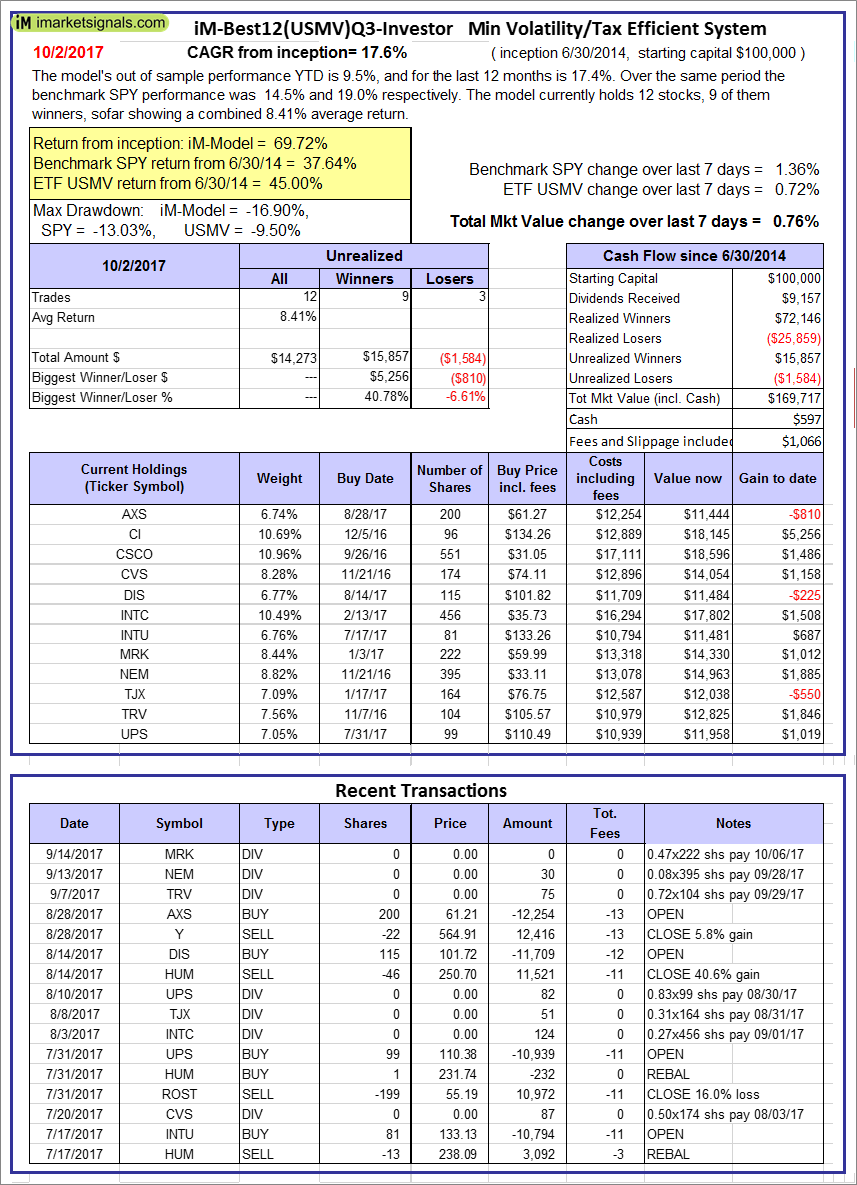 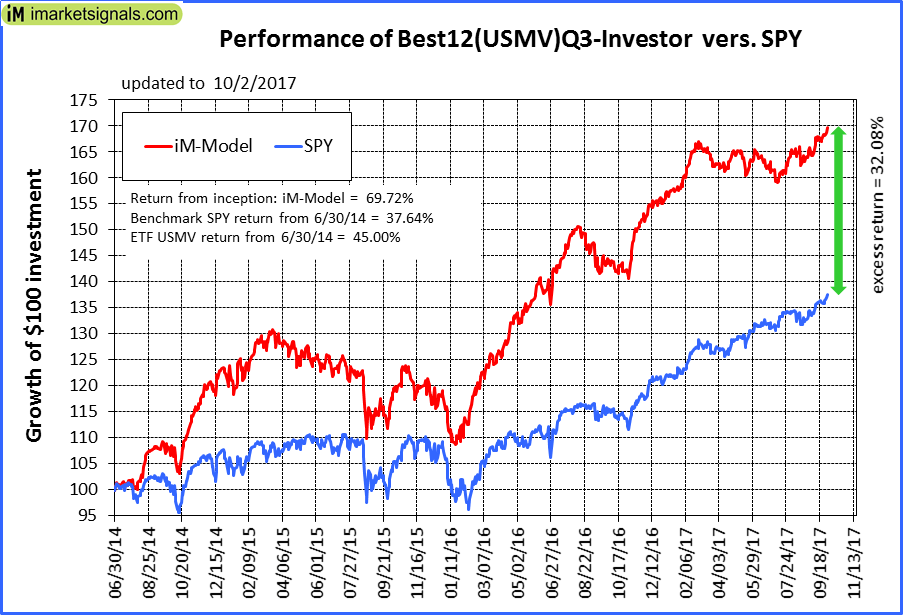 |
iM-Best12(USMV)Q3-Investor: The model’s out of sample performance YTD is 9.5%, and for the last 12 months is 17.4%. Over the same period the benchmark SPY performance was 14.5% and 19.0% respectively. Since inception, on 7/1/2014, the model gained 69.72% while the benchmark SPY gained 37.64% and the ETF USMV gained 45.00% over the same period. Over the previous week the market value of iM-Best12(USMV)Q3 gained 0.76% at a time when SPY gained 1.36%. A starting capital of $100,000 at inception on 7/1/2014 would have grown to $169,717 which includes $597 cash and excludes $1,066 spent on fees and slippage. |
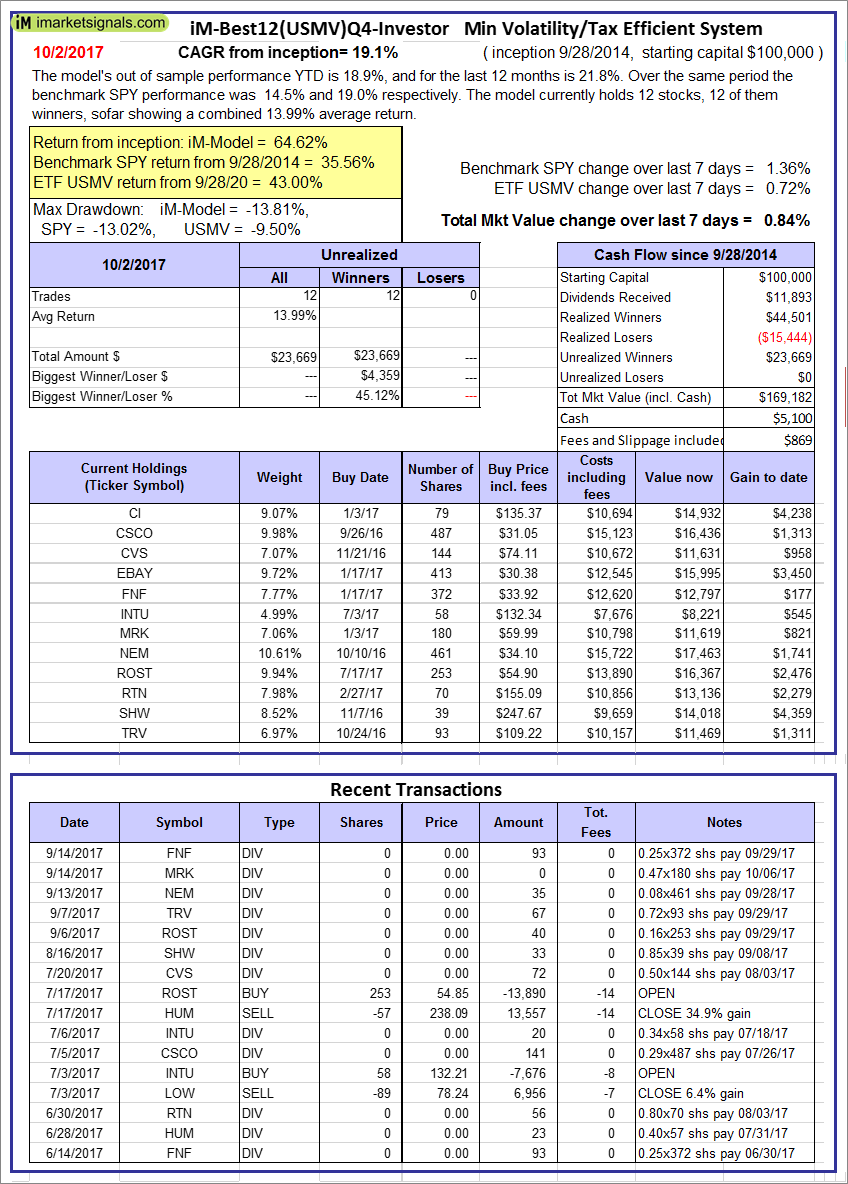 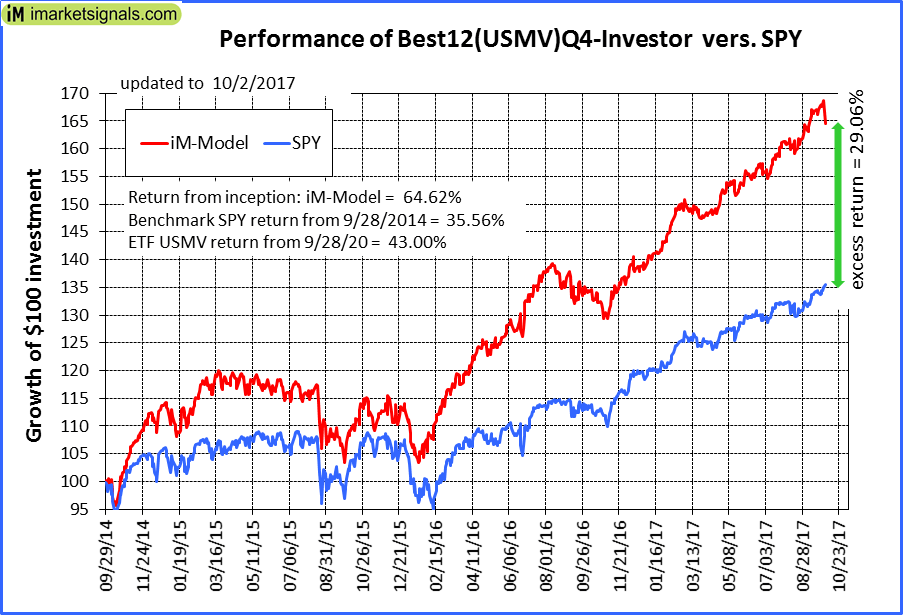 |
iM-Best12(USMV)Q4-Investor: Since inception, on 9/29/2014, the model gained 64.62% while the benchmark SPY gained 35.56% and the ETF USMV gained 43.00% over the same period. Over the previous week the market value of iM-Best12(USMV)Q4 gained 0.84% at a time when SPY gained 1.36%. A starting capital of $100,000 at inception on 9/29/2014 would have grown to $169,182 which includes $5,100 cash and excludes $869 spent on fees and slippage. |
 |
Average Performance of iM-Best12(USMV)Q1+Q2+Q3+Q4-Investor resulted in an excess return of 38.07% over SPY. (see iM-USMV Investor Portfolio) |
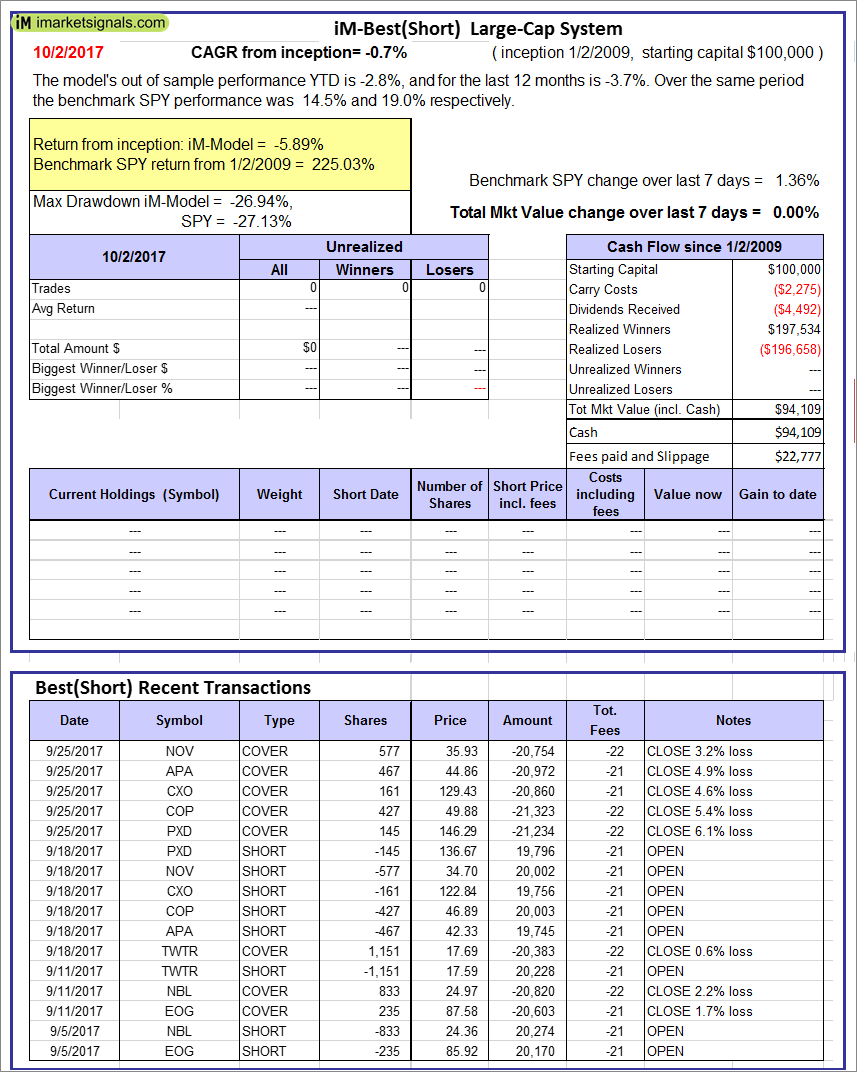 |
iM-Best(Short): The model’s out of sample performance YTD is -2.8%, and for the last 12 months is -3.7%. Over the same period the benchmark SPY performance was 14.5% and 19.0% respectively. Over the previous week the market value of iM-Best(Short) gained 0.00% at a time when SPY gained 1.36%. Over the period 1/2/2009 to 10/2/2017 the starting capital of $100,000 would have grown to $94,109 which includes $94,109 cash and excludes $22,777 spent on fees and slippage. |
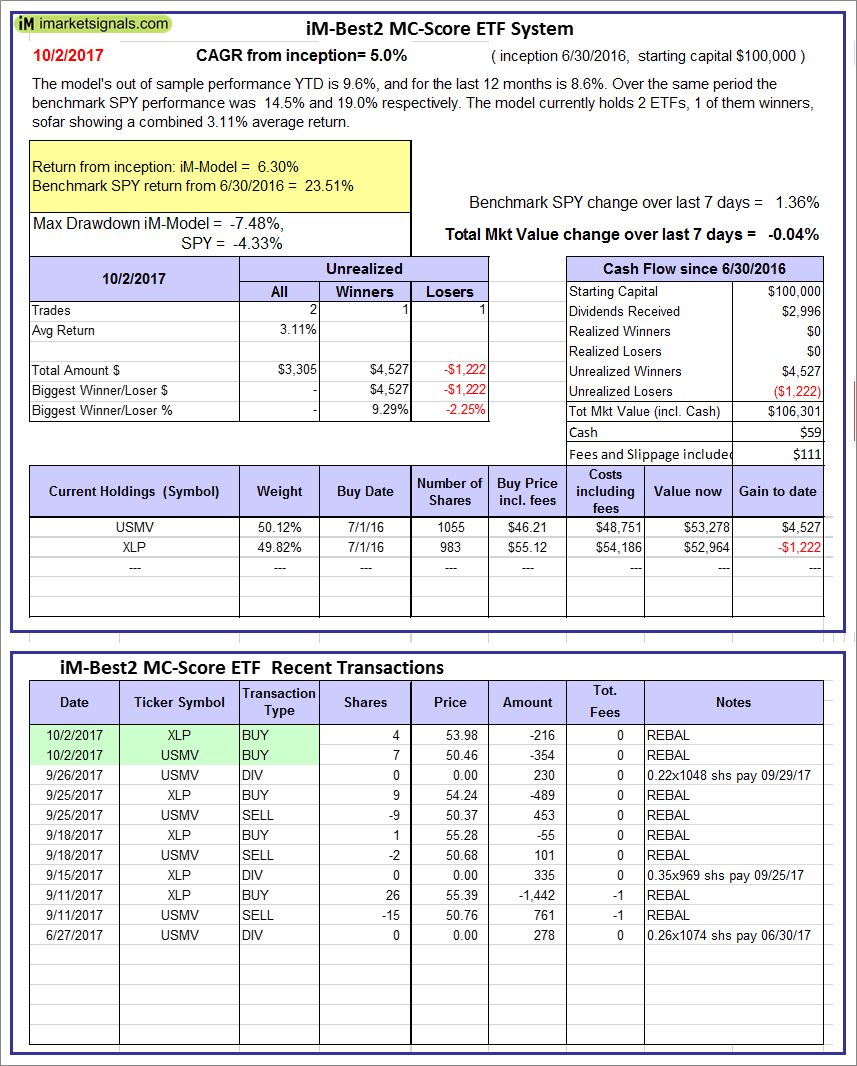 |
iM-Best2 MC-Score ETF System: The model’s out of sample performance YTD is 9.6%, and for the last 12 months is 8.6%. Over the same period the benchmark SPY performance was 14.5% and 19.0% respectively. Over the previous week the market value of the iM-Best2 MC-Score ETF System gained -0.04% at a time when SPY gained 1.36%. A starting capital of $100,000 at inception on 6/30/2016 would have grown to $106,301 which includes $59 cash and excludes $111 spent on fees and slippage. |
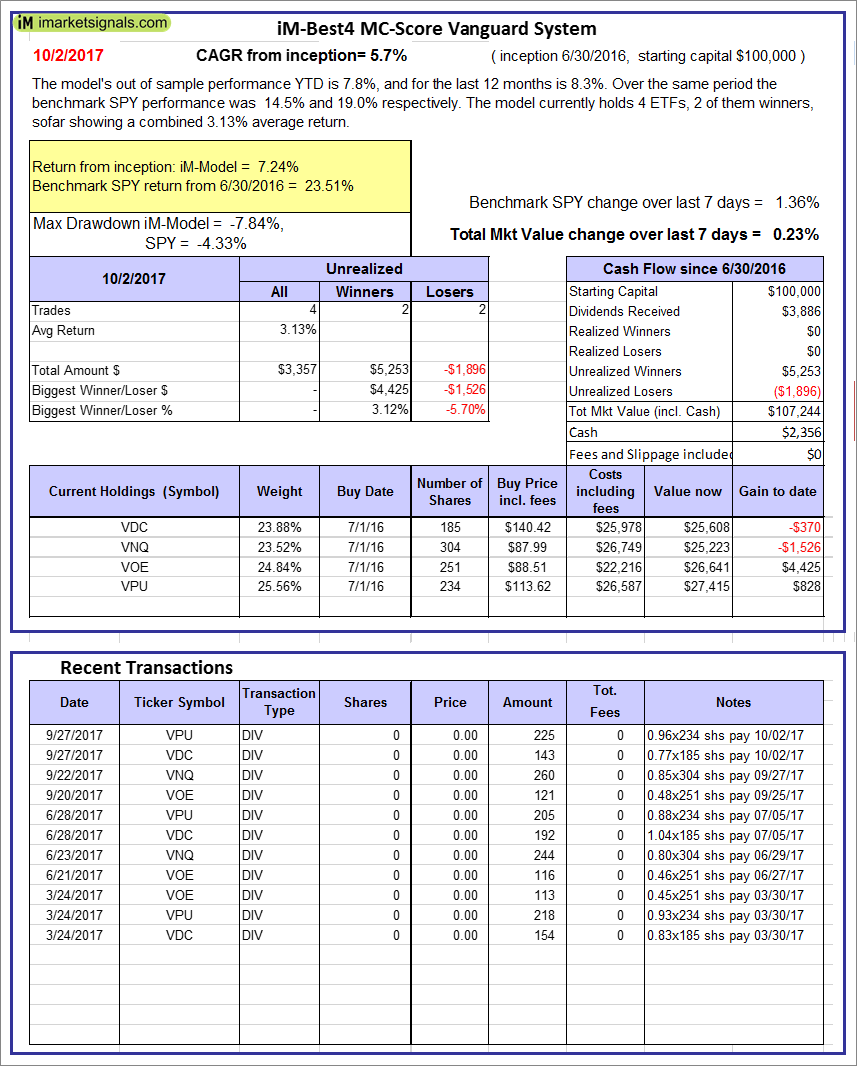 |
iM-Best4 MC-Score Vanguard System: The model’s out of sample performance YTD is 7.8%, and for the last 12 months is 8.3%. Over the same period the benchmark SPY performance was 14.5% and 19.0% respectively. Over the previous week the market value of the iM-Best4 MC-Score Vanguard System gained 0.23% at a time when SPY gained 1.36%. A starting capital of $100,000 at inception on 6/30/2016 would have grown to $107,244 which includes $2,356 cash and excludes $00 spent on fees and slippage. |
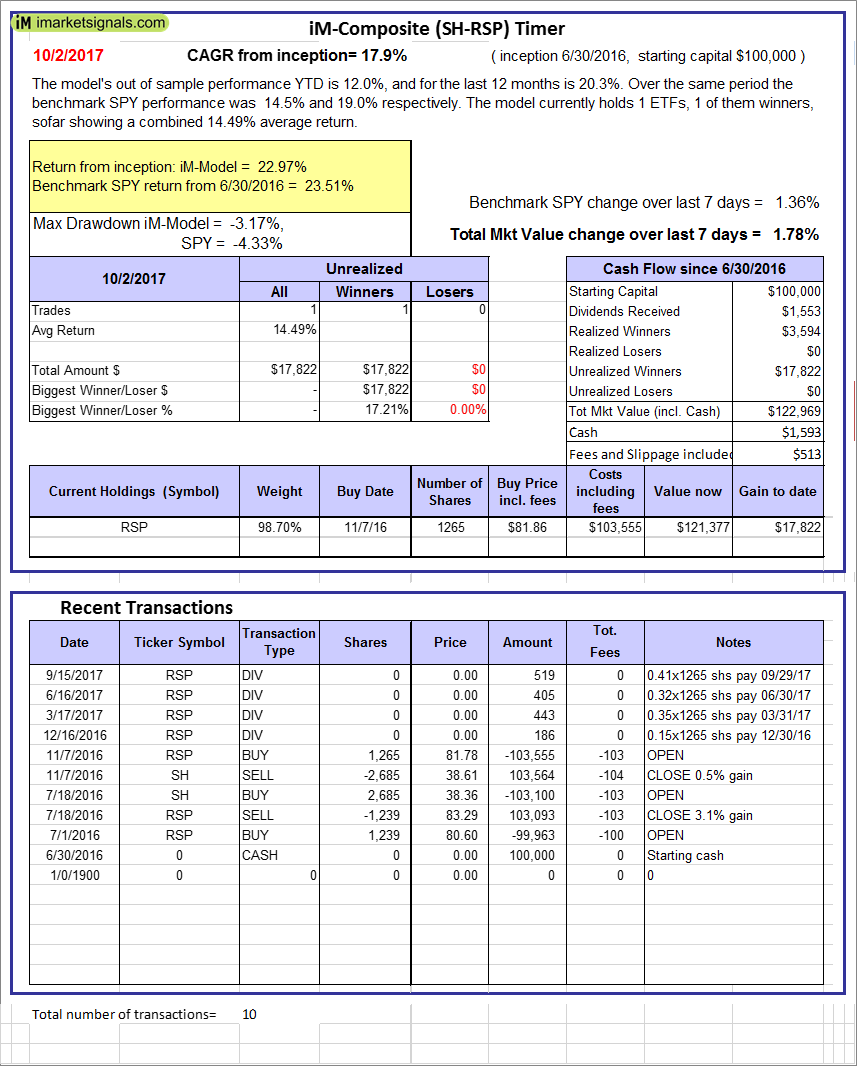 |
iM-Composite (SH-RSP) Timer: The model’s out of sample performance YTD is 12.0%, and for the last 12 months is 20.3%. Over the same period the benchmark SPY performance was 14.5% and 19.0% respectively. Over the previous week the market value of the iM-Composite (SH-RSP) Timer gained 1.78% at a time when SPY gained 1.36%. A starting capital of $100,000 at inception on 6/30/2016 would have grown to $122,969 which includes $1,593 cash and excludes $513 spent on fees and slippage. |
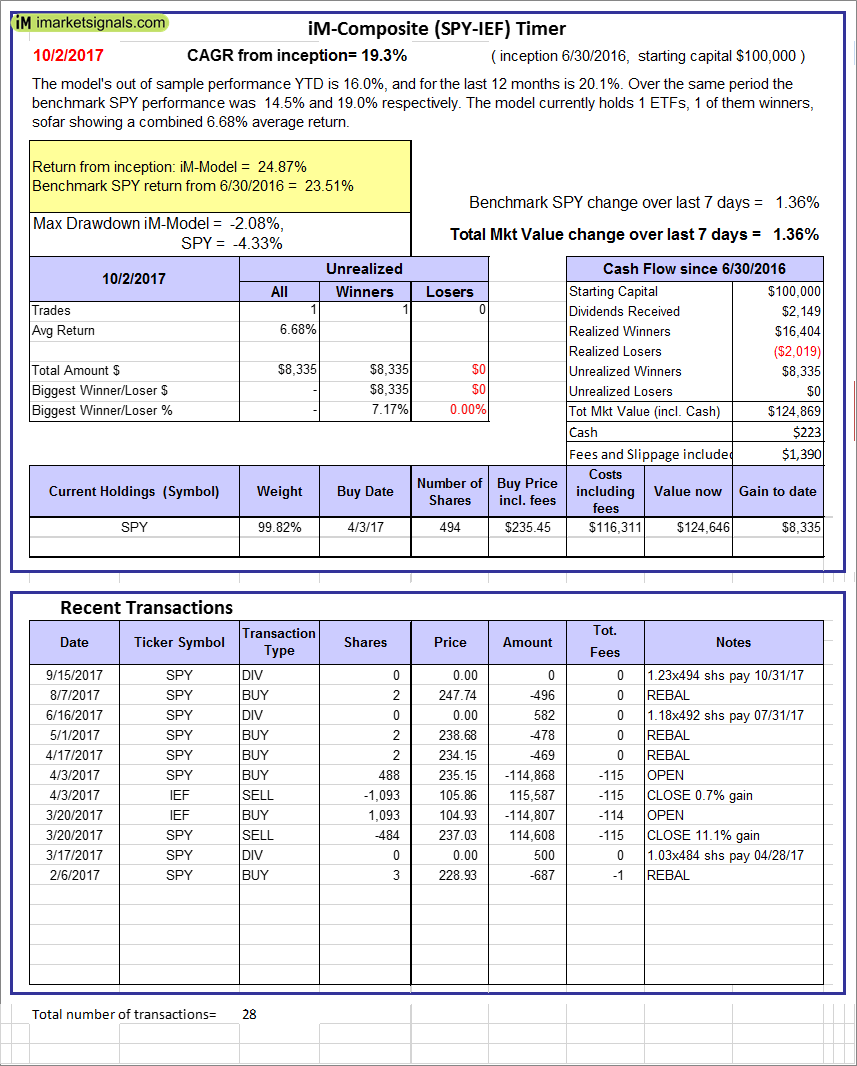 |
iM-Composite (SPY-IEF) Timer: The model’s out of sample performance YTD is 16.0%, and for the last 12 months is 20.1%. Over the same period the benchmark SPY performance was 14.5% and 19.0% respectively. Over the previous week the market value of the iM-Composite (SPY-IEF) Timer gained 1.36% at a time when SPY gained 1.36%. A starting capital of $100,000 at inception on 6/30/2016 would have grown to $124,869 which includes $223 cash and excludes $1,390 spent on fees and slippage. |
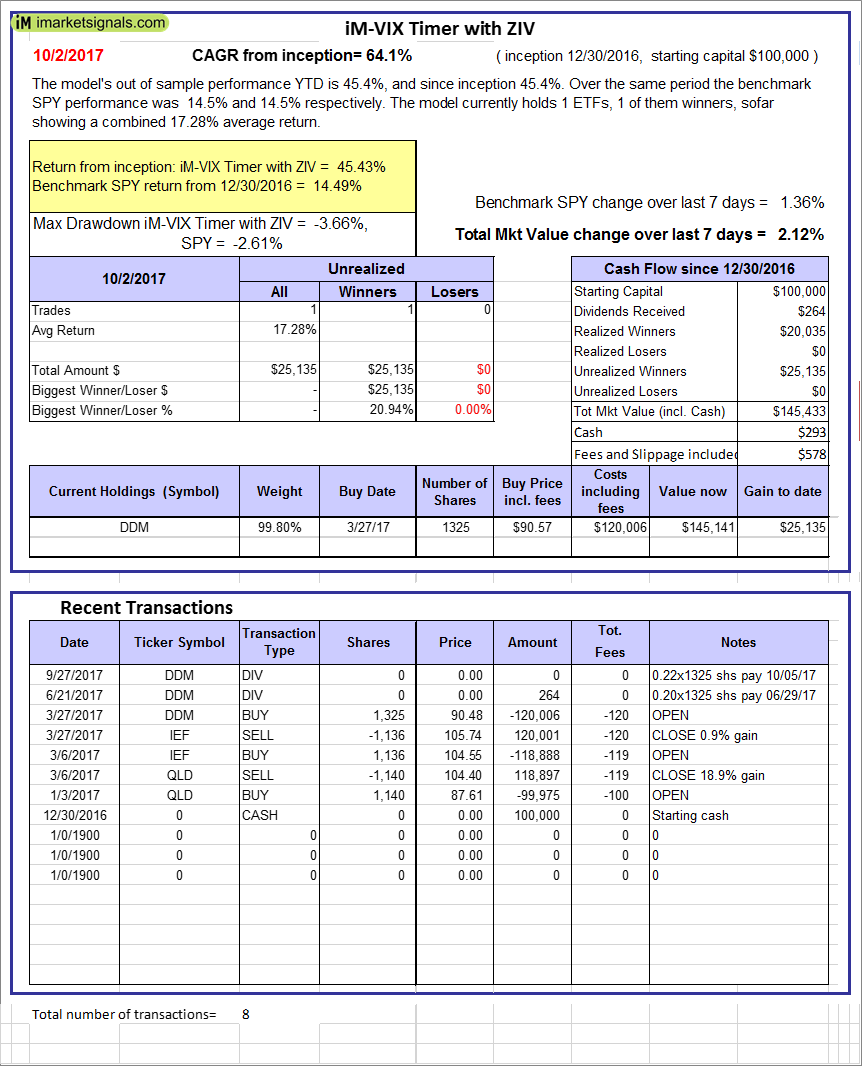 |
iM-VIX Timer with ZIV: The model’s out of sample performance YTD is 45.4%, and since inception 45.4%. Over the same period the benchmark SPY performance was 14.5% and 14.5% respectively. Over the previous week the market value of the iM-VIX Timer with ZIV gained 2.12% at a time when SPY gained 1.36%. A starting capital of $100,000 at inception on 6/30/2016 would have grown to $145,433 which includes $293 cash and excludes $578 spent on fees and slippage. |
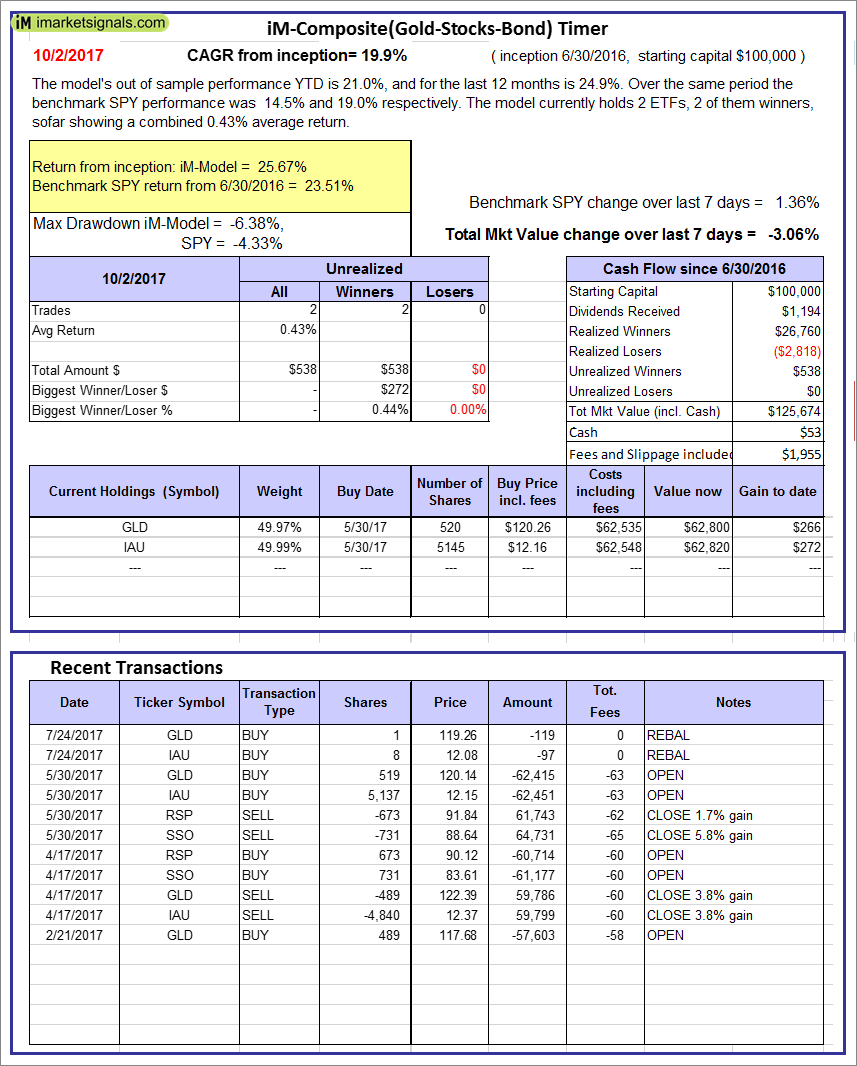 |
iM-Composite(Gold-Stocks-Bond) Timer: The model’s out of sample performance YTD is 21.0%, and for the last 12 months is 24.9%. Over the same period the benchmark SPY performance was 14.5% and 19.0% respectively. Over the previous week the market value of the iM-Composite(Gold-Stocks-Bond) Timer gained -3.06% at a time when SPY gained 1.36%. A starting capital of $100,000 at inception on 6/30/2016 would have grown to $125,674 which includes $53 cash and excludes $1,955 spent on fees and slippage. |
 |
iM-Low Turnover Composite Timer Combo: The model’s out of sample performance from inception is 3.7%. The benchmark SPY performance over the same period is 9.0%. Over the previous week the market value of the iM-Low Turnover Composite Timer Combo gained -0.90% at a time when SPY gained 1.36%. A starting capital of $100,000 at inception on 3/24/27 would have grown to $103,688 which includes $847 cash and excludes $69 spent on fees and slippage. |
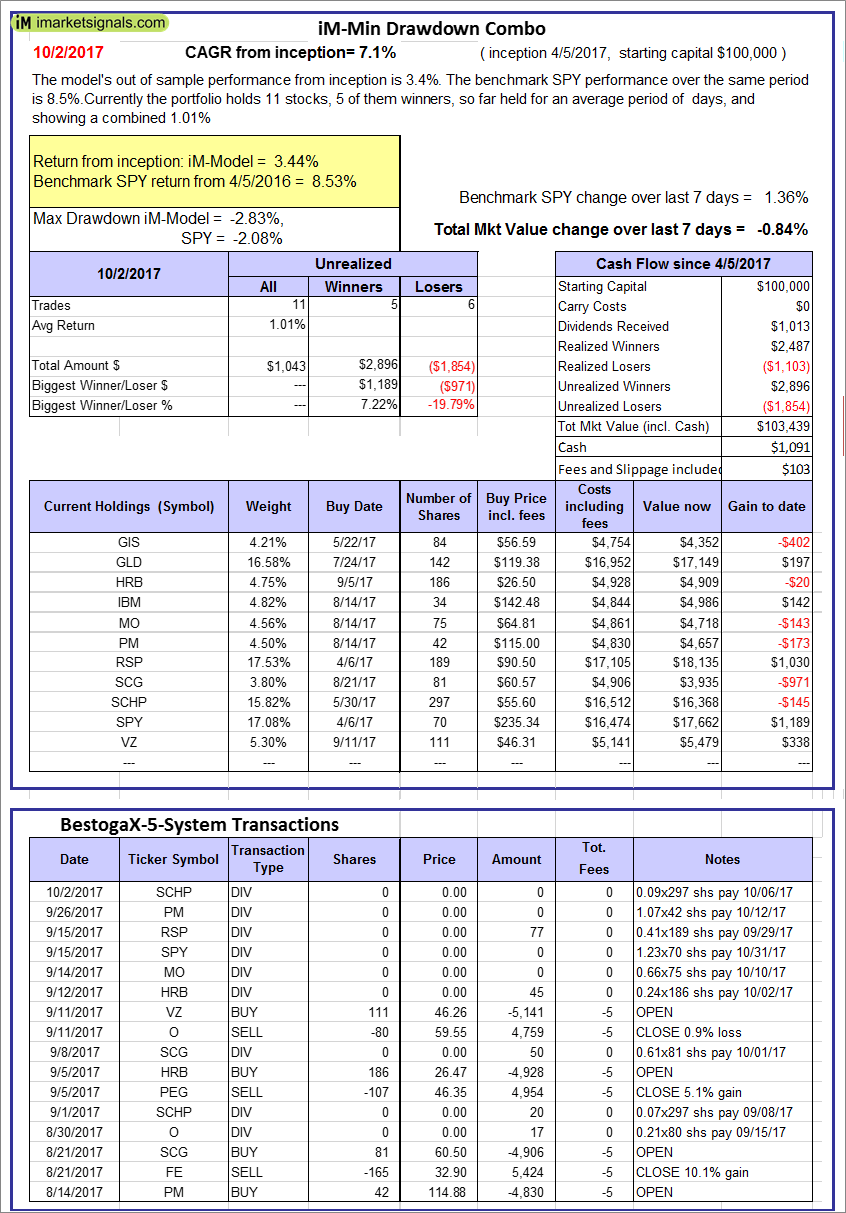 |
iM-Min Drawdown Combo: The model’s out of sample performance from inception is 3.4%. The benchmark SPY performance over the same period is 8.5%. Over the previous week the market value of the iM-Min Drawdown Combo gained -0.84% at a time when SPY gained 1.36%. A starting capital of $100,000 at inception on 4/5/2017 would have grown to $103,439 which includes $1,091 cash and excludes $103 spent on fees and slippage. |
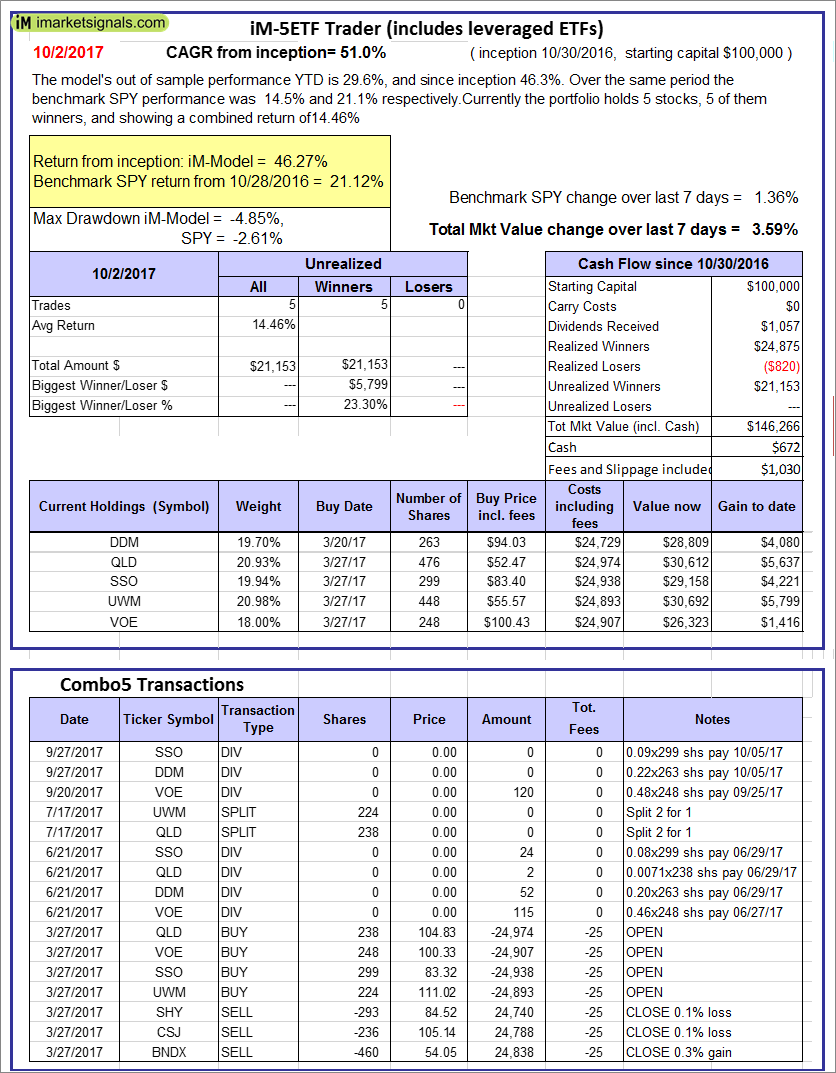 |
iM-5ETF Trader (includes leveraged ETFs): The model’s out of sample performance YTD is 29.6%, and since inception 46.3%. Over the same period the benchmark SPY performance was 14.5% and 21.1% respectively. Over the previous week the market value of the iM-5ETF Trader (includes leveraged ETFs) gained 3.59% at a time when SPY gained 1.36%. A starting capital of $100,000 at inception on 10/30/2016 would have grown to $146,266 which includes $672 cash and excludes $1,030 spent on fees and slippage. |
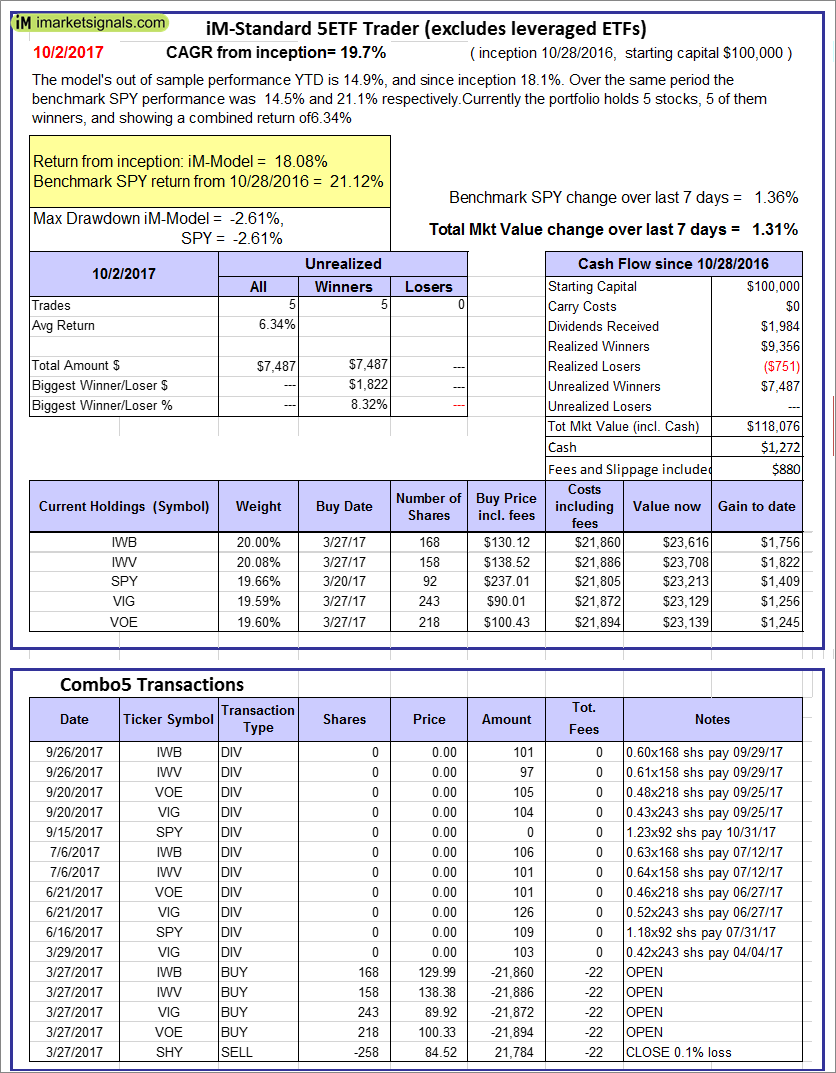 |
iM-Standard 5ETF Trader (excludes leveraged ETFs): The model’s out of sample performance YTD is 14.9%, and since inception 18.1%. Over the same period the benchmark SPY performance was 14.5% and 21.1% respectively. Over the previous week the market value of the iM-Standard 5ETF Trader (excludes leveraged ETFs) gained 1.31% at a time when SPY gained 1.36%. A starting capital of $100,000 at inception on 10/30/2016 would have grown to $118,076 which includes $1,272 cash and excludes $880 spent on fees and slippage. |
iM-Best Reports – 10/2/2017
Posted in pmp SPY-SH
Leave a Reply
You must be logged in to post a comment.