
  |
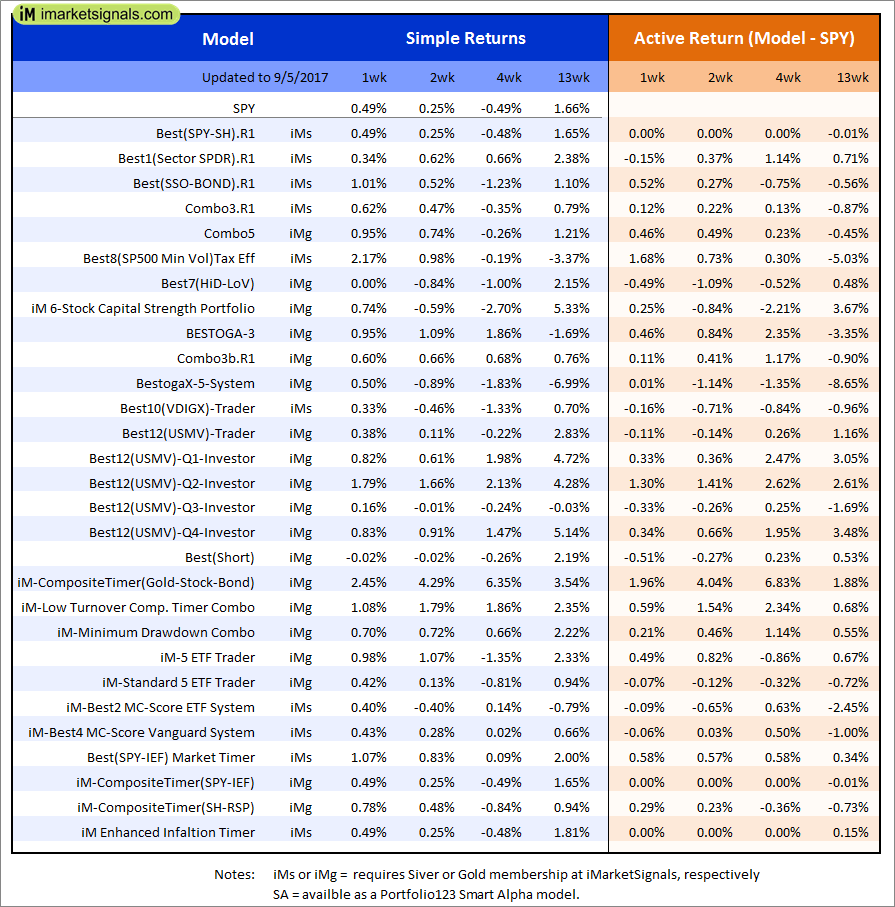
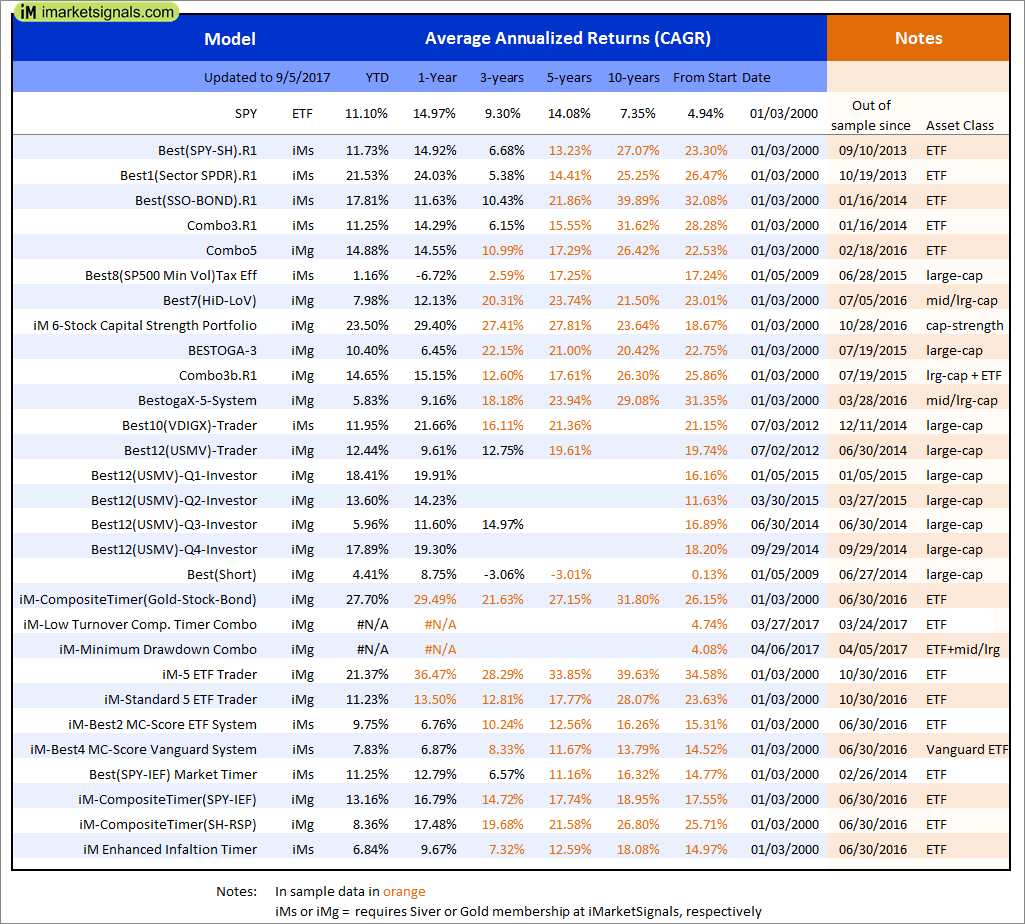
Out of sample performance summary of our models for the past 1, 2, 4 and 13 week periods. The active active return indicates how the models over- or underperformed the benchmark ETF SPY. Also the YTD, and the 1-, 3-, 5- and 10-year annualized returns are shown in the second table |
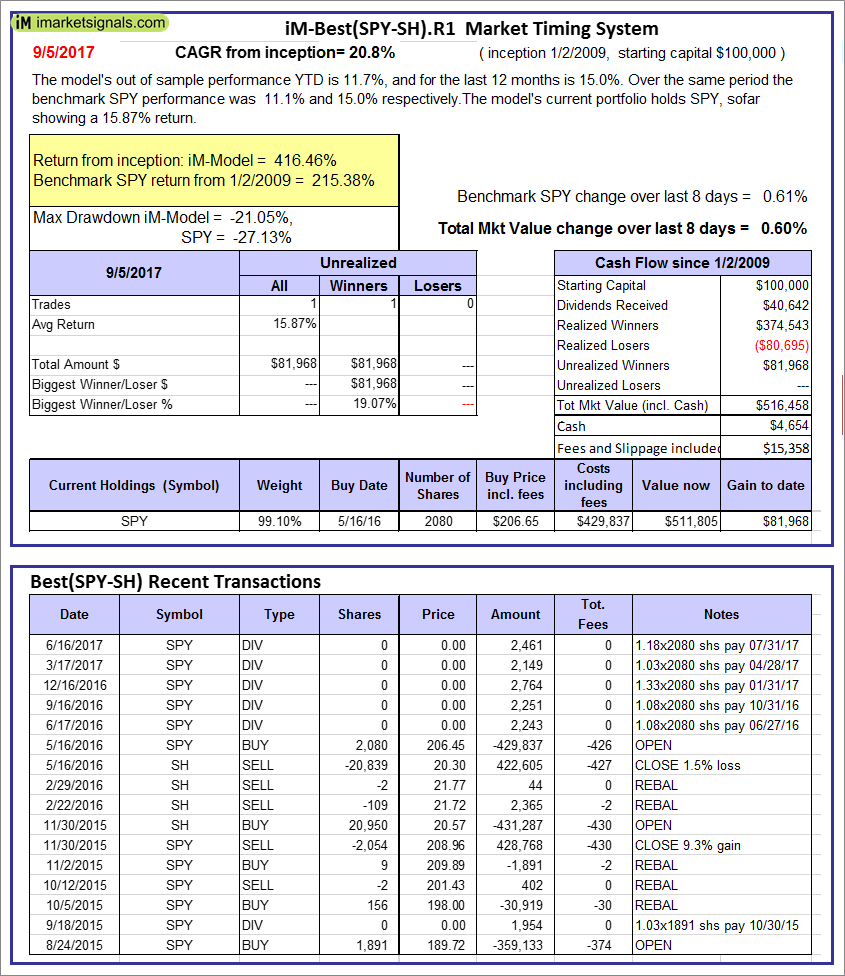 |
iM-Best(SPY-SH).R1: The model’s out of sample performance YTD is 11.7%, and for the last 12 months is 15.0%. Over the same period the benchmark SPY performance was 11.1% and 15.0% respectively. Over the previous week the market value of Best(SPY-SH) gained 0.60% at a time when SPY gained 0.61%. A starting capital of $100,000 at inception on 1/2/2009 would have grown to $516,458 which includes $4,654 cash and excludes $15,358 spent on fees and slippage. |
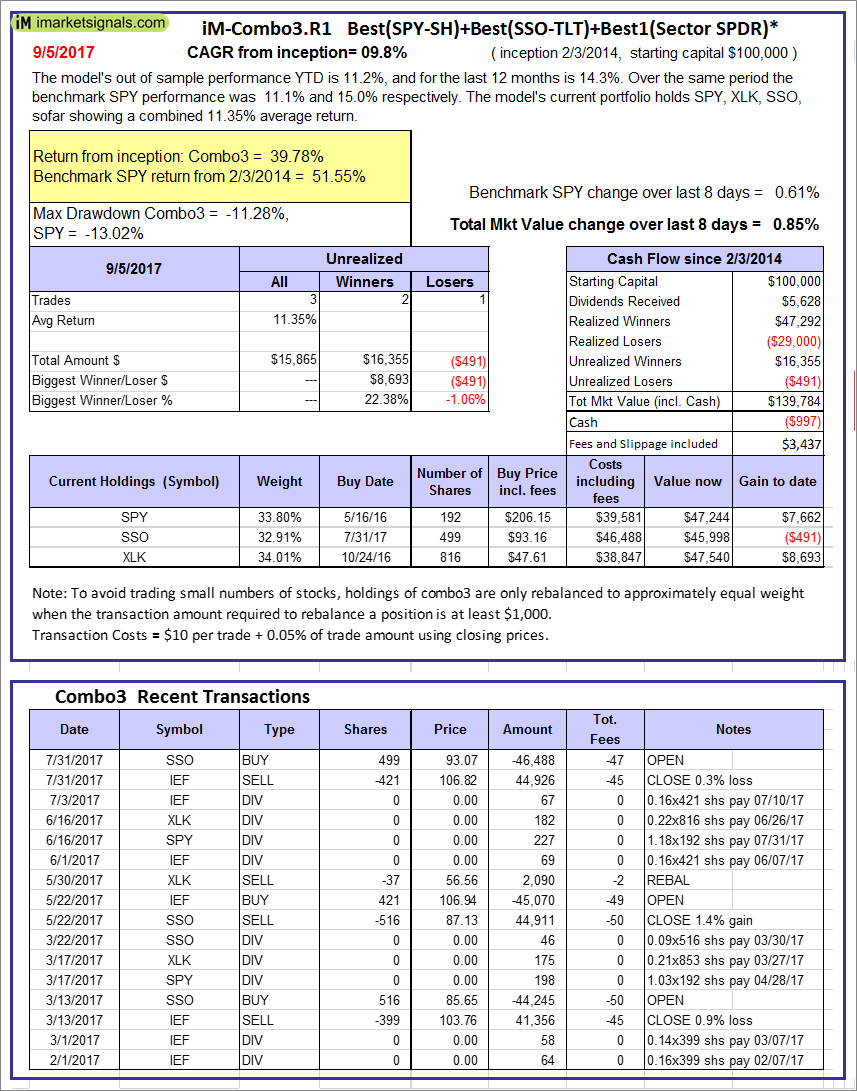 |
iM-Combo3.R1: The model’s out of sample performance YTD is 11.2%, and for the last 12 months is 14.3%. Over the same period the benchmark SPY performance was 11.1% and 15.0% respectively. Over the previous week the market value of iM-Combo3.R1 gained 0.85% at a time when SPY gained 0.61%. A starting capital of $100,000 at inception on 2/3/2014 would have grown to $139,784 which includes -$997 cash and excludes $3,437 spent on fees and slippage. |
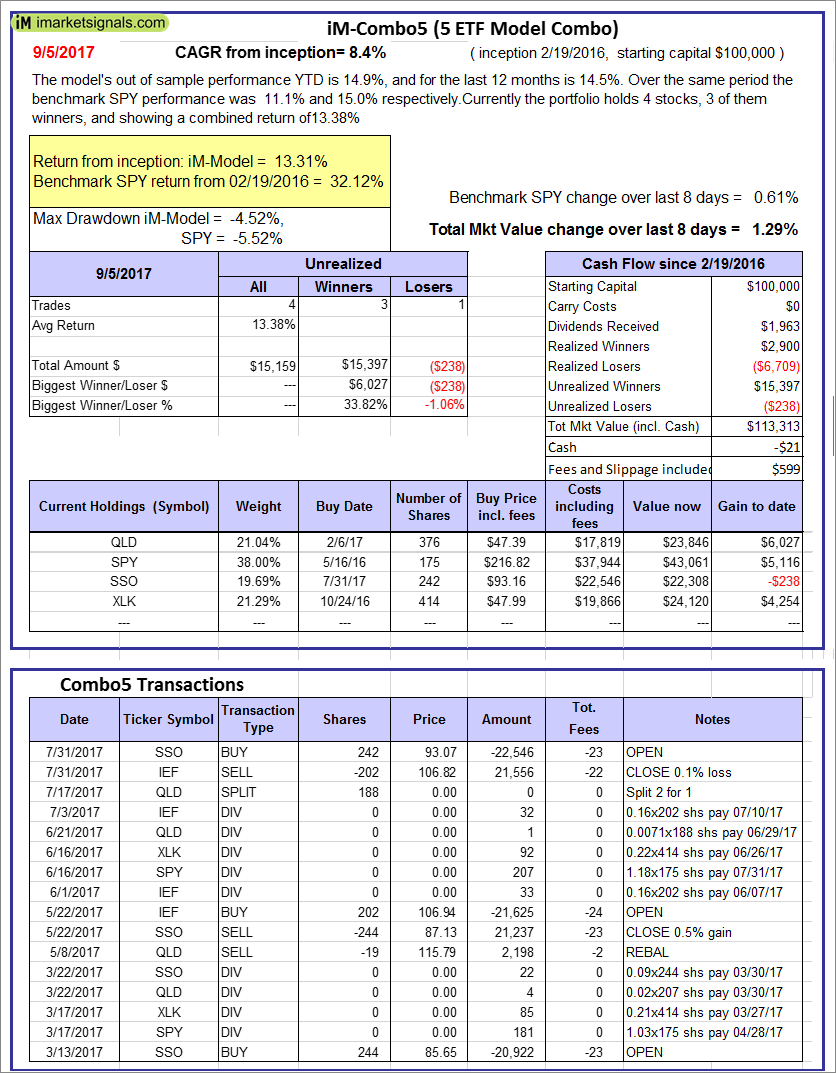 |
iM-Combo5: The model’s out of sample performance YTD is 14.9%, and for the last 12 months is 14.5%. Over the same period the benchmark SPY performance was 11.1% and 15.0% respectively. Over the previous week the market value of iM-Combo5 gained 1.29% at a time when SPY gained 0.61%. A starting capital of $100,000 at inception on 2/22/2016 would have grown to $113,313 which includes -$21 cash and excludes $599 spent on fees and slippage. |
  |
iM-Best10(VDIGX)-Trader: The model’s out of sample performance YTD is 12.0%, and for the last 12 months is 21.7%. Over the same period the benchmark SPY performance was 11.1% and 15.0% respectively. Since inception, on 7/1/2014, the model gained 63.17% while the benchmark SPY gained 33.57% and VDIGX gained 29.04% over the same period. Over the previous week the market value of iM-Best10(VDIGX) gained 0.42% at a time when SPY gained 0.61%. A starting capital of $100,000 at inception on 7/1/2014 would have grown to $163,170 which includes $7,174 cash and excludes $1,588 spent on fees and slippage. |
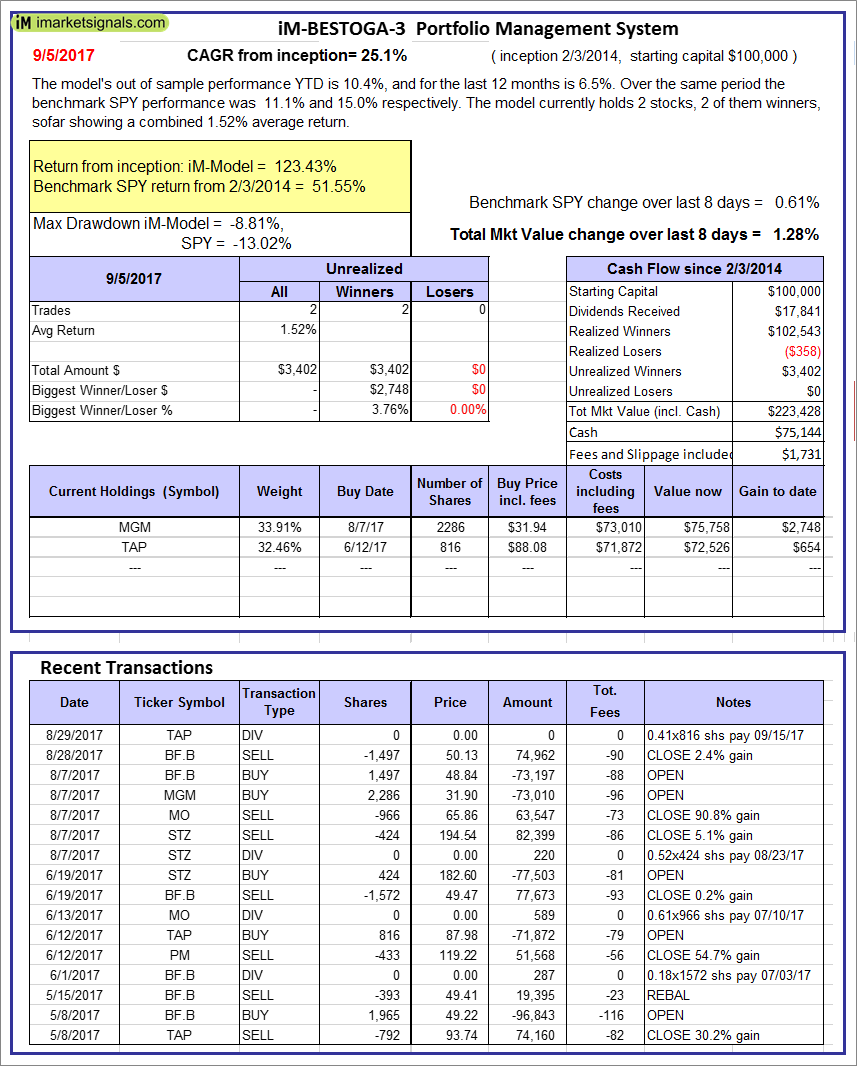 |
iM-BESTOGA-3: The model’s out of sample performance YTD is 10.4%, and for the last 12 months is 6.5%. Over the same period the benchmark SPY performance was 11.1% and 15.0% respectively. Over the previous week the market value of iM-BESTOGA-3 gained 1.28% at a time when SPY gained 0.61%. A starting capital of $100,000 at inception on 2/3/2014 would have grown to $223,428 which includes $75,144 cash and excludes $1,731 spent on fees and slippage. |
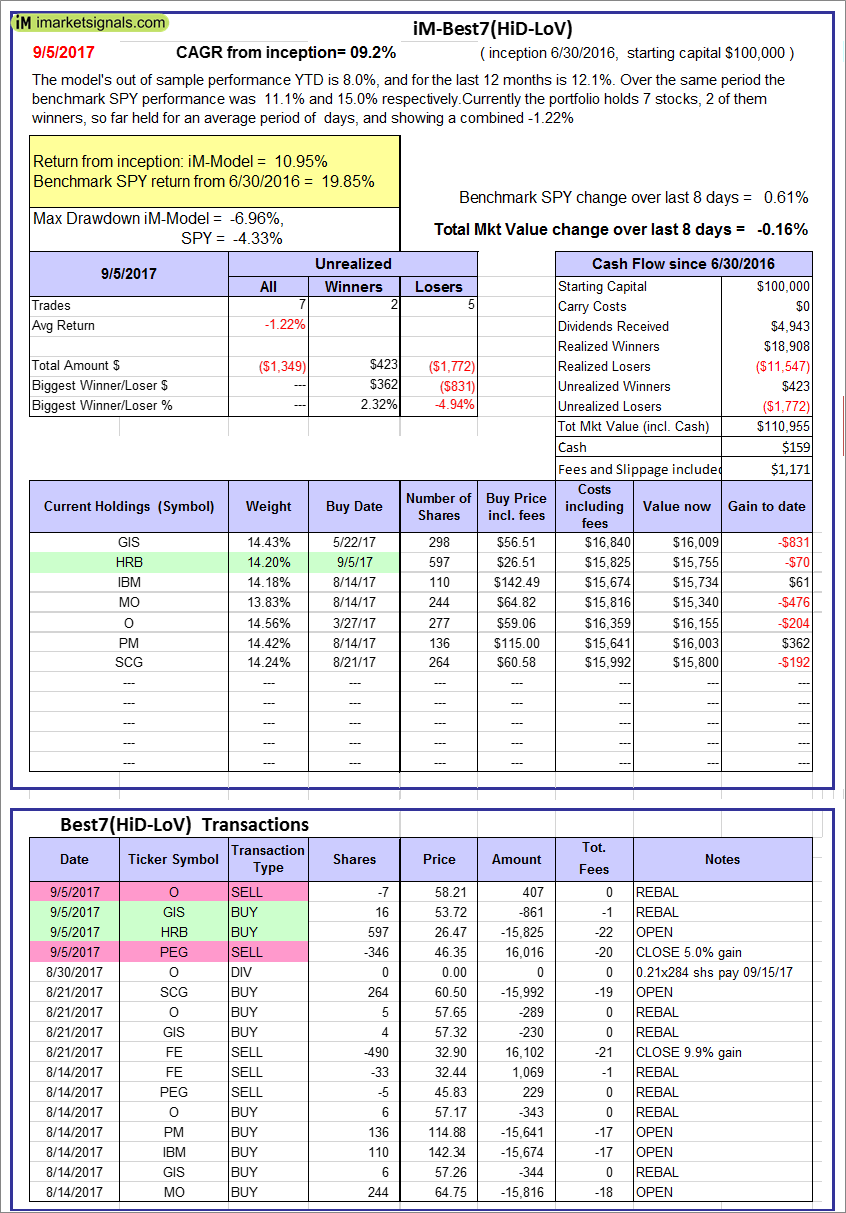 |
iM-Best7(HiD-LoV): The model’s out of sample performance YTD is 8.0%, and for the last 12 months is 12.1%. Over the same period the benchmark SPY performance was 11.1% and 15.0% respectively. Over the previous week the market value of iM-BESTOGA-3 gained -0.16% at a time when SPY gained 0.61%. A starting capital of $100,000 at inception on 6/30/2016 would have grown to $110,955 which includes $159 cash and excludes $1,171 spent on fees and slippage. |
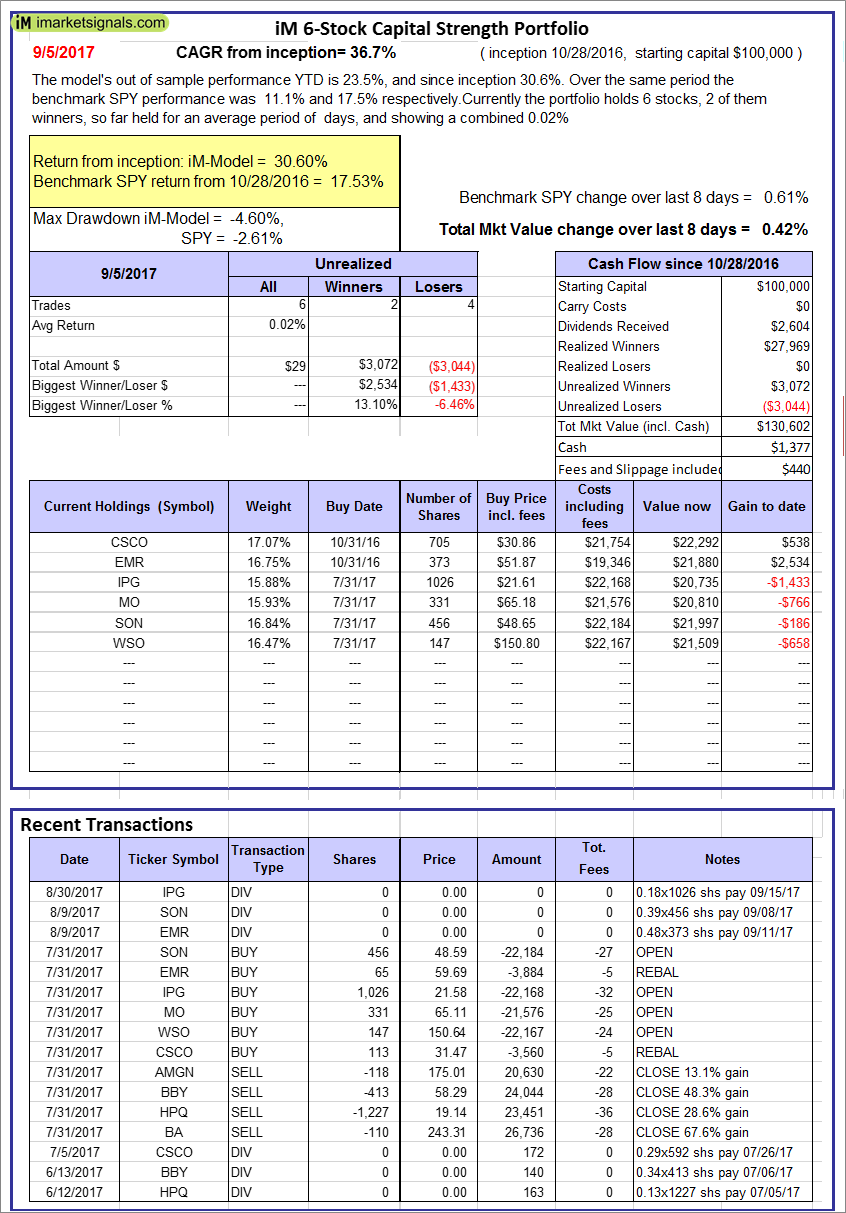 |
iM 6-Stock Capital Strength Portfolio: The model’s out of sample performance YTD is 23.5%, and since inception 30.6%. Over the same period the benchmark SPY performance was 11.1% and 17.5% respectively. Over the previous week the market value of the iM 6-Stock Capital Strength Portfolio gained 0.42% at a time when SPY gained 0.61%. A starting capital of $100,000 at inception on 10/28/2016 would have grown to $130,602 which includes $1,377 cash and excludes $440 spent on fees and slippage. |
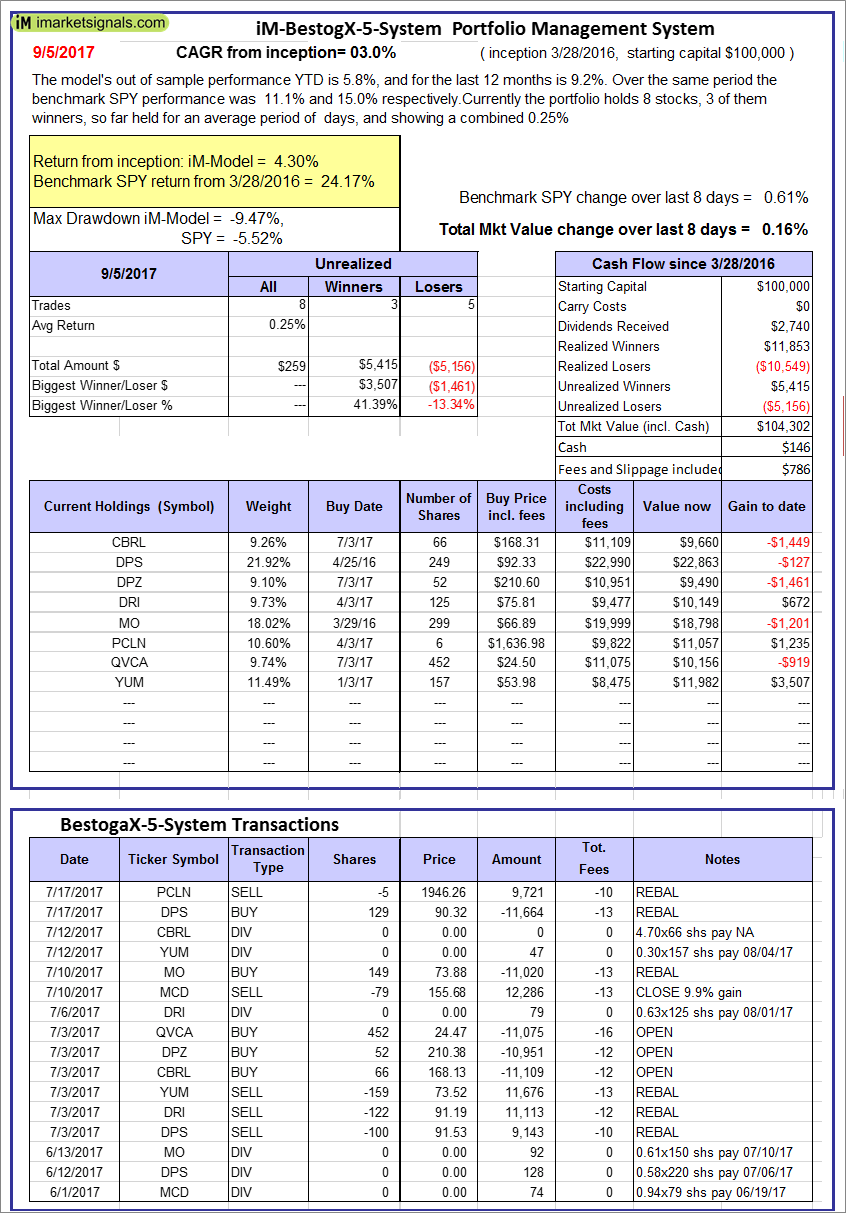 |
iM-BestogaX5-System: The model’s out of sample performance YTD is 5.8%, and for the last 12 months is 9.2%. Over the same period the benchmark SPY performance was 11.1% and 15.0% respectively. Over the previous week the market value of iM-Best8(S&P 500)Tax-Eff. gained 0.16% at a time when SPY gained 0.61%. A starting capital of $100,000 at inception on 3/28/2016 would have grown to $104,302 which includes $146 cash and excludes $786 spent on fees and slippage. |
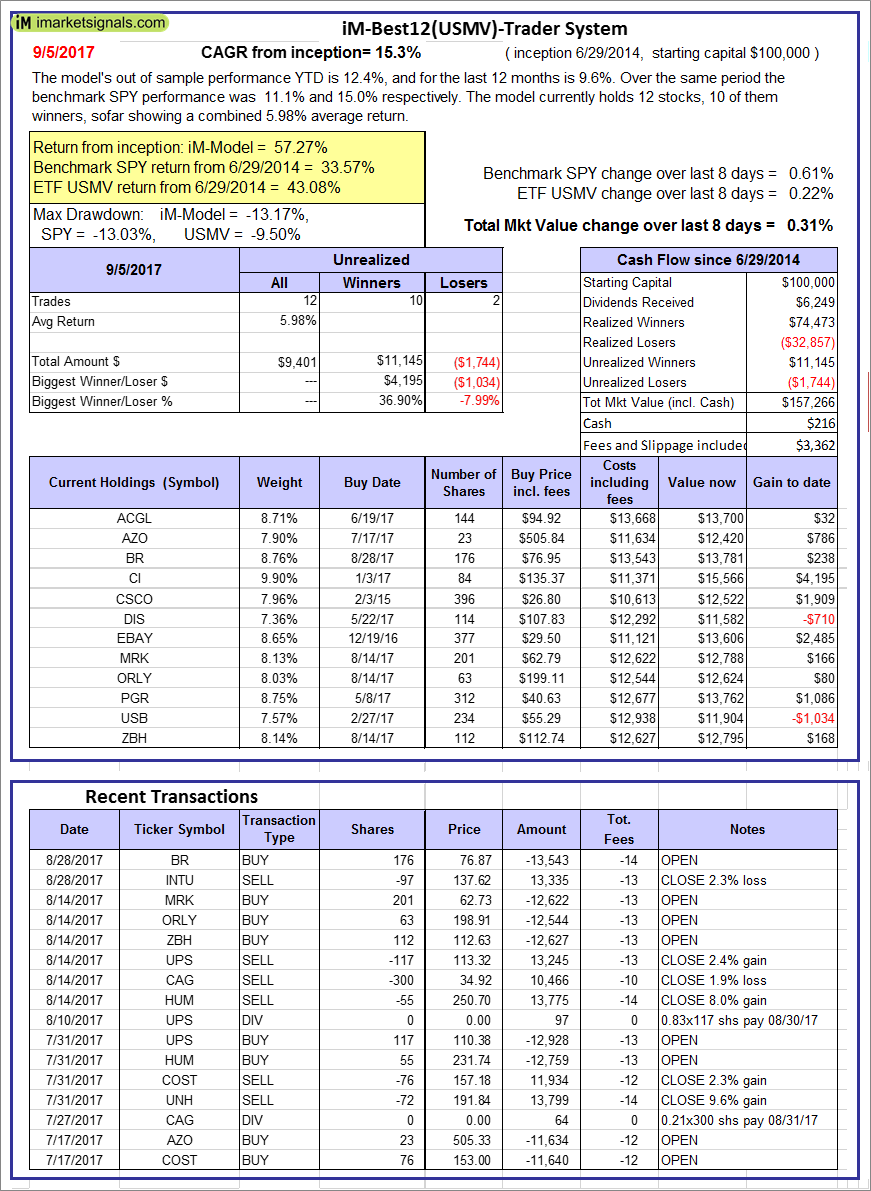 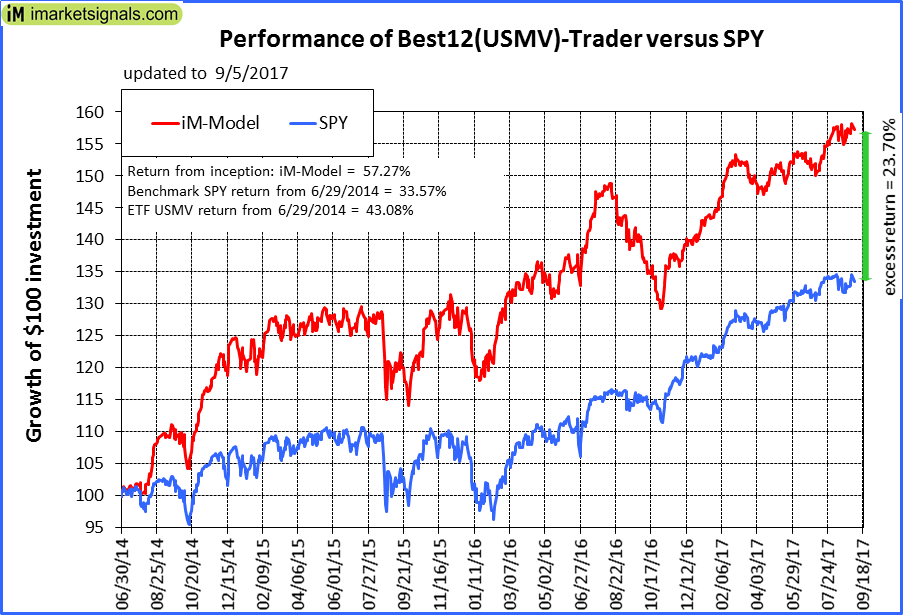 |
iM-Best12(USMV)-Trader: The model’s out of sample performance YTD is 12.4%, and for the last 12 months is 9.6%. Over the same period the benchmark SPY performance was 11.1% and 15.0% respectively. Since inception, on 6/30/2014, the model gained 57.27% while the benchmark SPY gained 33.57% and the ETF USMV gained 43.08% over the same period. Over the previous week the market value of iM-Best12(USMV)-Trader gained 0.31% at a time when SPY gained 0.61%. A starting capital of $100,000 at inception on 6/30/2014 would have grown to $157,266 which includes $216 cash and excludes $3,362 spent on fees and slippage. |
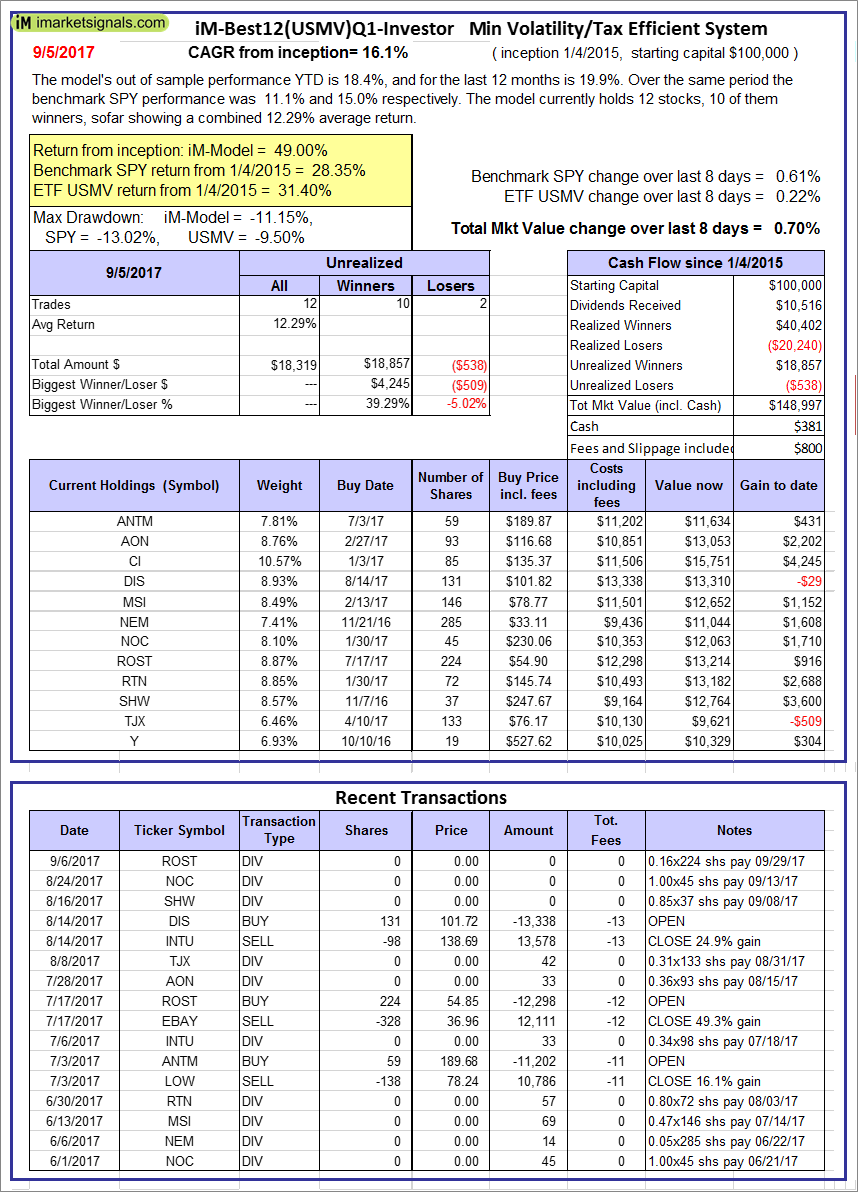 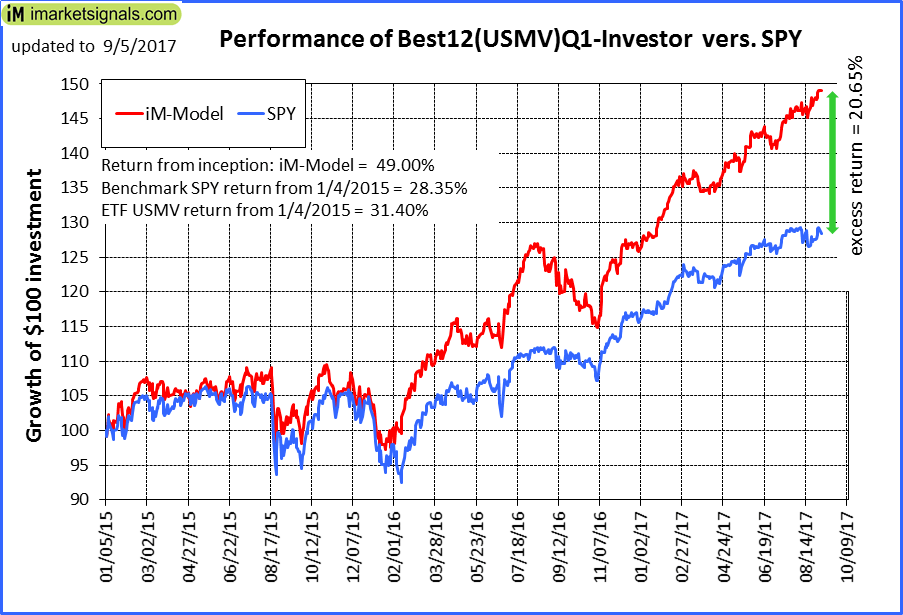 |
iM-Best12(USMV)Q1-Investor: The model’s out of sample performance YTD is 18.4%, and for the last 12 months is 19.9%. Over the same period the benchmark SPY performance was 11.1% and 15.0% respectively. Since inception, on 1/5/2015, the model gained 49.00% while the benchmark SPY gained 28.35% and the ETF USMV gained 31.40% over the same period. Over the previous week the market value of iM-Best12(USMV)Q1 gained 0.70% at a time when SPY gained 0.61%. A starting capital of $100,000 at inception on 1/5/2015 would have grown to $148,997 which includes $381 cash and excludes $800 spent on fees and slippage. |
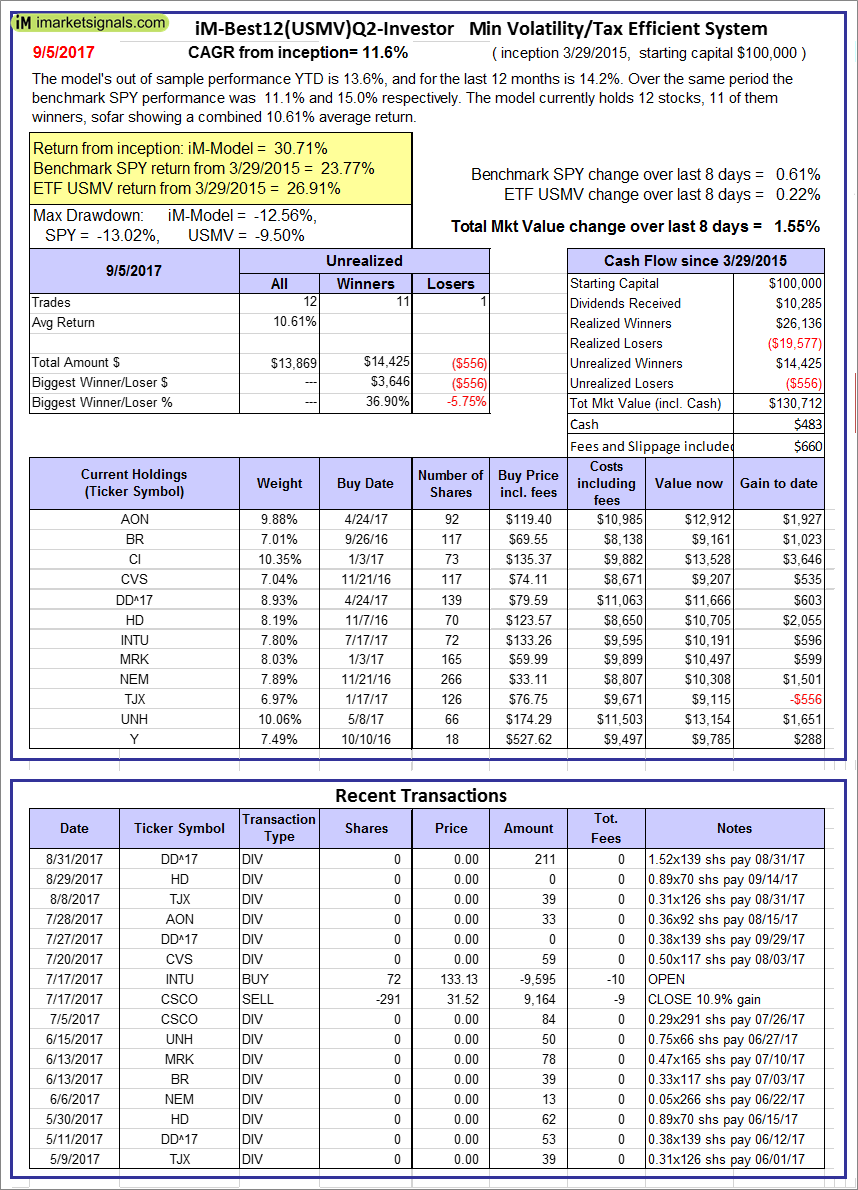 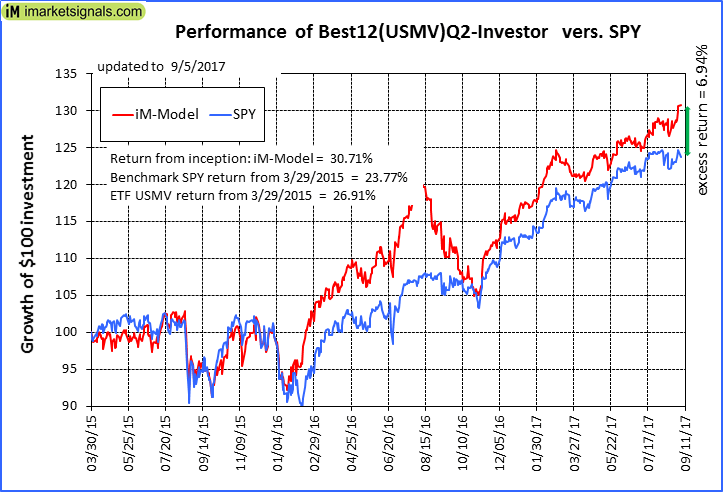 |
iM-Best12(USMV)Q2-Investor: The model’s out of sample performance YTD is 13.6%, and for the last 12 months is 14.2%. Over the same period the benchmark SPY performance was 11.1% and 15.0% respectively. Since inception, on 3/30/2015, the model gained 30.71% while the benchmark SPY gained 23.77% and the ETF USMV gained 26.91% over the same period. Over the previous week the market value of iM-Best12(USMV)Q2 gained 1.55% at a time when SPY gained 0.61%. A starting capital of $100,000 at inception on 3/30/2015 would have grown to $130,712 which includes $483 cash and excludes $660 spent on fees and slippage. |
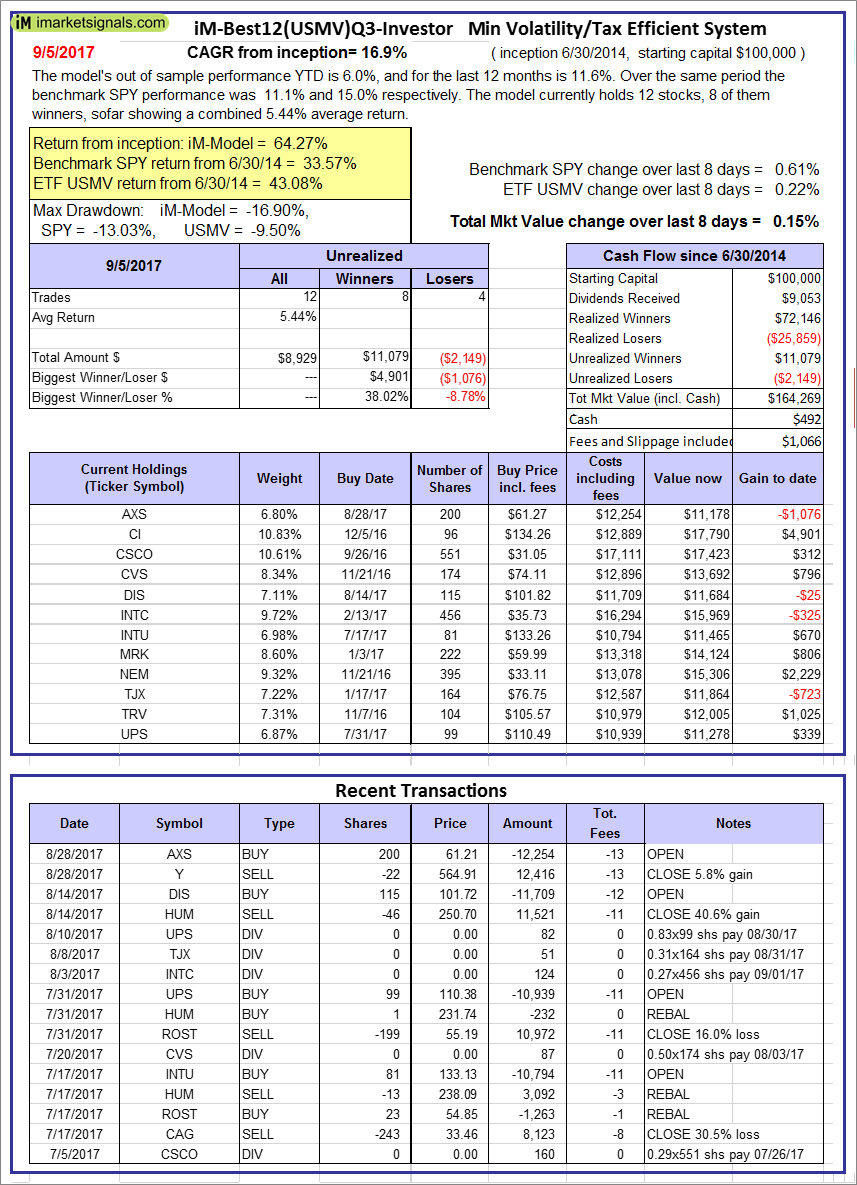 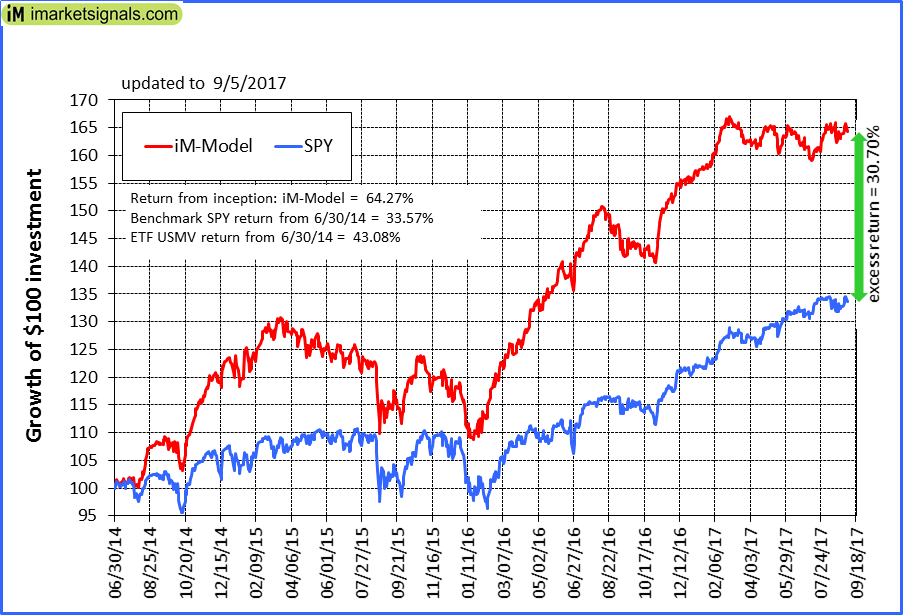 |
iM-Best12(USMV)Q3-Investor: The model’s out of sample performance YTD is 6.0%, and for the last 12 months is 11.6%. Over the same period the benchmark SPY performance was 11.1% and 15.0% respectively. Since inception, on 7/1/2014, the model gained 64.27% while the benchmark SPY gained 33.57% and the ETF USMV gained 43.08% over the same period. Over the previous week the market value of iM-Best12(USMV)Q3 gained 0.15% at a time when SPY gained 0.61%. A starting capital of $100,000 at inception on 7/1/2014 would have grown to $164,269 which includes $492 cash and excludes $1,066 spent on fees and slippage. |
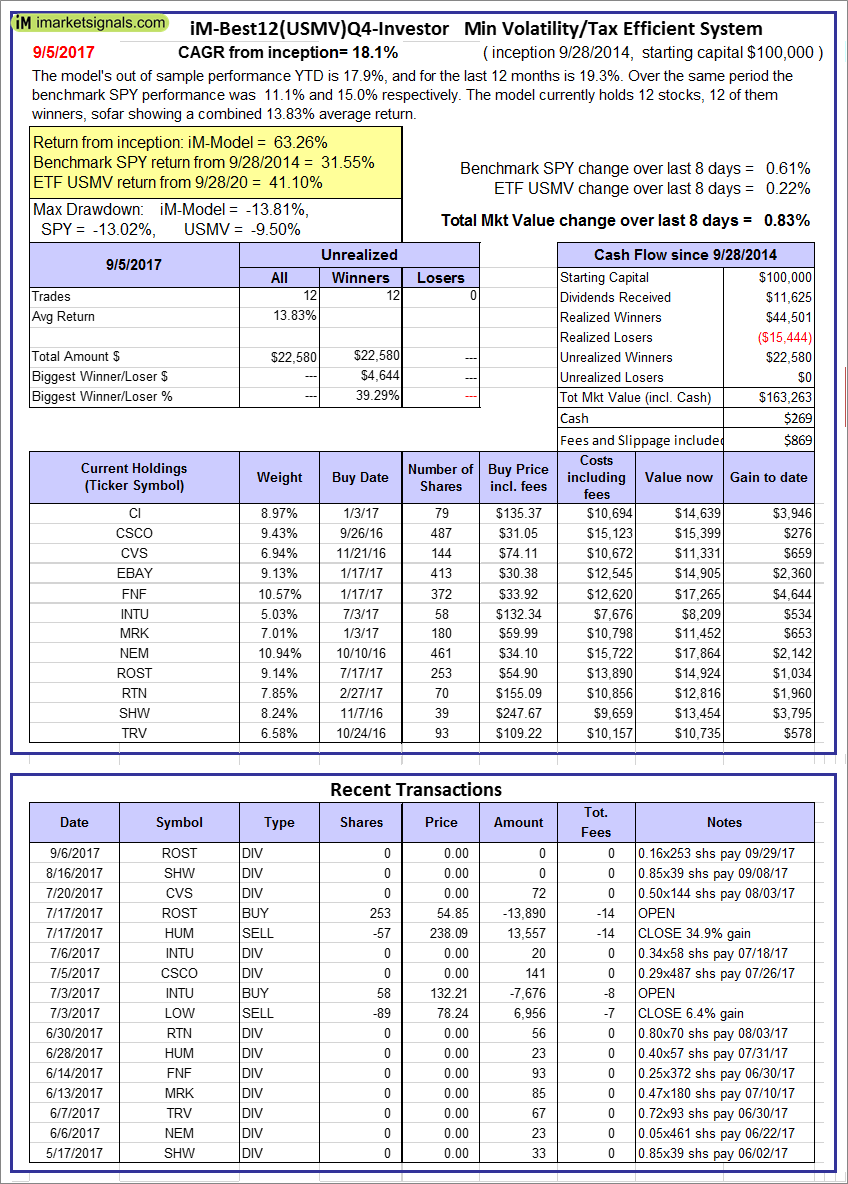 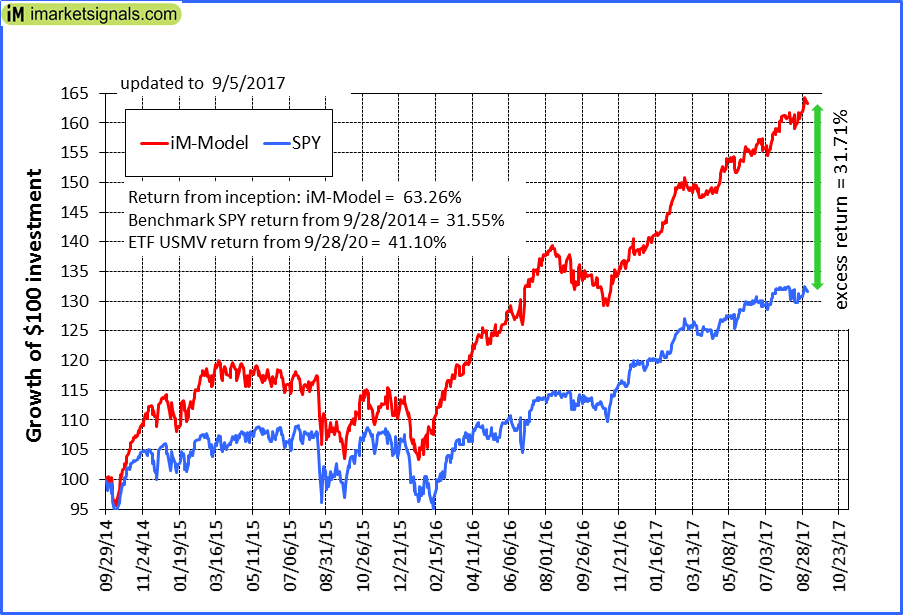 |
iM-Best12(USMV)Q4-Investor: Since inception, on 9/29/2014, the model gained 63.26% while the benchmark SPY gained 31.55% and the ETF USMV gained 41.10% over the same period. Over the previous week the market value of iM-Best12(USMV)Q4 gained 0.83% at a time when SPY gained 0.61%. A starting capital of $100,000 at inception on 9/29/2014 would have grown to $163,263 which includes $269 cash and excludes $869 spent on fees and slippage. |
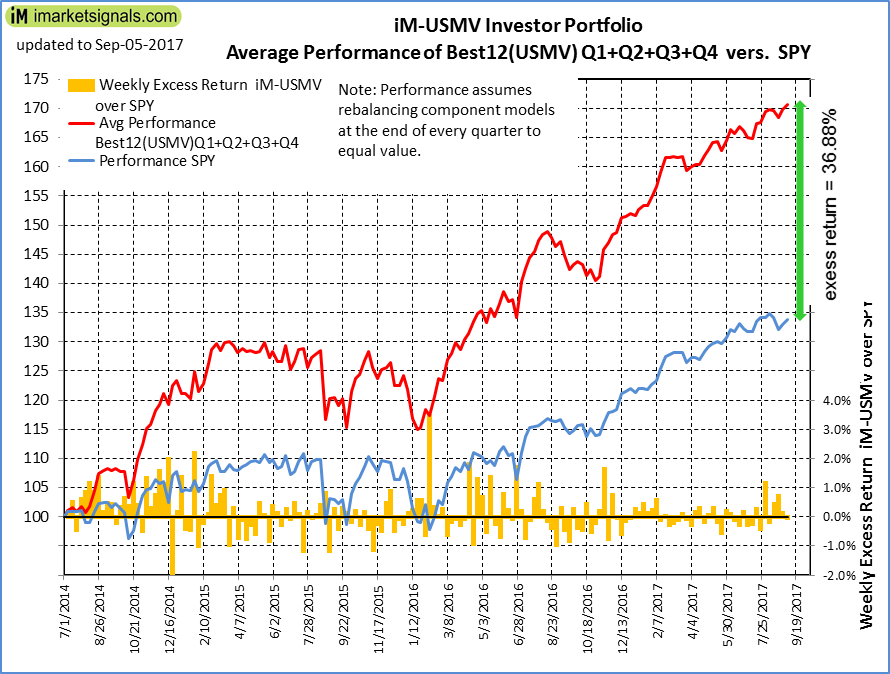 |
Average Performance of iM-Best12(USMV)Q1+Q2+Q3+Q4-Investor resulted in an excess return of 36.88% over SPY. (see iM-USMV Investor Portfolio) |
 |
iM-Best(Short): The model’s out of sample performance YTD is 4.4%, and for the last 12 months is 8.8%. Over the same period the benchmark SPY performance was 11.1% and 15.0% respectively. Over the previous week the market value of iM-Best(Short) gained -0.03% at a time when SPY gained 0.61%. Over the period 1/2/2009 to 9/5/2017 the starting capital of $100,000 would have grown to $101,057 which includes $141,528 cash and excludes $22,479 spent on fees and slippage. |
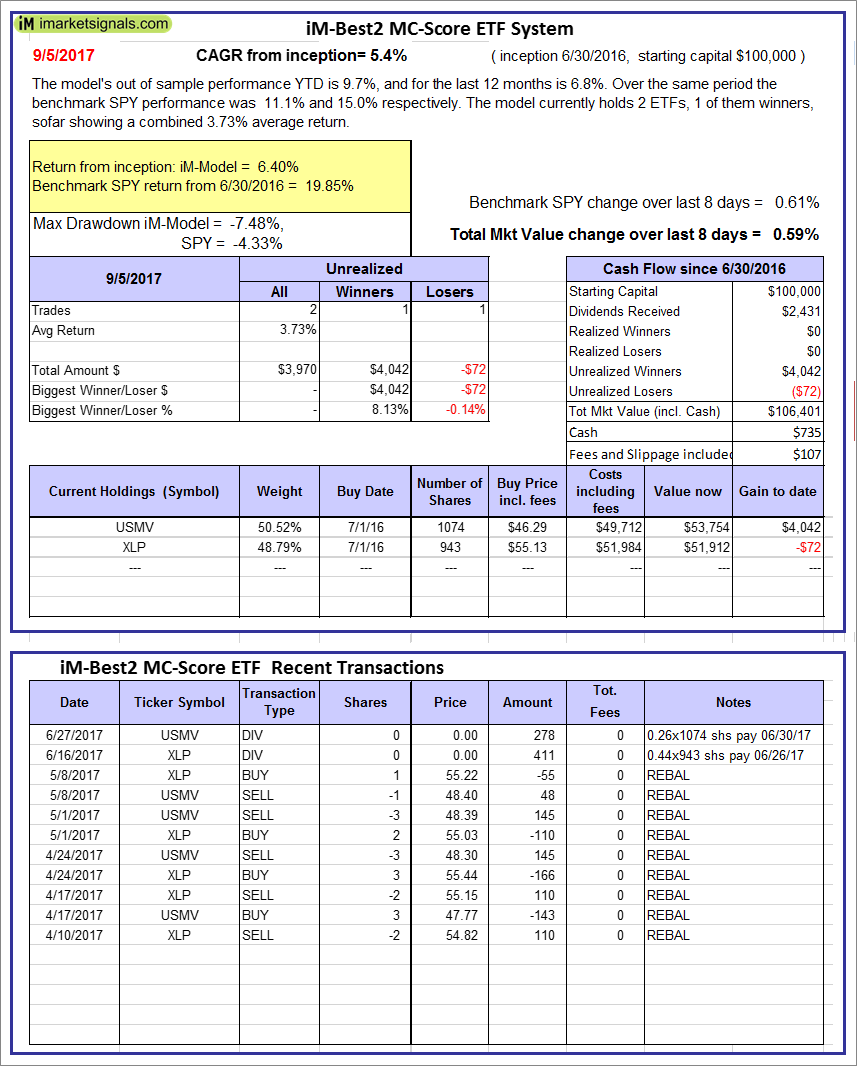 |
iM-Best2 MC-Score ETF System: The model’s out of sample performance YTD is 9.7%, and for the last 12 months is 6.8%. Over the same period the benchmark SPY performance was 11.1% and 15.0% respectively. Over the previous week the market value of the iM-Best2 MC-Score ETF System gained 0.59% at a time when SPY gained 0.61%. A starting capital of $100,000 at inception on 6/30/2016 would have grown to $106,401 which includes $735 cash and excludes $107 spent on fees and slippage. |
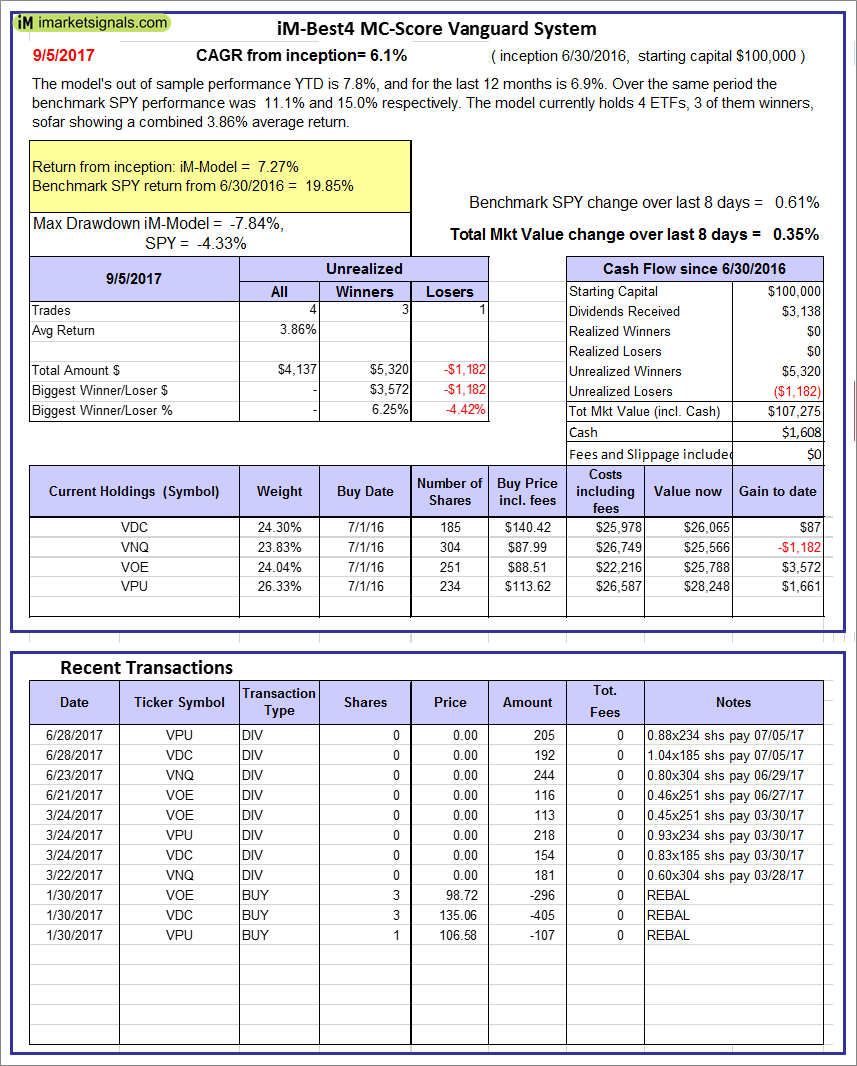 |
iM-Best4 MC-Score Vanguard System: The model’s out of sample performance YTD is 7.8%, and for the last 12 months is 6.9%. Over the same period the benchmark SPY performance was 11.1% and 15.0% respectively. Over the previous week the market value of the iM-Best4 MC-Score Vanguard System gained 0.35% at a time when SPY gained 0.61%. A starting capital of $100,000 at inception on 6/30/2016 would have grown to $107,275 which includes $1,608 cash and excludes $00 spent on fees and slippage. |
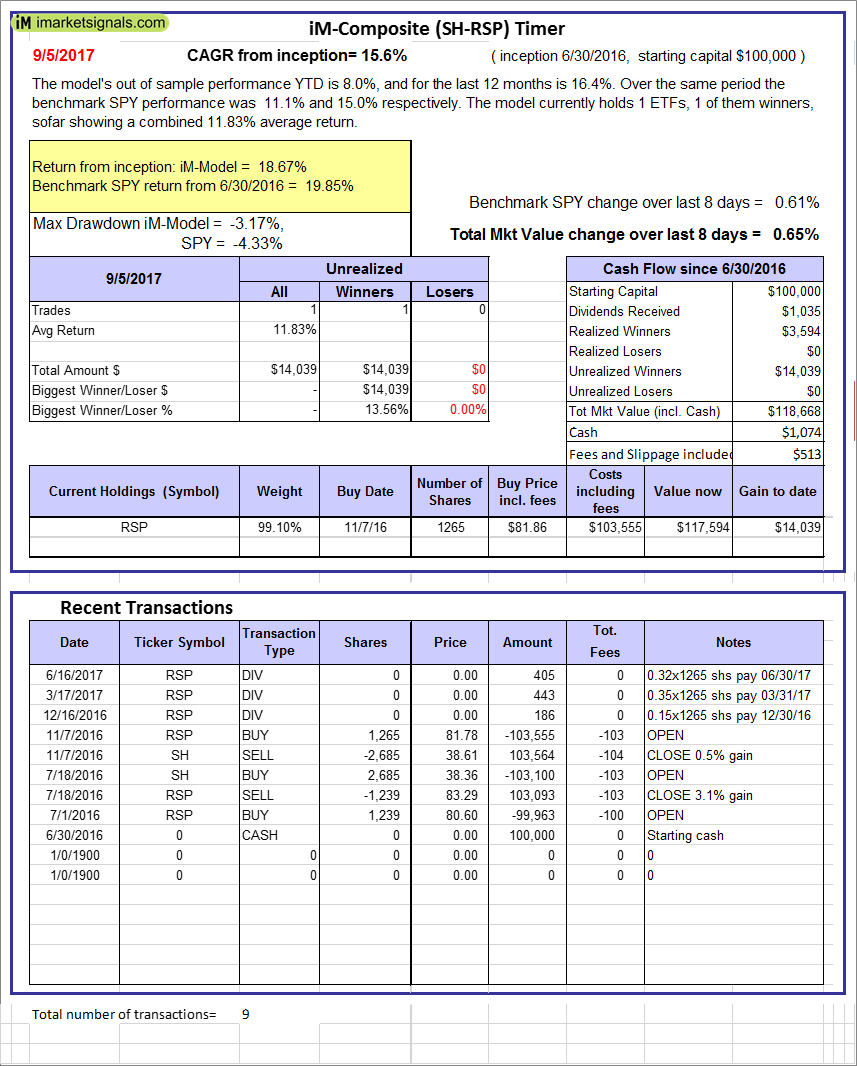 |
iM-Composite (SH-RSP) Timer: The model’s out of sample performance YTD is 8.0%, and for the last 12 months is 16.4%. Over the same period the benchmark SPY performance was 11.1% and 15.0% respectively. Over the previous week the market value of the iM-Composite (SH-RSP) Timer gained 0.65% at a time when SPY gained 0.61%. A starting capital of $100,000 at inception on 6/30/2016 would have grown to $118,668 which includes $1,074 cash and excludes $513 spent on fees and slippage. |
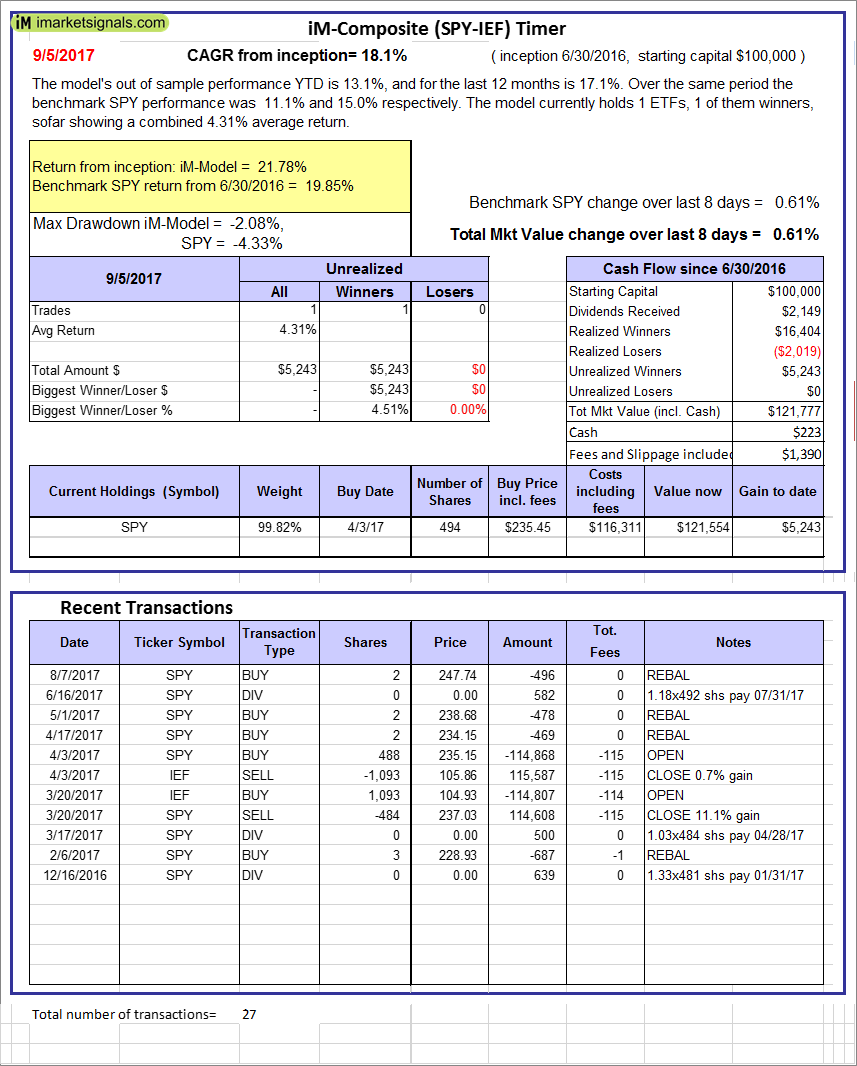 |
iM-Composite (SPY-IEF) Timer: The model’s out of sample performance YTD is 13.1%, and for the last 12 months is 17.1%. Over the same period the benchmark SPY performance was 11.1% and 15.0% respectively. Over the previous week the market value of the iM-Composite (SPY-IEF) Timer gained 0.61% at a time when SPY gained 0.61%. A starting capital of $100,000 at inception on 6/30/2016 would have grown to $121,777 which includes $223 cash and excludes $1,390 spent on fees and slippage. |
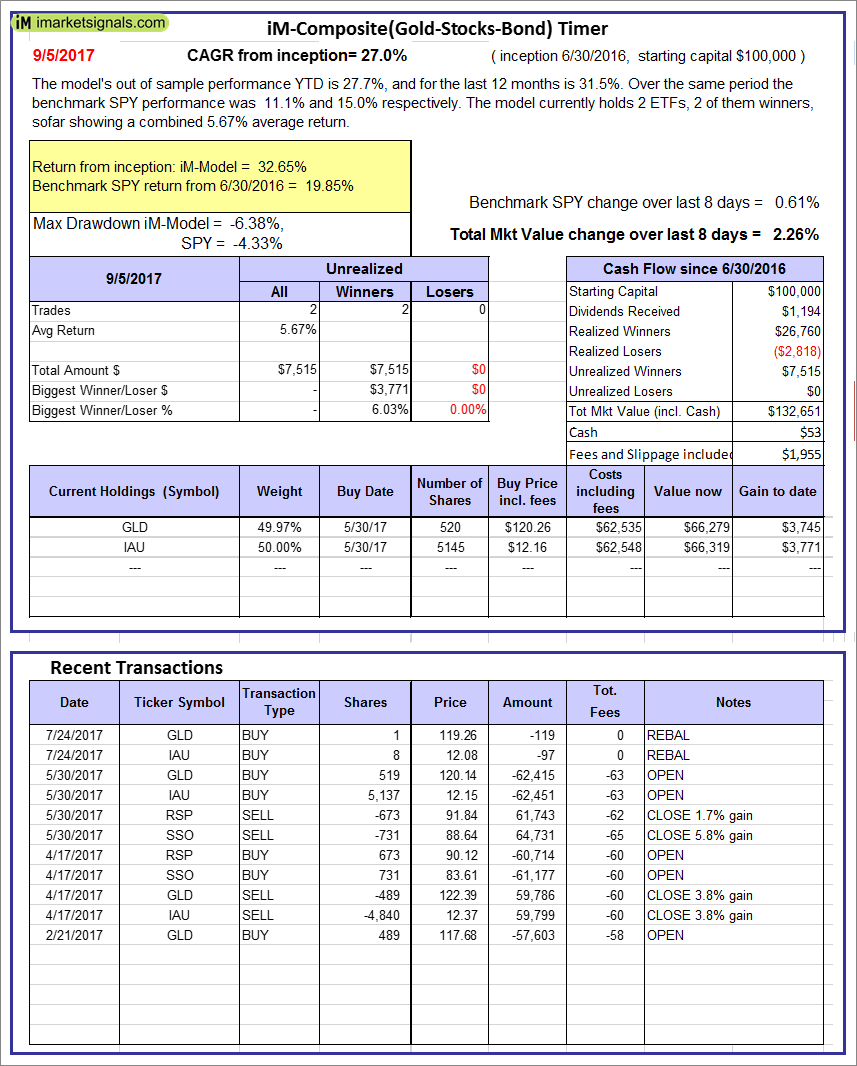 |
iM-Composite(Gold-Stocks-Bond) Timer: The model’s out of sample performance YTD is 27.7%, and for the last 12 months is 31.5%. Over the same period the benchmark SPY performance was 11.1% and 15.0% respectively. Over the previous week the market value of the iM-Composite(Gold-Stocks-Bond) Timer gained 2.26% at a time when SPY gained 0.61%. A starting capital of $100,000 at inception on 6/30/2016 would have grown to $132,651 which includes $53 cash and excludes $1,955 spent on fees and slippage. |
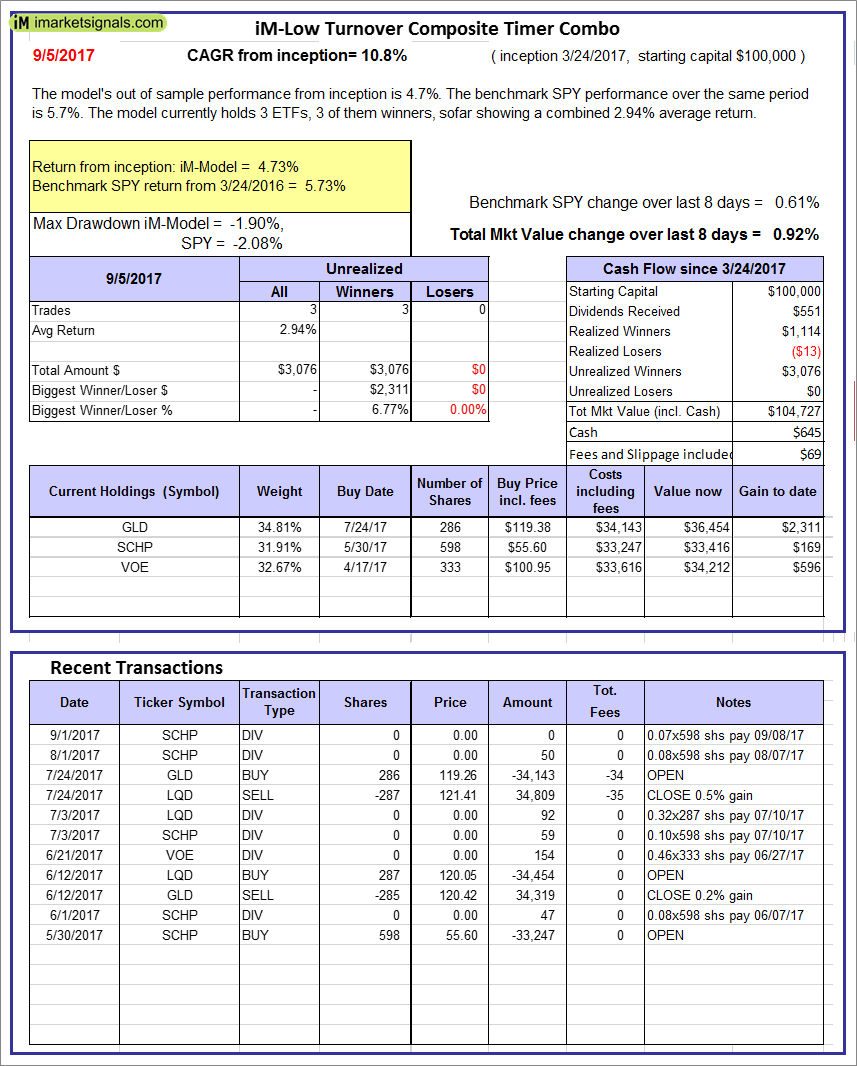 |
iM-Low Turnover Composite Timer Combo: The model’s out of sample performance from inception is 4.7%. The benchmark SPY performance over the same period is 5.7%. Over the previous week the market value of the iM-Low Turnover Composite Timer Combo gained 0.92% at a time when SPY gained 0.61%. A starting capital of $100,000 at inception on 3/24/27 would have grown to $104,727 which includes $645 cash and excludes $69 spent on fees and slippage. |
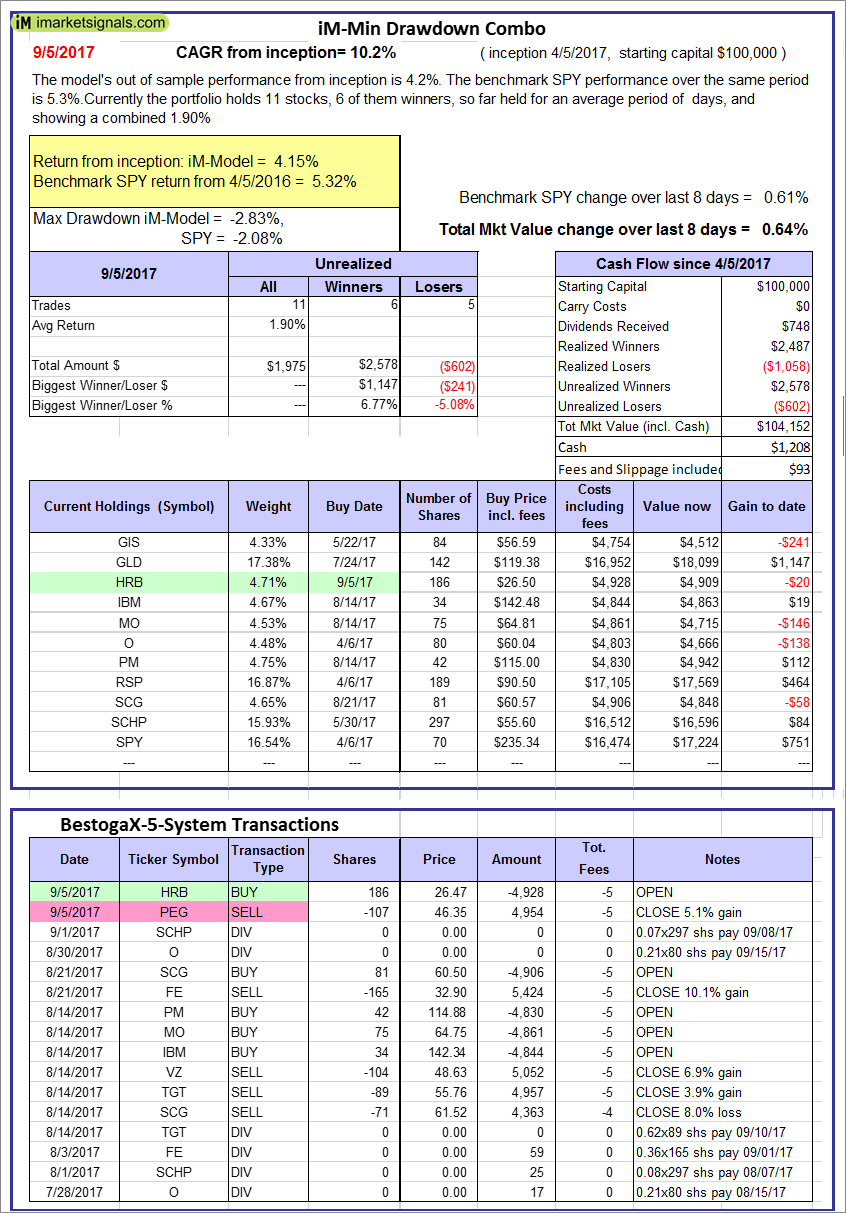 |
iM-Min Drawdown Combo: The model’s out of sample performance from inception is 4.2%. The benchmark SPY performance over the same period is 5.3%. Over the previous week the market value of the iM-Min Drawdown Combo gained 0.64% at a time when SPY gained 0.61%. A starting capital of $100,000 at inception on 4/5/2017 would have grown to $104,152 which includes $1,208 cash and excludes $93 spent on fees and slippage. |
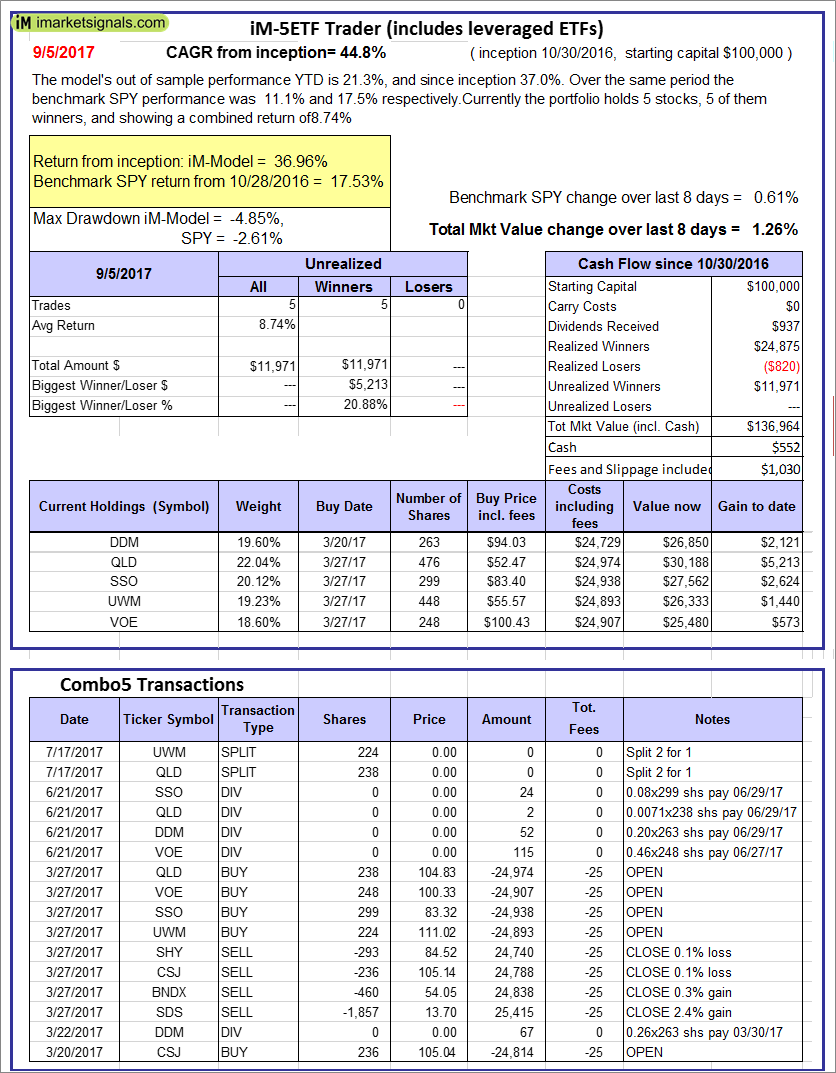 |
iM-5ETF Trader (includes leveraged ETFs): The model’s out of sample performance YTD is 11.2%, and since inception 14.3%. Over the same period the benchmark SPY performance was 11.1% and 17.5% respectively. Over the previous week the market value of the iM-5ETF Trader (includes leveraged ETFs) gained 1.26% at a time when SPY gained 0.61%. A starting capital of $100,000 at inception on 10/30/2016 would have grown to $136,964 which includes $552 cash and excludes $1,030 spent on fees and slippage. |
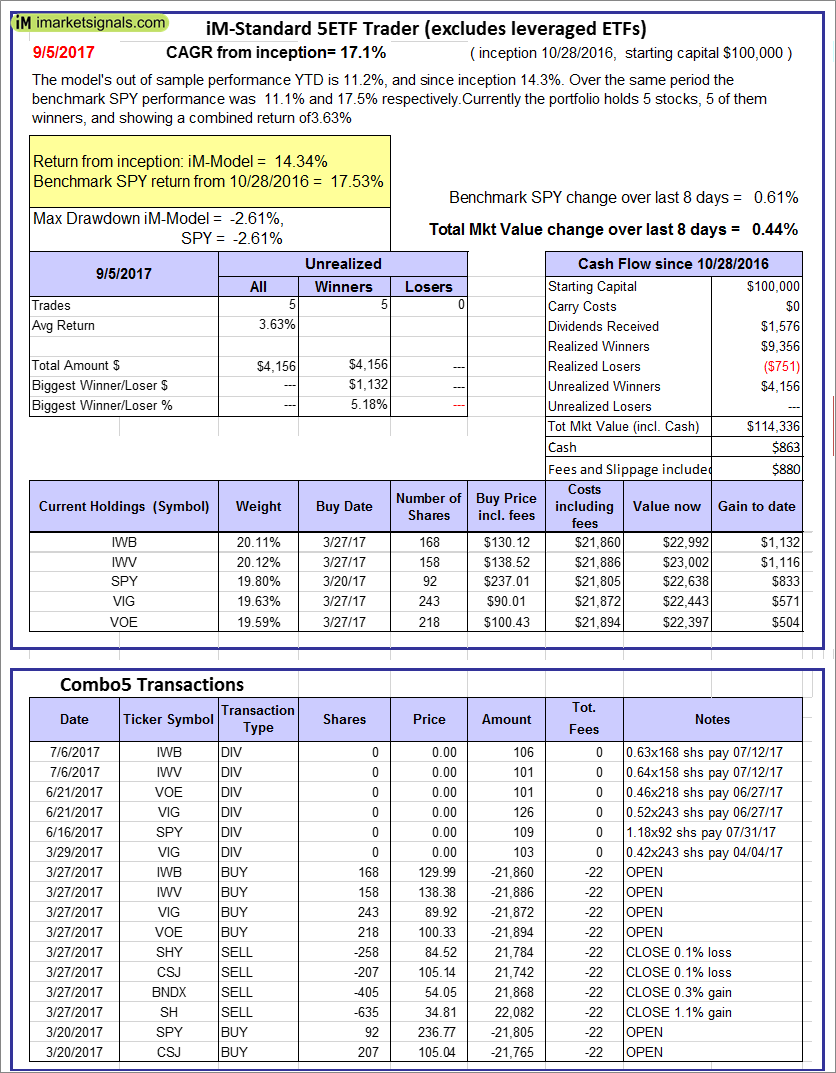 |
iM-Standard 5ETF Trader (excludes leveraged ETFs): The model’s out of sample performance YTD is 11.2%, and since inception 14.3%. Over the same period the benchmark SPY performance was 11.1% and 17.5% respectively. Over the previous week the market value of the iM-Standard 5ETF Trader (excludes leveraged ETFs) gained 0.44% at a time when SPY gained 0.61%. A starting capital of $100,000 at inception on 10/30/2016 would have grown to $114,336 which includes $863 cash and excludes $880 spent on fees and slippage. |
iM-Best Reports – 9/5/2017
Posted in pmp SPY-SH
Leave a Reply
You must be logged in to post a comment.