
  |
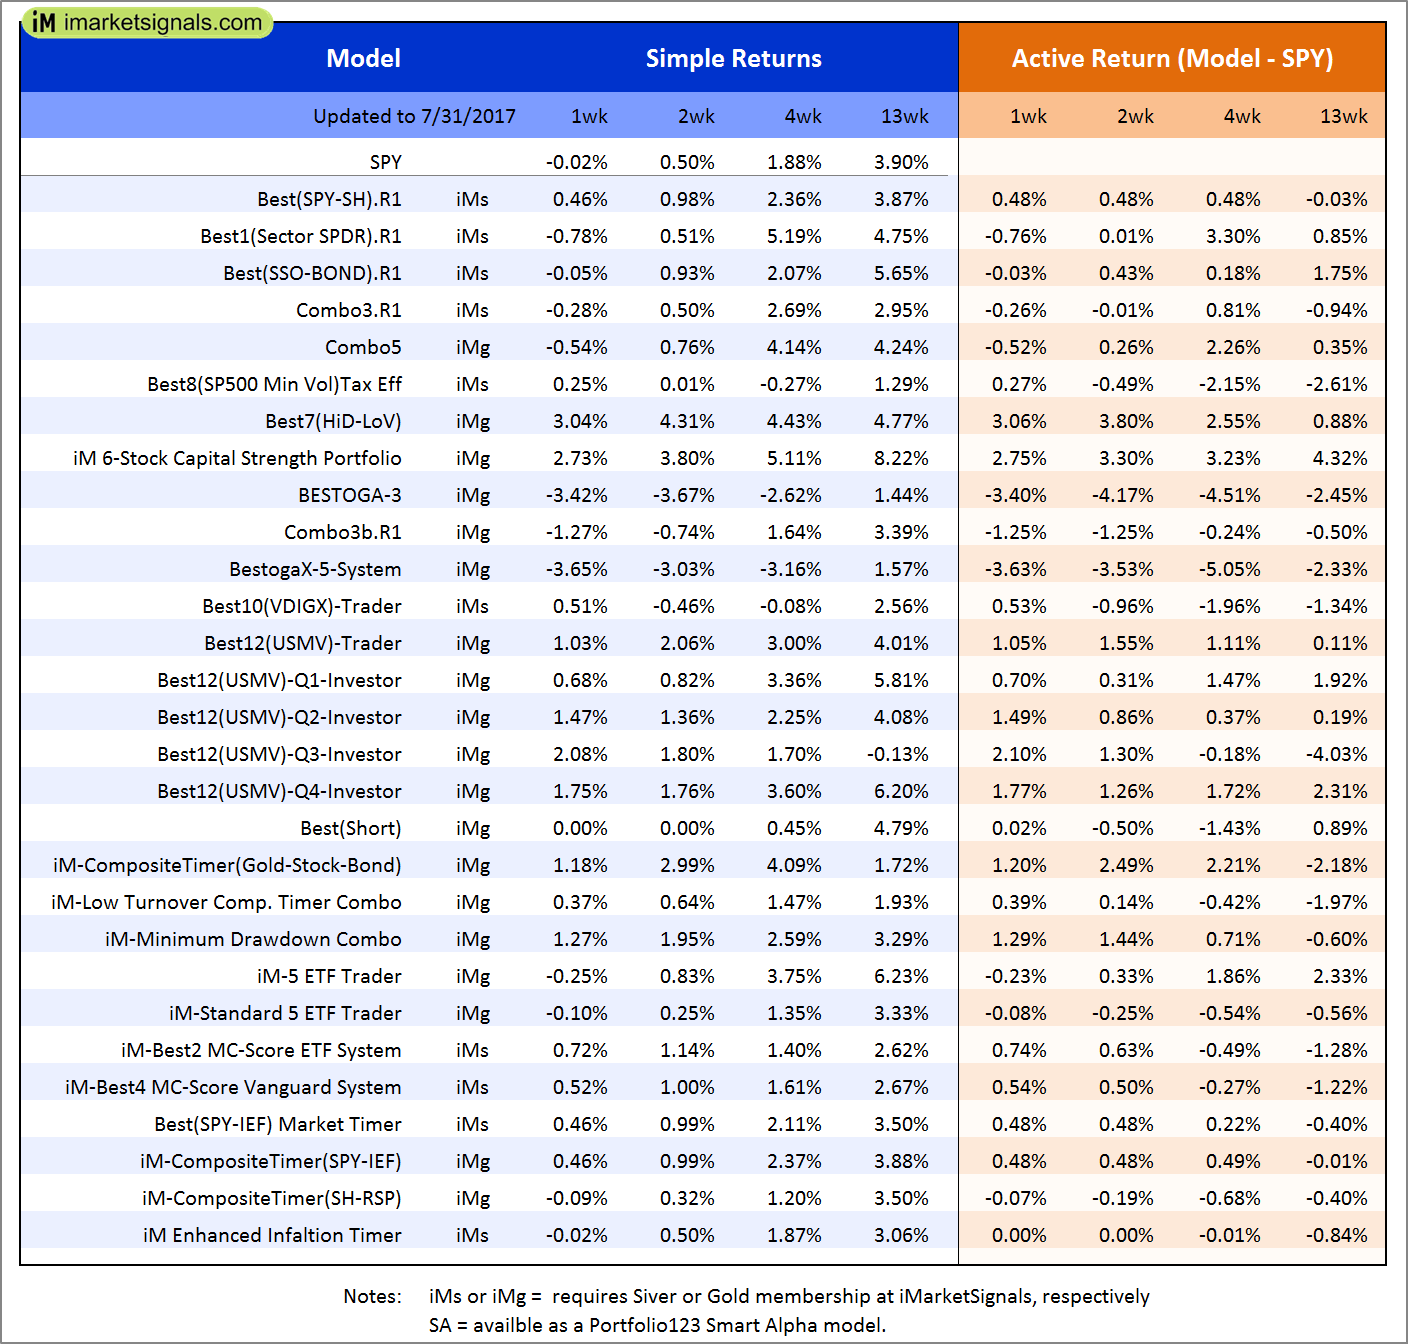
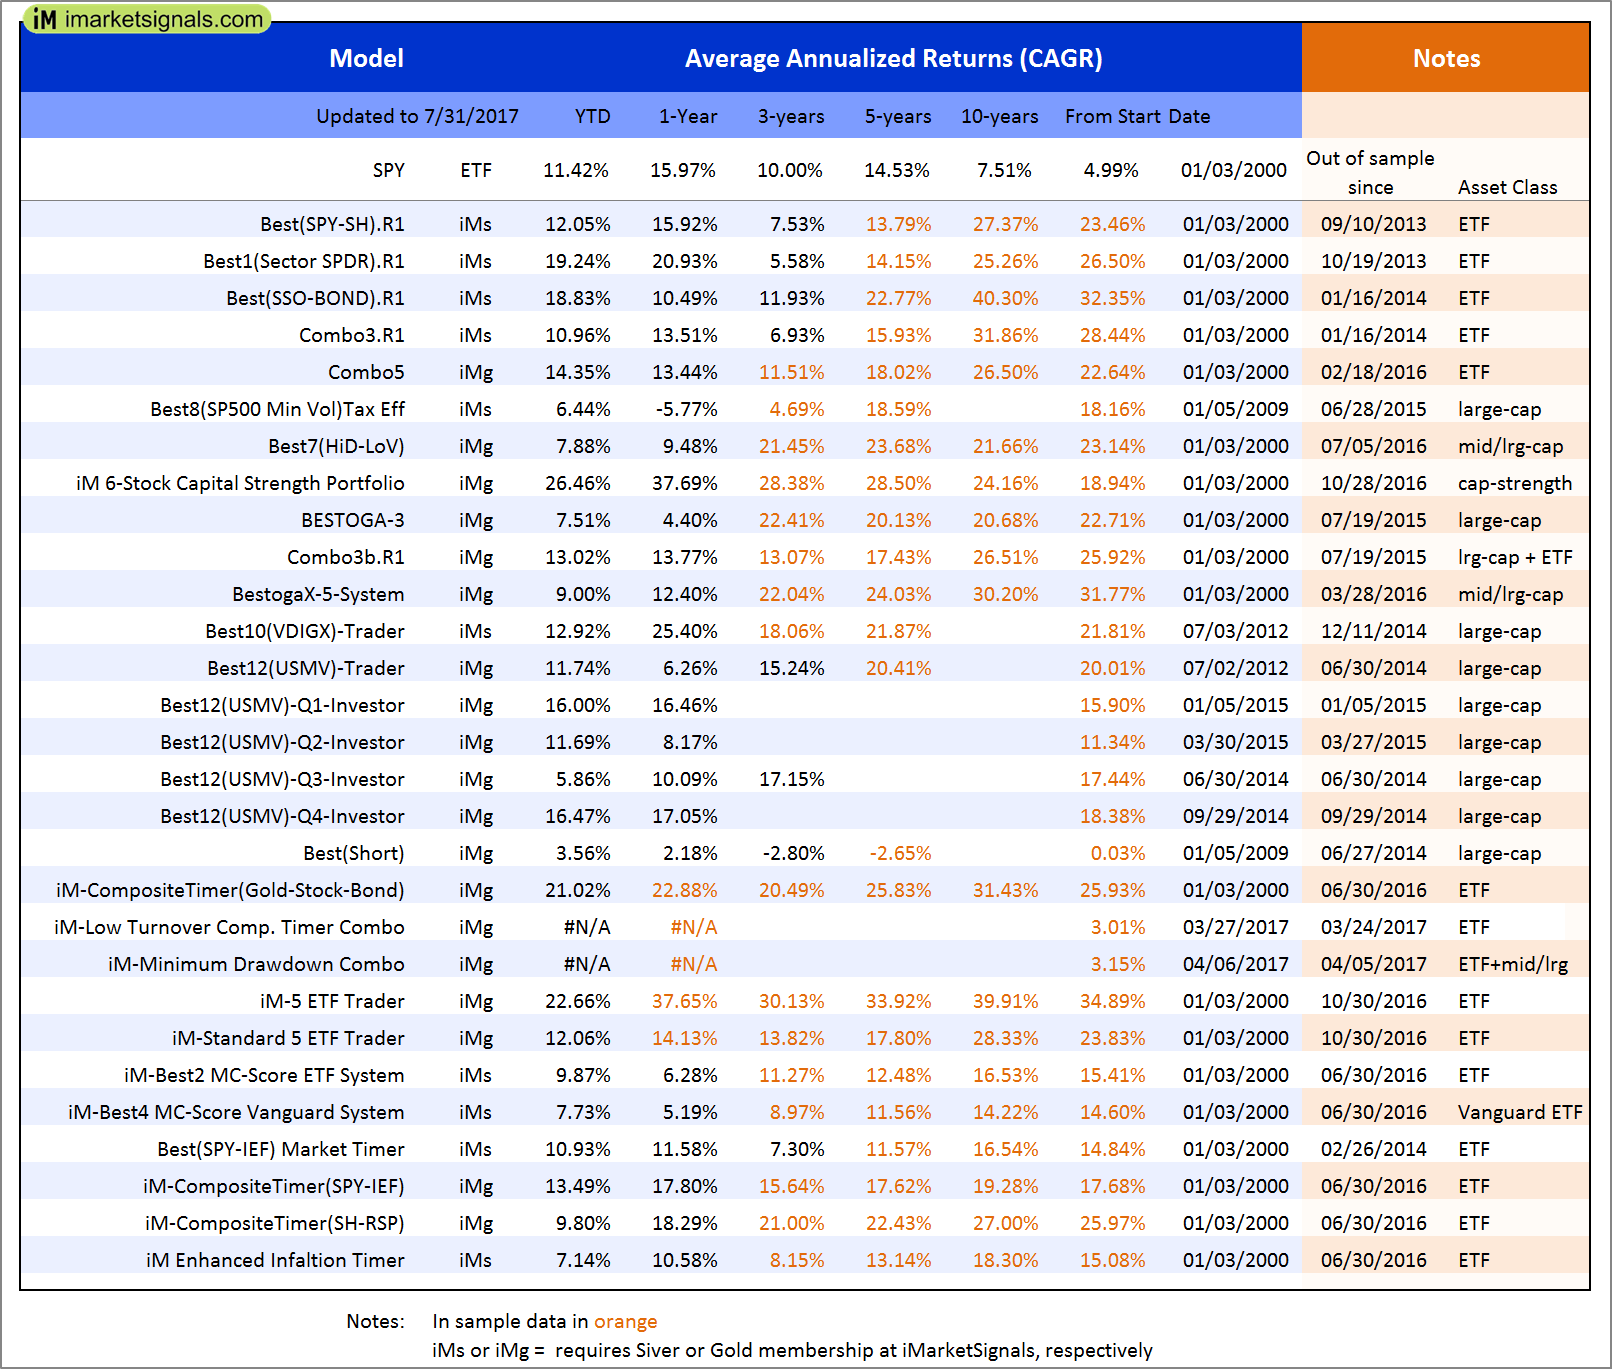
Out of sample performance summary of our models for the past 1, 2, 4 and 13 week periods. The active active return indicates how the models over- or underperformed the benchmark ETF SPY. Also the YTD, and the 1-, 3-, 5- and 10-year annualized returns are shown in the second table |
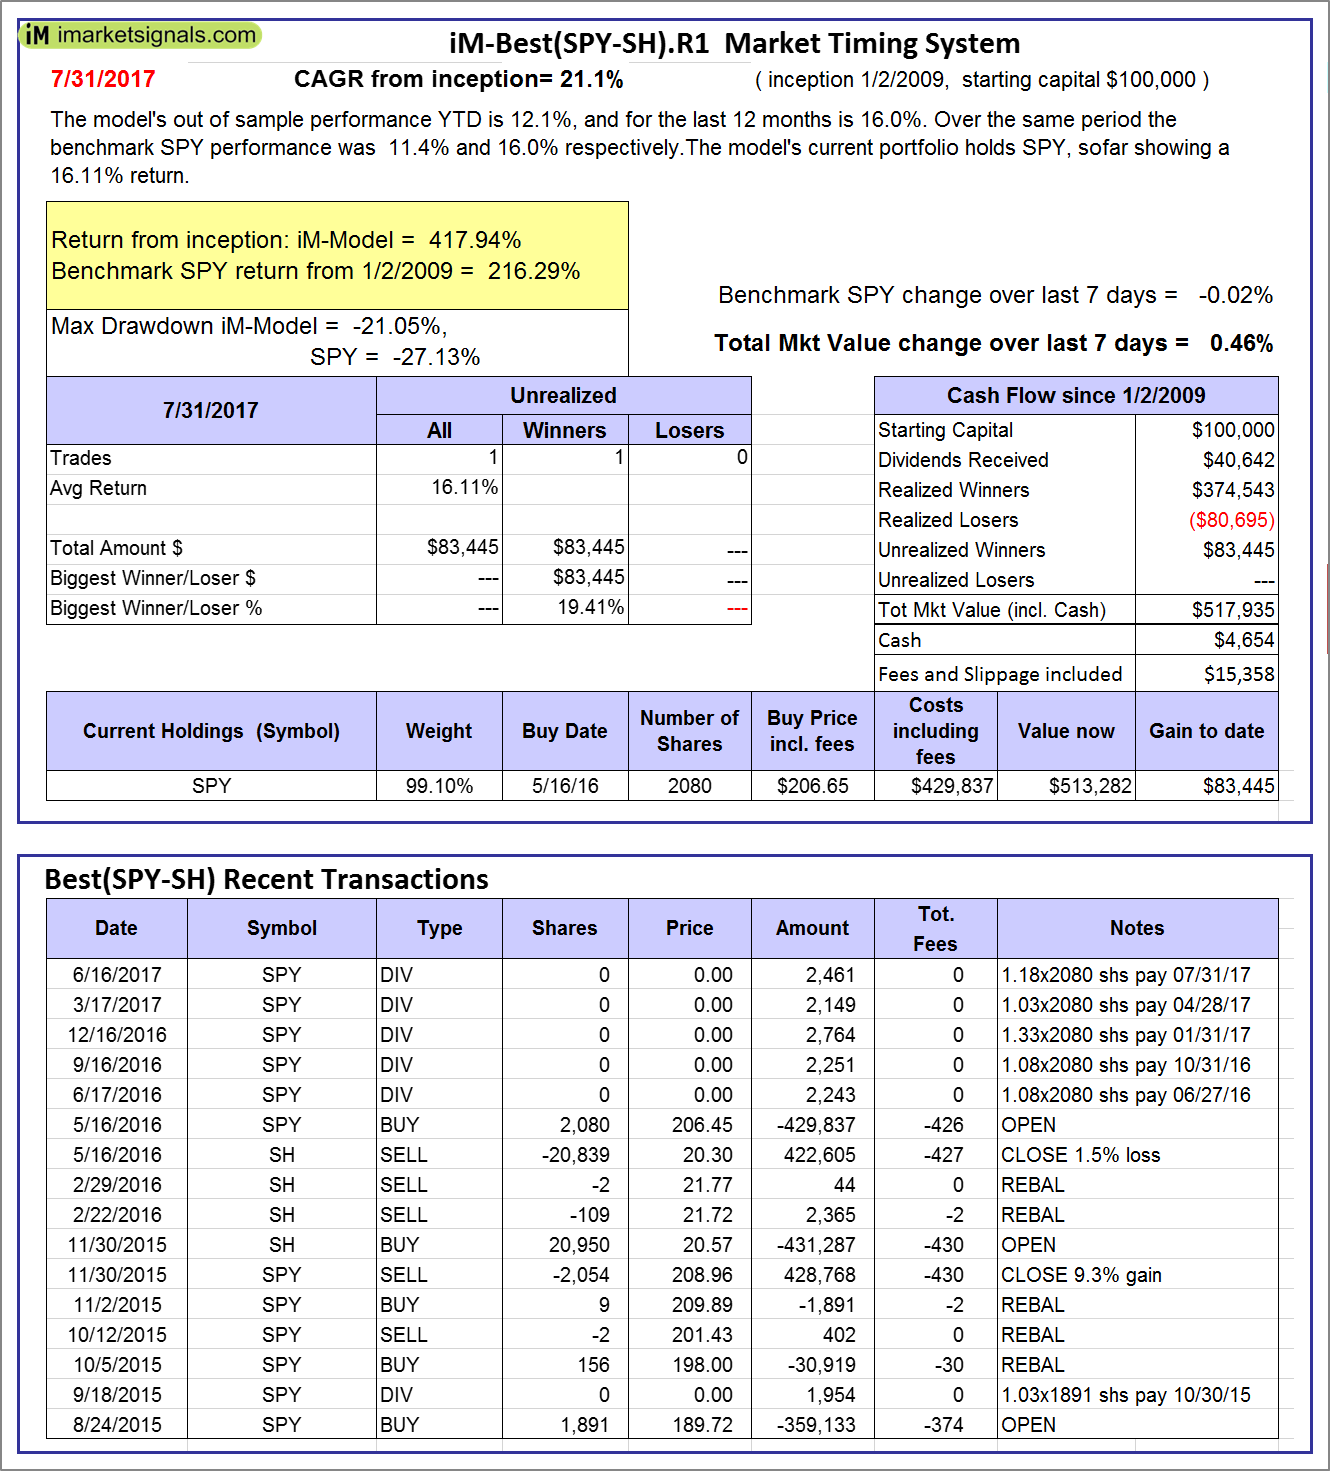 |
iM-Best(SPY-SH).R1: The model’s out of sample performance YTD is 12.1%, and for the last 12 months is 16.0%. Over the same period the benchmark SPY performance was 11.4% and 16.0% respectively. Over the previous week the market value of Best(SPY-SH) gained 0.46% at a time when SPY gained -0.02%. A starting capital of $100,000 at inception on 1/2/2009 would have grown to $517,935 which includes $4,654 cash and excludes $15,358 spent on fees and slippage. |
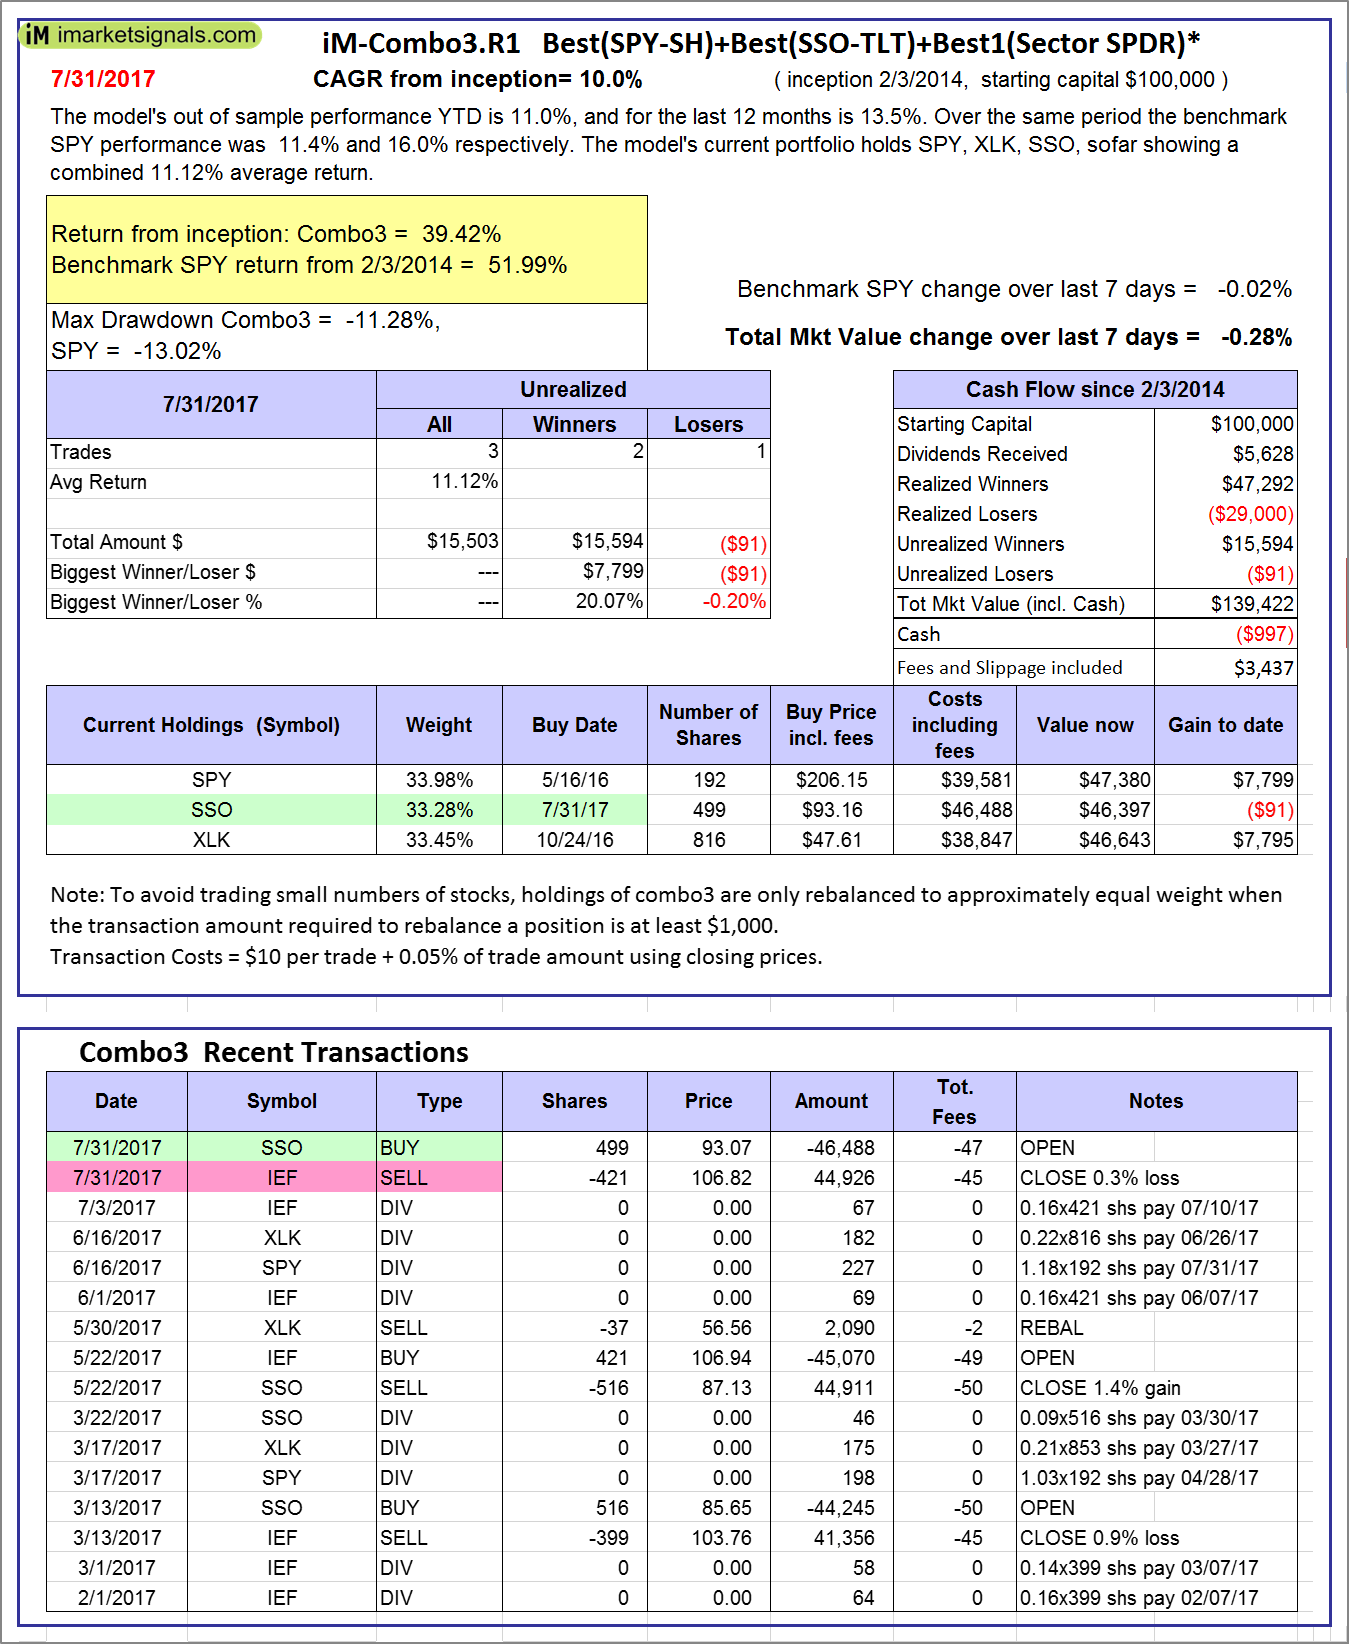 |
iM-Combo3.R1: The model’s out of sample performance YTD is 11.0%, and for the last 12 months is 13.5%. Over the same period the benchmark SPY performance was 11.4% and 16.0% respectively. Over the previous week the market value of iM-Combo3.R1 gained -0.28% at a time when SPY gained -0.02%. A starting capital of $100,000 at inception on 2/3/2014 would have grown to $139,422 which includes -$997 cash and excludes $3,437 spent on fees and slippage. |
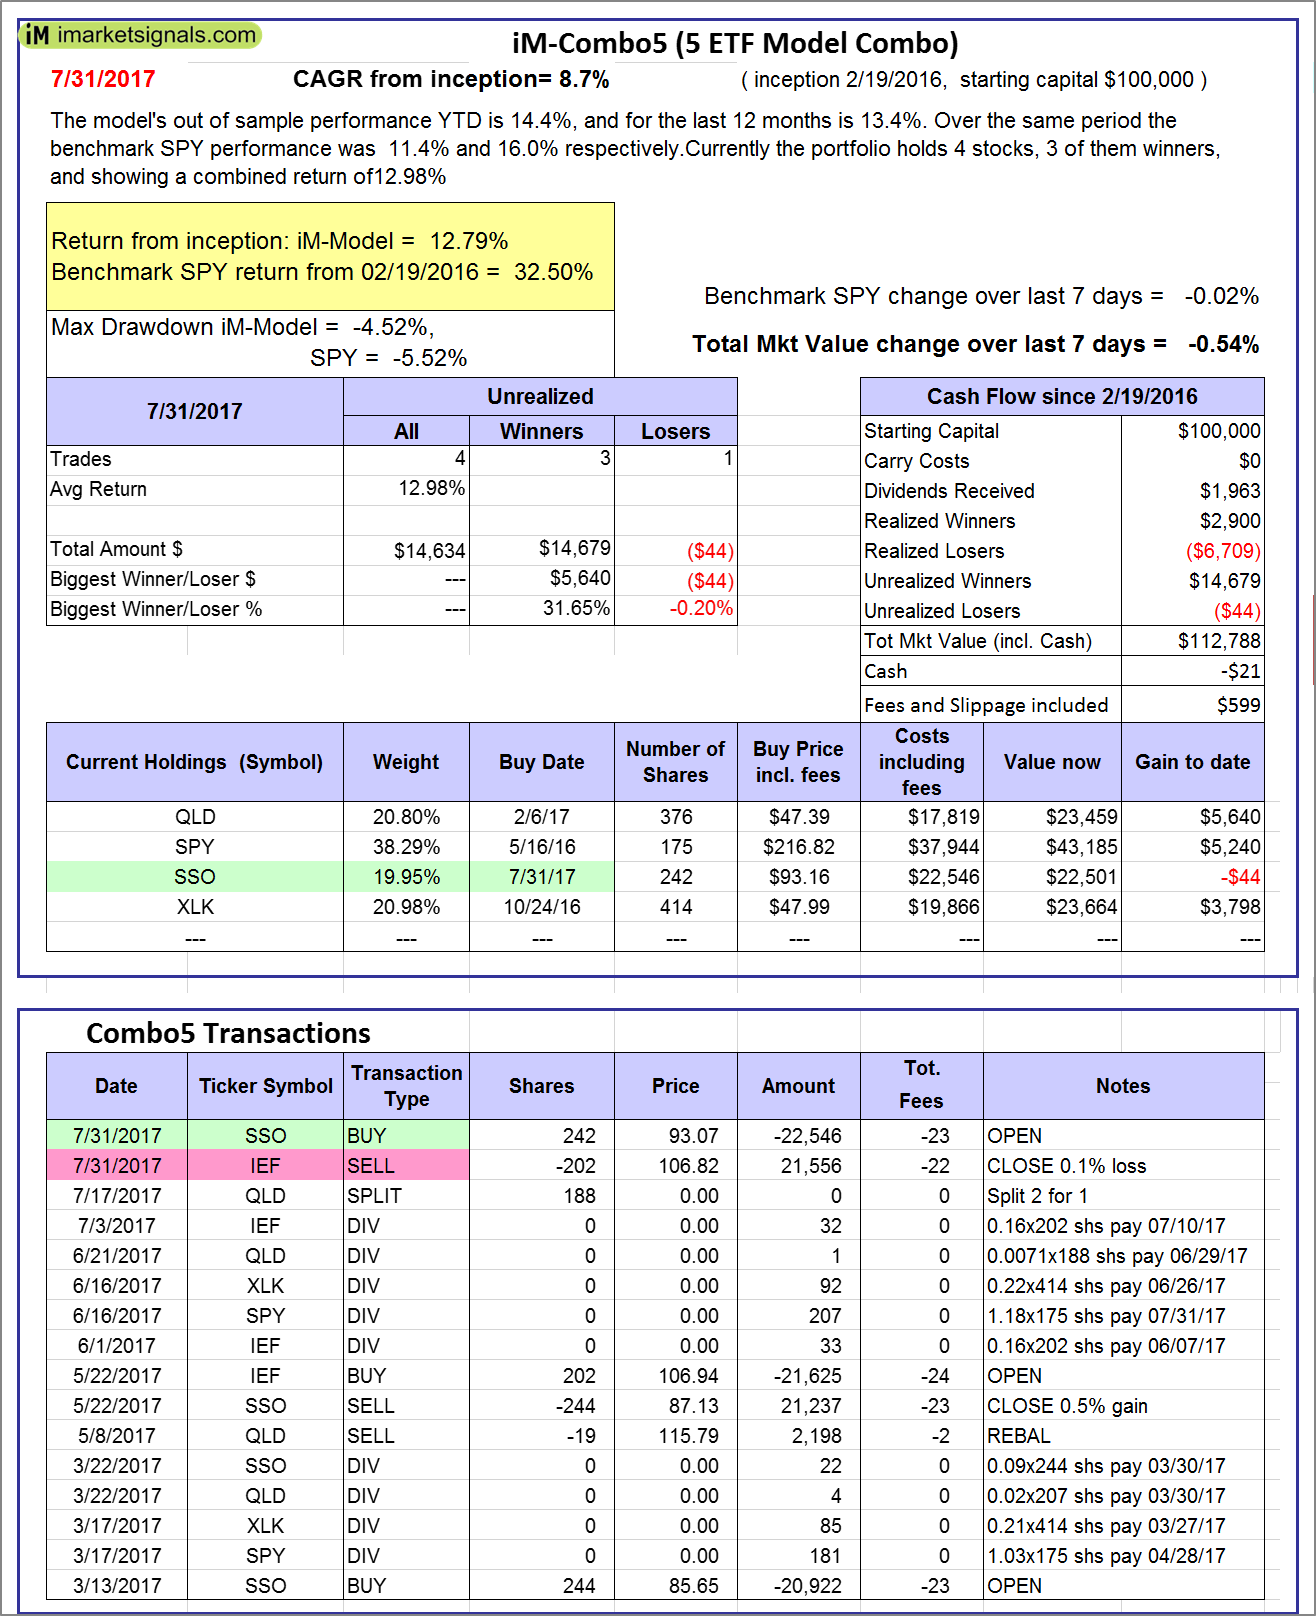 |
iM-Combo5: The model’s out of sample performance YTD is 14.4%, and for the last 12 months is 13.4%. Over the same period the benchmark SPY performance was 11.4% and 16.0% respectively. Over the previous week the market value of iM-Combo5 gained -0.54% at a time when SPY gained -0.02%. A starting capital of $100,000 at inception on 2/22/2016 would have grown to $112,788 which includes -$21 cash and excludes $599 spent on fees and slippage. |
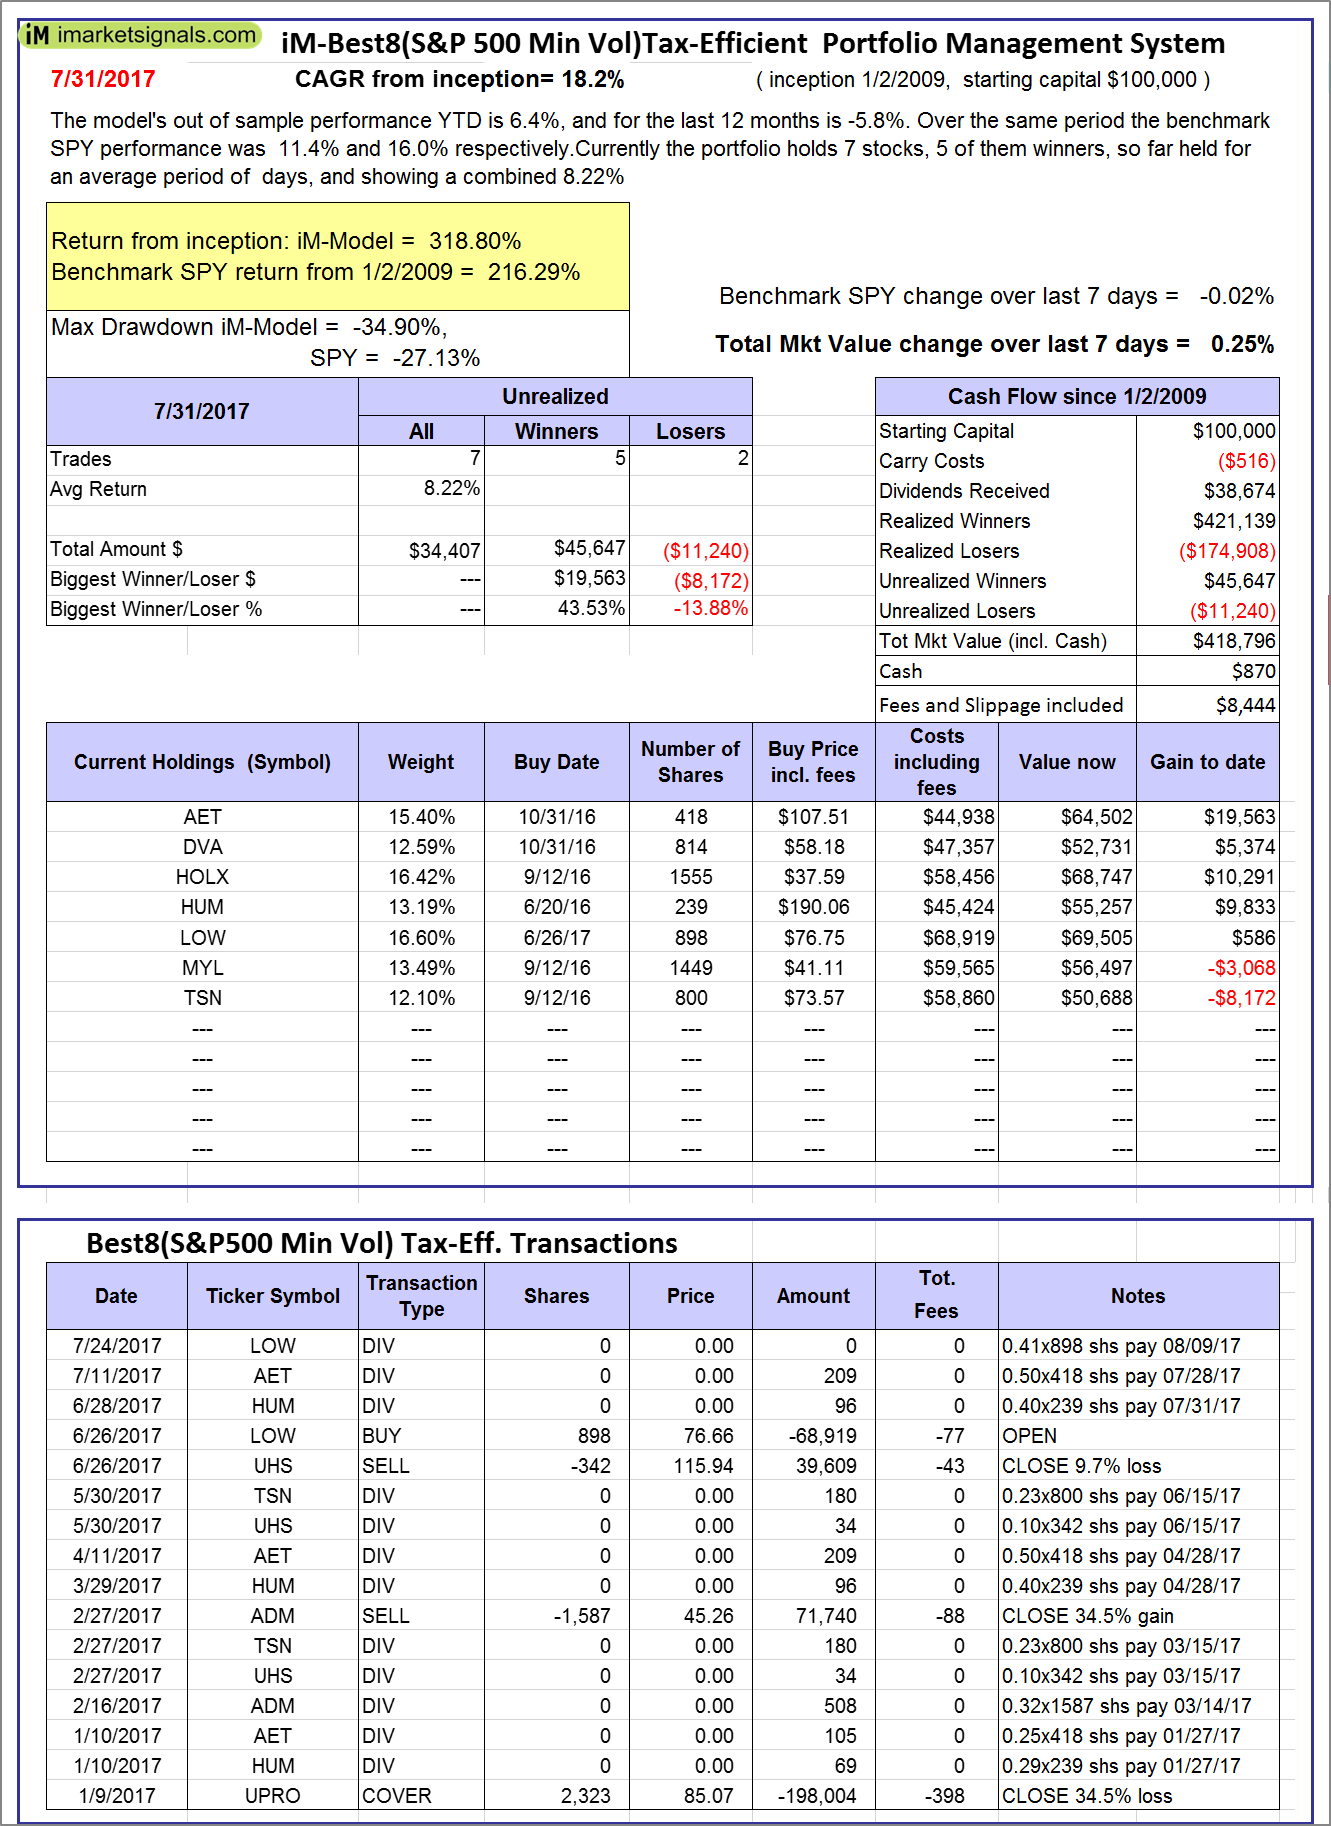 |
The iM-Best8(S&P500 Min Vol)Tax-Efficient The model’s out of sample performance YTD is 6.4%, and for the last 12 months is -5.8%. Over the same period the benchmark SPY performance was 11.4% and 16.0% respectively. Over the previous week the market value of iM-Best8(S&P 500)Tax-Eff. gained 0.25% at a time when SPY gained -0.02%. A starting capital of $100,000 at inception on 1/2/2009 would have grown to $418,796 which includes $870 cash and excludes $8,444 spent on fees and slippage. |
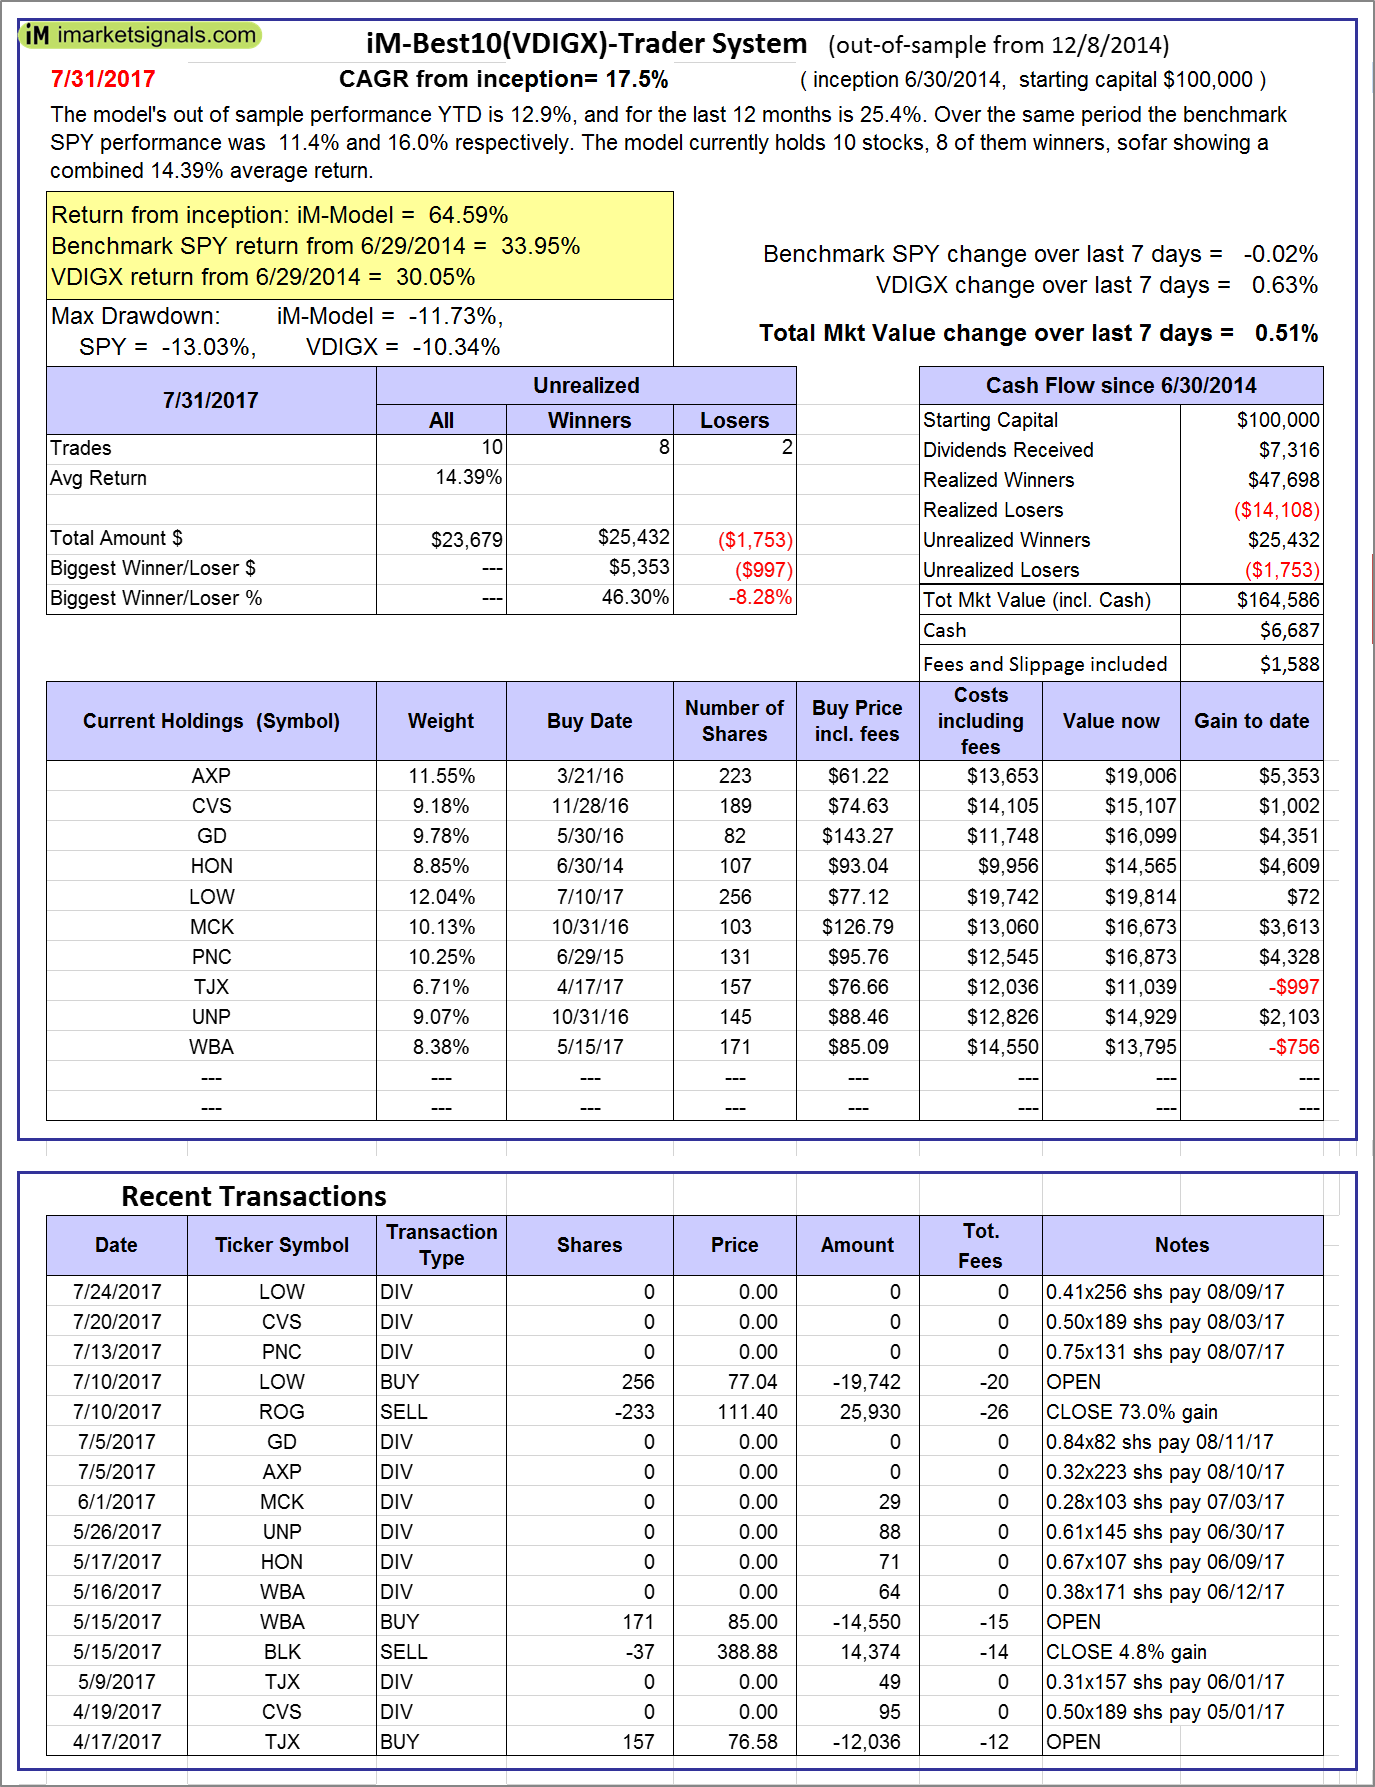 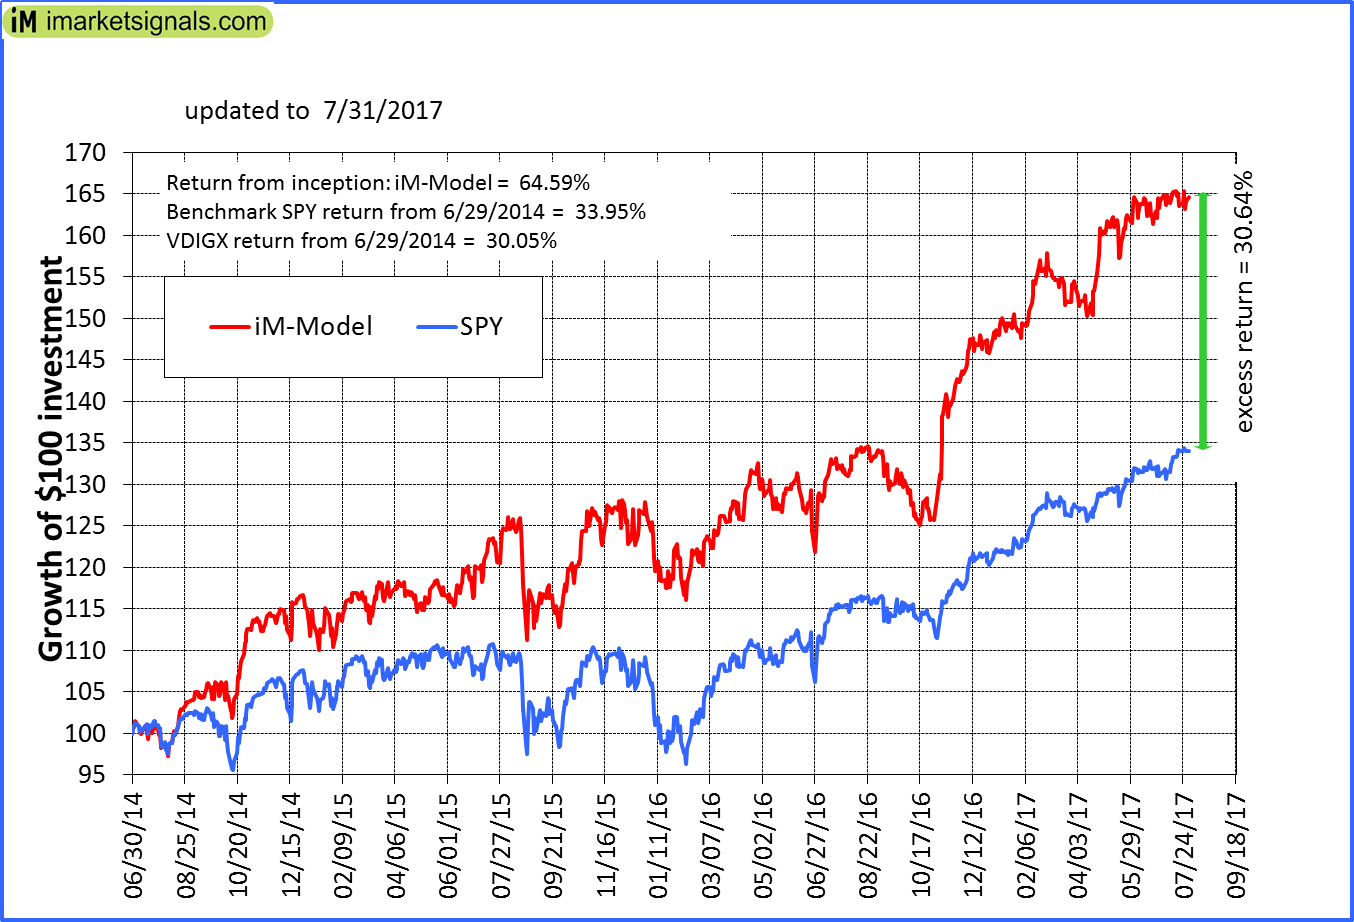 |
iM-Best10(VDIGX)-Trader: The model’s out of sample performance YTD is 12.9%, and for the last 12 months is 25.4%. Over the same period the benchmark SPY performance was 11.4% and 16.0% respectively. Since inception, on 7/1/2014, the model gained 64.59% while the benchmark SPY gained 33.95% and VDIGX gained 30.05% over the same period. Over the previous week the market value of iM-Best10(VDIGX) gained 0.51% at a time when SPY gained -0.02%. A starting capital of $100,000 at inception on 7/1/2014 would have grown to $164,586 which includes $6,687 cash and excludes $1,588 spent on fees and slippage. |
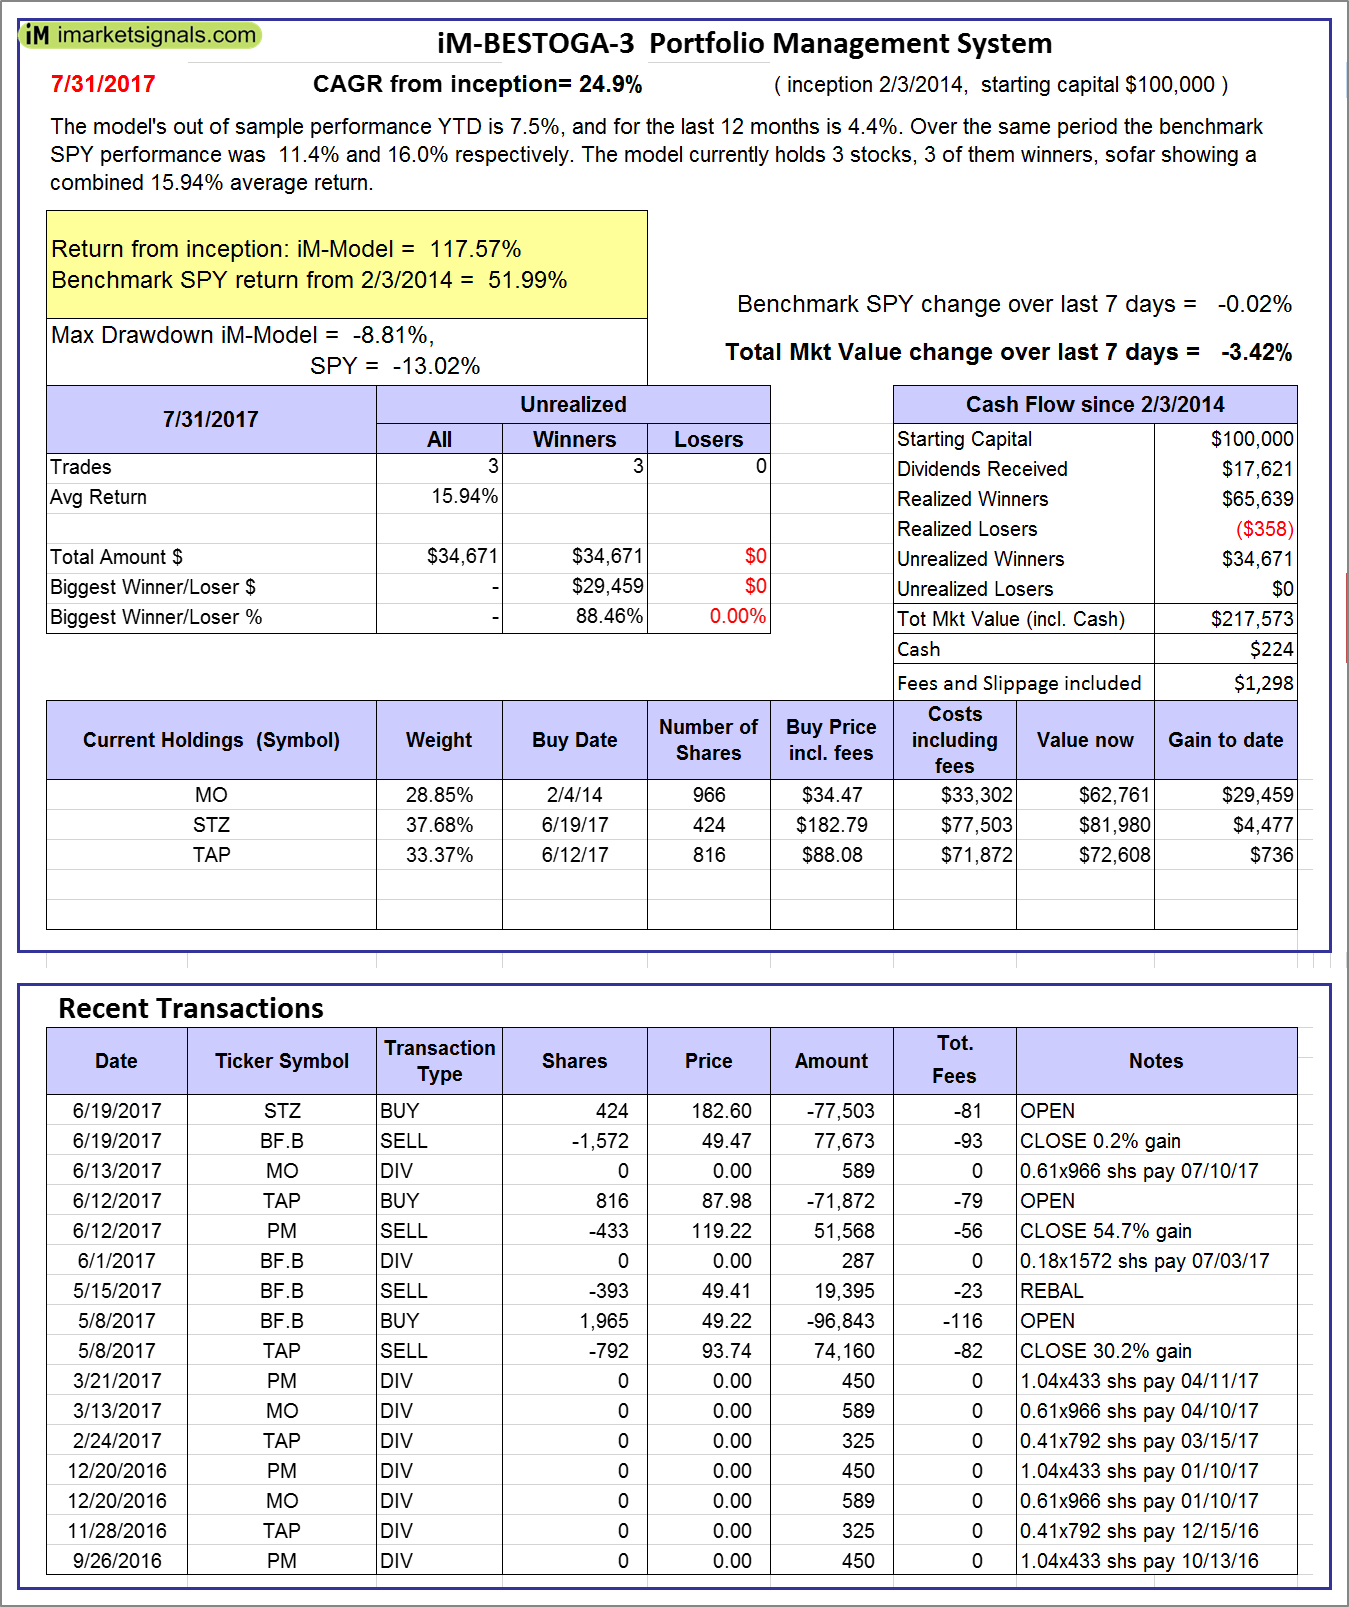 |
iM-BESTOGA-3: The model’s out of sample performance YTD is 7.5%, and for the last 12 months is 4.4%. Over the same period the benchmark SPY performance was 11.4% and 16.0% respectively. Over the previous week the market value of iM-BESTOGA-3 gained -3.42% at a time when SPY gained -0.02%. A starting capital of $100,000 at inception on 2/3/2014 would have grown to $217,573 which includes $224 cash and excludes $1,298 spent on fees and slippage. |
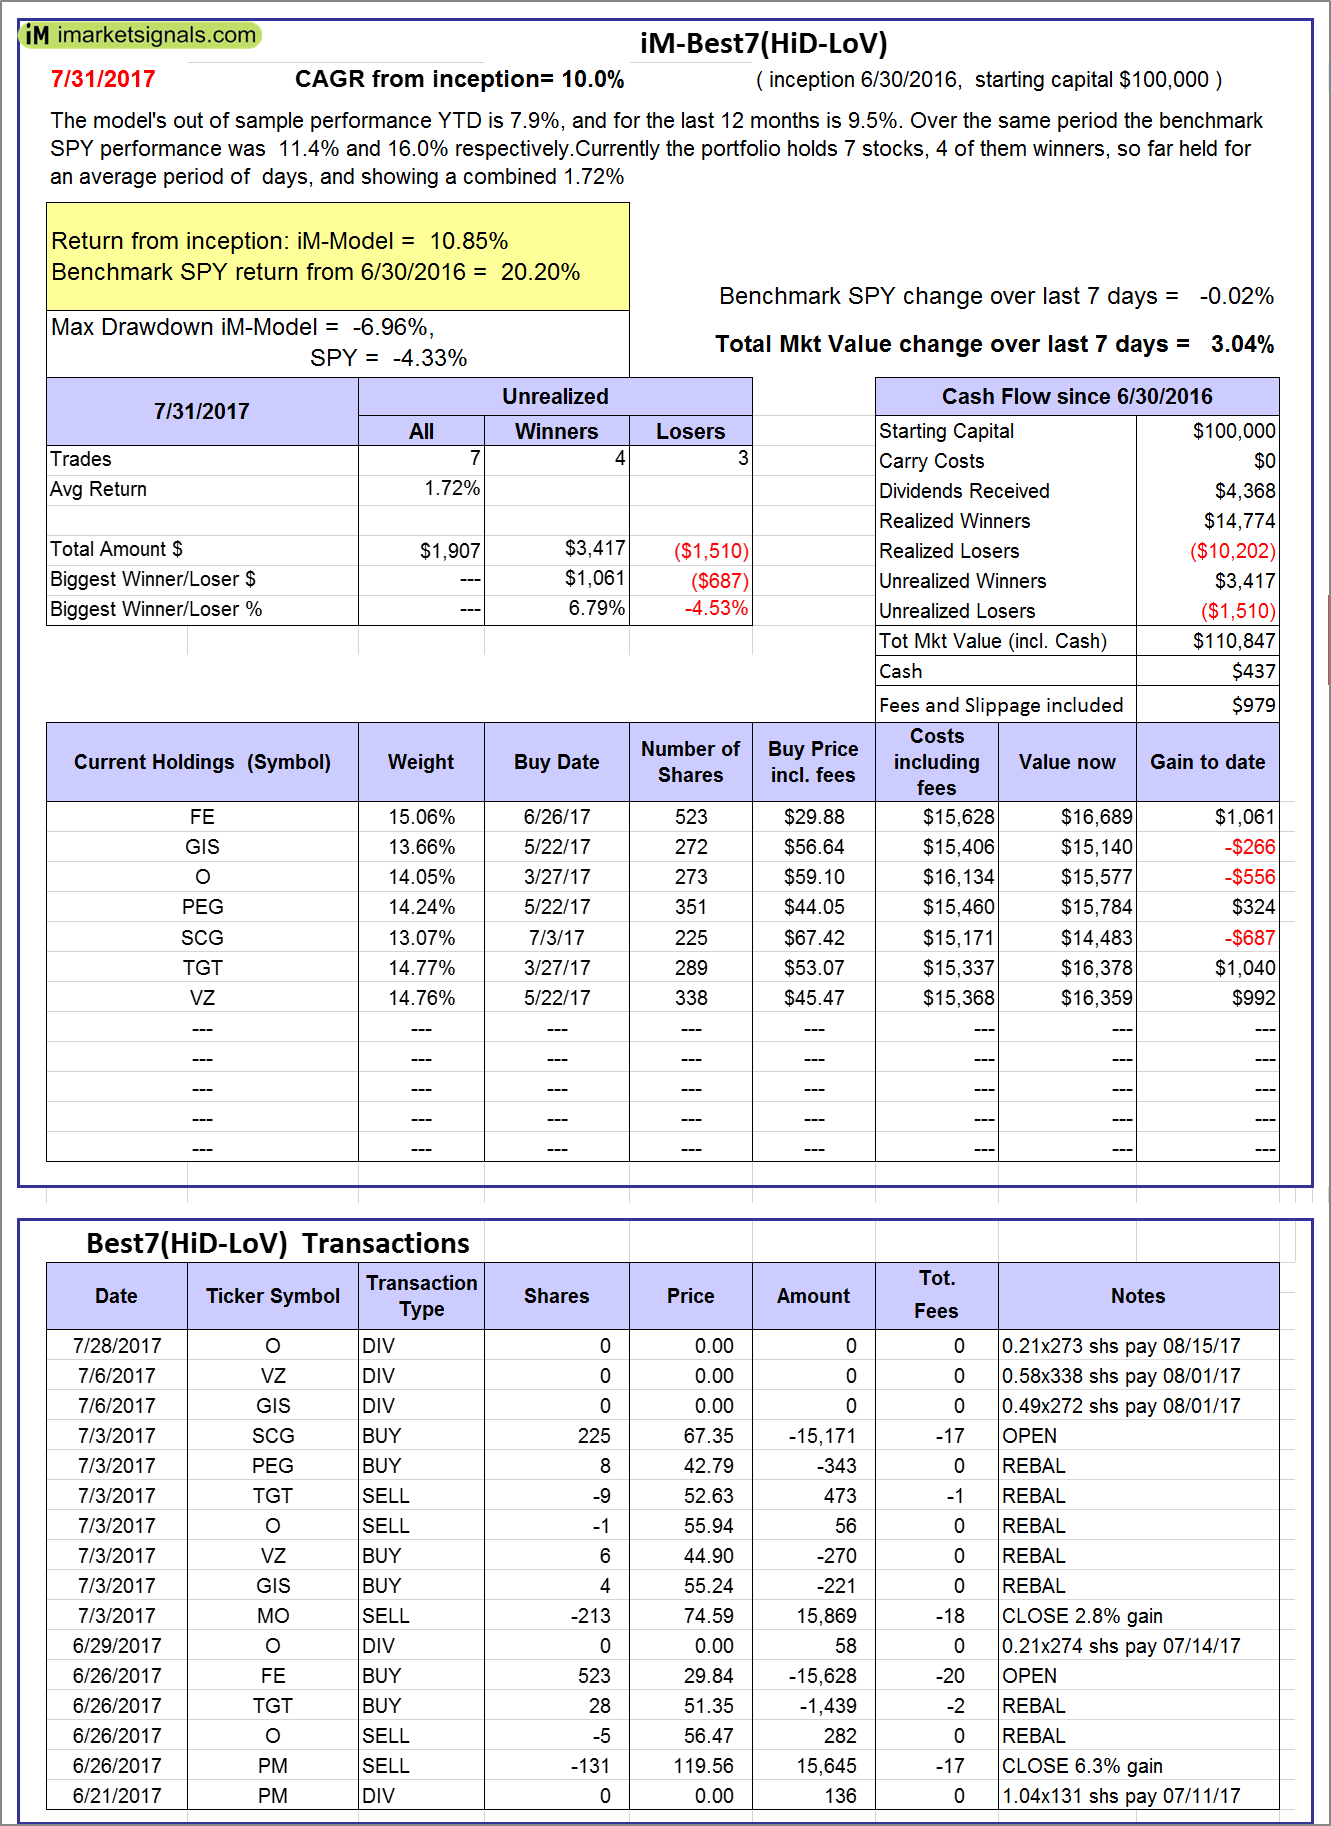 |
iM-Best7(HiD-LoV): The model’s out of sample performance YTD is 7.9%, and for the last 12 months is 9.5%. Over the same period the benchmark SPY performance was 11.4% and 16.0% respectively. Over the previous week the market value of iM-BESTOGA-3 gained 3.04% at a time when SPY gained -0.02%. A starting capital of $100,000 at inception on 6/30/2016 would have grown to $110,847 which includes $437 cash and excludes $979 spent on fees and slippage. |
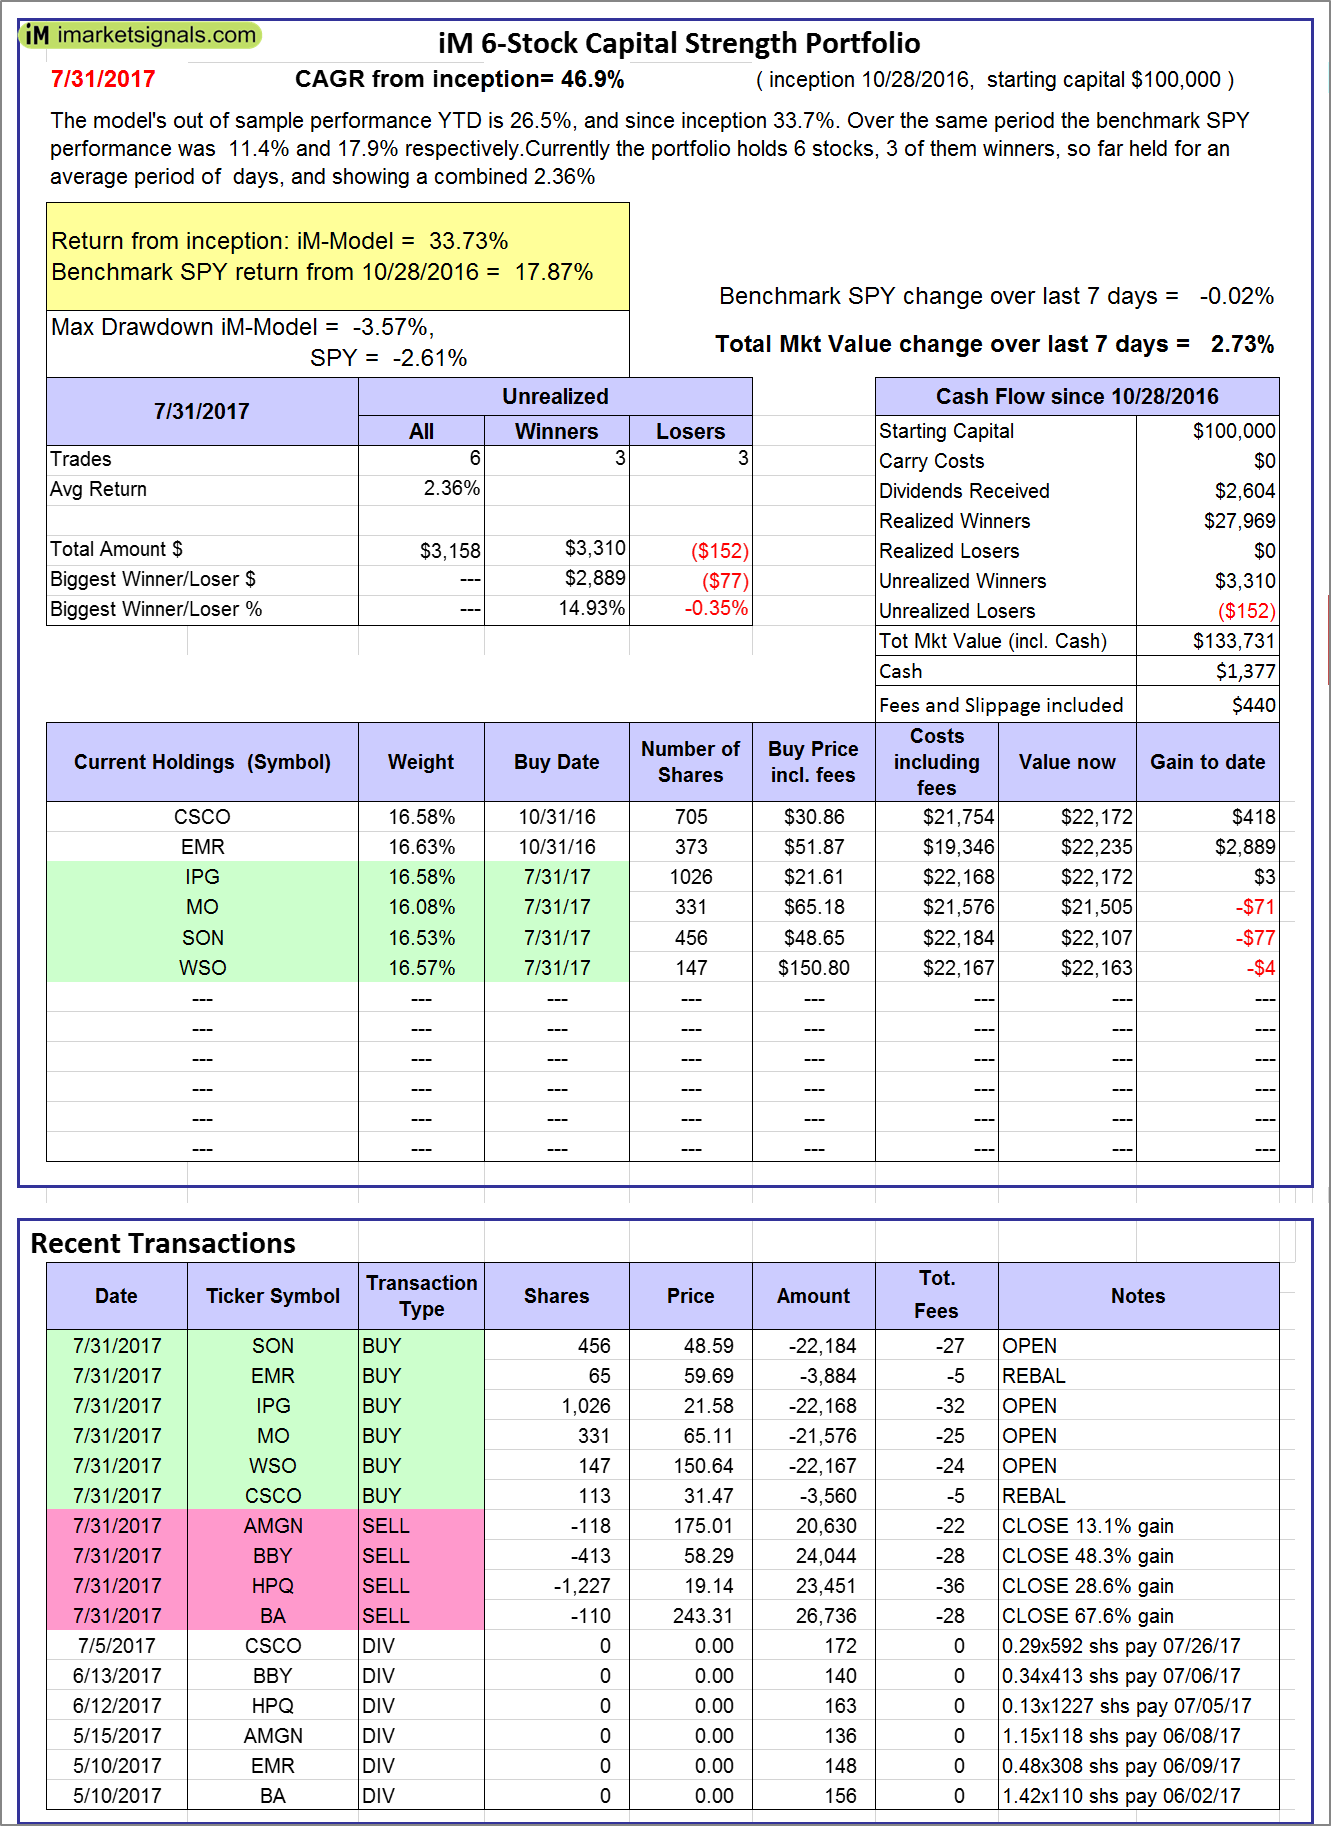 |
iM 6-Stock Capital Strength Portfolio: The model’s out of sample performance YTD is 26.5%, and since inception 33.7%. Over the same period the benchmark SPY performance was 11.4% and 17.9% respectively. Over the previous week the market value of the iM 6-Stock Capital Strength Portfolio gained 2.73% at a time when SPY gained -0.02%. A starting capital of $100,000 at inception on 10/28/2016 would have grown to $133,731 which includes $1,377 cash and excludes $440 spent on fees and slippage. |
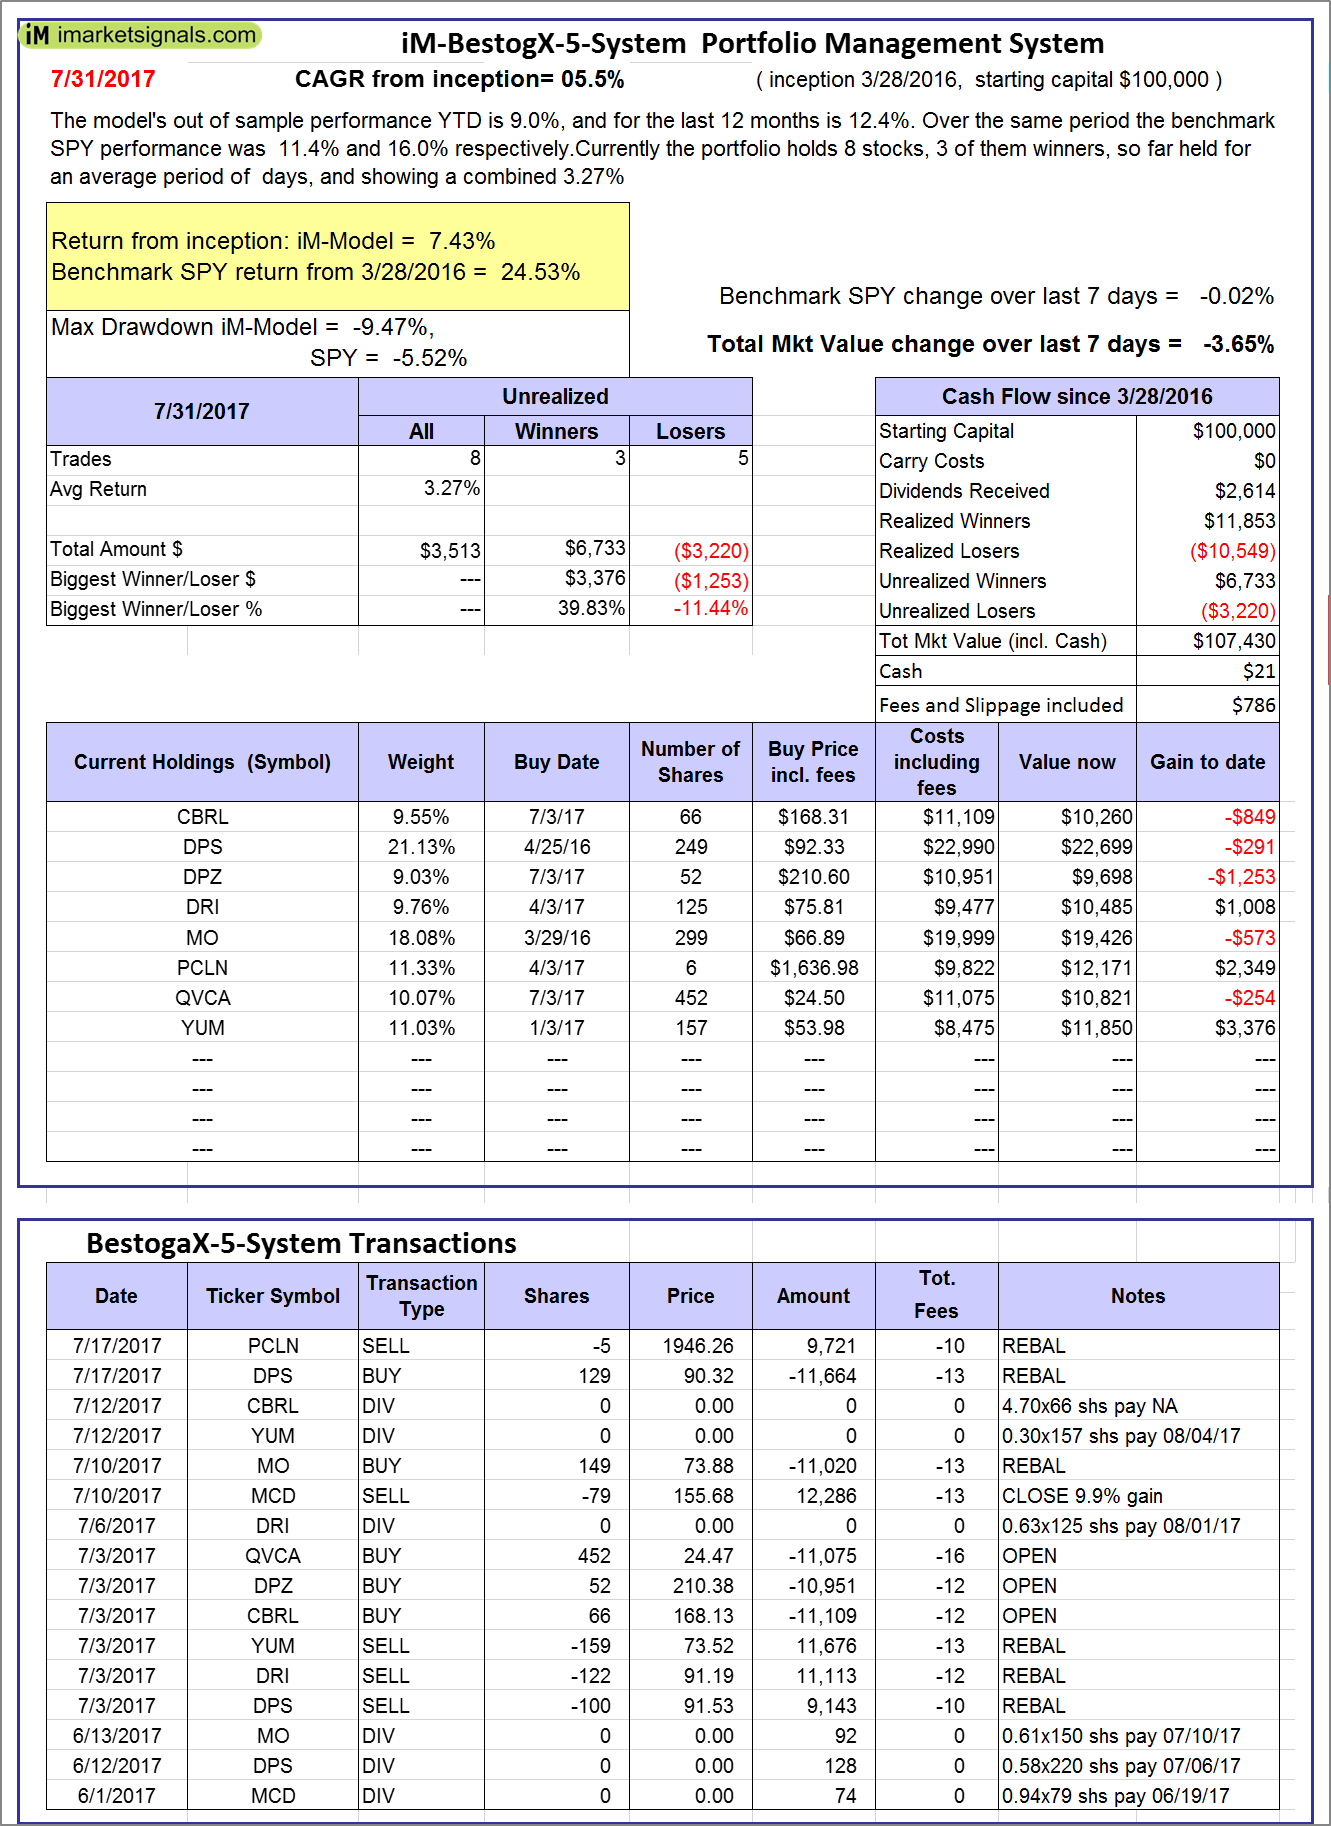 |
iM-BestogaX5-System: The model’s out of sample performance YTD is 9.0%, and for the last 12 months is 12.4%. Over the same period the benchmark SPY performance was 11.4% and 16.0% respectively. Over the previous week the market value of iM-Best8(S&P 500)Tax-Eff. gained -3.65% at a time when SPY gained -0.02%. A starting capital of $100,000 at inception on 3/28/2016 would have grown to $107,430 which includes $21 cash and excludes $786 spent on fees and slippage. |
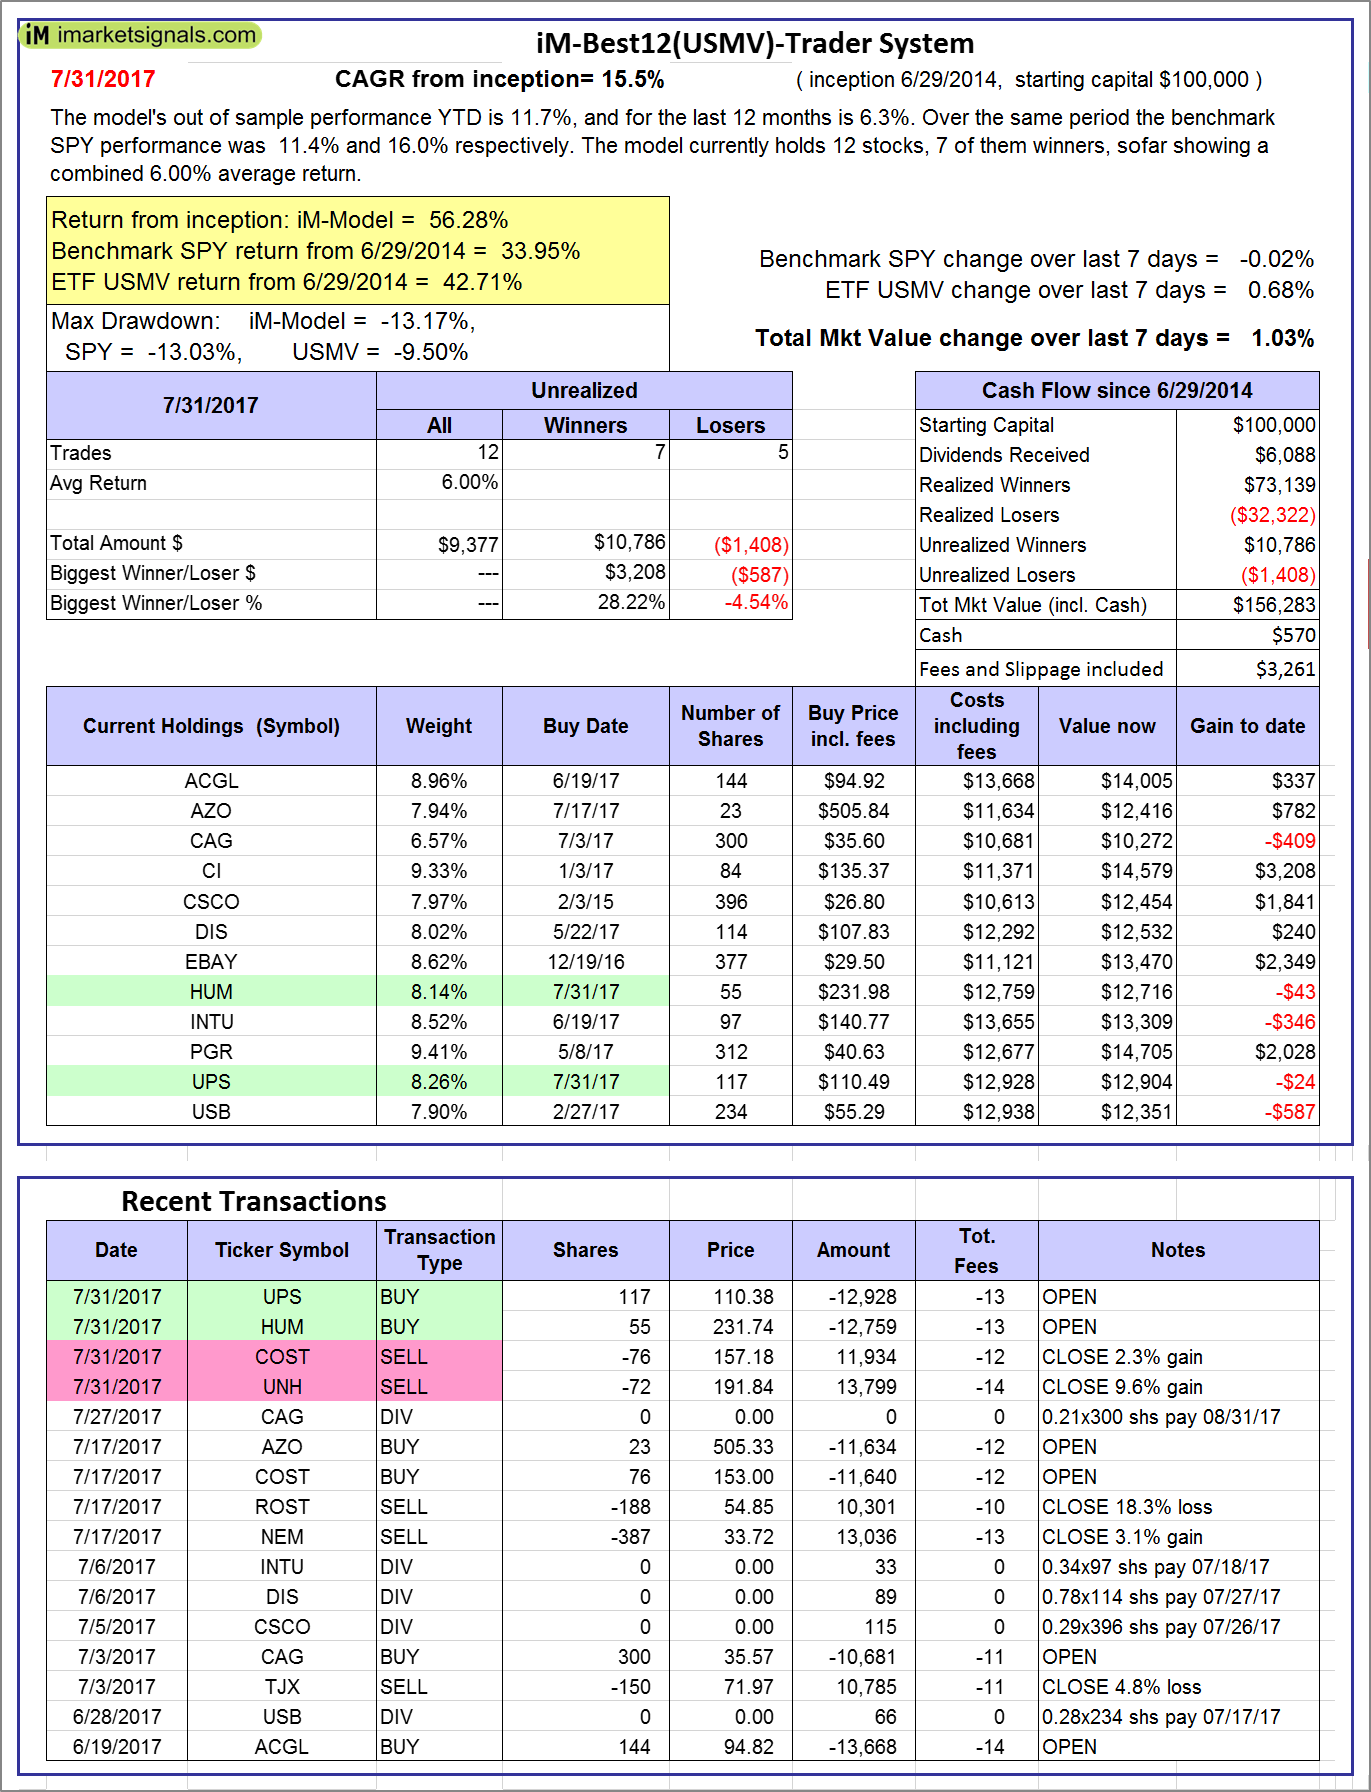 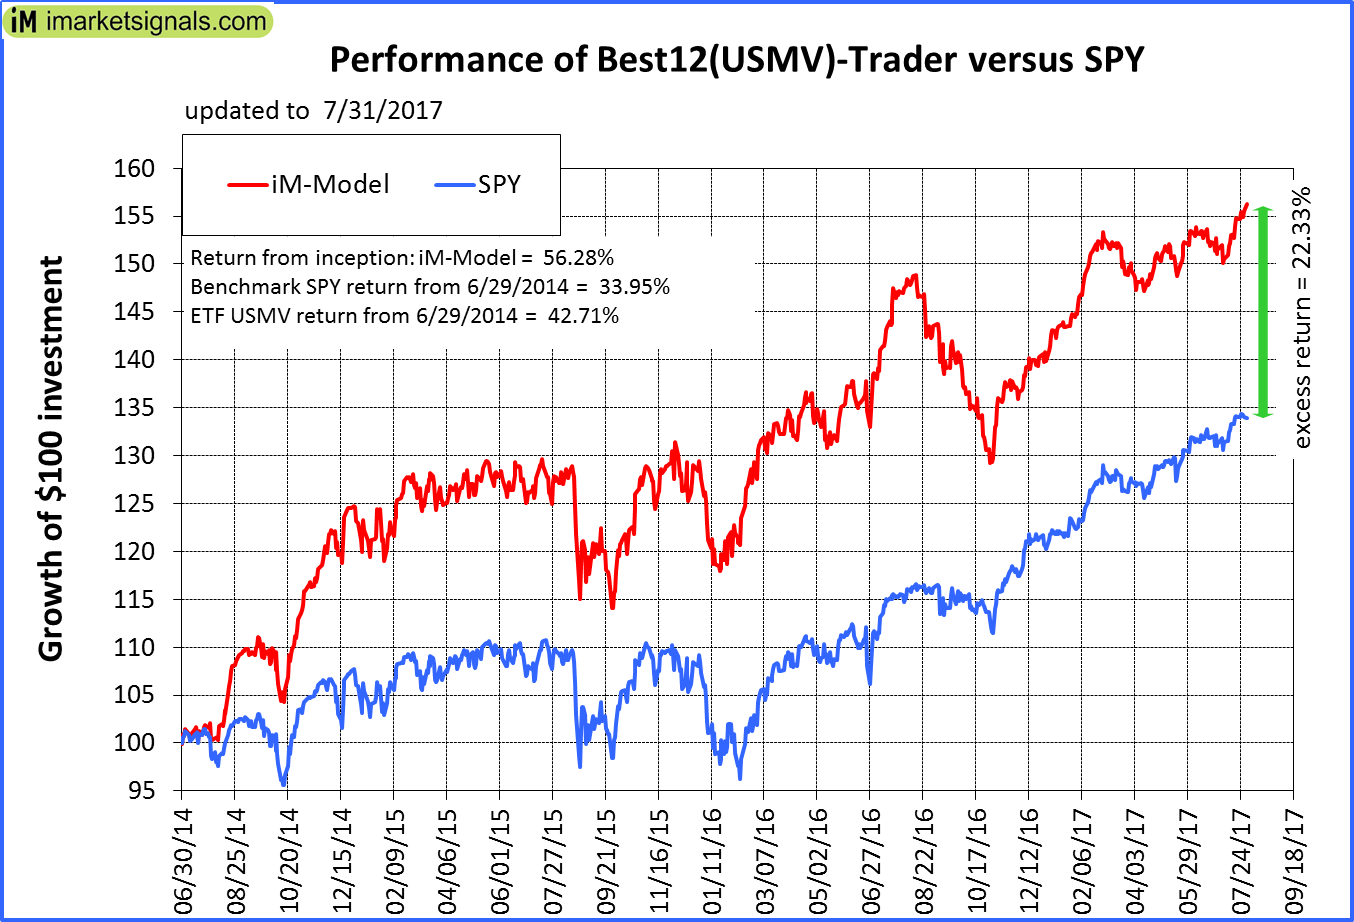 |
iM-Best12(USMV)-Trader: The model’s out of sample performance YTD is 11.7%, and for the last 12 months is 6.3%. Over the same period the benchmark SPY performance was 11.4% and 16.0% respectively. Since inception, on 6/30/2014, the model gained 56.28% while the benchmark SPY gained 33.95% and the ETF USMV gained 42.71% over the same period. Over the previous week the market value of iM-Best12(USMV)-Trader gained 1.03% at a time when SPY gained -0.02%. A starting capital of $100,000 at inception on 6/30/2014 would have grown to $156,283 which includes $570 cash and excludes $3,261 spent on fees and slippage. |
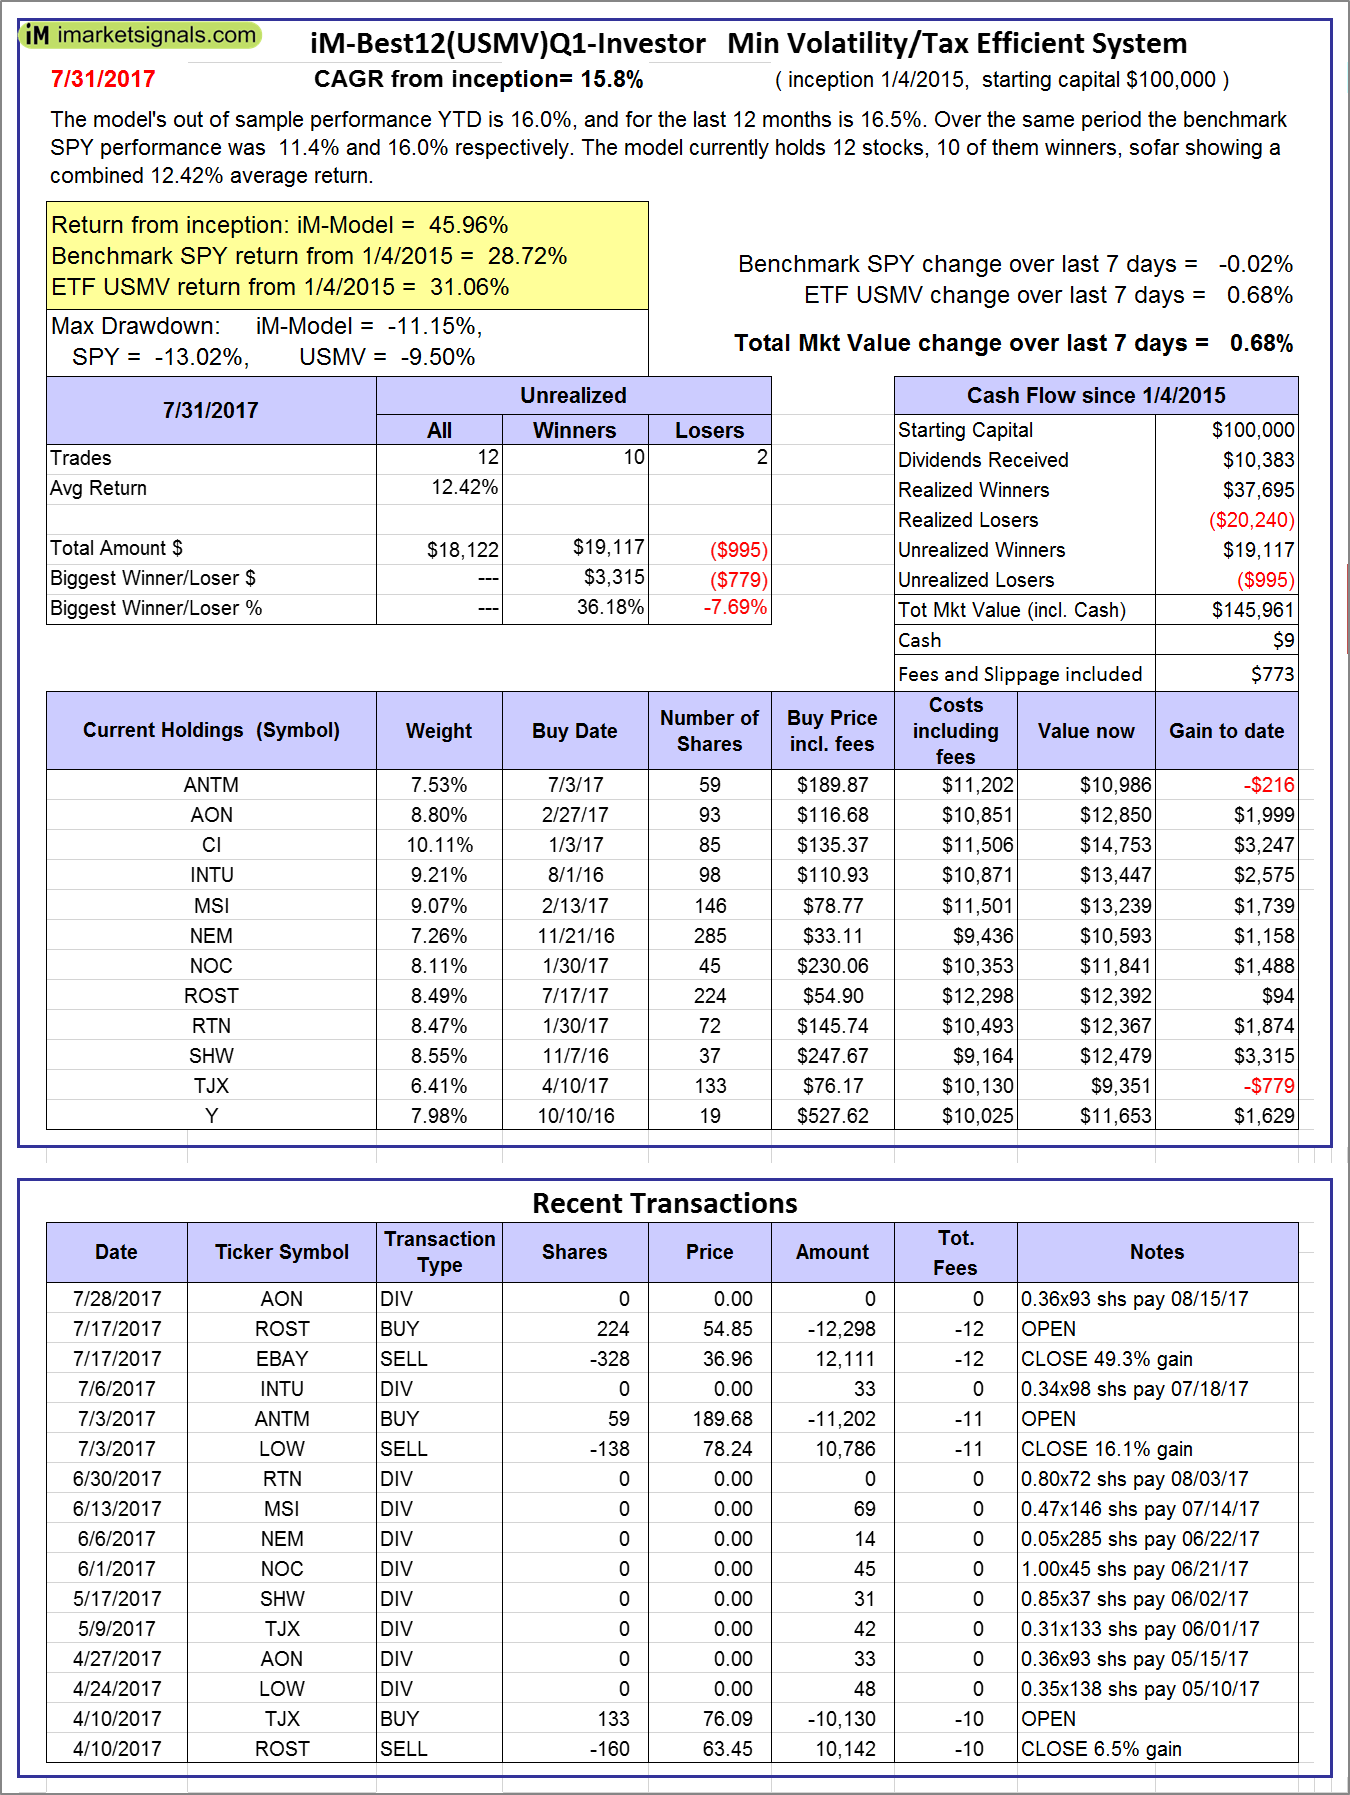 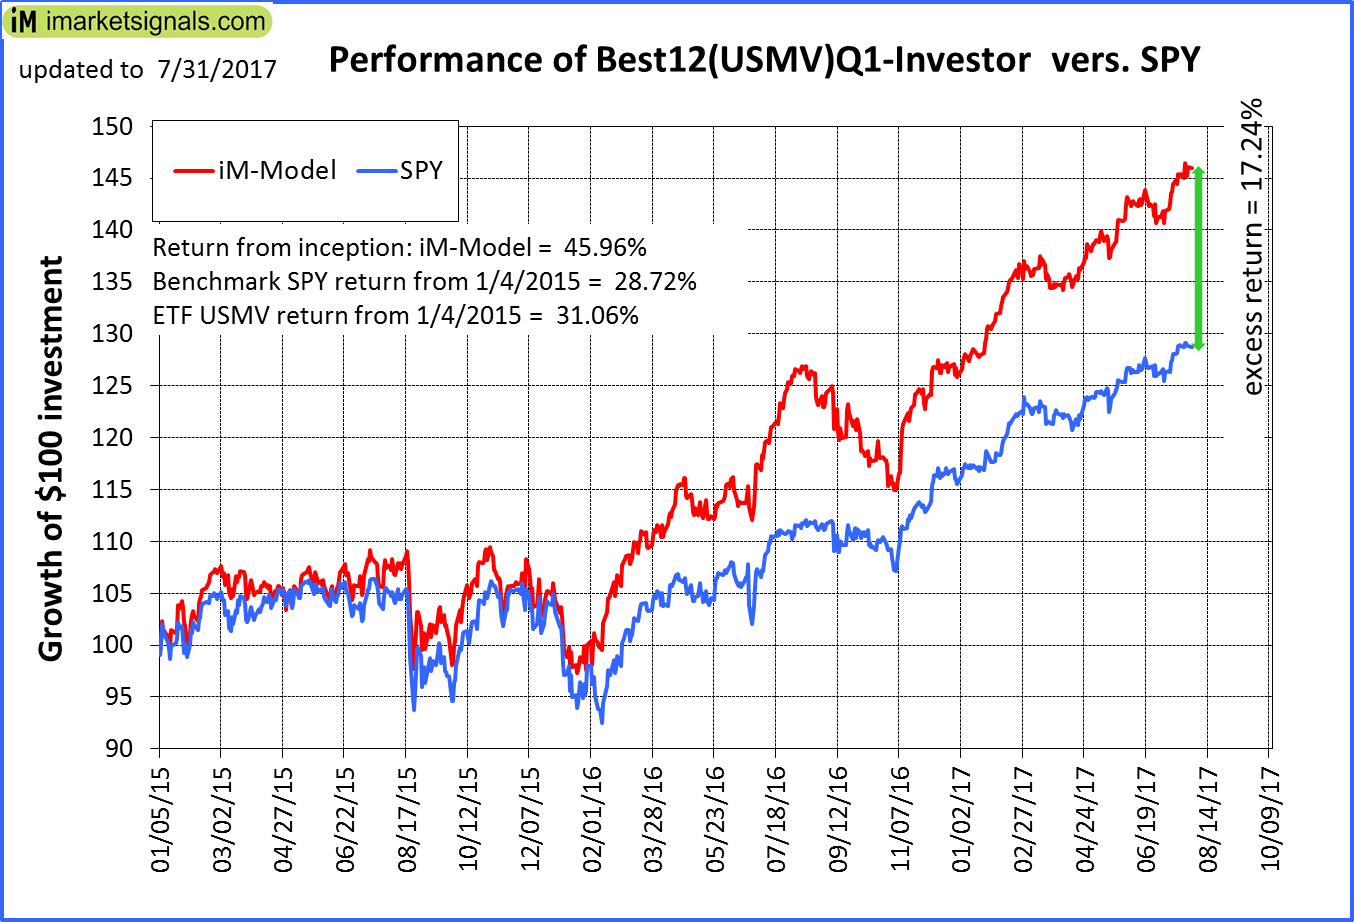 |
iM-Best12(USMV)Q1-Investor: The model’s out of sample performance YTD is 16.0%, and for the last 12 months is 16.5%. Over the same period the benchmark SPY performance was 11.4% and 16.0% respectively. Since inception, on 1/5/2015, the model gained 45.96% while the benchmark SPY gained 28.72% and the ETF USMV gained 31.06% over the same period. Over the previous week the market value of iM-Best12(USMV)Q1 gained 0.68% at a time when SPY gained -0.02%. A starting capital of $100,000 at inception on 1/5/2015 would have grown to $145,961 which includes $9 cash and excludes $773 spent on fees and slippage. |
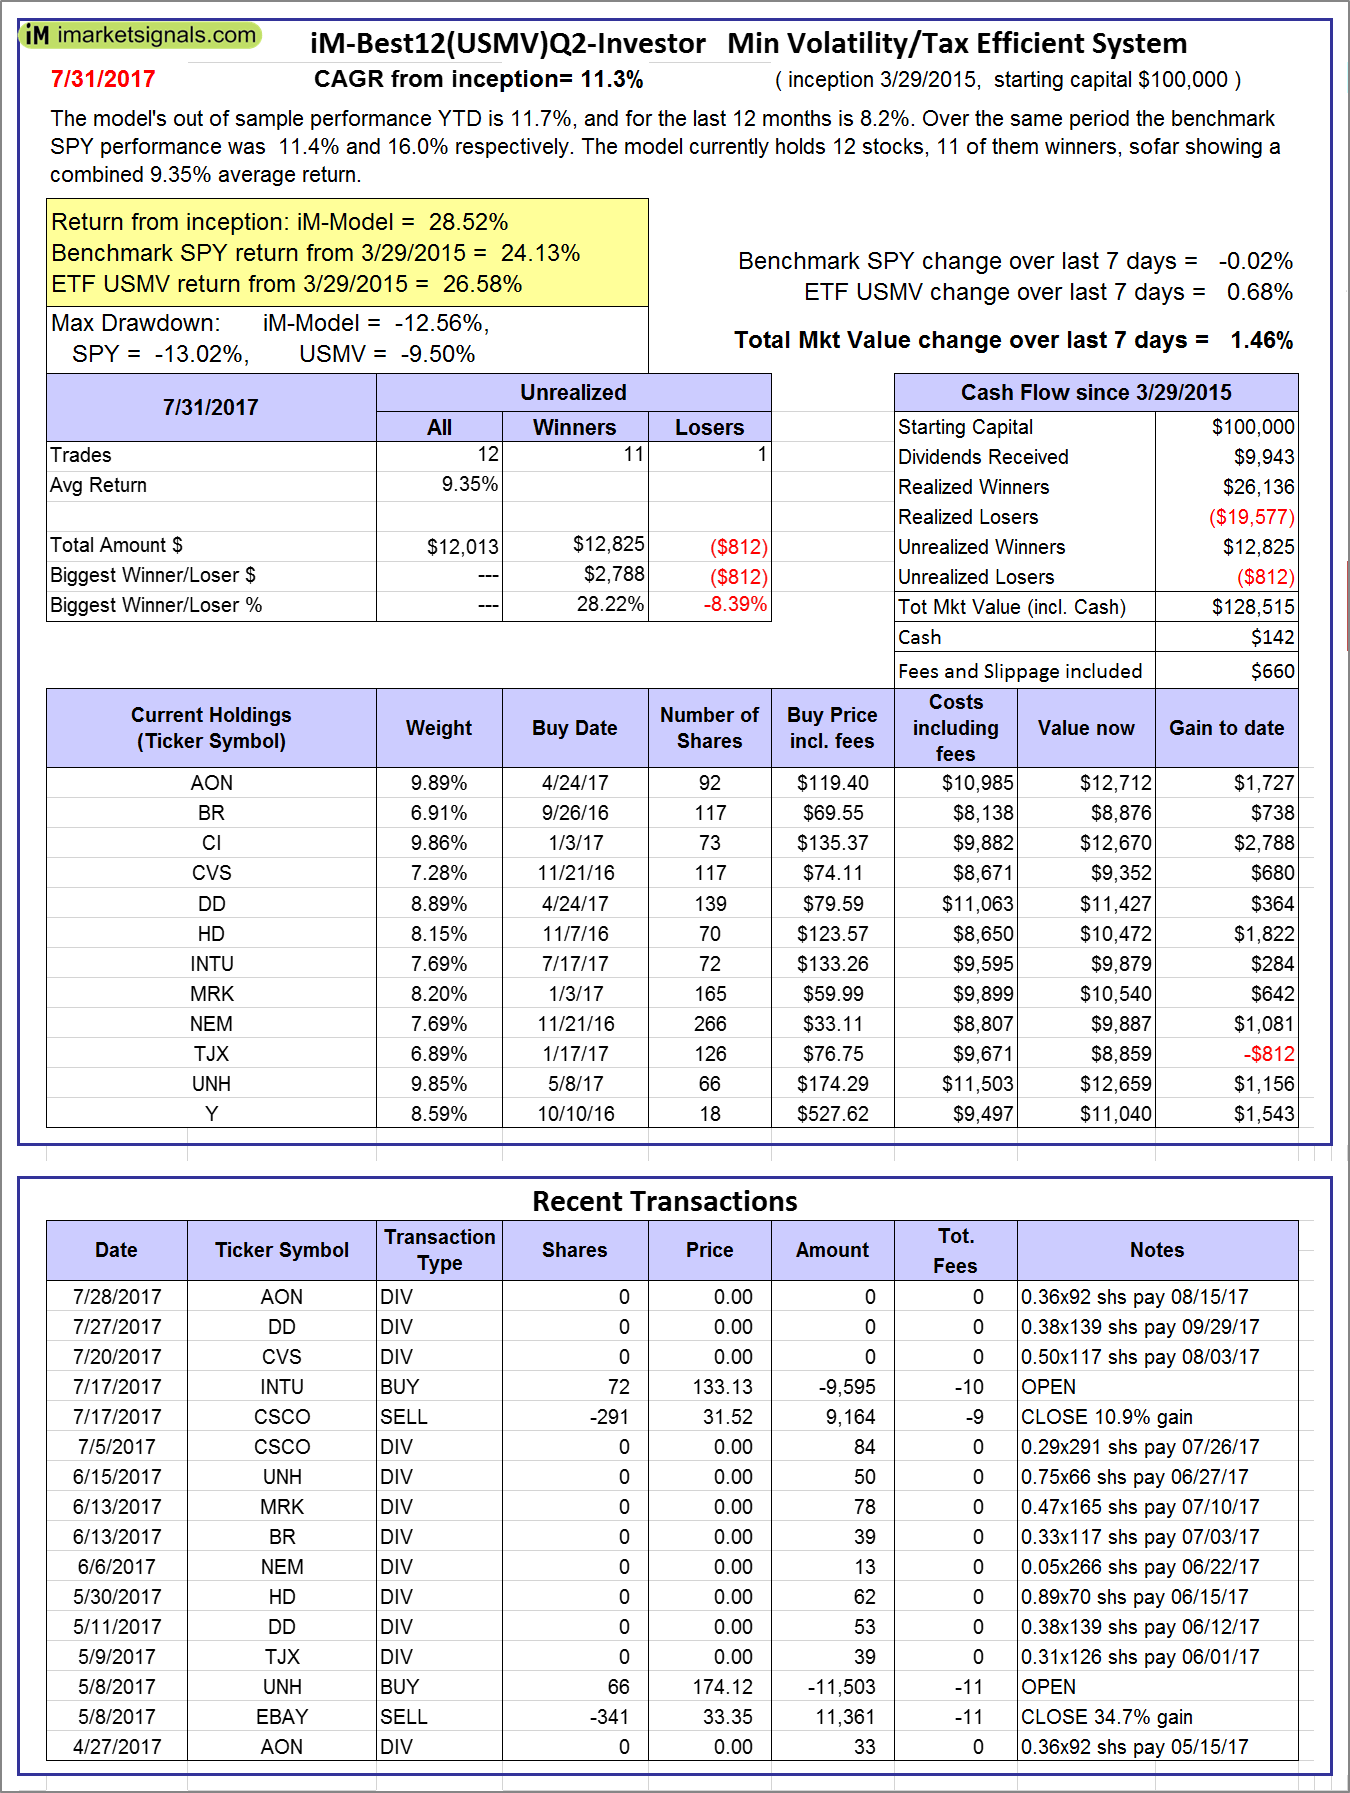 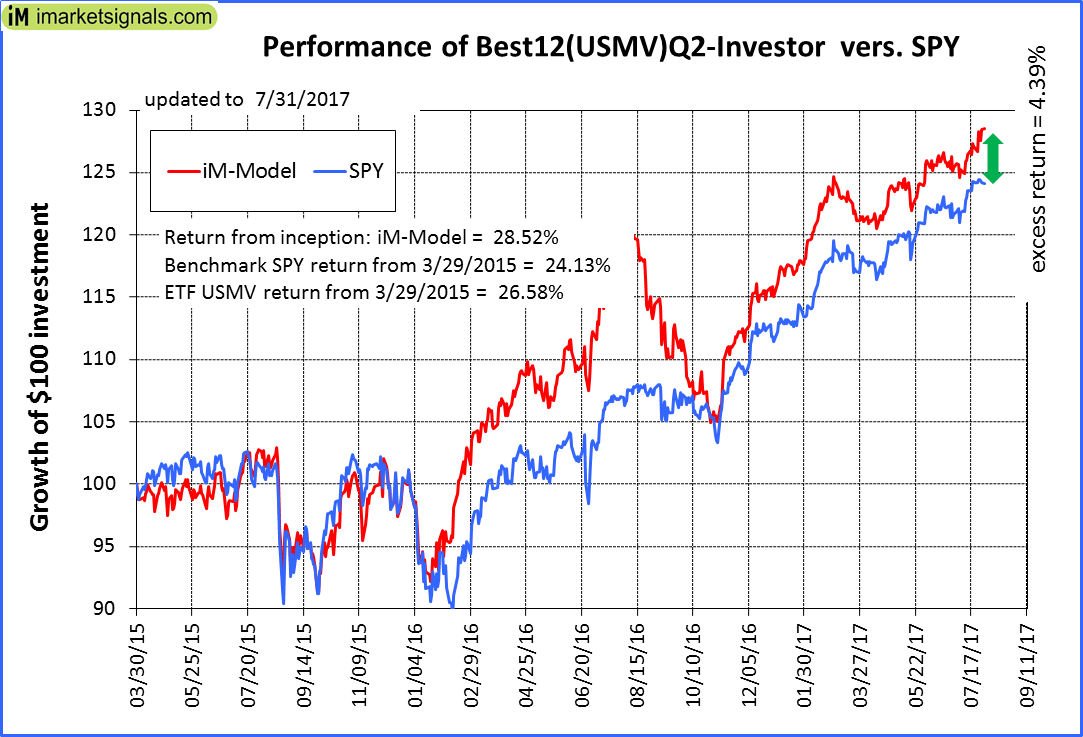 |
iM-Best12(USMV)Q2-Investor: The model’s out of sample performance YTD is 11.7%, and for the last 12 months is 8.2%. Over the same period the benchmark SPY performance was 11.4% and 16.0% respectively. Since inception, on 3/30/2015, the model gained 28.52% while the benchmark SPY gained 24.13% and the ETF USMV gained 26.58% over the same period. Over the previous week the market value of iM-Best12(USMV)Q2 gained 1.46% at a time when SPY gained -0.02%. A starting capital of $100,000 at inception on 3/30/2015 would have grown to $128,515 which includes $142 cash and excludes $660 spent on fees and slippage. |
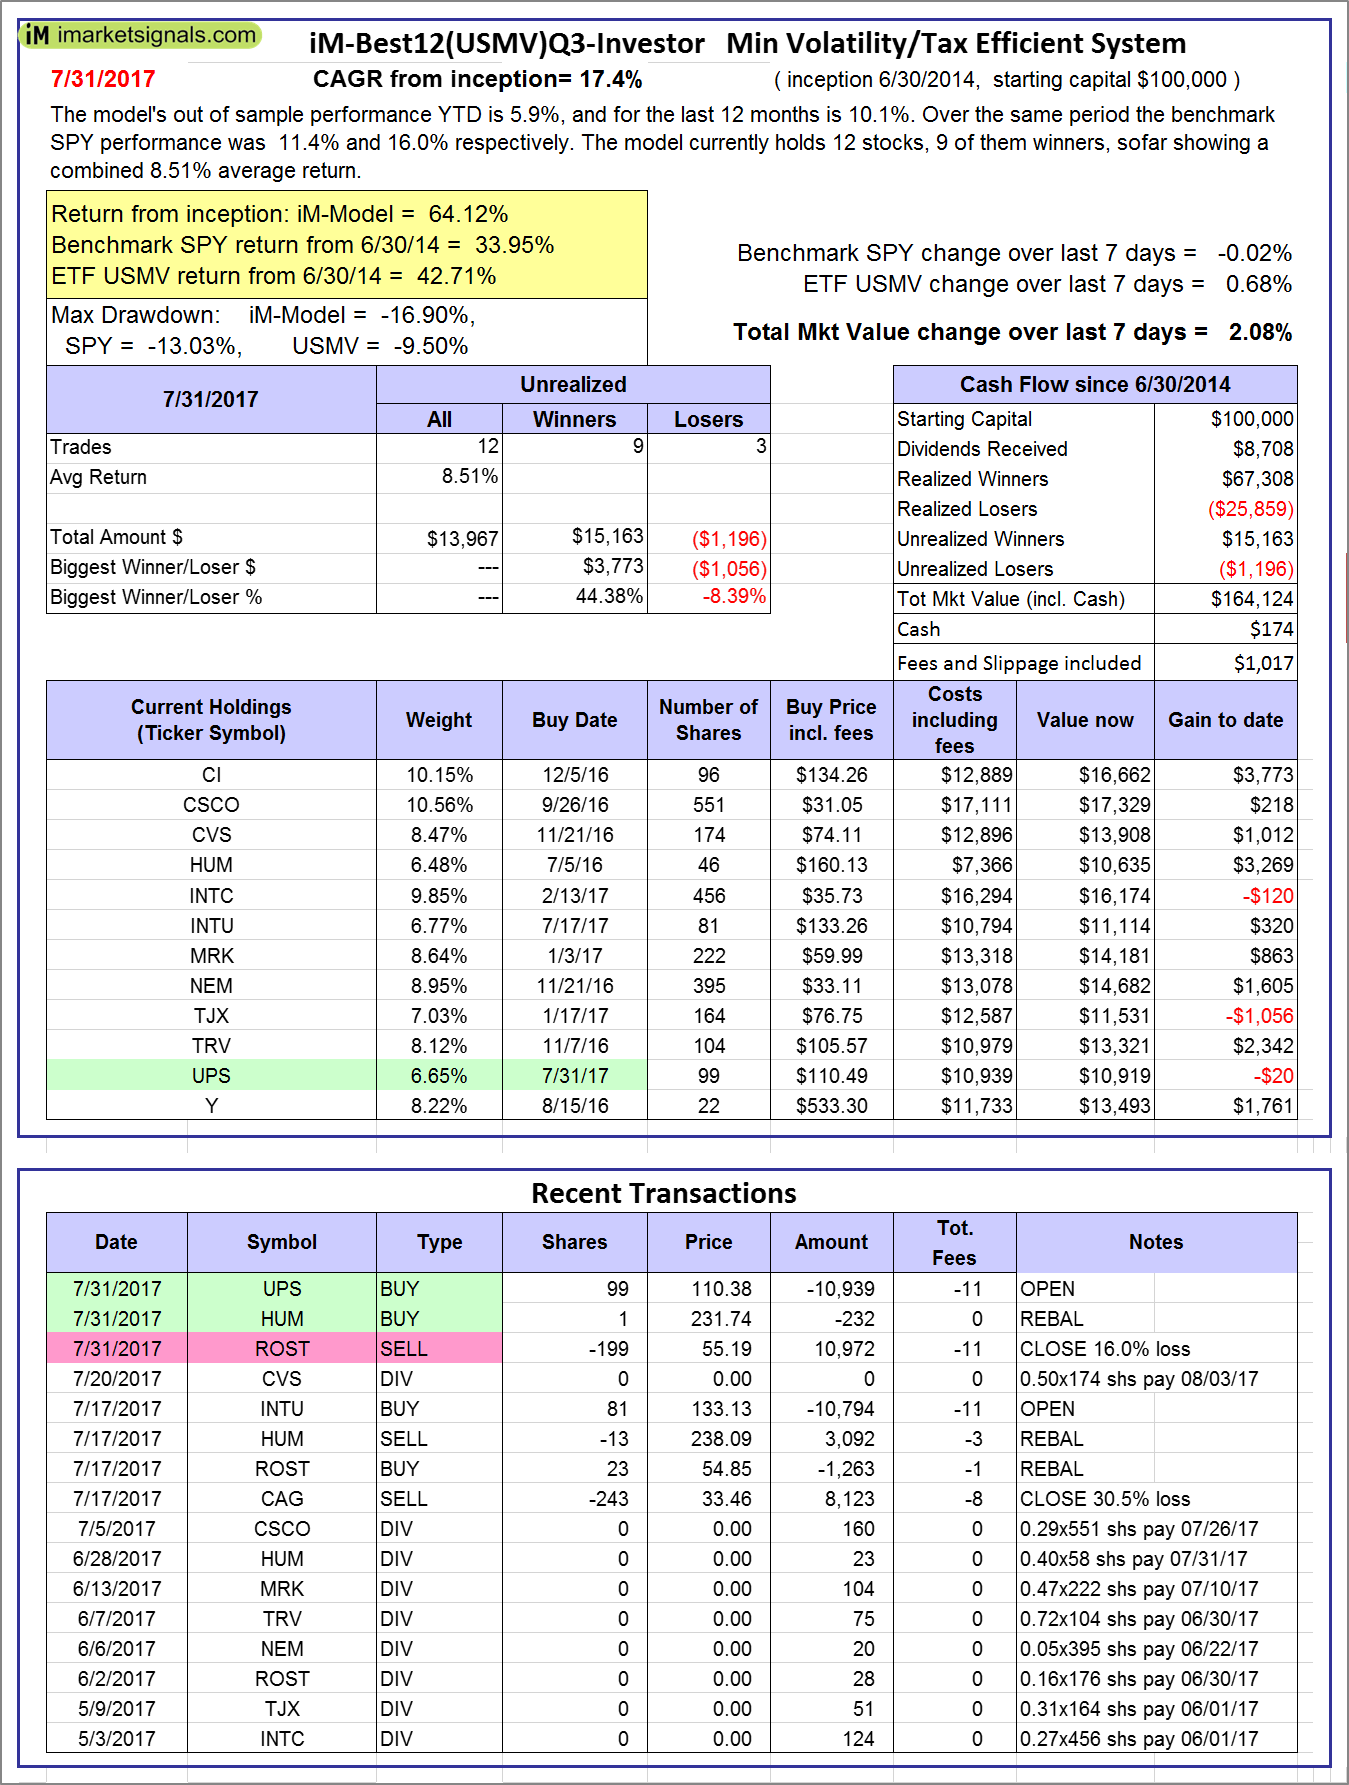 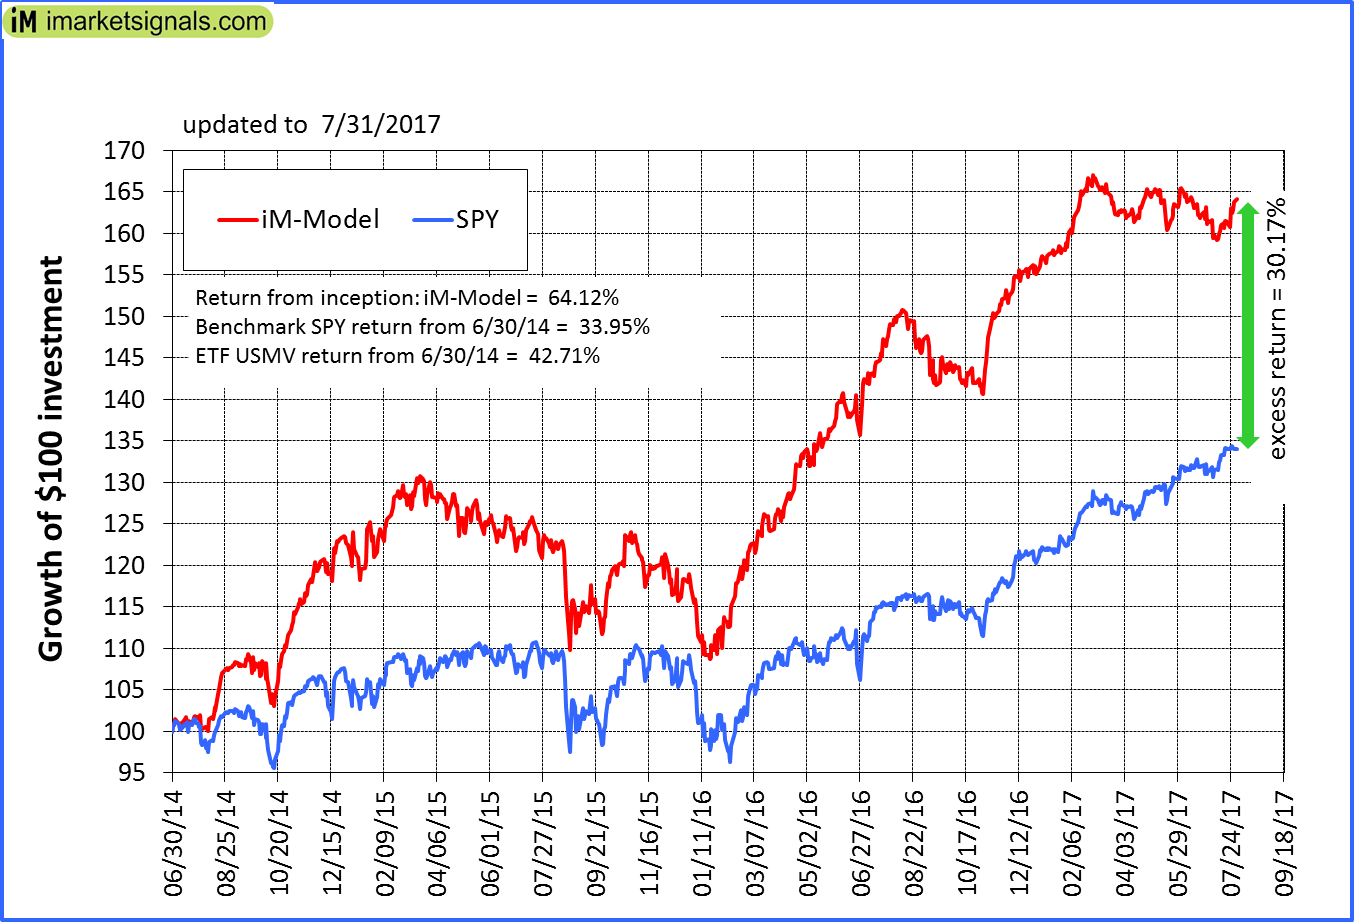 |
iM-Best12(USMV)Q3-Investor: The model’s out of sample performance YTD is 5.9%, and for the last 12 months is 10.1%. Over the same period the benchmark SPY performance was 11.4% and 16.0% respectively. Since inception, on 7/1/2014, the model gained 64.12% while the benchmark SPY gained 33.95% and the ETF USMV gained 42.71% over the same period. Over the previous week the market value of iM-Best12(USMV)Q3 gained 2.08% at a time when SPY gained -0.02%. A starting capital of $100,000 at inception on 7/1/2014 would have grown to $164,124 which includes $174 cash and excludes $1,017 spent on fees and slippage. |
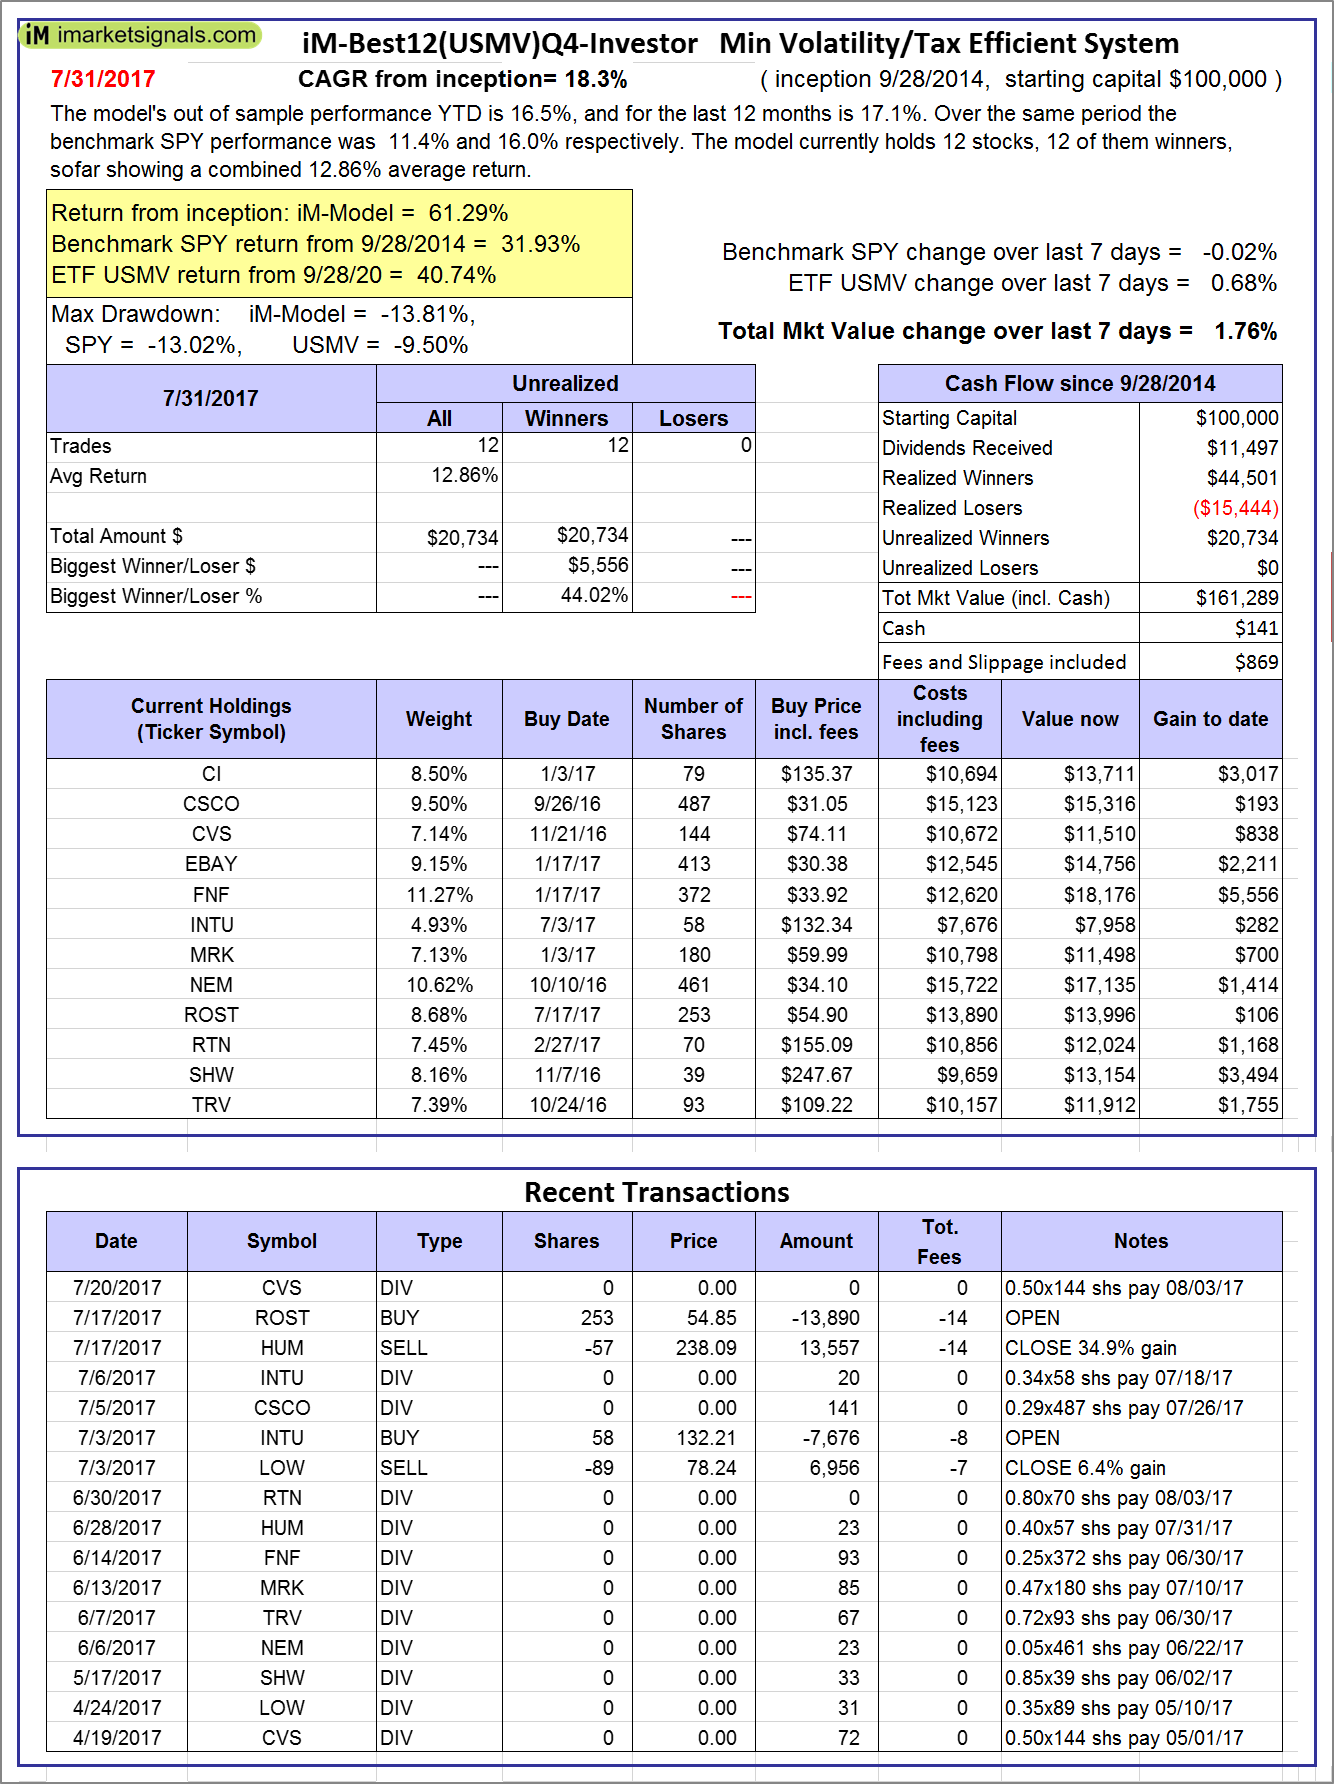  |
iM-Best12(USMV)Q4-Investor: Since inception, on 9/29/2014, the model gained 61.29% while the benchmark SPY gained 31.93% and the ETF USMV gained 40.74% over the same period. Over the previous week the market value of iM-Best12(USMV)Q4 gained 1.76% at a time when SPY gained -0.02%. A starting capital of $100,000 at inception on 9/29/2014 would have grown to $161,289 which includes $141 cash and excludes $869 spent on fees and slippage. |
 |
Average Performance of iM-Best12(USMV)Q1+Q2+Q3+Q4-Investor resulted in an excess return of 35.19% over SPY. (see iM-USMV Investor Portfolio) |
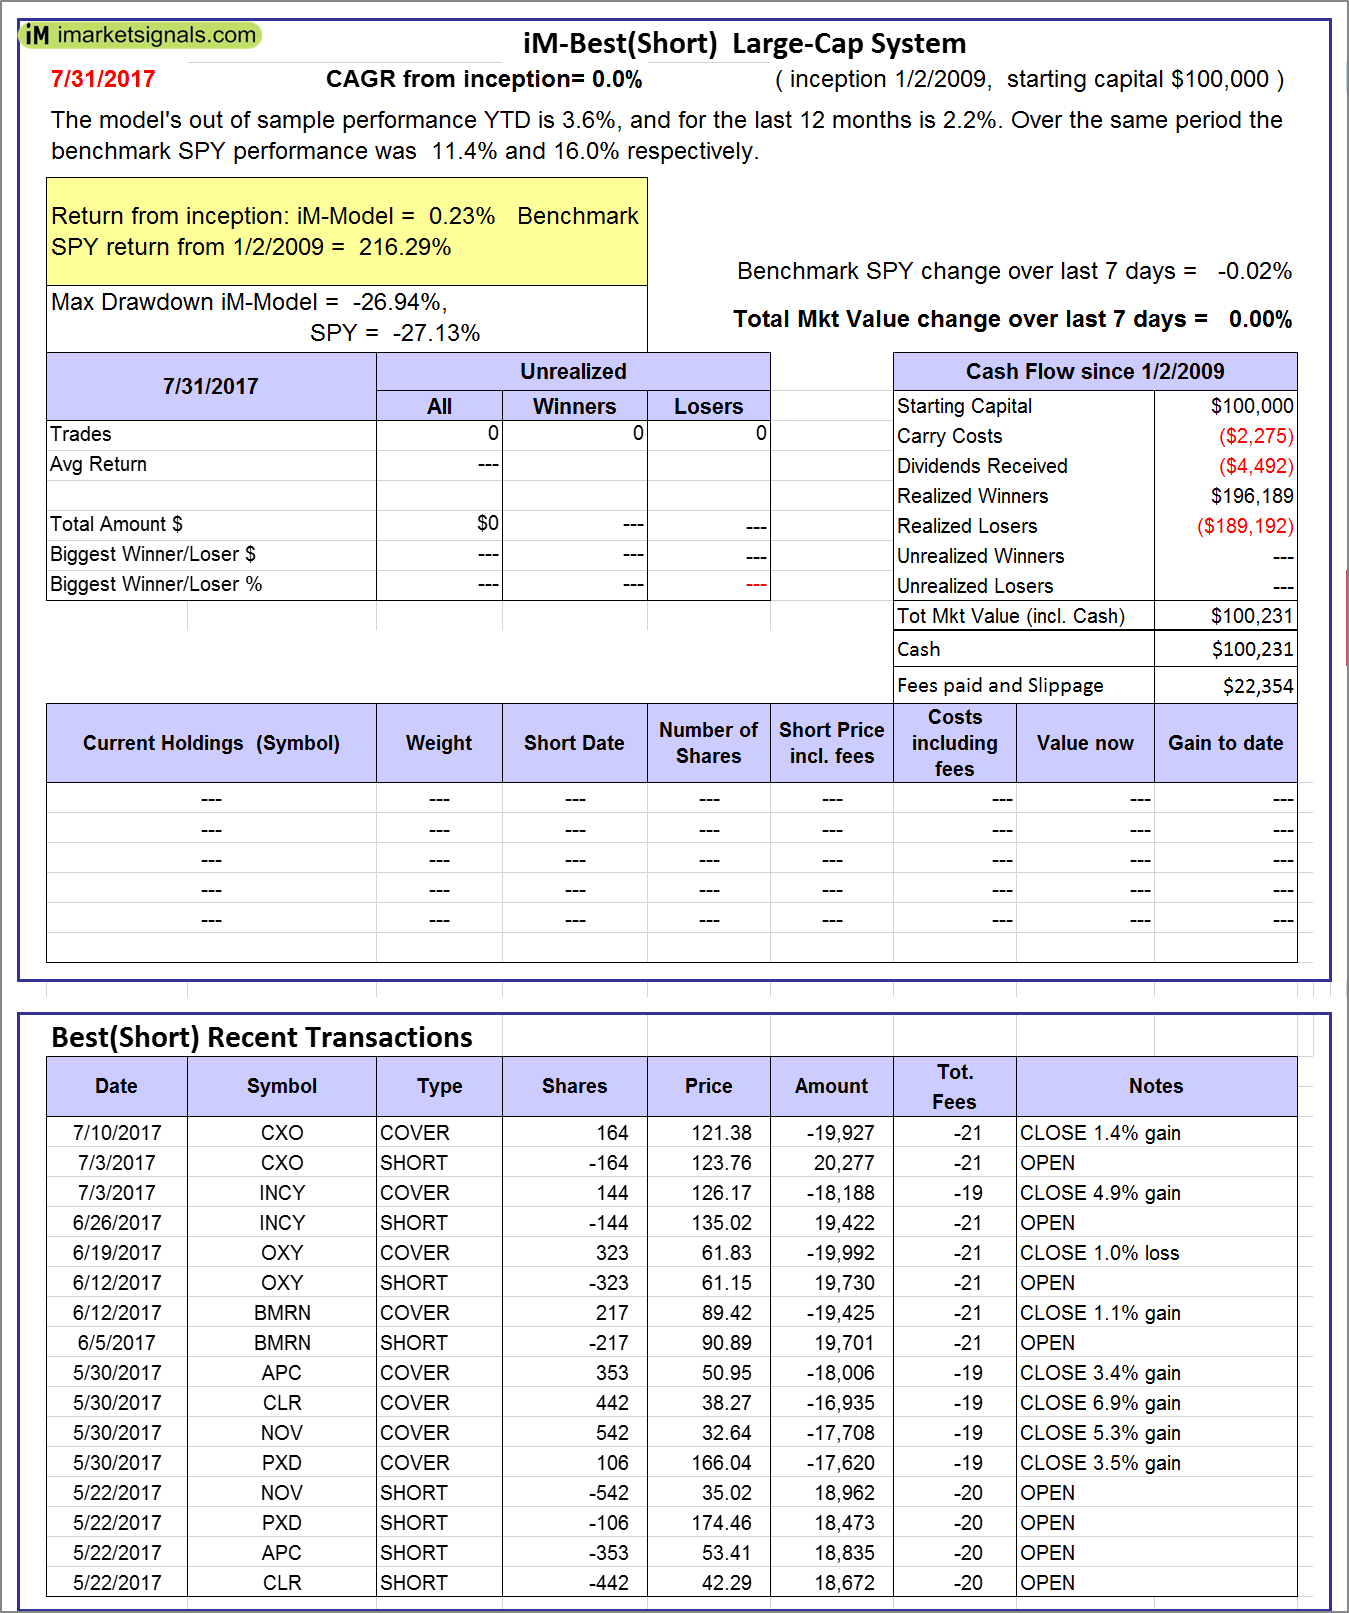 |
iM-Best(Short): The model’s out of sample performance YTD is 3.6%, and for the last 12 months is 2.2%. Over the same period the benchmark SPY performance was 11.4% and 16.0% respectively. Over the previous week the market value of iM-Best(Short) gained 0.00% at a time when SPY gained -0.02%. Over the period 1/2/2009 to 7/31/2017 the starting capital of $100,000 would have grown to $100,231 which includes $100,231 cash and excludes $22,354 spent on fees and slippage. |
 |
iM-Best2 MC-Score ETF System: The model’s out of sample performance YTD is 9.9%, and for the last 12 months is 6.3%. Over the same period the benchmark SPY performance was 11.4% and 16.0% respectively. Over the previous week the market value of the iM-Best2 MC-Score ETF System gained 0.72% at a time when SPY gained -0.02%. A starting capital of $100,000 at inception on 6/30/2016 would have grown to $106,516 which includes $735 cash and excludes $107 spent on fees and slippage. |
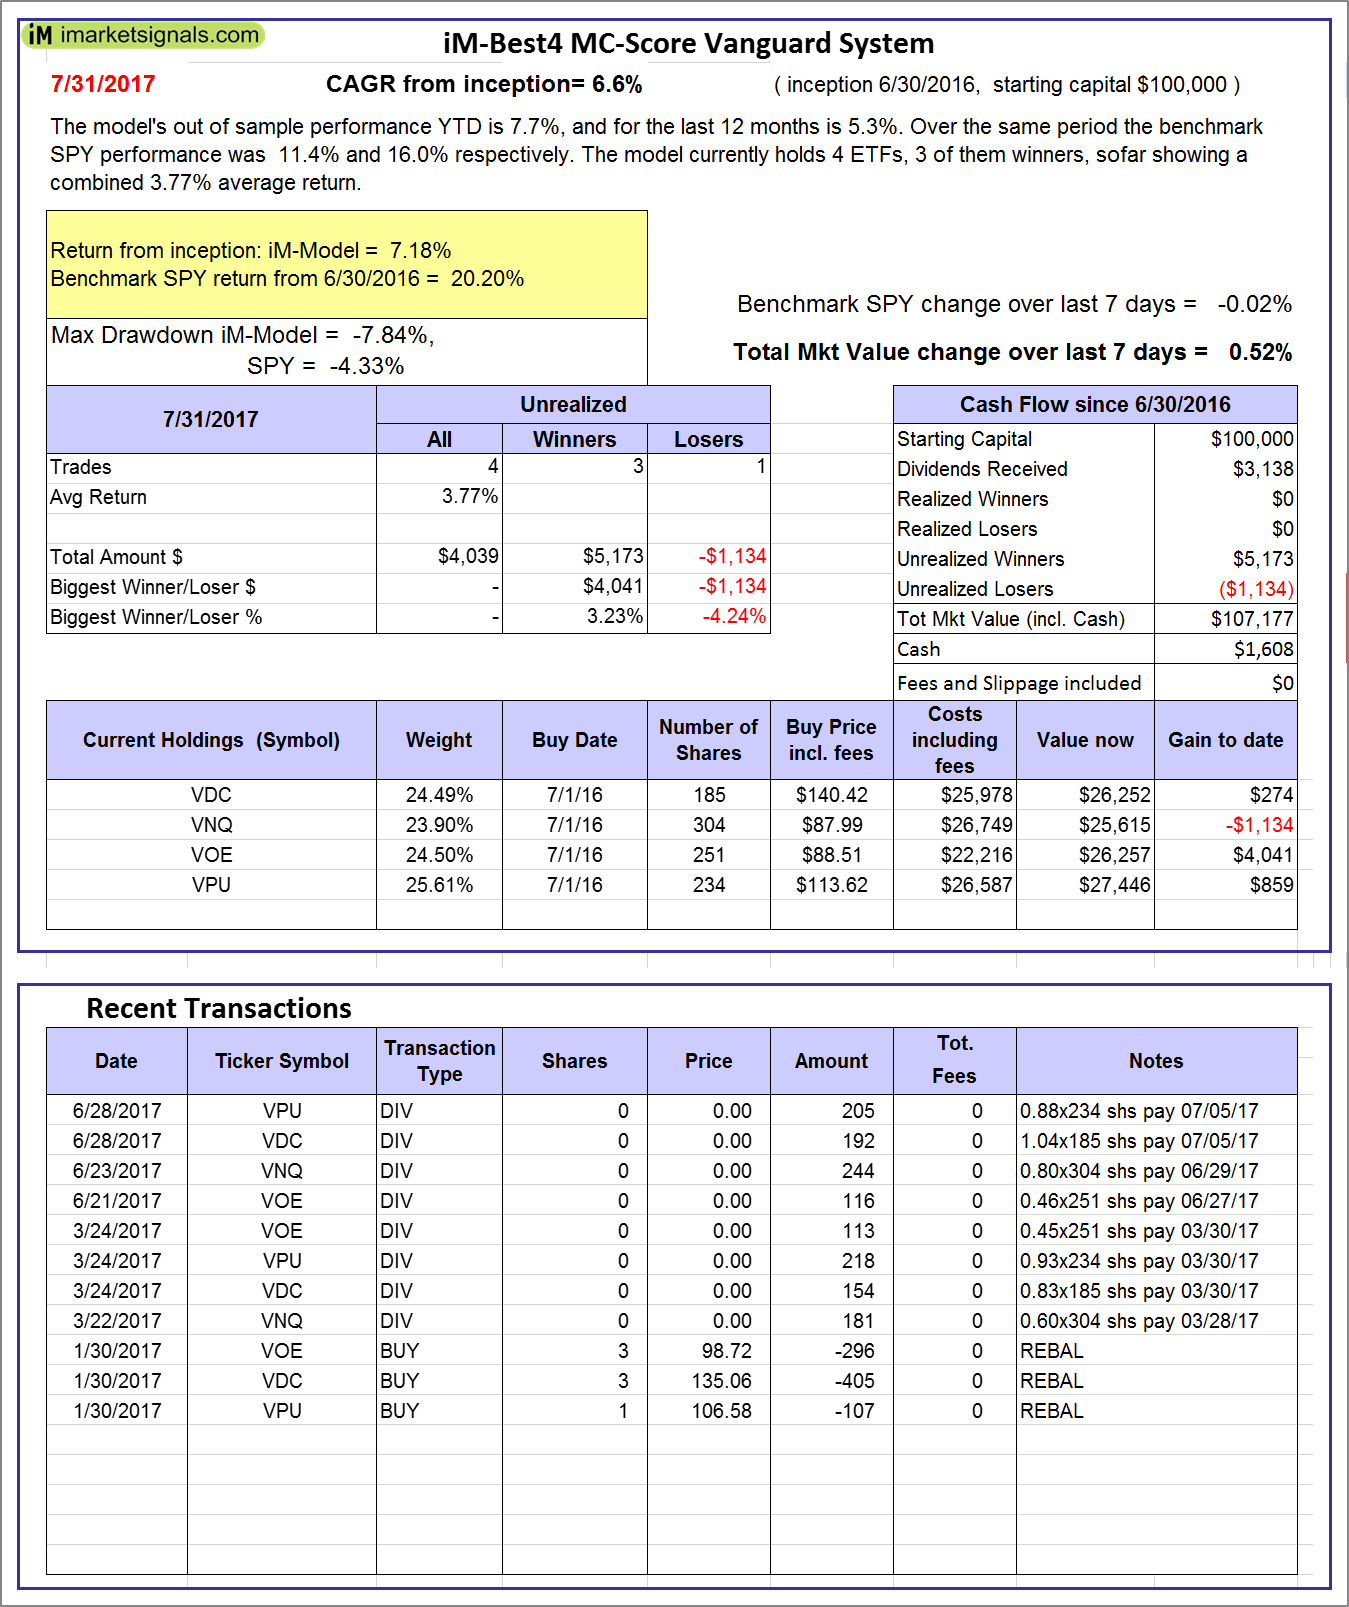 |
iM-Best4 MC-Score Vanguard System: The model’s out of sample performance YTD is 7.7%, and for the last 12 months is 5.3%. Over the same period the benchmark SPY performance was 11.4% and 16.0% respectively. Over the previous week the market value of the iM-Best4 MC-Score Vanguard System gained 0.52% at a time when SPY gained -0.02%. A starting capital of $100,000 at inception on 6/30/2016 would have grown to $107,177 which includes $1,608 cash and excludes $00 spent on fees and slippage. |
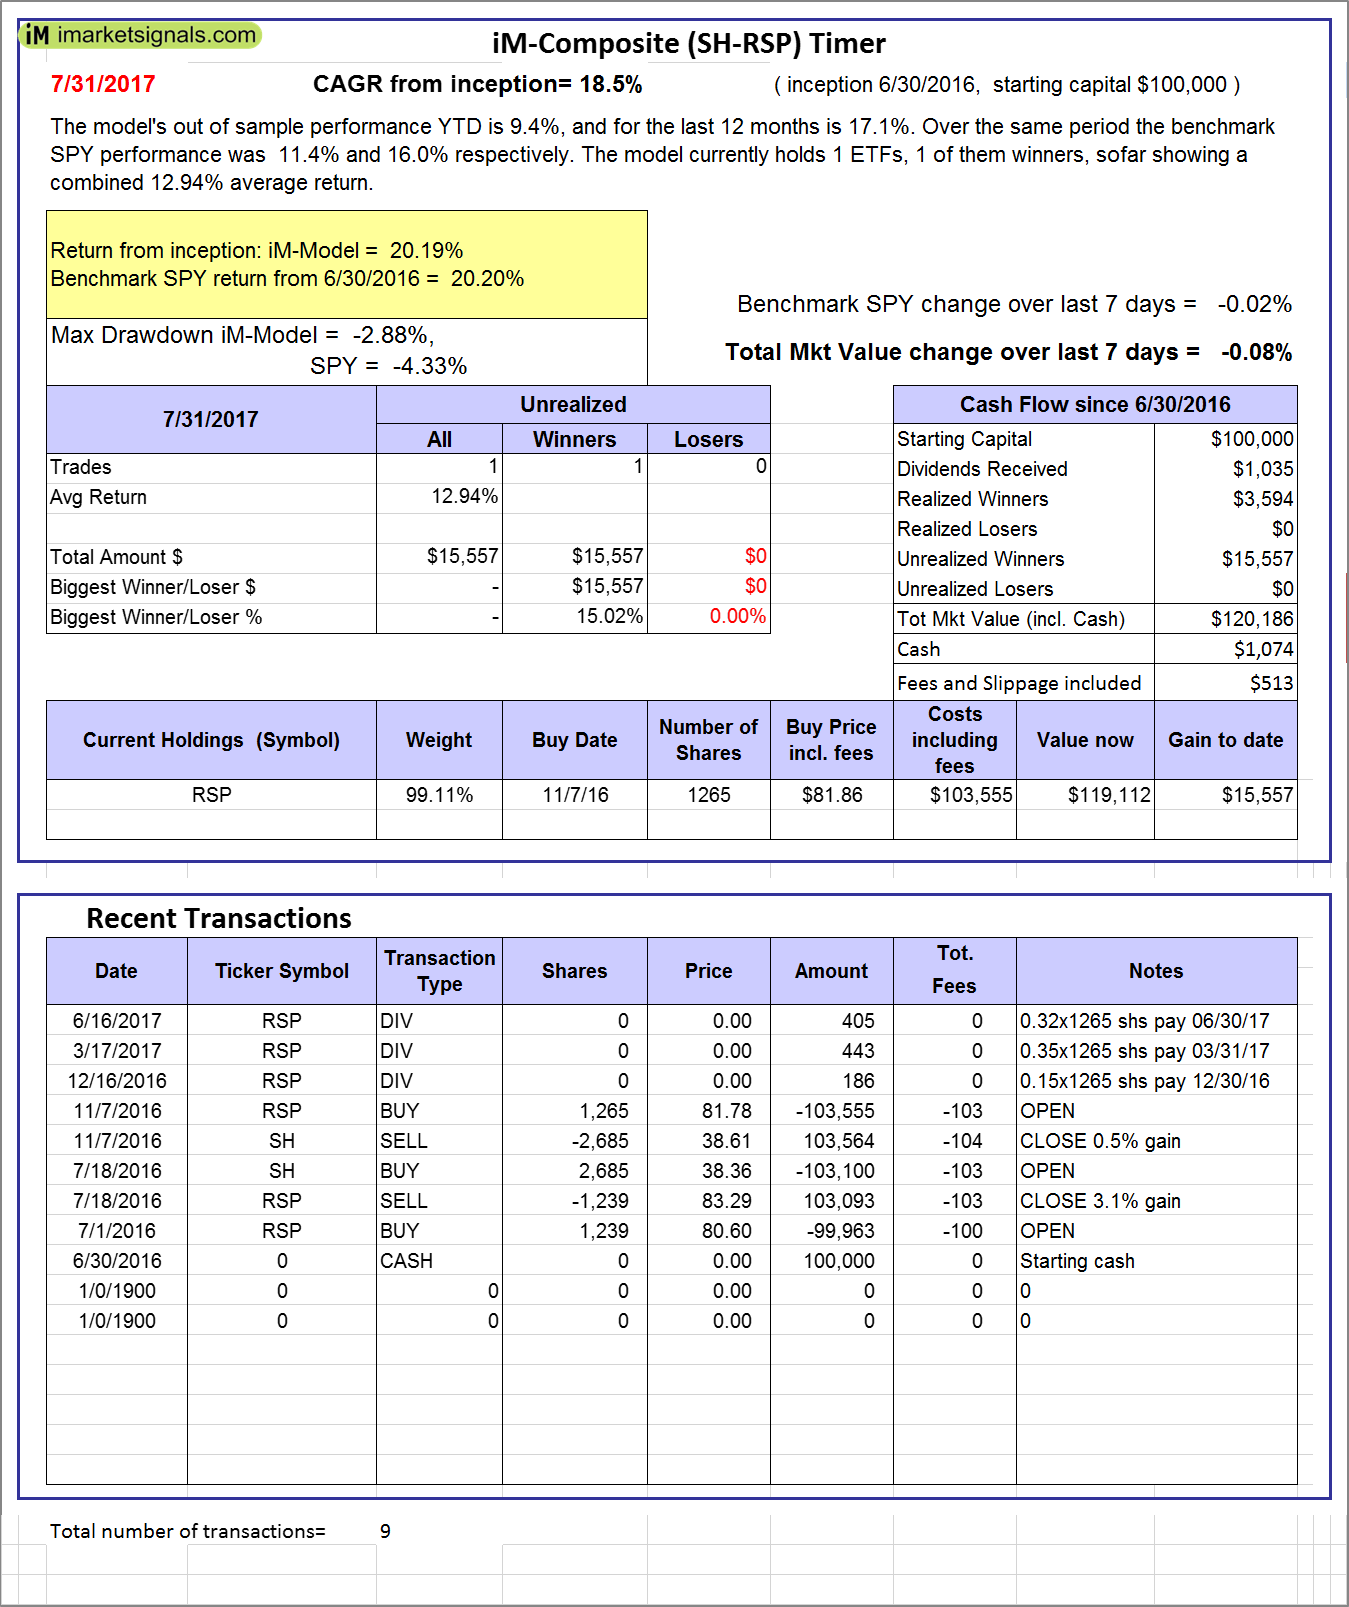 |
iM-Composite (SH-RSP) Timer: The model’s out of sample performance YTD is 9.4%, and for the last 12 months is 17.1%. Over the same period the benchmark SPY performance was 11.4% and 16.0% respectively. Over the previous week the market value of the iM-Composite (SH-RSP) Timer gained -0.08% at a time when SPY gained -0.02%. A starting capital of $100,000 at inception on 6/30/2016 would have grown to $120,186 which includes $1,074 cash and excludes $513 spent on fees and slippage. |
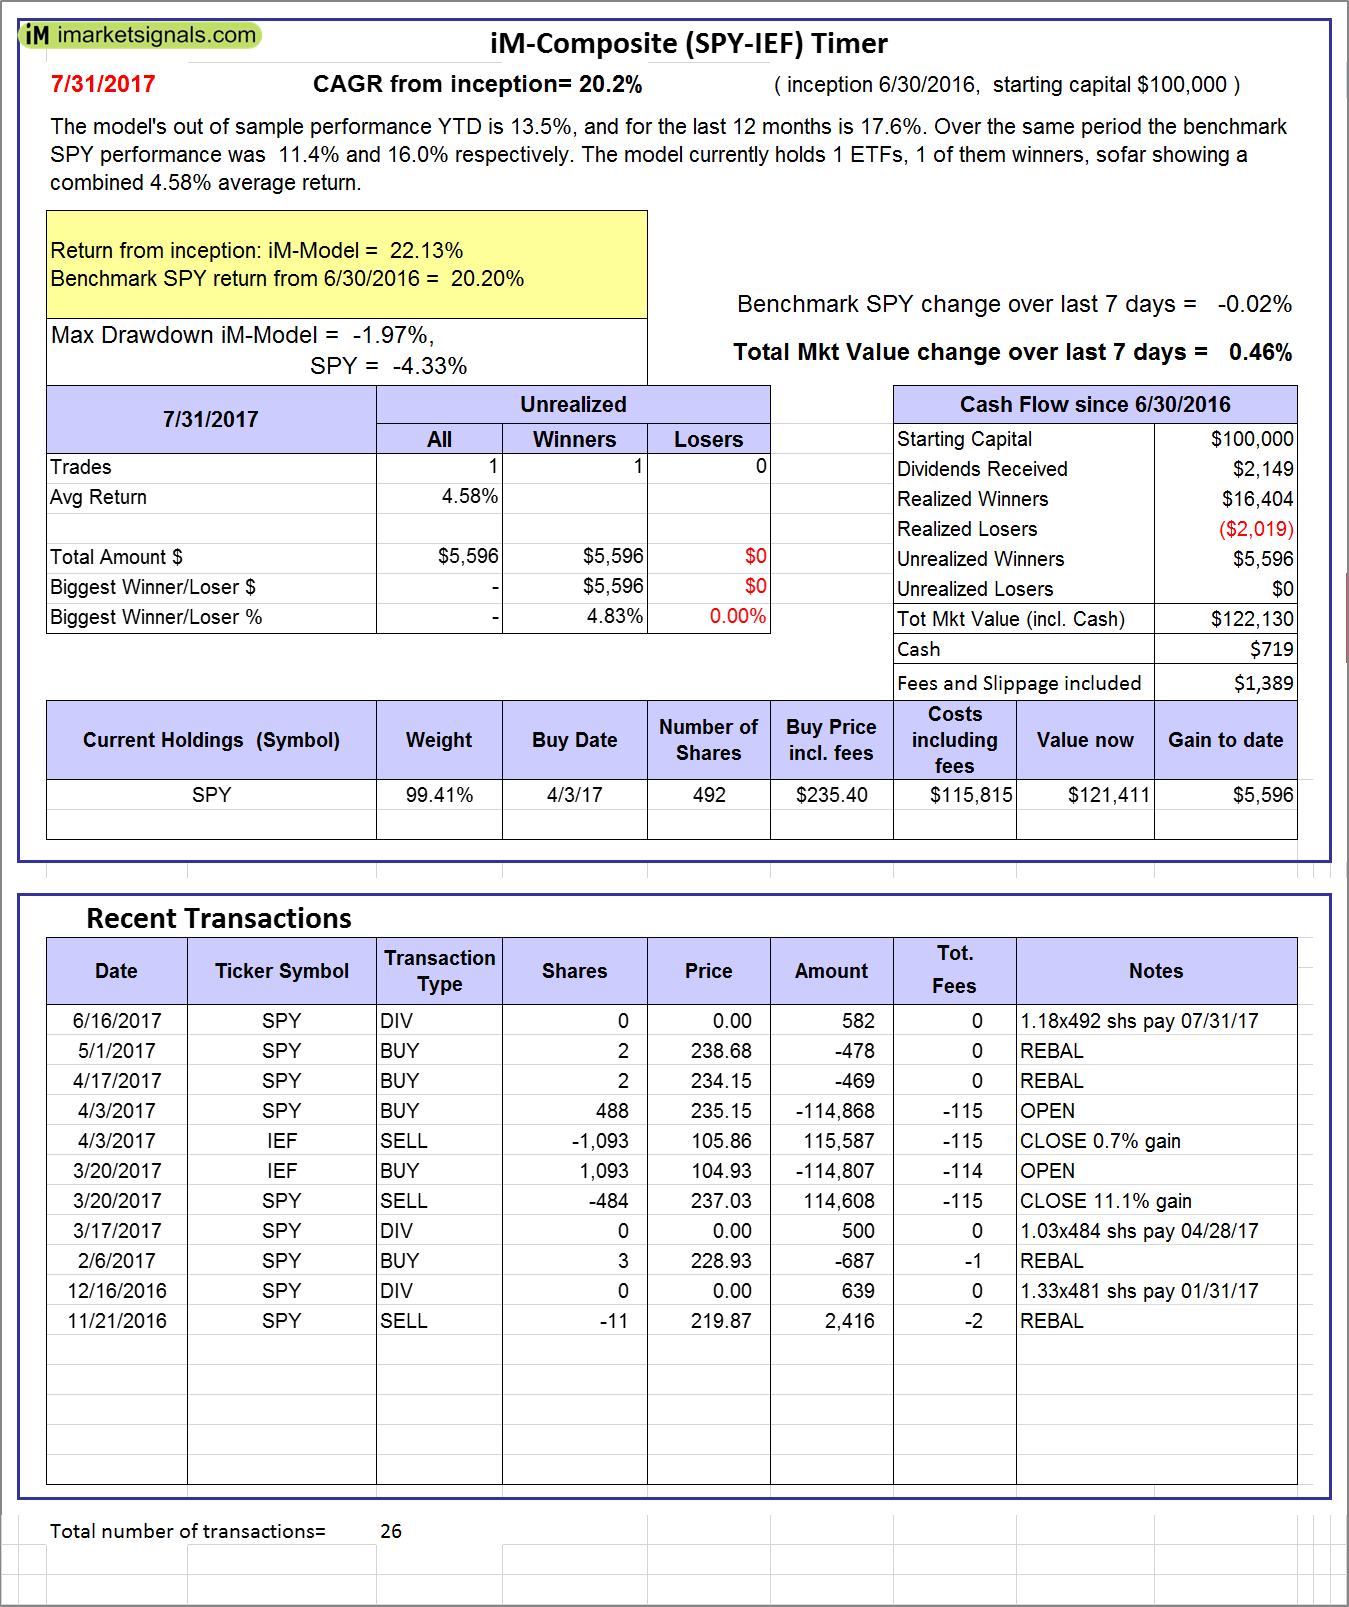 |
iM-Composite (SPY-IEF) Timer: The model’s out of sample performance YTD is 13.5%, and for the last 12 months is 17.6%. Over the same period the benchmark SPY performance was 11.4% and 16.0% respectively. Over the previous week the market value of the iM-Composite (SPY-IEF) Timer gained 0.46% at a time when SPY gained -0.02%. A starting capital of $100,000 at inception on 6/30/2016 would have grown to $122,130 which includes $719 cash and excludes $1,389 spent on fees and slippage. |
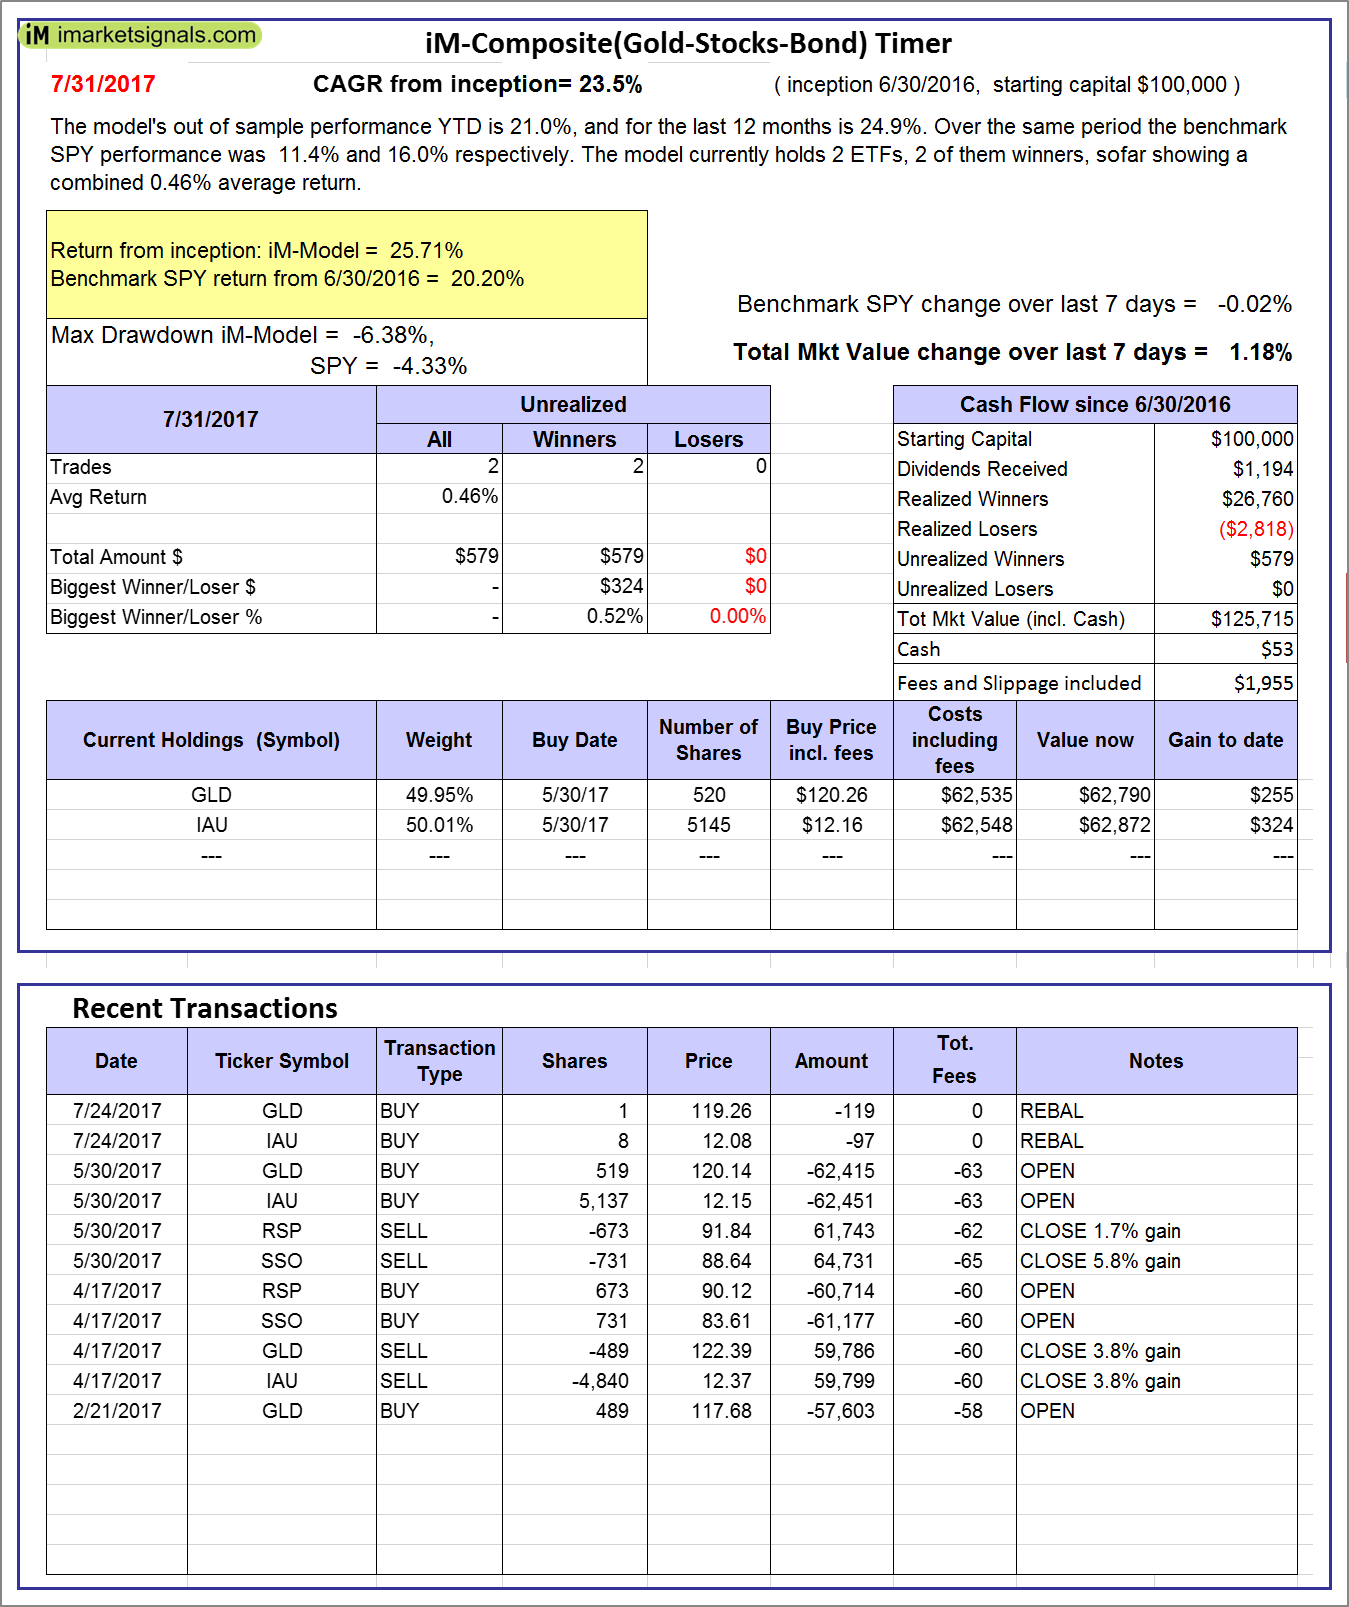 |
iM-Composite(Gold-Stocks-Bond) Timer: The model’s out of sample performance YTD is 21.0%, and for the last 12 months is 24.9%. Over the same period the benchmark SPY performance was 11.4% and 16.0% respectively. Over the previous week the market value of the iM-Composite(Gold-Stocks-Bond) Timer gained 1.18% at a time when SPY gained -0.02%. A starting capital of $100,000 at inception on 6/30/2016 would have grown to $125,715 which includes $53 cash and excludes $1,955 spent on fees and slippage. |
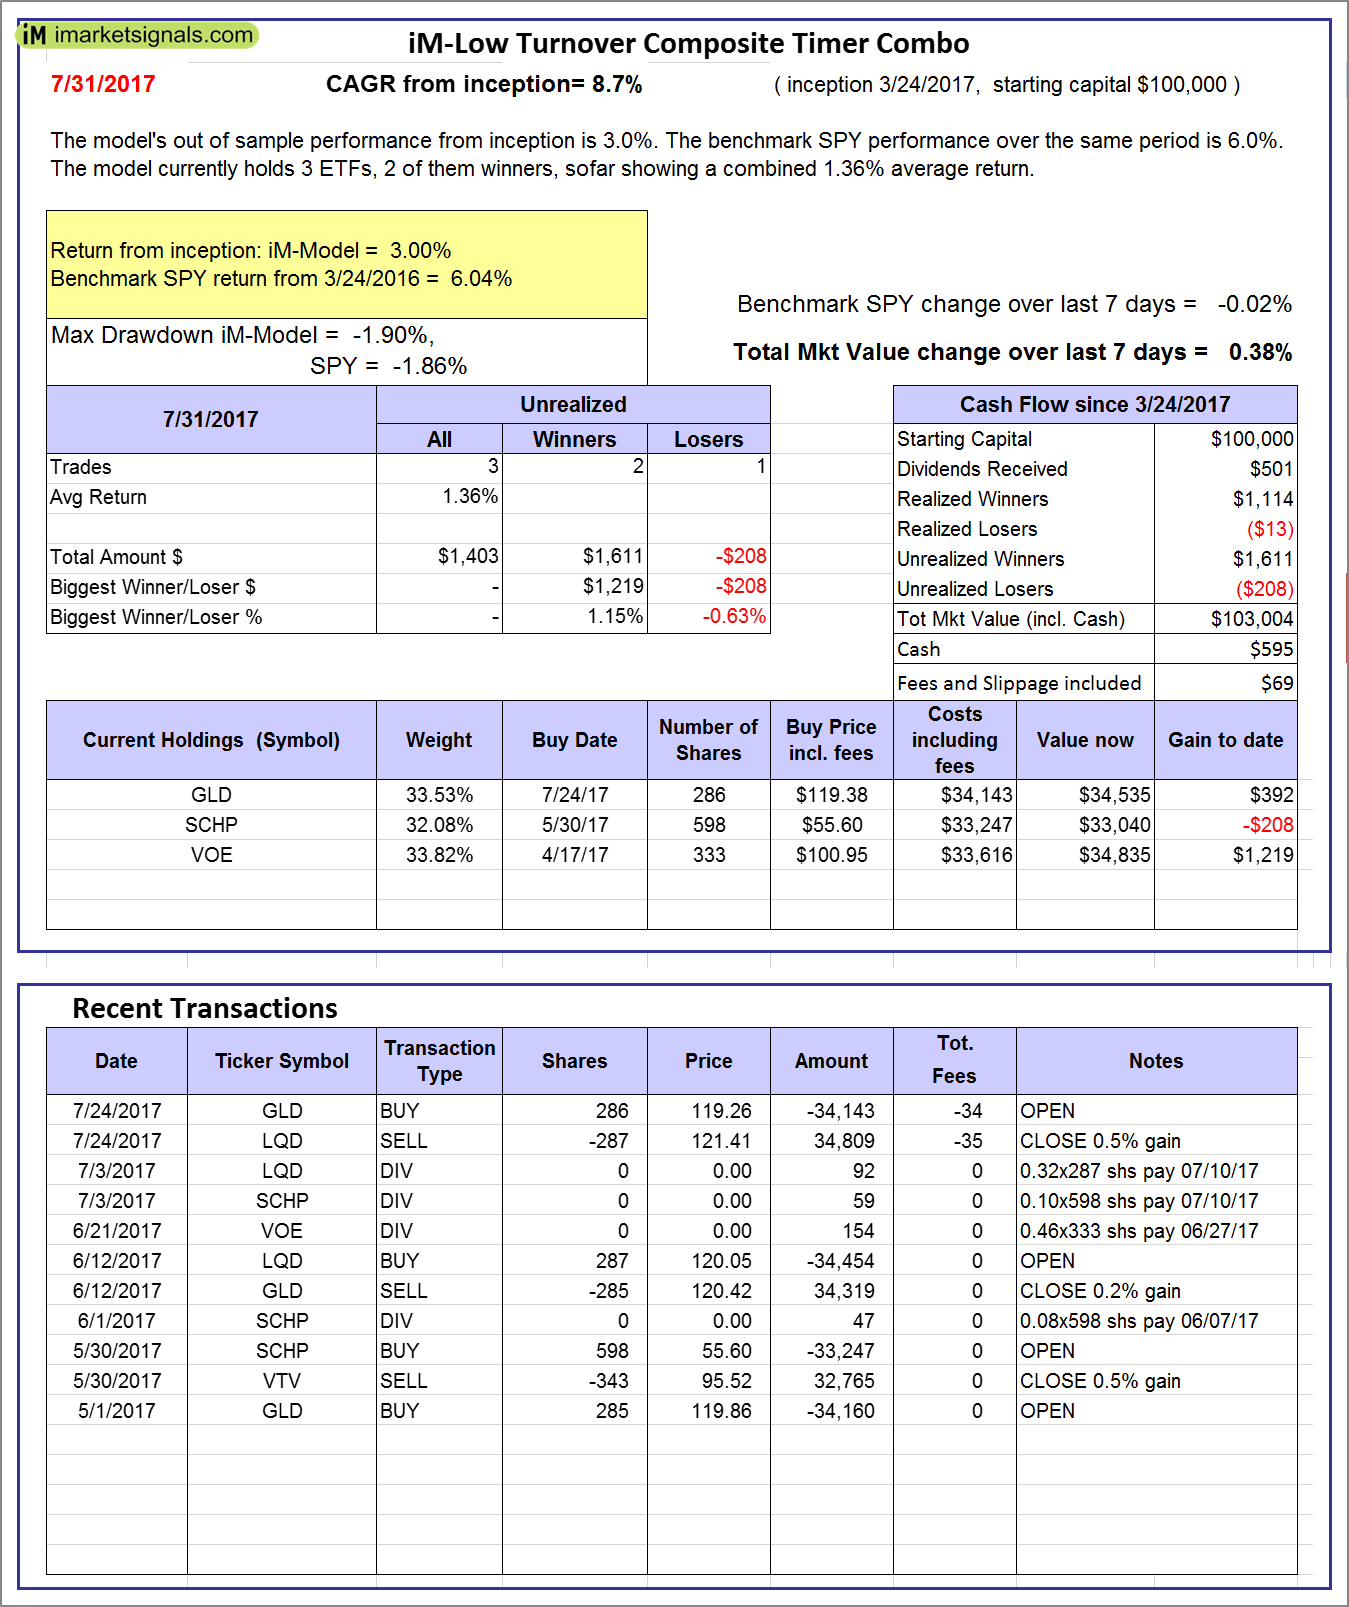 |
iM-Low Turnover Composite Timer Combo: The model’s out of sample performance from inception is 3.0%. The benchmark SPY performance over the same period is 6.0%. Over the previous week the market value of the iM-Low Turnover Composite Timer Combo gained 0.38% at a time when SPY gained -0.02%. A starting capital of $100,000 at inception on 3/24/27 would have grown to $103,004 which includes $595 cash and excludes $69 spent on fees and slippage. |
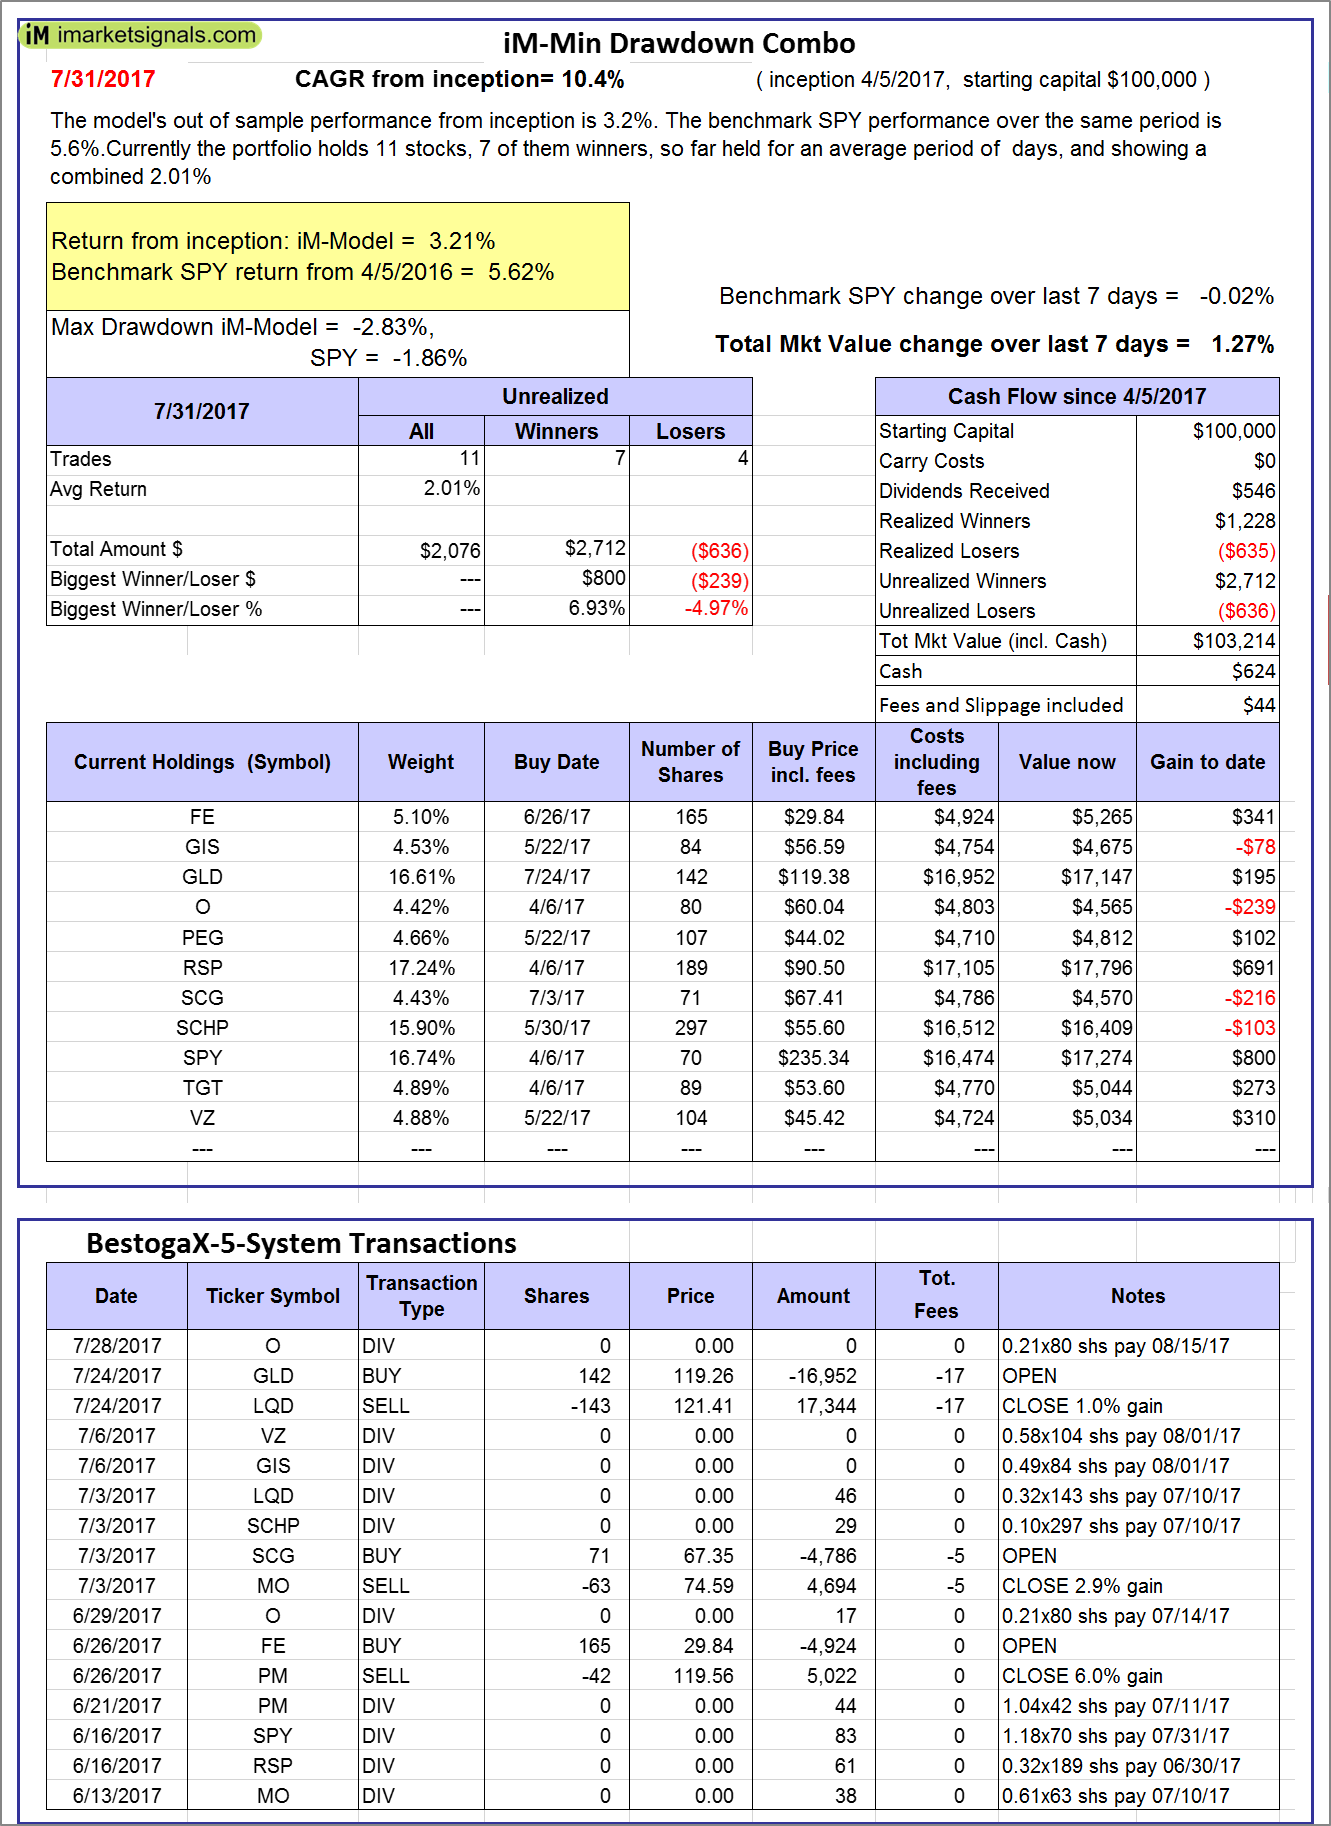 |
iM-Min Drawdown Combo: The model’s out of sample performance from inception is 3.2%. The benchmark SPY performance over the same period is 5.6%. Over the previous week the market value of the iM-Min Drawdown Combo gained 1.27% at a time when SPY gained -0.02%. A starting capital of $100,000 at inception on 4/5/2017 would have grown to $103,214 which includes $624 cash and excludes $44 spent on fees and slippage. |
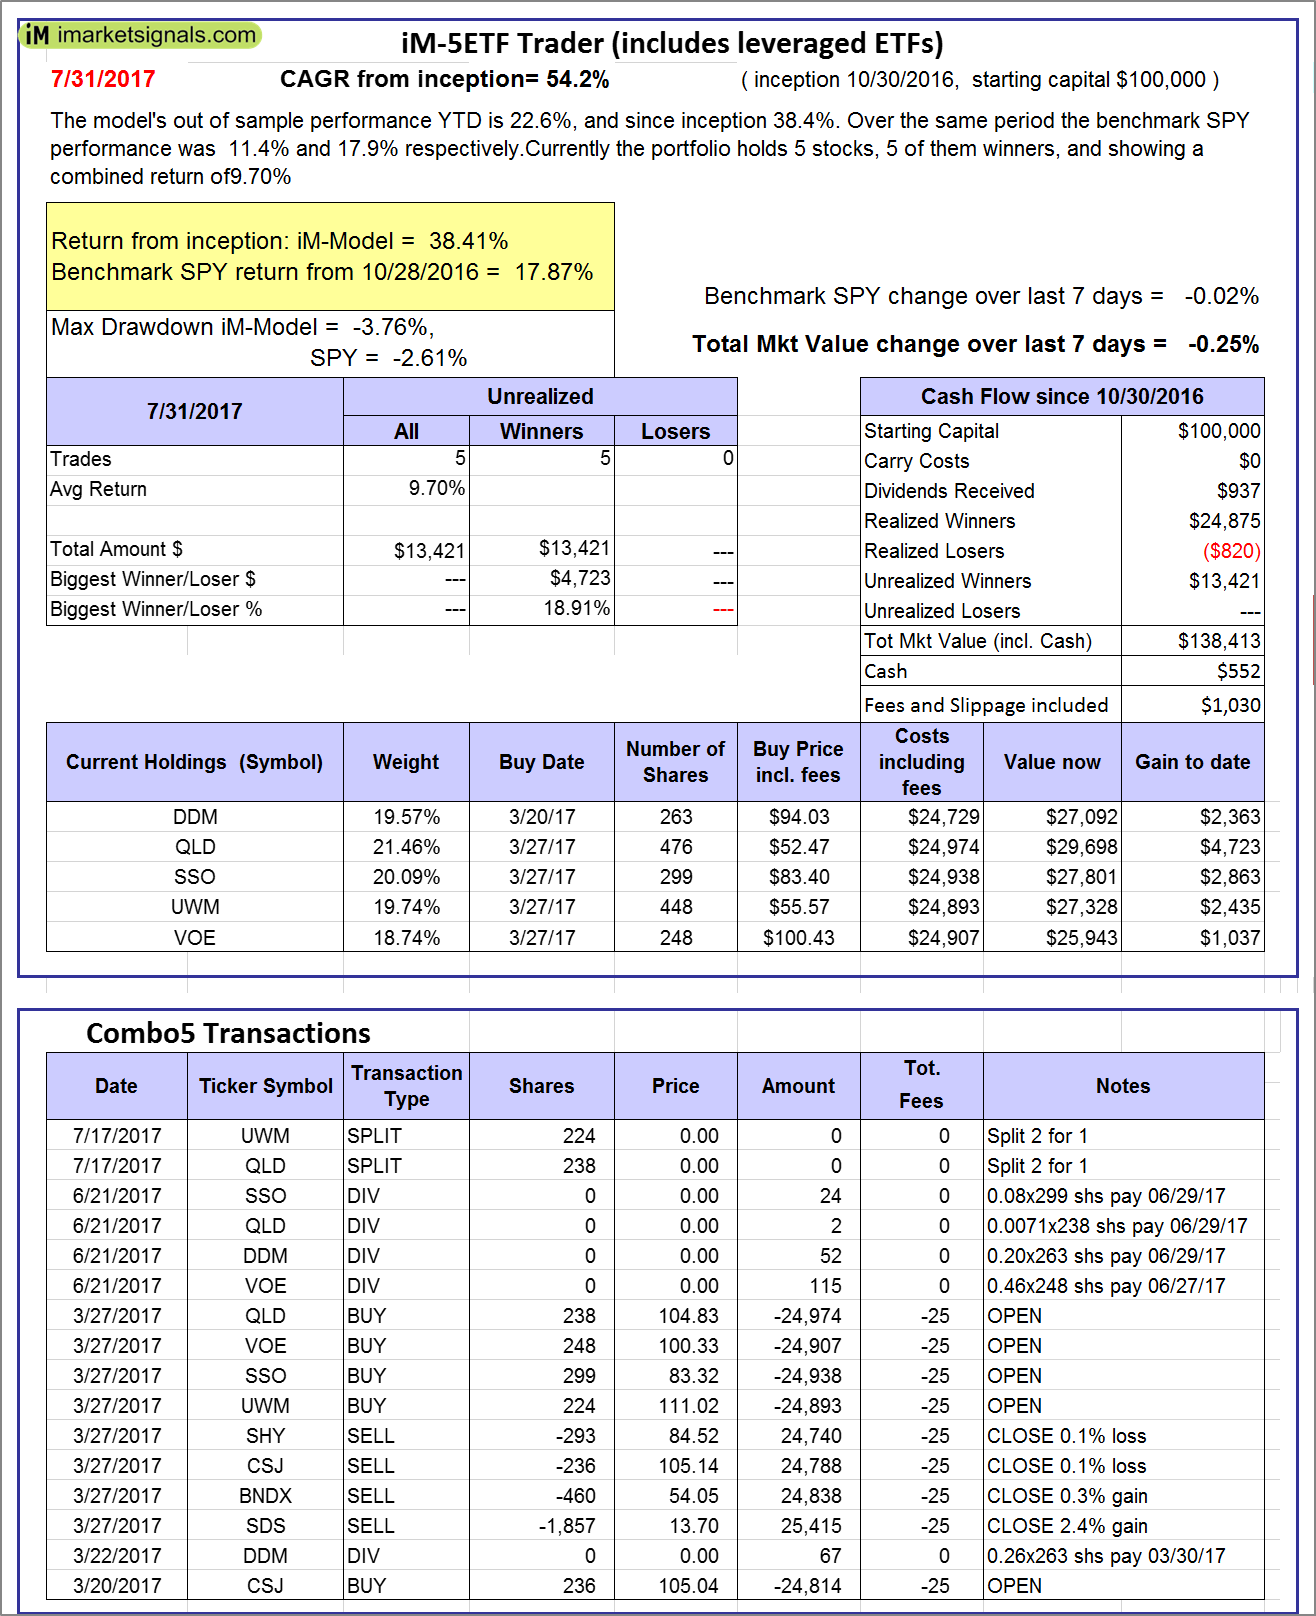 |
iM-5ETF Trader (includes leveraged ETFs): The model’s out of sample performance YTD is 12.0%, and since inception 15.2%. Over the same period the benchmark SPY performance was 11.4% and 17.9% respectively. Over the previous week the market value of the iM-5ETF Trader (includes leveraged ETFs) gained -0.25% at a time when SPY gained -0.02%. A starting capital of $100,000 at inception on 10/30/2016 would have grown to $138,413 which includes $552 cash and excludes $1,030 spent on fees and slippage. |
 |
iM-Standard 5ETF Trader (excludes leveraged ETFs): The model’s out of sample performance YTD is 12.0%, and since inception 15.2%. Over the same period the benchmark SPY performance was 11.4% and 17.9% respectively. Over the previous week the market value of the iM-Standard 5ETF Trader (excludes leveraged ETFs) gained -0.10% at a time when SPY gained -0.02%. A starting capital of $100,000 at inception on 10/30/2016 would have grown to $115,194 which includes $863 cash and excludes $880 spent on fees and slippage. |
iM-Best Reports – 7/31/2017
Posted in pmp SPY-SH
Leave a Reply
You must be logged in to post a comment.