  |
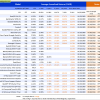
Out of sample performance summary of our models for the past 1, 2, 4 and 13 week periods. The active active return indicates how the models over- or underperformed the benchmark ETF SPY. Also the YTD, and the 1-, 3-, 5- and 10-year annualized returns are shown in the second table |
|
|
iM-Best(SPY-SH).R1: The model’s out of sample performance YTD is 12.5%, and for the last 12 months is 15.9%. Over the same period the benchmark SPY performance was 11.9% and 15.9% respectively. Over the previous week the market value of Best(SPY-SH) gained 0.44% at a time when SPY gained 0.45%. A starting capital of $100,000 at inception on 1/2/2009 would have grown to $520,223 which includes $4,654 cash and excludes $15,358 spent on fees and slippage. |
|
|
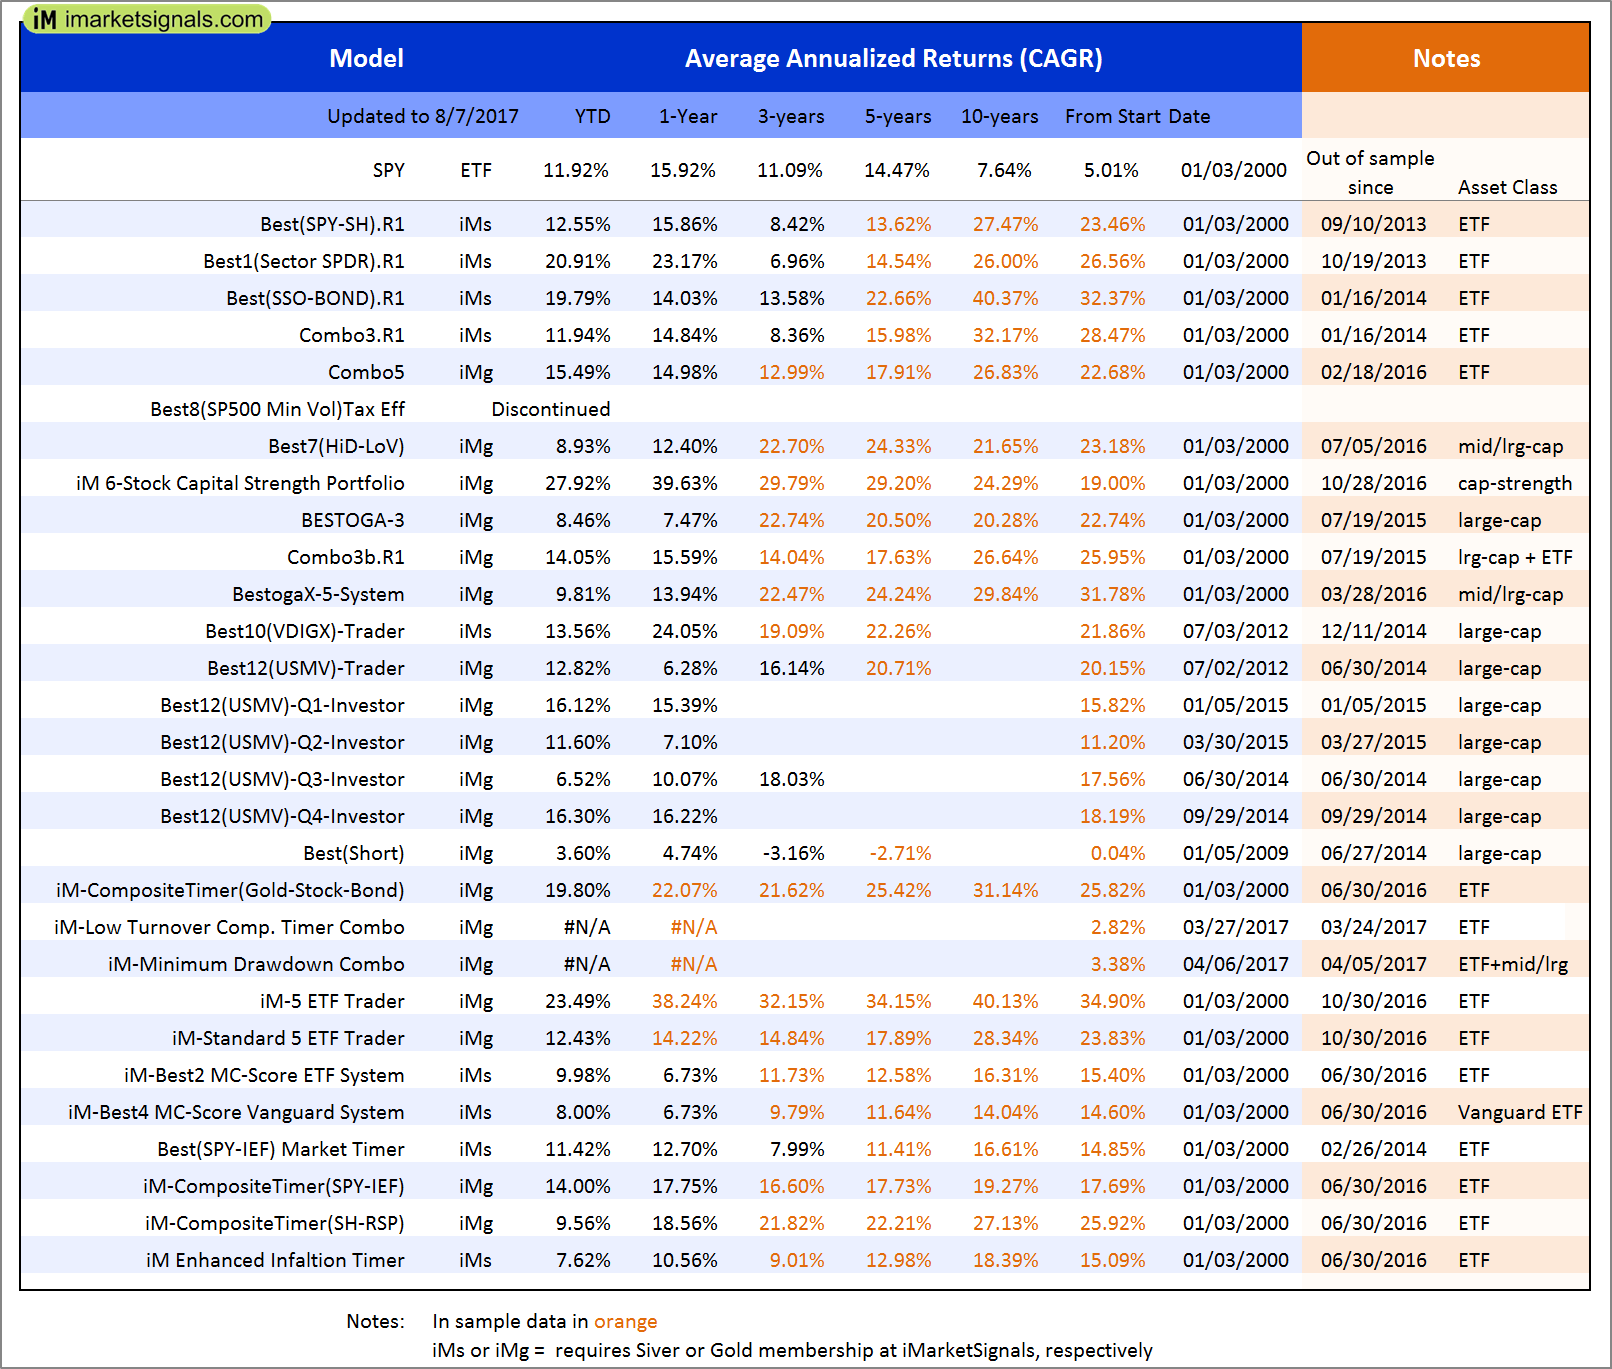
iM-Combo3.R1: The model’s out of sample performance YTD is 11.9%, and for the last 12 months is 14.8%. Over the same period the benchmark SPY performance was 11.9% and 15.9% respectively. Over the previous week the market value of iM-Combo3.R1 gained 0.89% at a time when SPY gained 0.45%. A starting capital of $100,000 at inception on 2/3/2014 would have grown to $140,661 which includes -$997 cash and excludes $3,437 spent on fees and slippage. |
|
|
iM-Combo5: The model’s out of sample performance YTD is 15.5%, and for the last 12 months is 15.0%. Over the same period the benchmark SPY performance was 11.9% and 15.9% respectively. Over the previous week the market value of iM-Combo5 gained 1.00% at a time when SPY gained 0.45%. A starting capital of $100,000 at inception on 2/22/2016 would have grown to $113,911 which includes -$21 cash and excludes $599 spent on fees and slippage. |
|
|
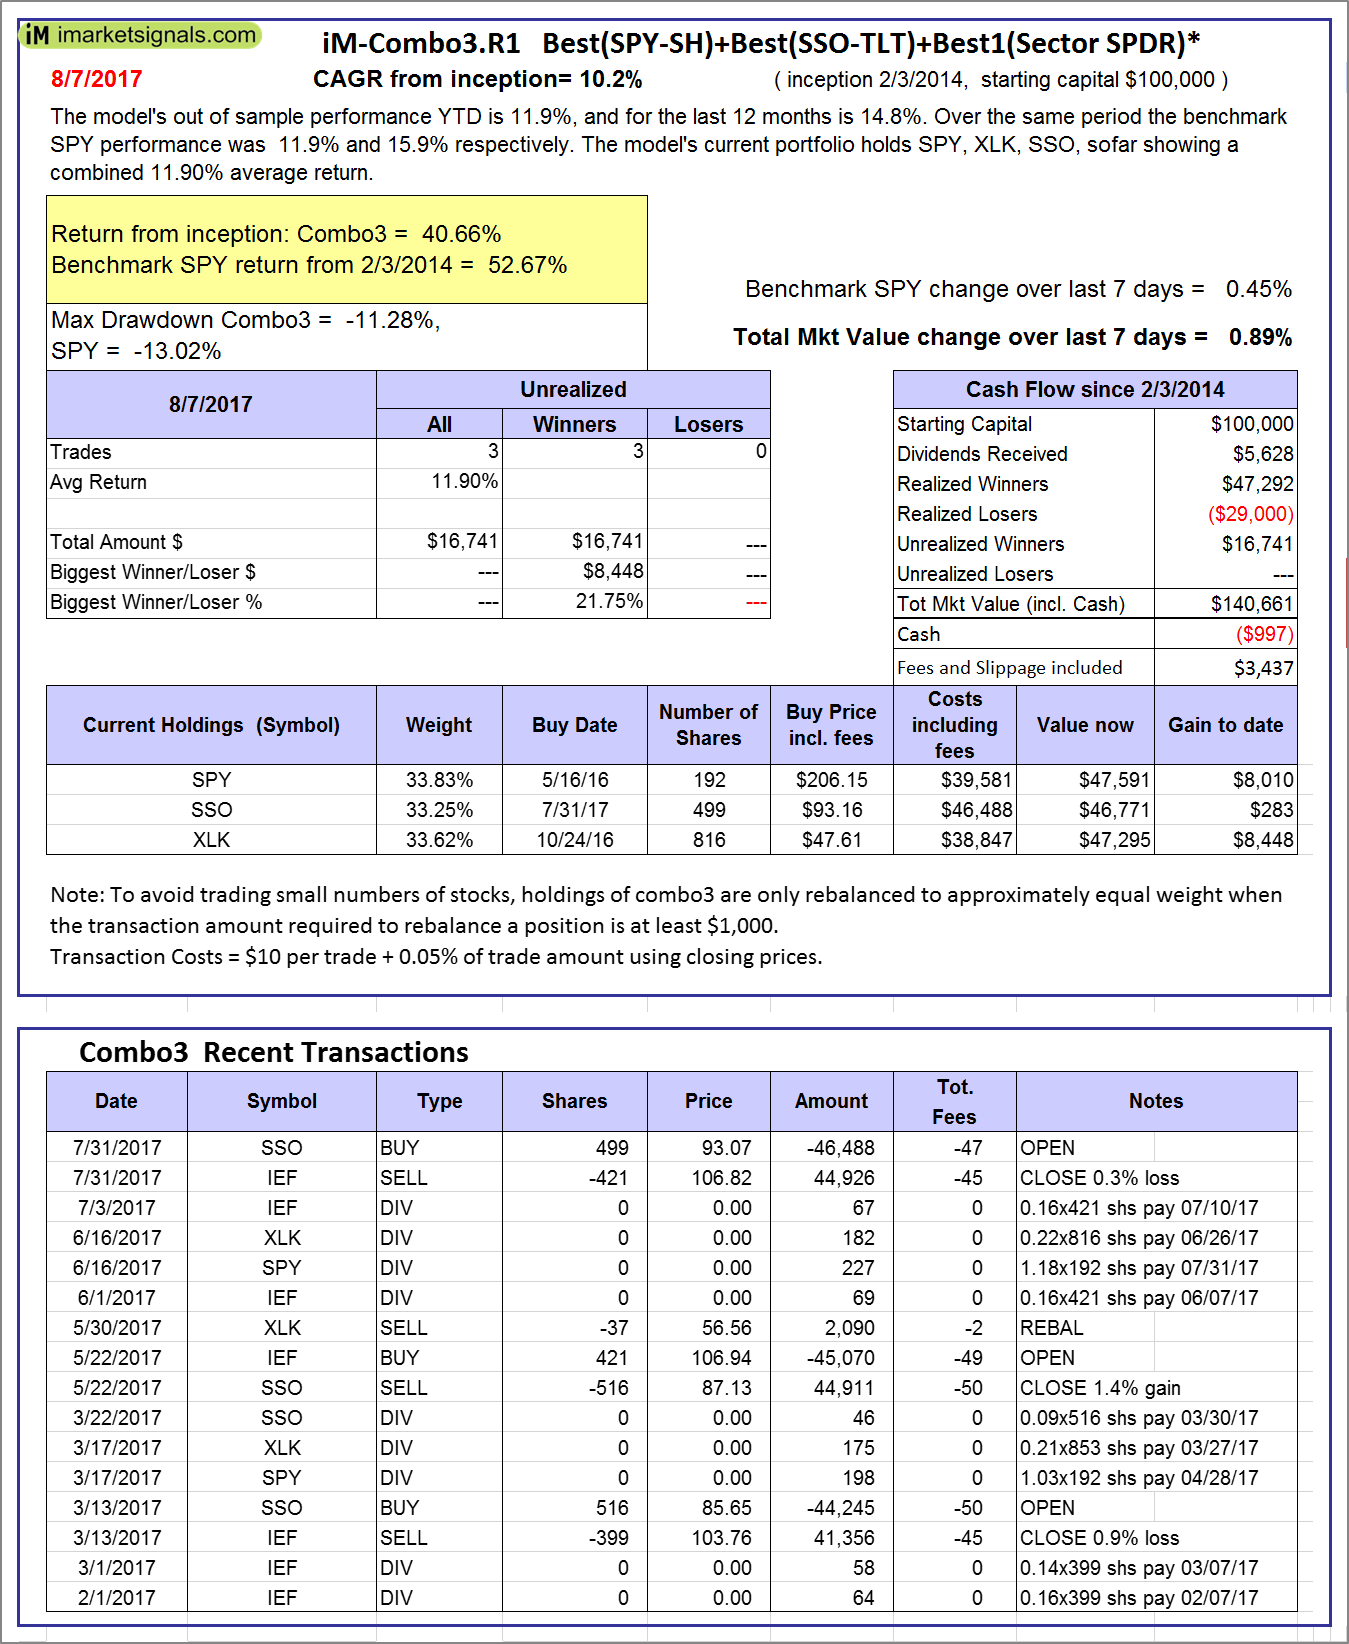
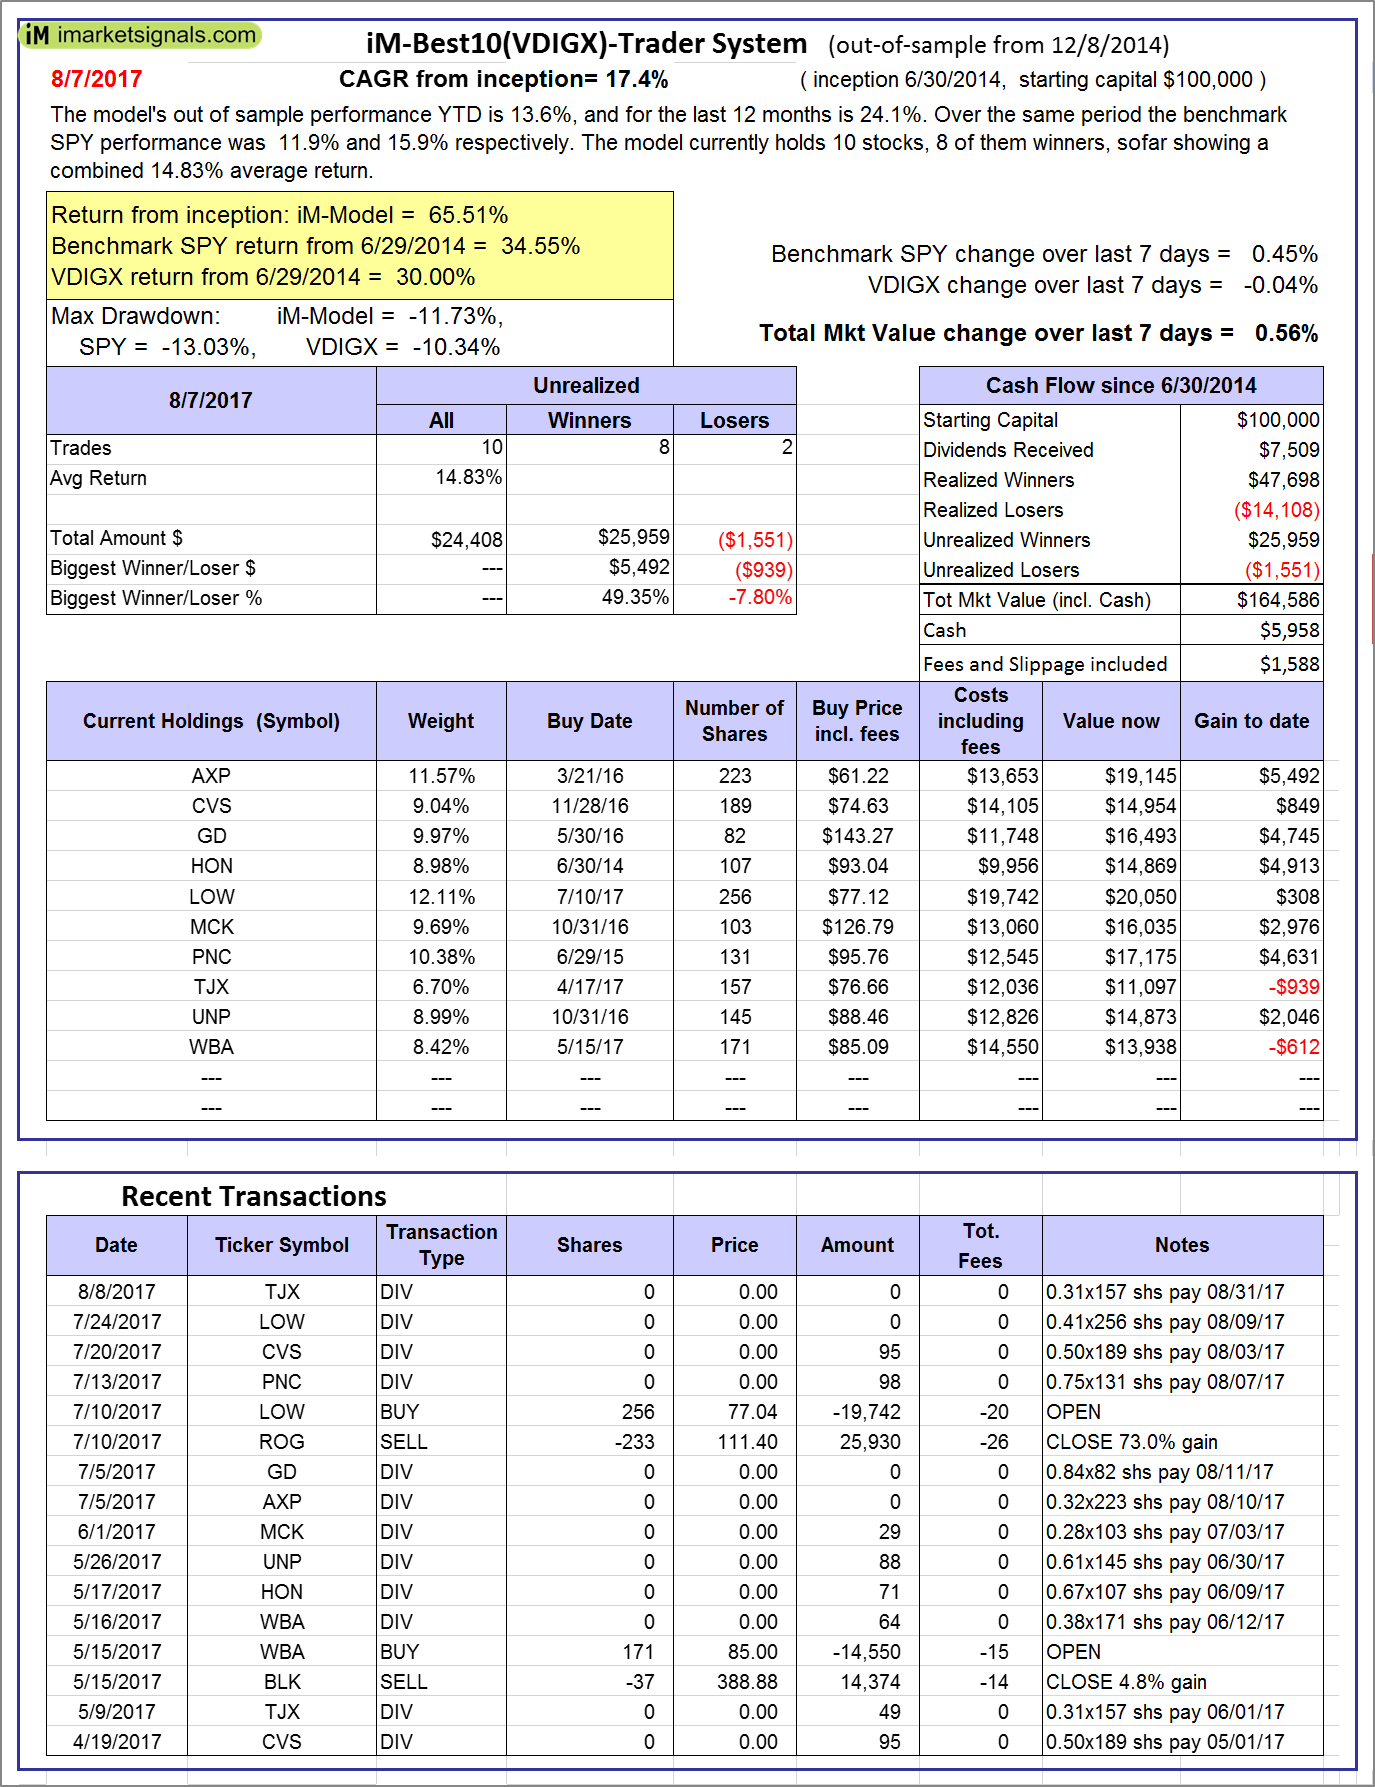
iM-Best10(VDIGX)-Trader: The model’s out of sample performance YTD is 13.6%, and for the last 12 months is 24.1%. Over the same period the benchmark SPY performance was 11.9% and 15.9% respectively. Since inception, on 7/1/2014, the model gained 65.51% while the benchmark SPY gained 34.55% and VDIGX gained 30.00% over the same period. Over the previous week the market value of iM-Best10(VDIGX) gained 0.56% at a time when SPY gained 0.45%. A starting capital of $100,000 at inception on 7/1/2014 would have grown to $164,586 which includes $5,958 cash and excludes $1,588 spent on fees and slippage. |
|
|
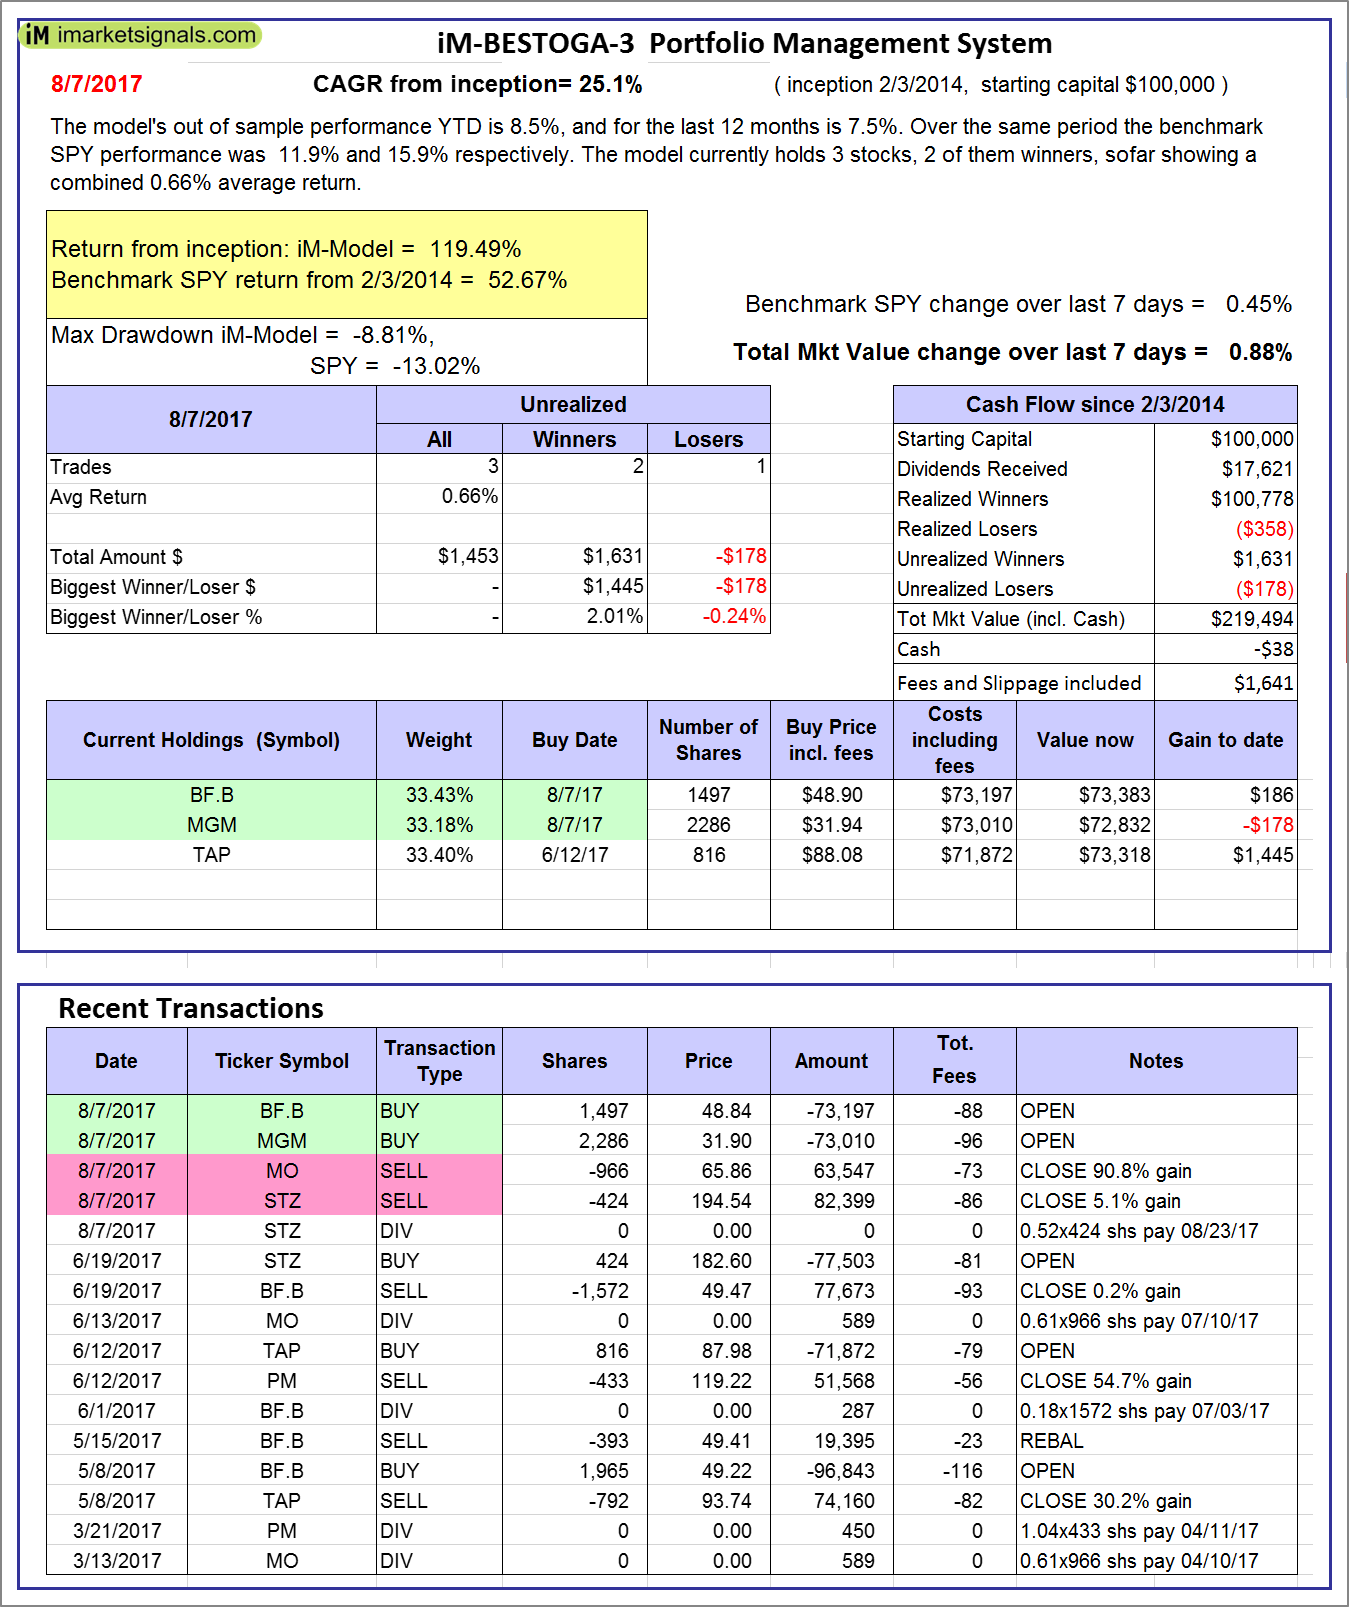
iM-BESTOGA-3: The model’s out of sample performance YTD is 8.5%, and for the last 12 months is 7.5%. Over the same period the benchmark SPY performance was 11.9% and 15.9% respectively. Over the previous week the market value of iM-BESTOGA-3 gained 0.88% at a time when SPY gained 0.45%. A starting capital of $100,000 at inception on 2/3/2014 would have grown to $219,494 which includes -$38 cash and excludes $1,641 spent on fees and slippage. |
|
|
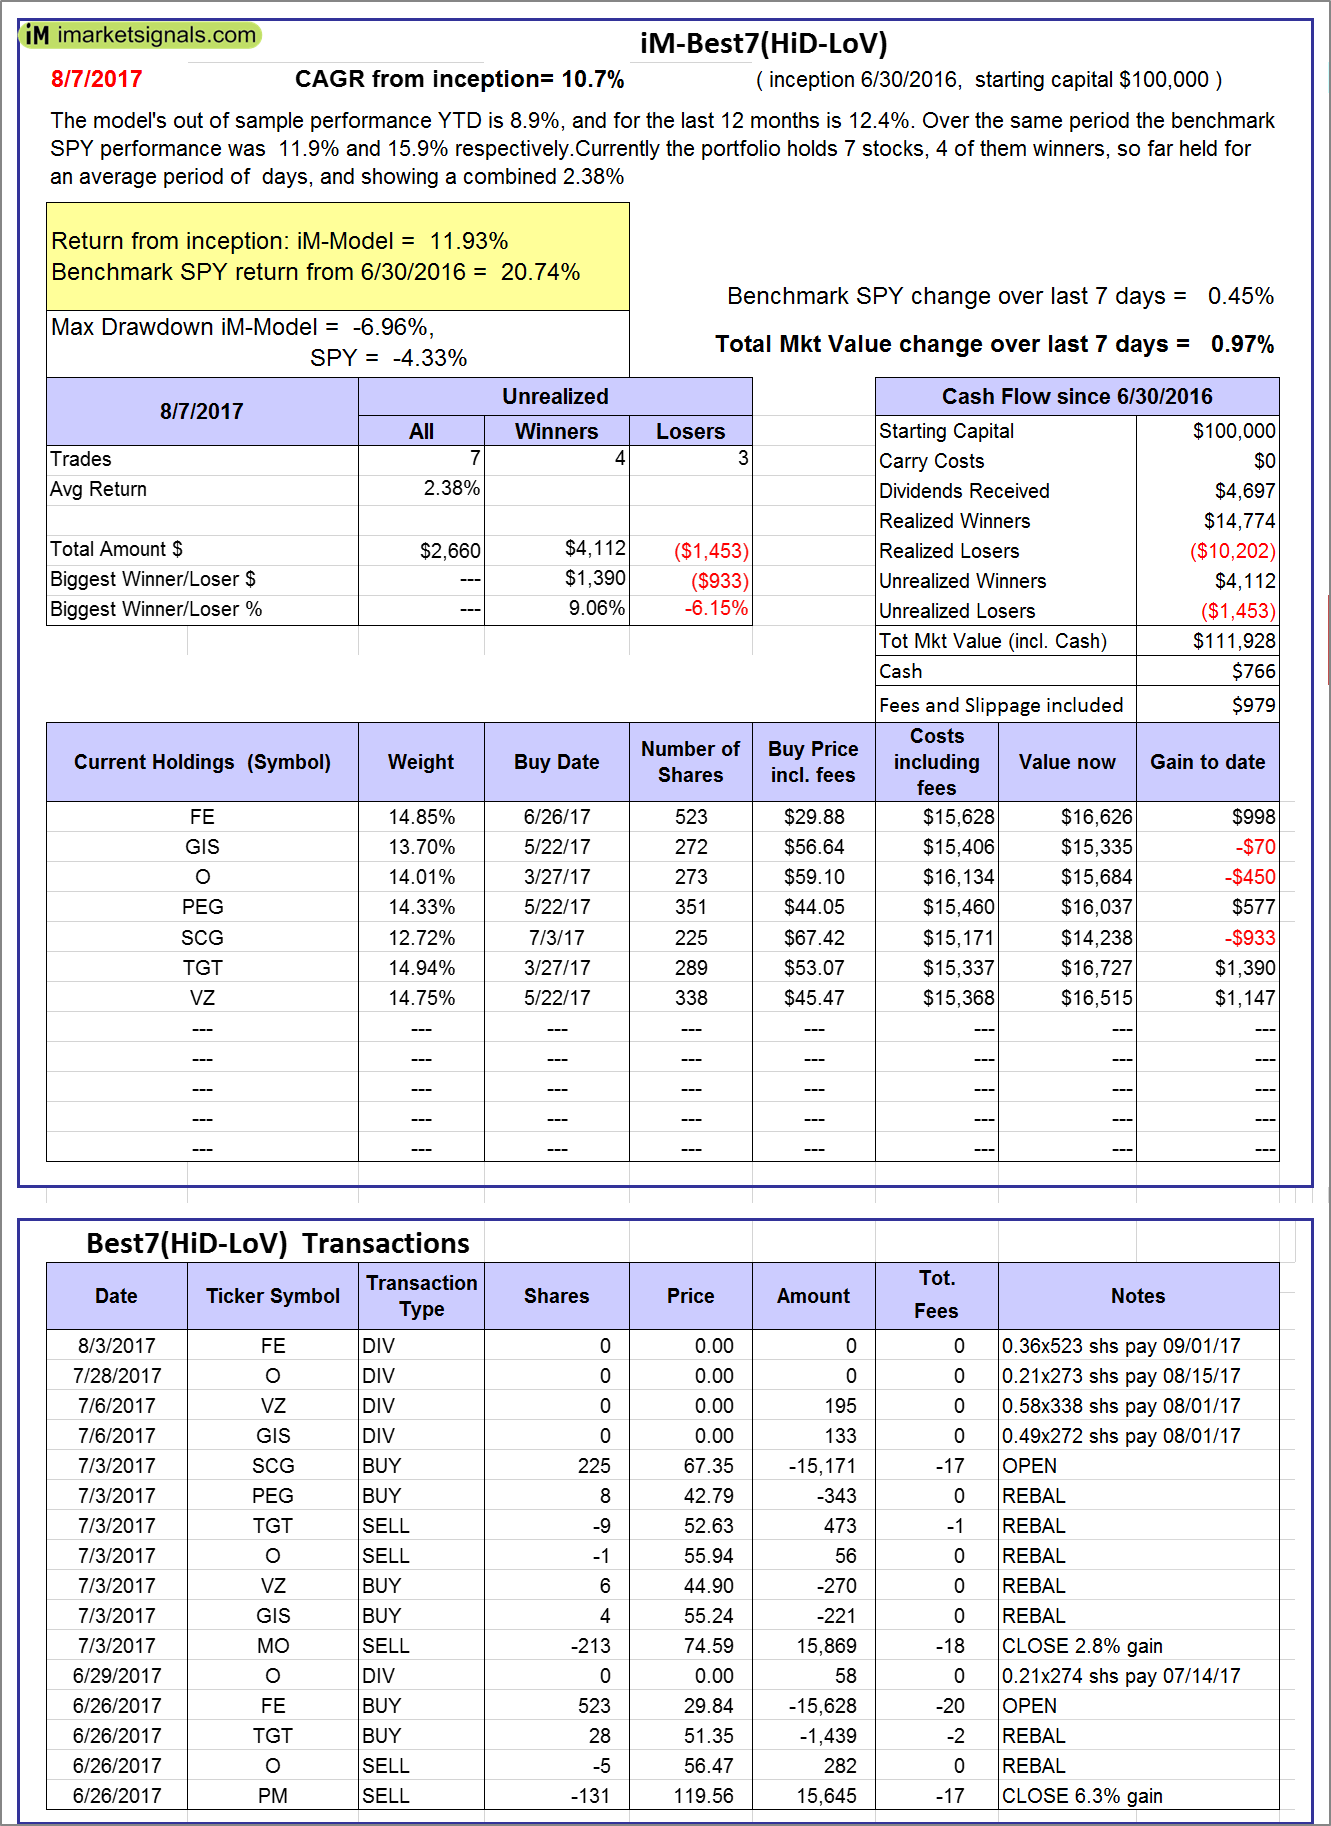
iM-Best7(HiD-LoV): The model’s out of sample performance YTD is 8.9%, and for the last 12 months is 12.4%. Over the same period the benchmark SPY performance was 11.9% and 15.9% respectively. Over the previous week the market value of iM-BESTOGA-3 gained 0.97% at a time when SPY gained 0.45%. A starting capital of $100,000 at inception on 6/30/2016 would have grown to $111,928 which includes $766 cash and excludes $979 spent on fees and slippage. |
|
|
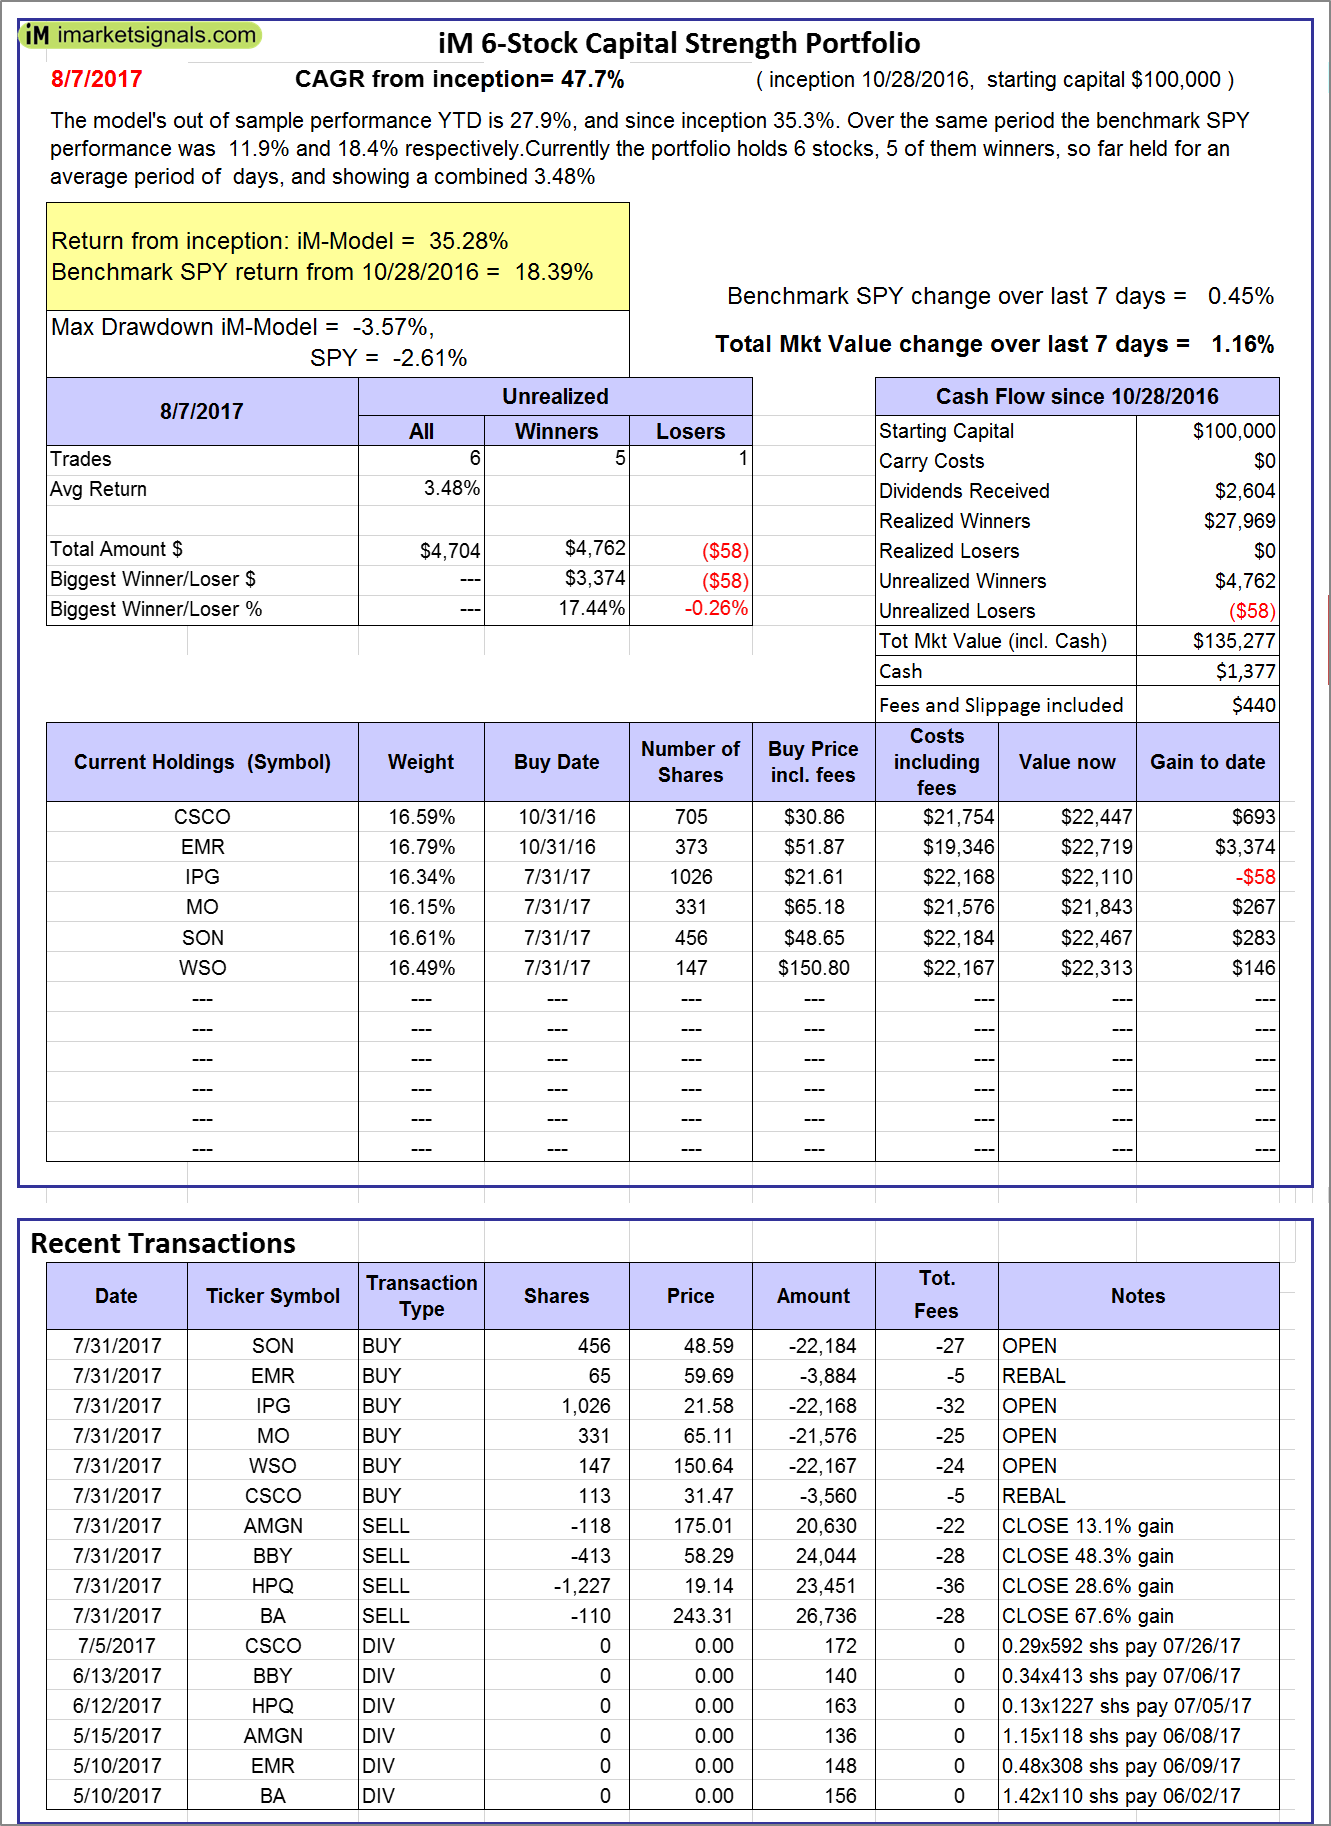
iM 6-Stock Capital Strength Portfolio: The model’s out of sample performance YTD is 27.9%, and since inception 35.3%. Over the same period the benchmark SPY performance was 11.9% and 18.4% respectively. Over the previous week the market value of the iM 6-Stock Capital Strength Portfolio gained 1.16% at a time when SPY gained 0.45%. A starting capital of $100,000 at inception on 10/28/2016 would have grown to $135,277 which includes $1,377 cash and excludes $440 spent on fees and slippage. |
|
|
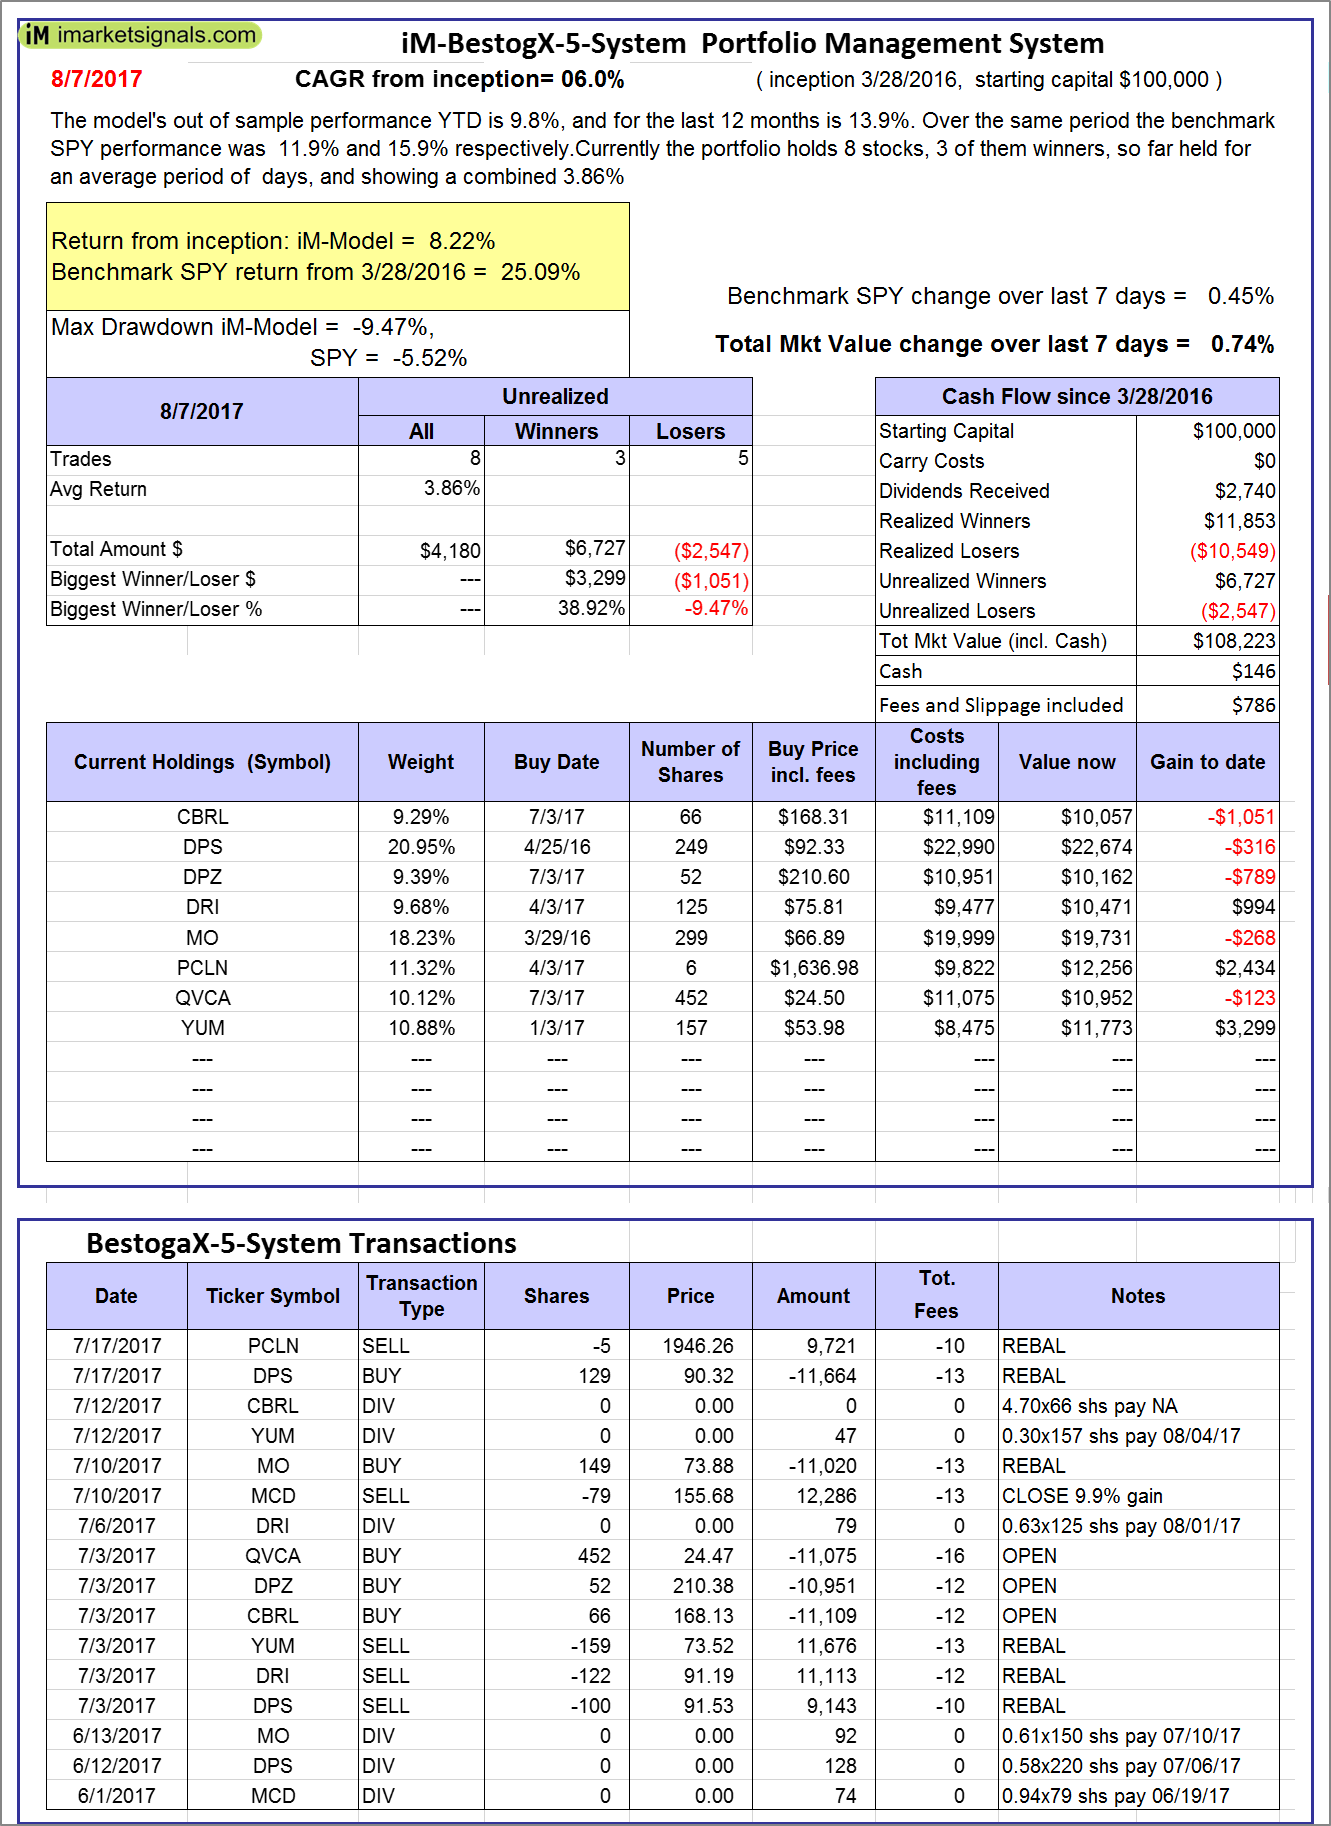
iM-BestogaX5-System: The model’s out of sample performance YTD is 9.8%, and for the last 12 months is 13.9%. Over the same period the benchmark SPY performance was 11.9% and 15.9% respectively. Over the previous week the market value of iM-Best8(S&P 500)Tax-Eff. gained 0.74% at a time when SPY gained 0.45%. A starting capital of $100,000 at inception on 3/28/2016 would have grown to $108,223 which includes $146 cash and excludes $786 spent on fees and slippage. |
|
|
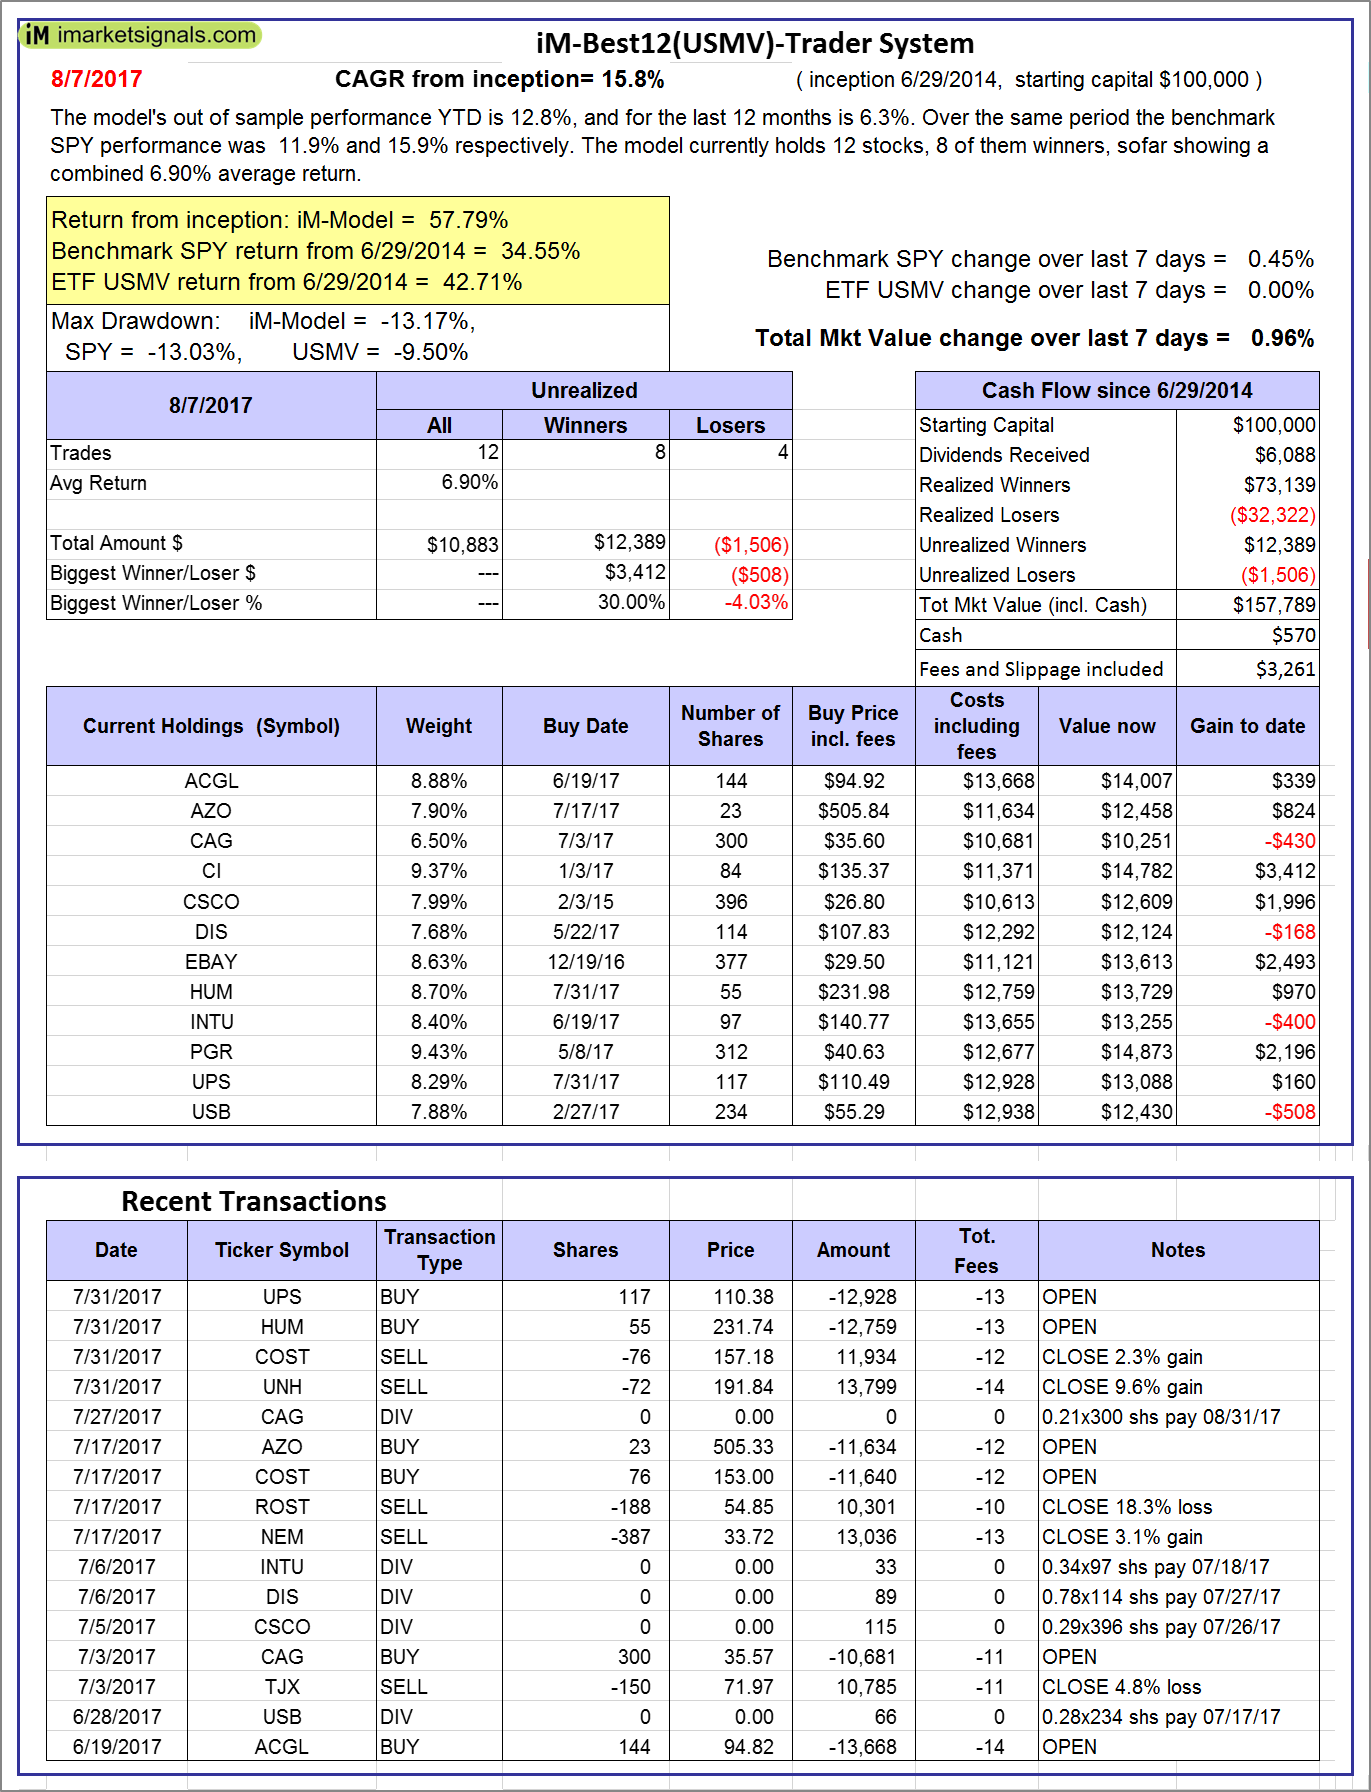
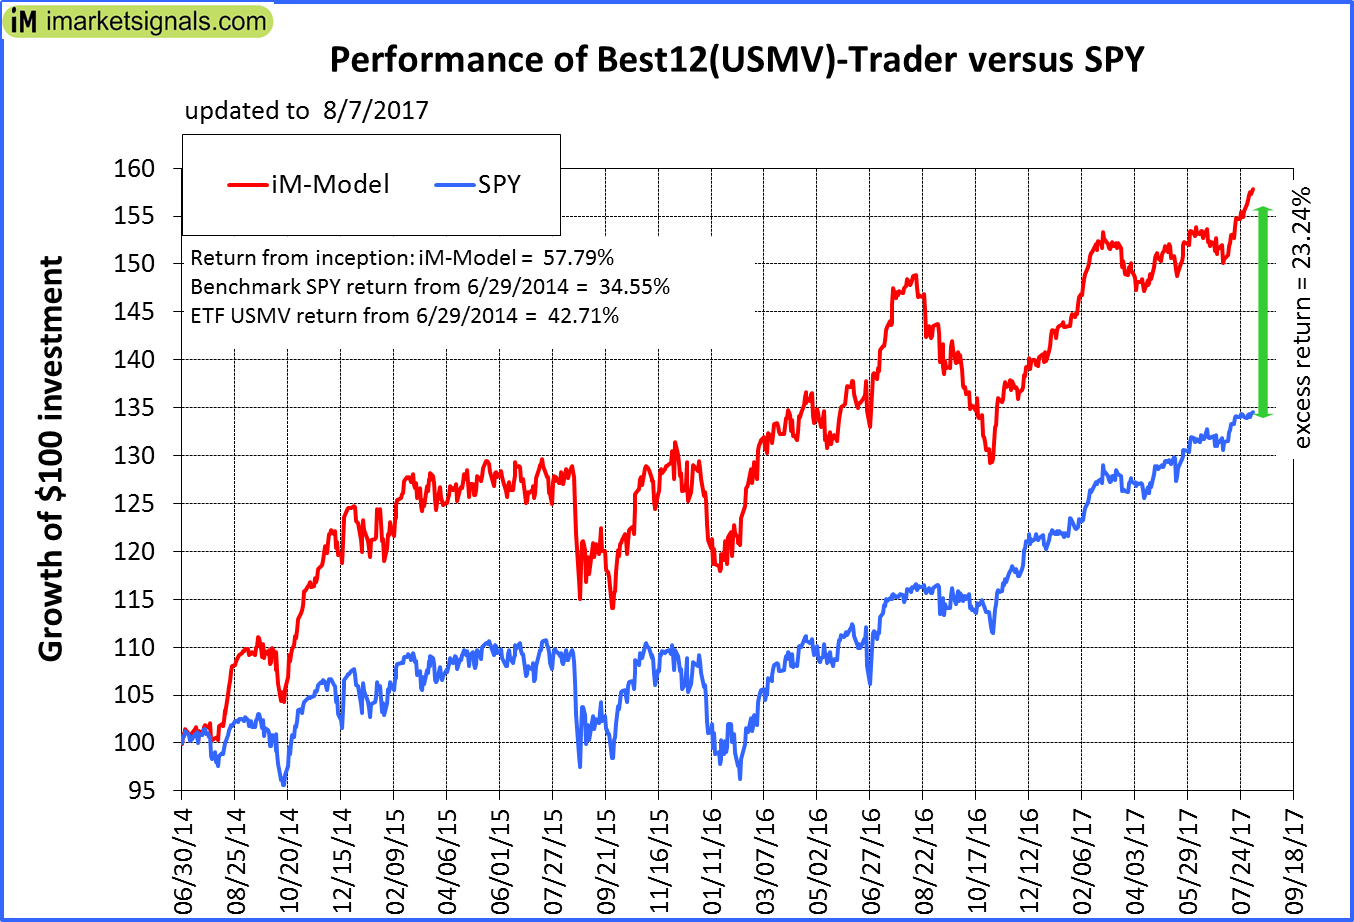
iM-Best12(USMV)-Trader: The model’s out of sample performance YTD is 12.8%, and for the last 12 months is 6.3%. Over the same period the benchmark SPY performance was 11.9% and 15.9% respectively. Since inception, on 6/30/2014, the model gained 57.79% while the benchmark SPY gained 34.55% and the ETF USMV gained 42.71% over the same period. Over the previous week the market value of iM-Best12(USMV)-Trader gained 0.96% at a time when SPY gained 0.45%. A starting capital of $100,000 at inception on 6/30/2014 would have grown to $157,789 which includes $570 cash and excludes $3,261 spent on fees and slippage. |
|
|
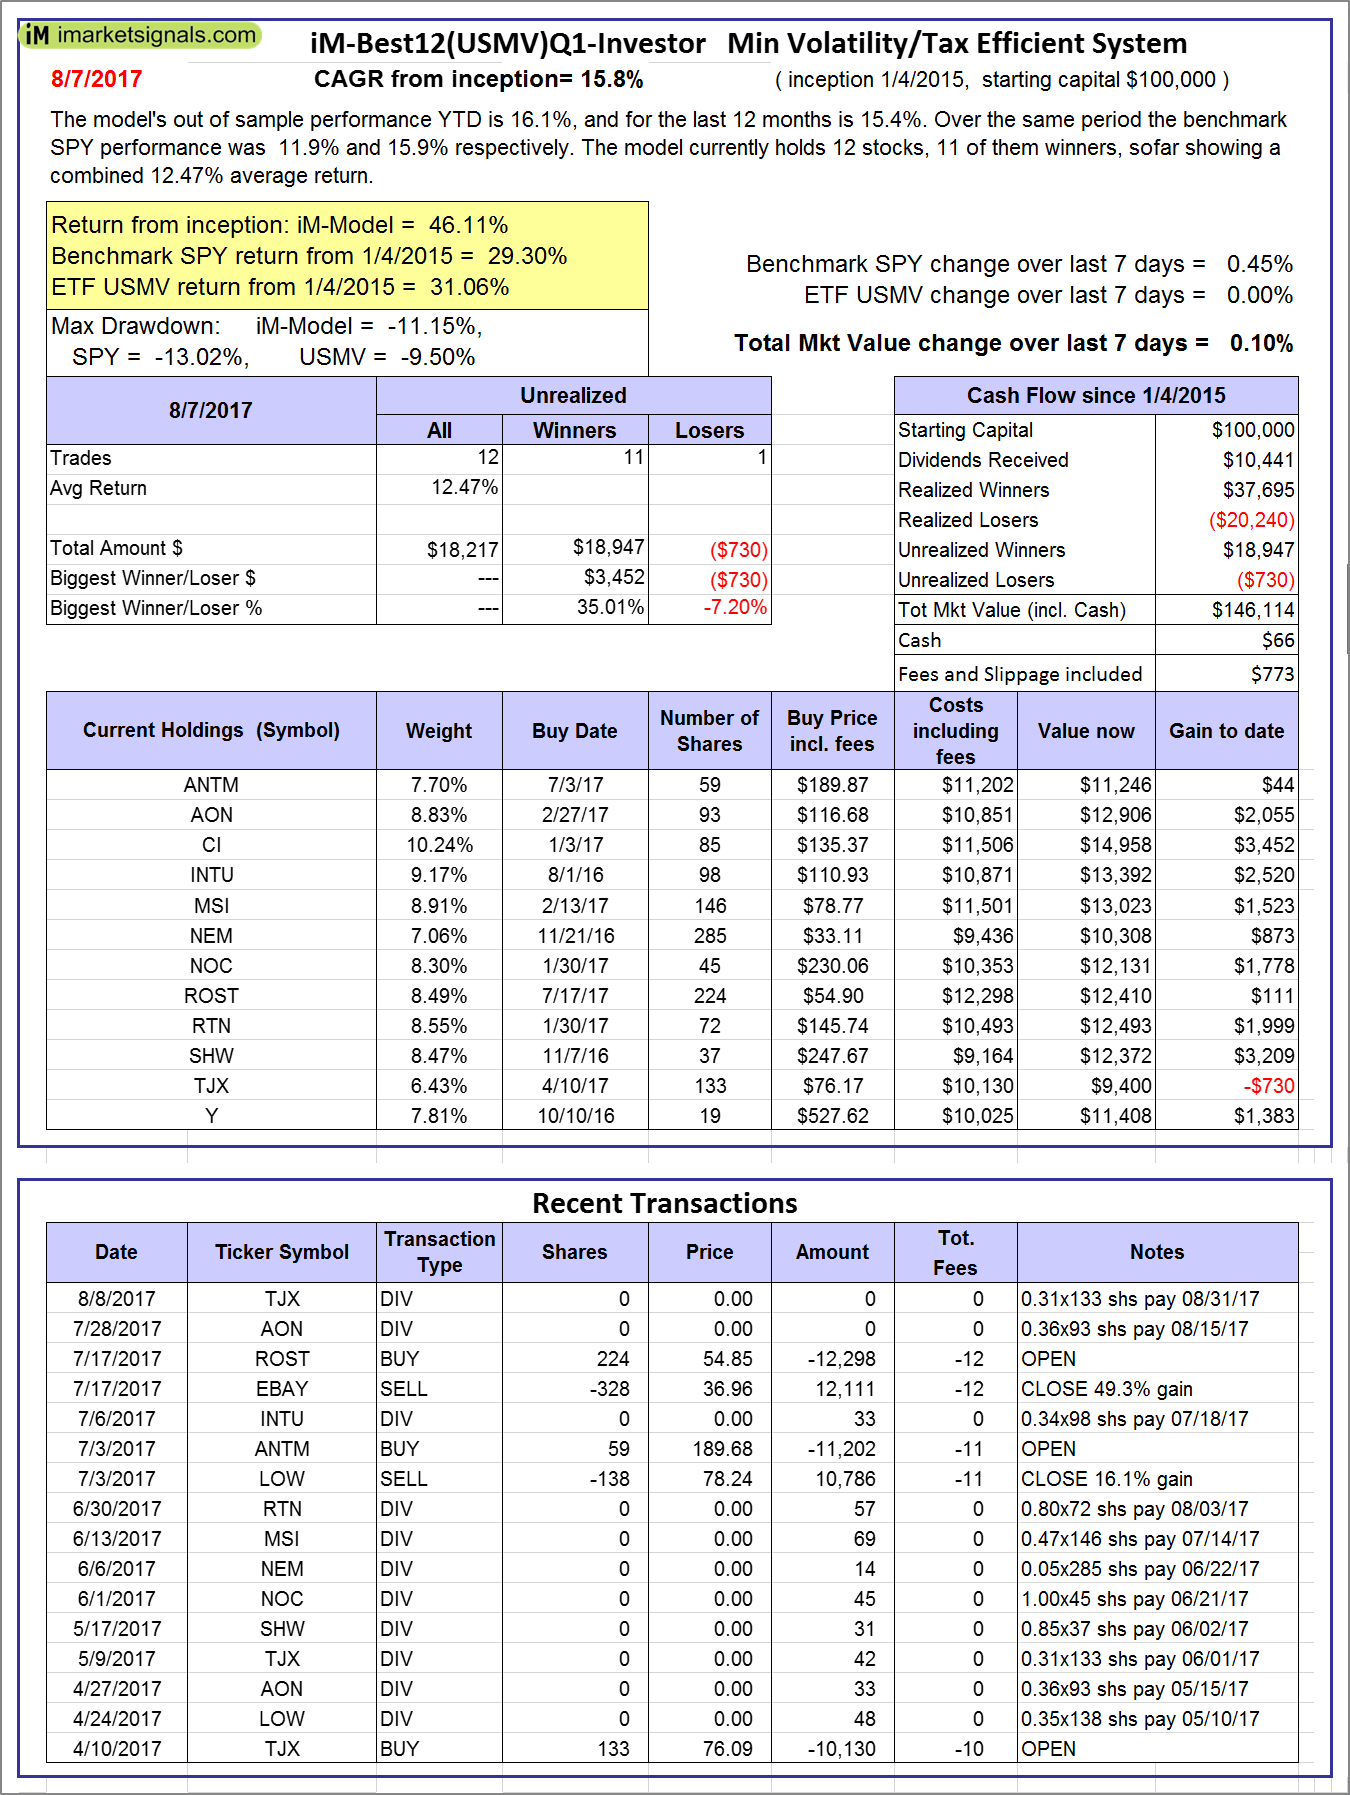
iM-Best12(USMV)Q1-Investor: The model’s out of sample performance YTD is 16.1%, and for the last 12 months is 15.4%. Over the same period the benchmark SPY performance was 11.9% and 15.9% respectively. Since inception, on 1/5/2015, the model gained 46.11% while the benchmark SPY gained 29.30% and the ETF USMV gained 31.06% over the same period. Over the previous week the market value of iM-Best12(USMV)Q1 gained 0.10% at a time when SPY gained 0.45%. A starting capital of $100,000 at inception on 1/5/2015 would have grown to $146,114 which includes $66 cash and excludes $773 spent on fees and slippage. |
|
|
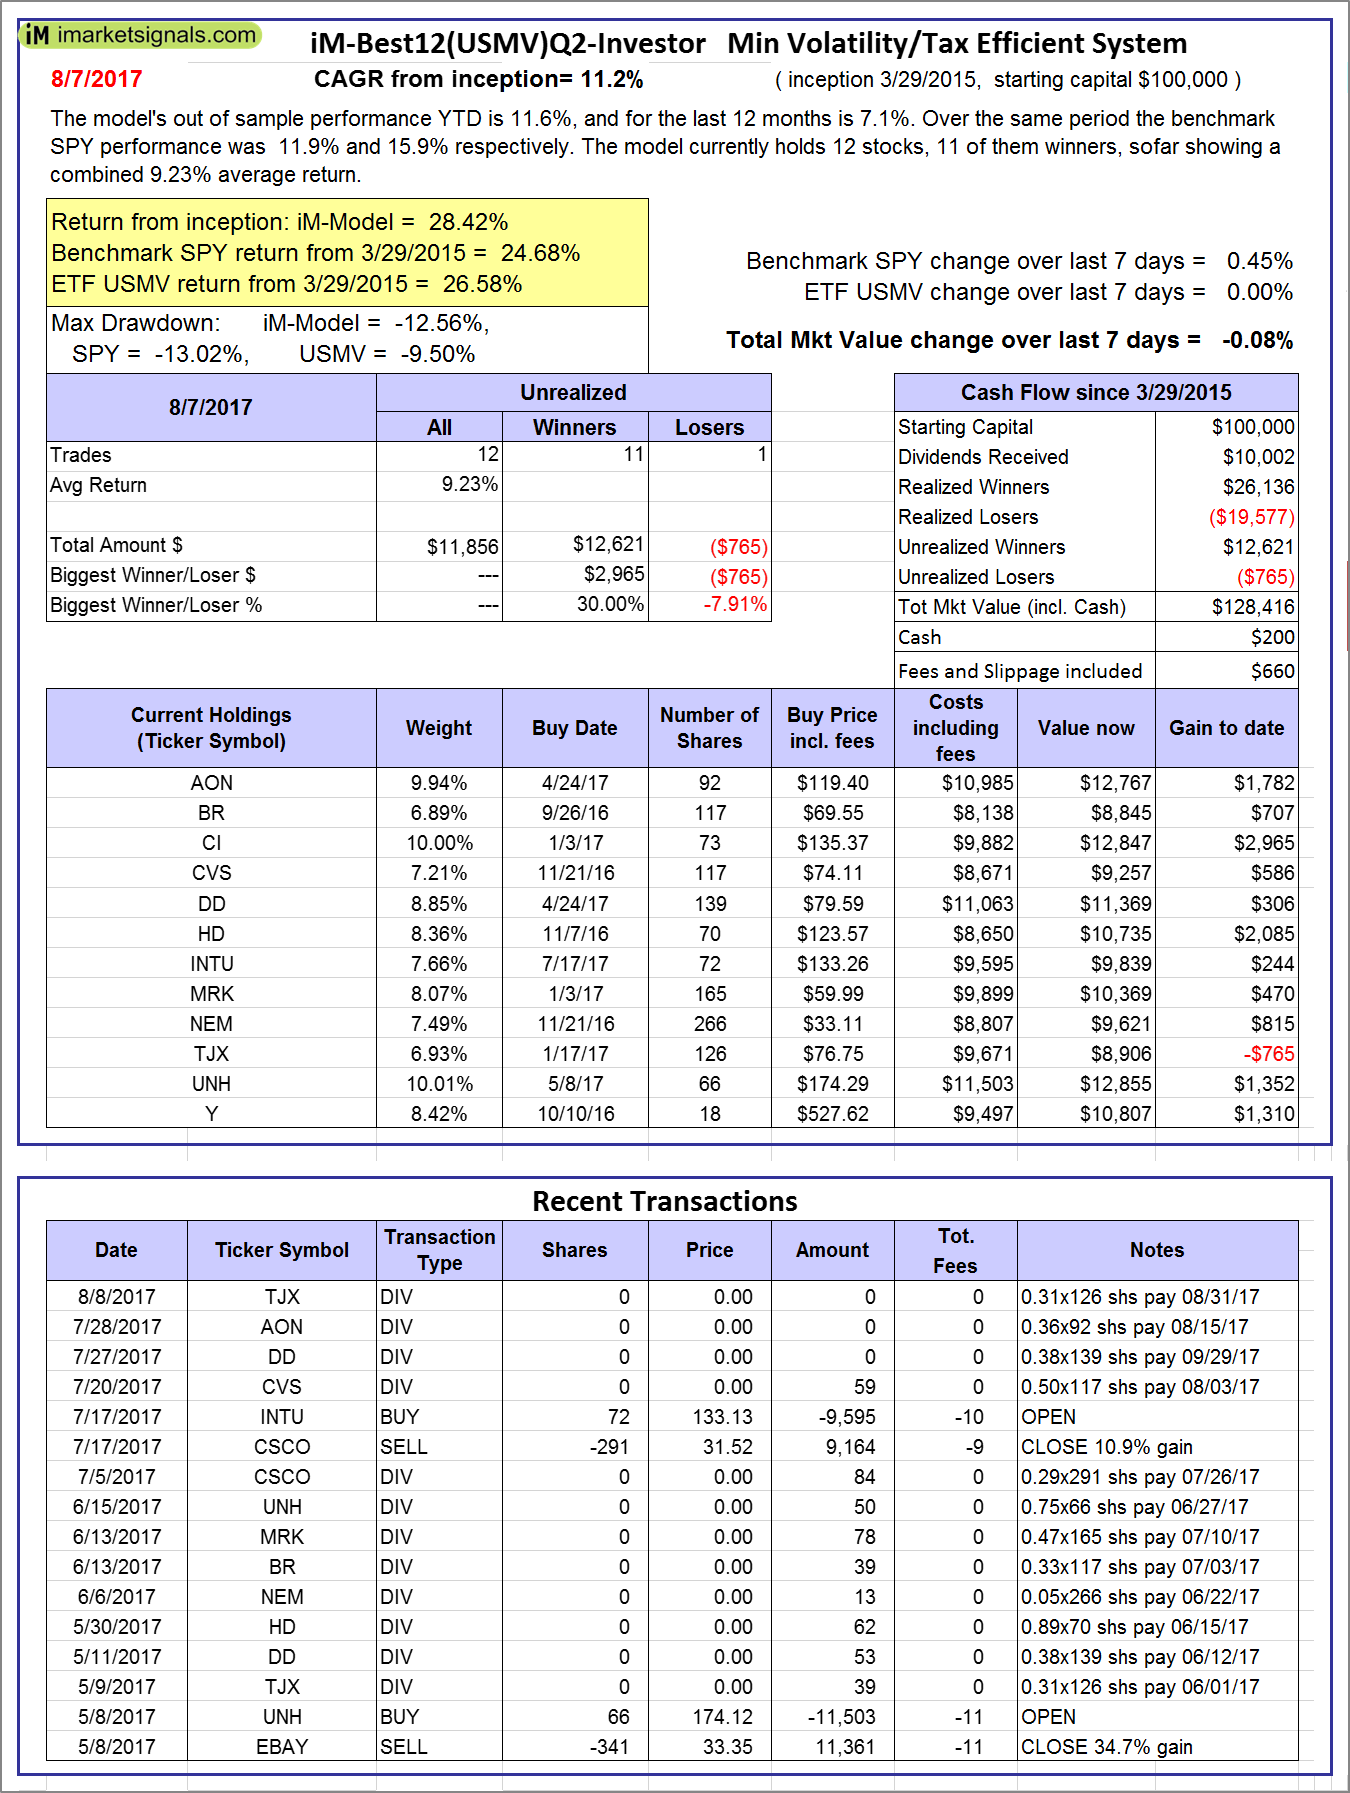
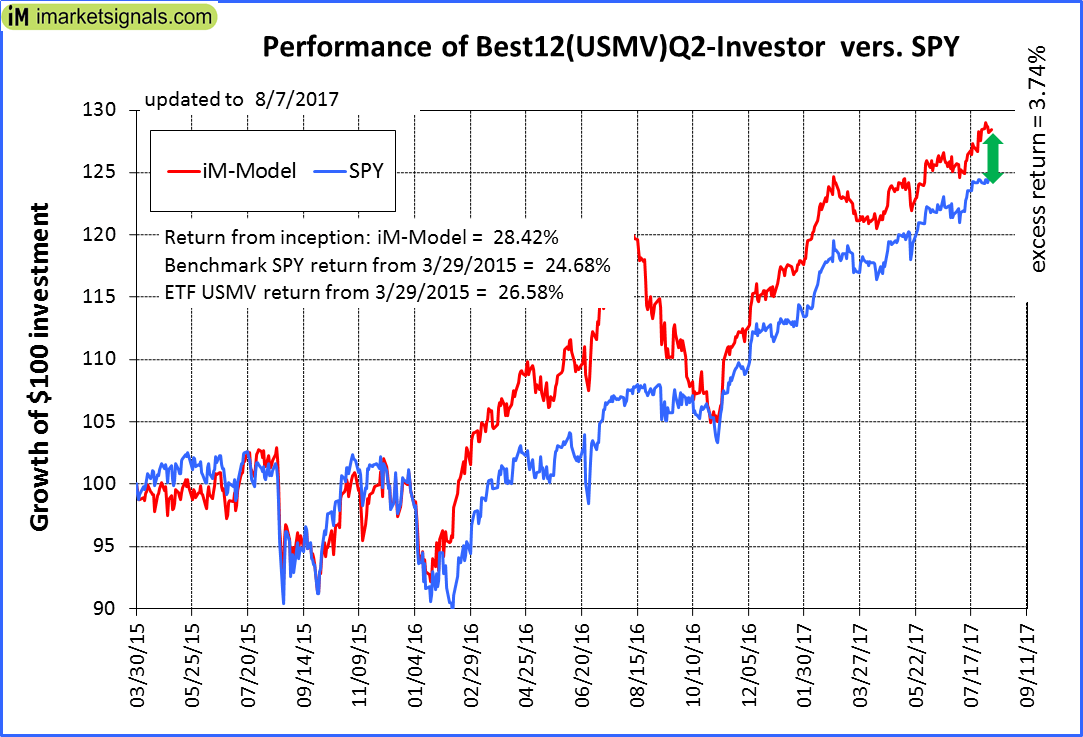
iM-Best12(USMV)Q2-Investor: The model’s out of sample performance YTD is 11.6%, and for the last 12 months is 7.1%. Over the same period the benchmark SPY performance was 11.9% and 15.9% respectively. Since inception, on 3/30/2015, the model gained 28.42% while the benchmark SPY gained 24.68% and the ETF USMV gained 26.58% over the same period. Over the previous week the market value of iM-Best12(USMV)Q2 gained -0.08% at a time when SPY gained 0.45%. A starting capital of $100,000 at inception on 3/30/2015 would have grown to $128,416 which includes $200 cash and excludes $660 spent on fees and slippage. |
|
|
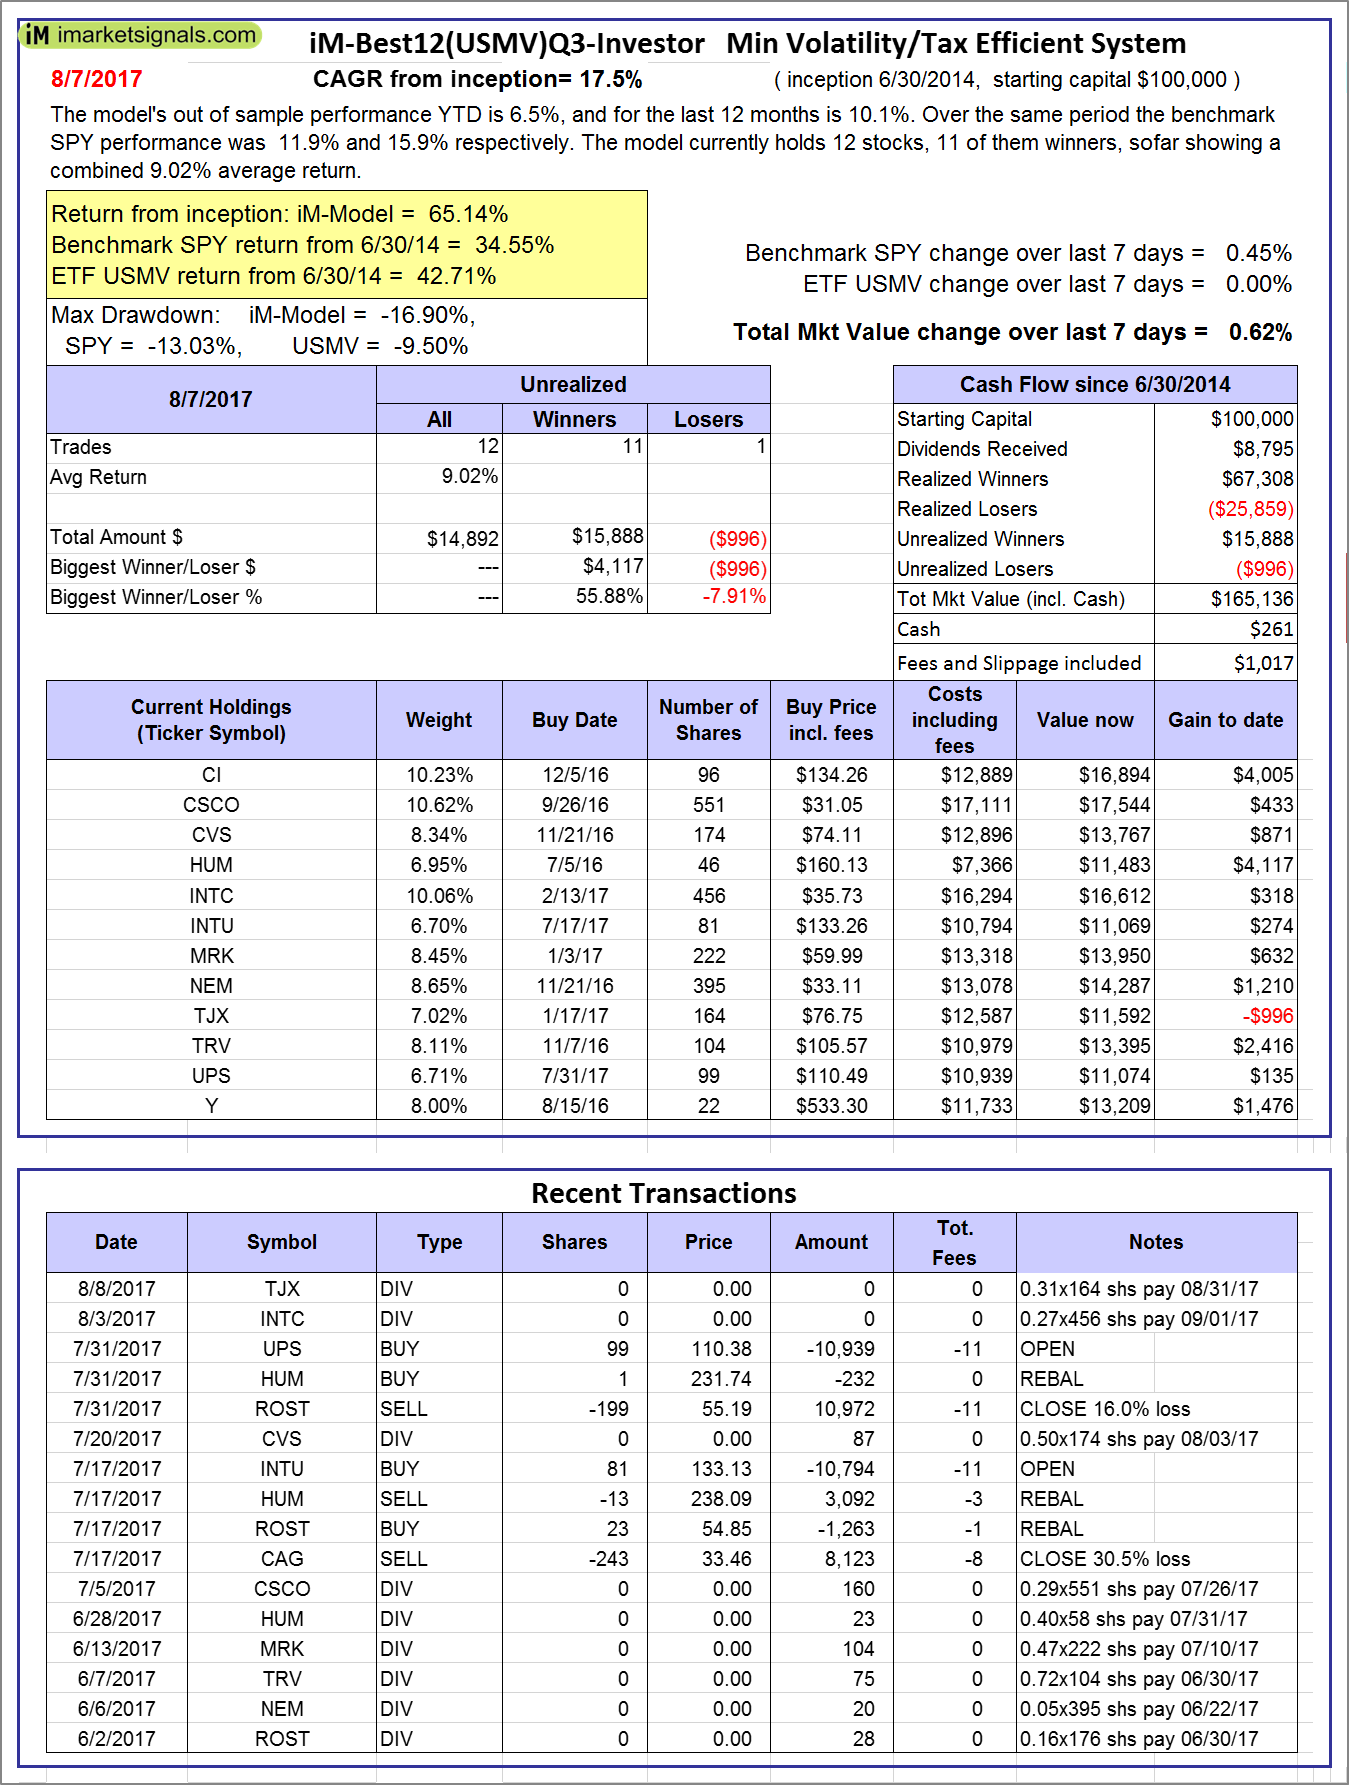
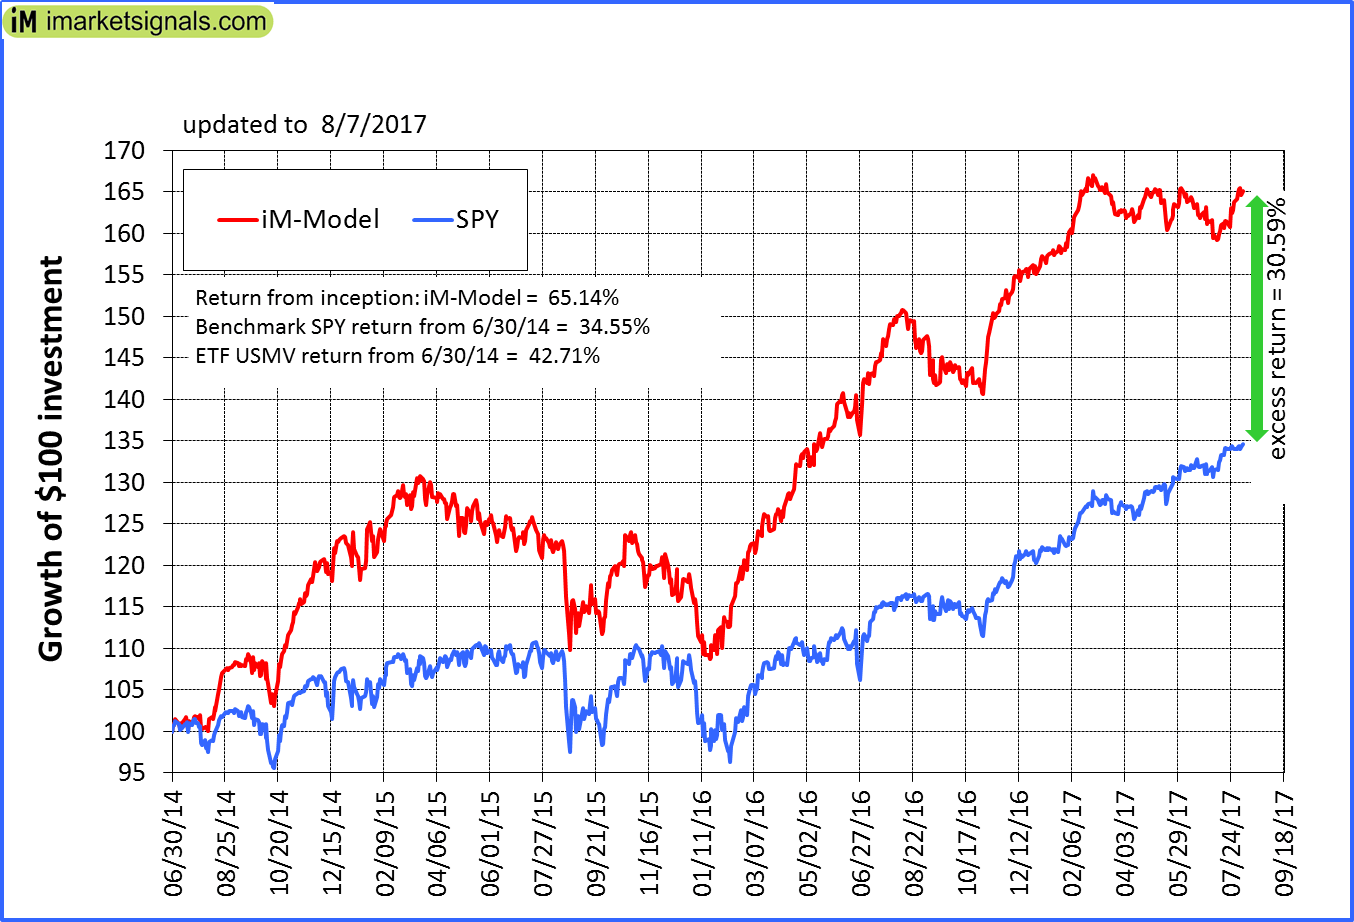
iM-Best12(USMV)Q3-Investor: The model’s out of sample performance YTD is 6.5%, and for the last 12 months is 10.1%. Over the same period the benchmark SPY performance was 11.9% and 15.9% respectively. Since inception, on 7/1/2014, the model gained 65.14% while the benchmark SPY gained 34.55% and the ETF USMV gained 42.71% over the same period. Over the previous week the market value of iM-Best12(USMV)Q3 gained 0.62% at a time when SPY gained 0.45%. A starting capital of $100,000 at inception on 7/1/2014 would have grown to $165,136 which includes $261 cash and excludes $1,017 spent on fees and slippage. |
|
|
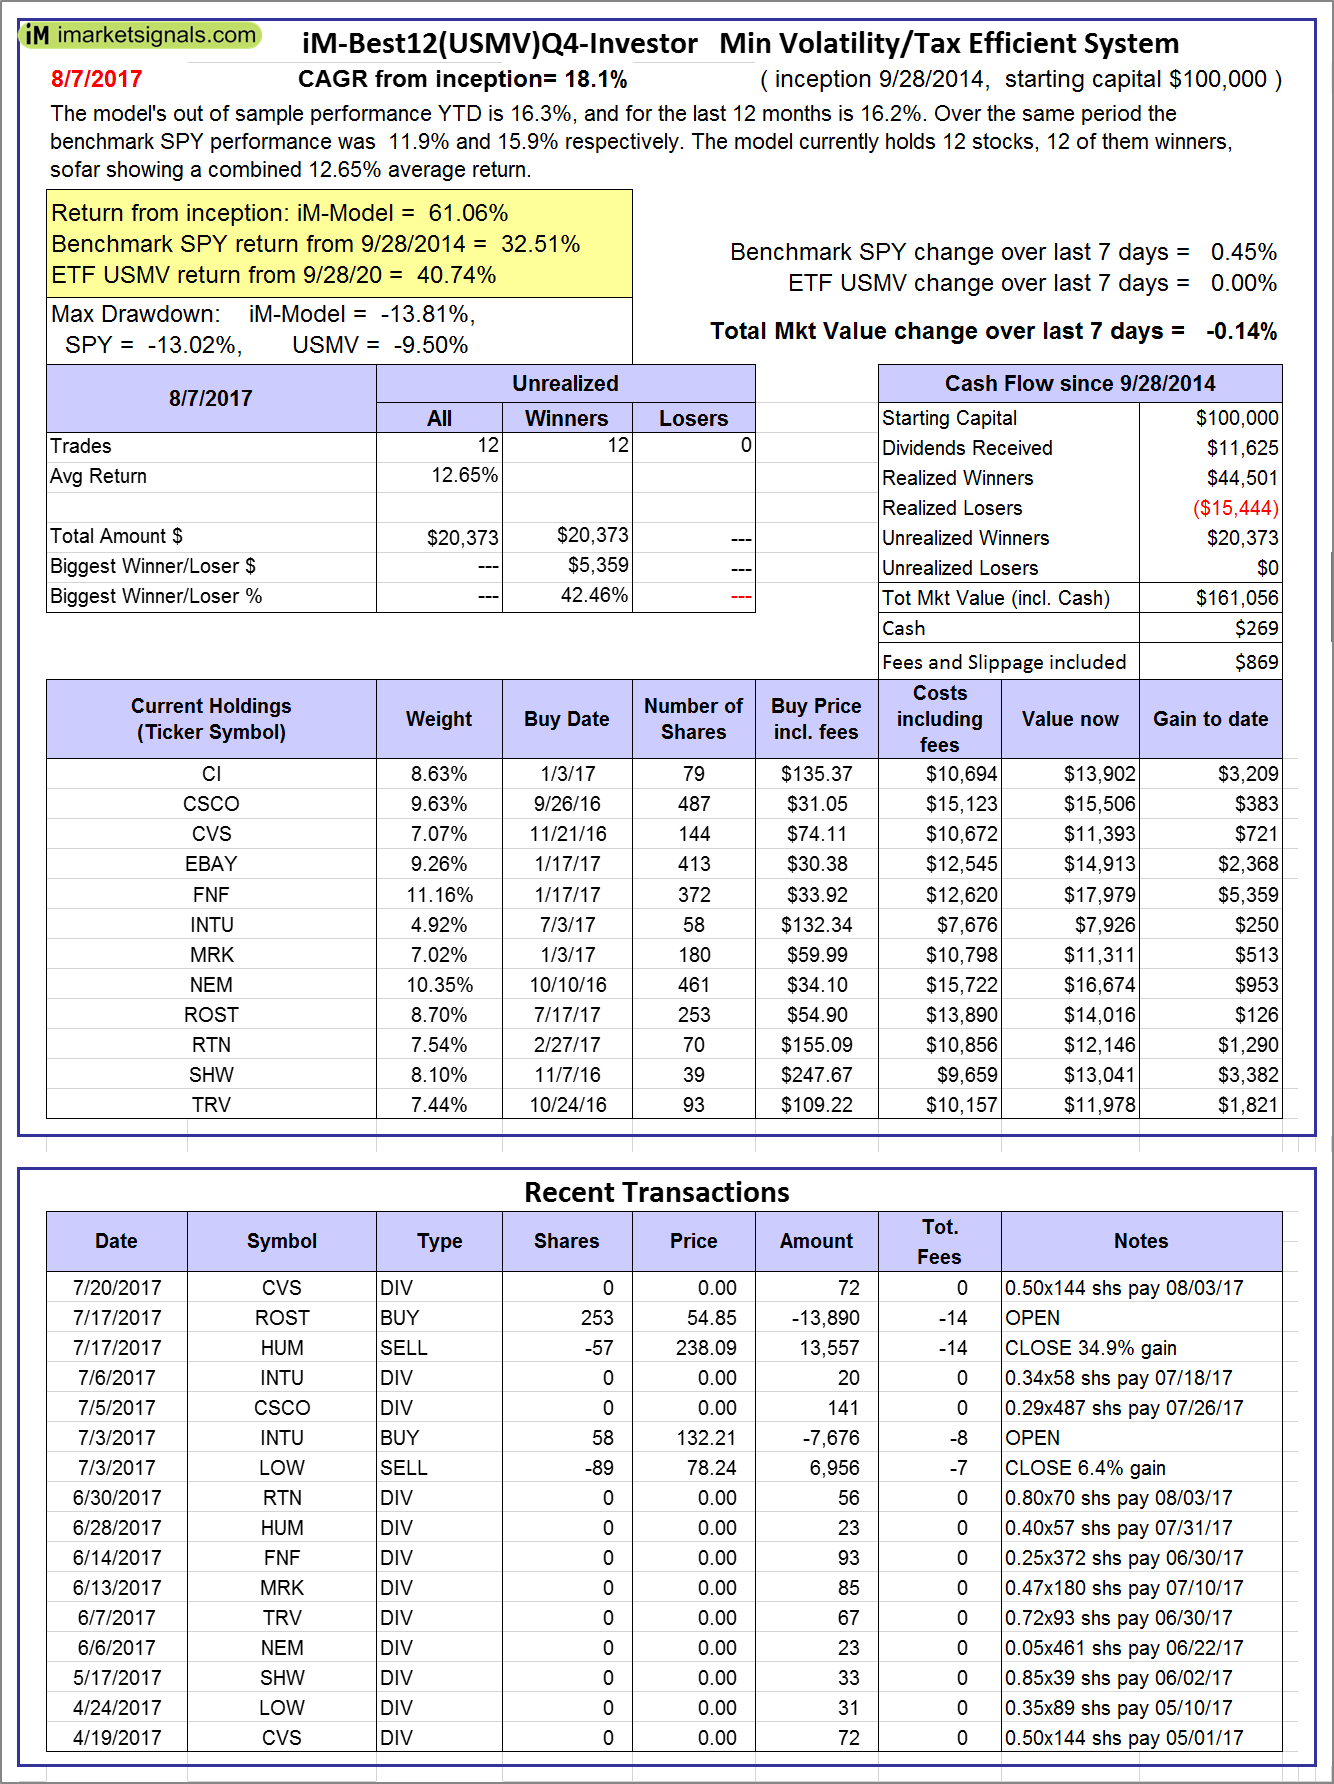
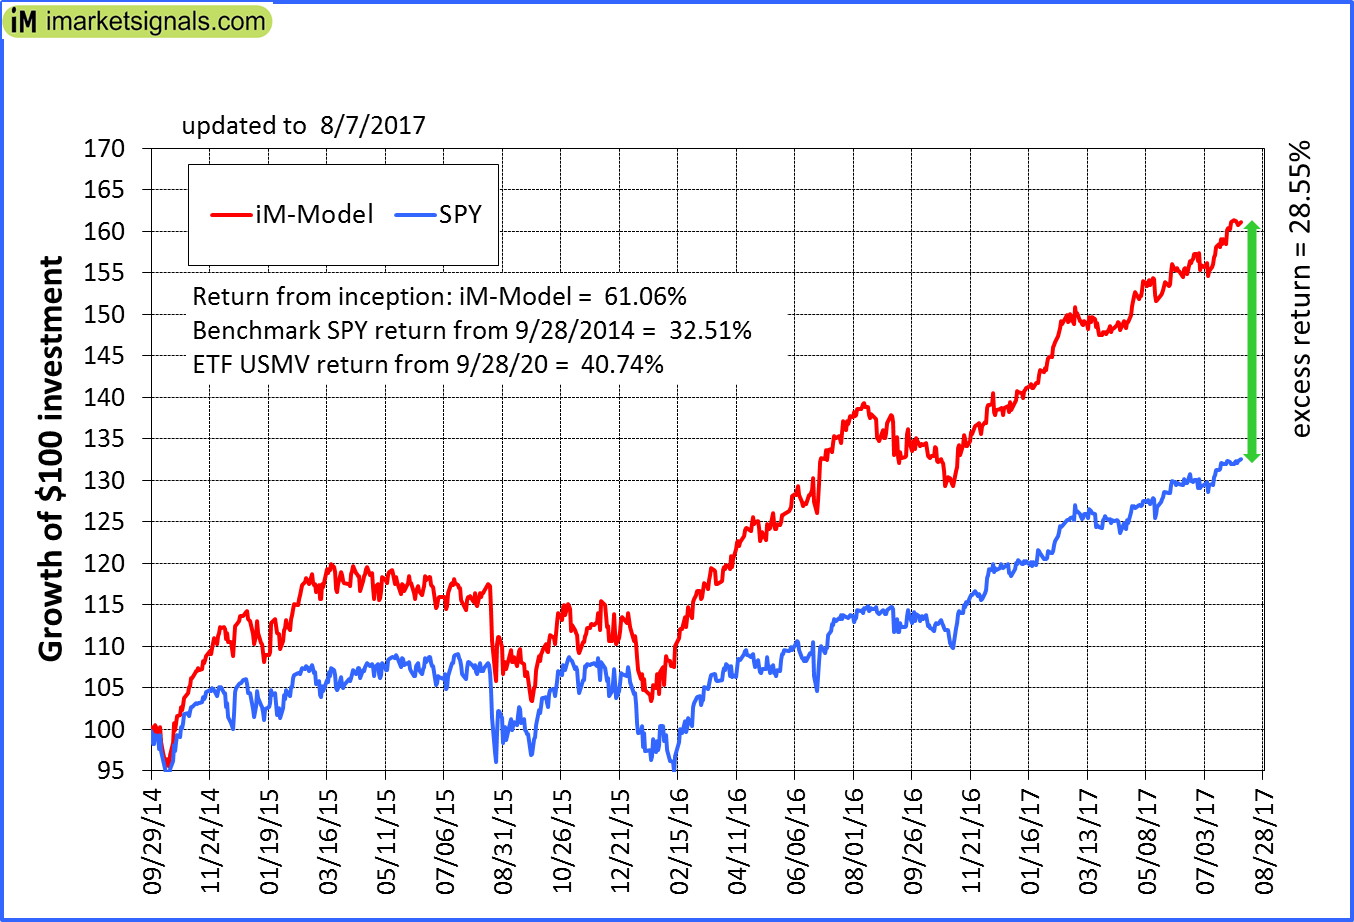
iM-Best12(USMV)Q4-Investor: Since inception, on 9/29/2014, the model gained 61.06% while the benchmark SPY gained 32.51% and the ETF USMV gained 40.74% over the same period. Over the previous week the market value of iM-Best12(USMV)Q4 gained -0.14% at a time when SPY gained 0.45%. A starting capital of $100,000 at inception on 9/29/2014 would have grown to $161,056 which includes $269 cash and excludes $869 spent on fees and slippage. |
|
|
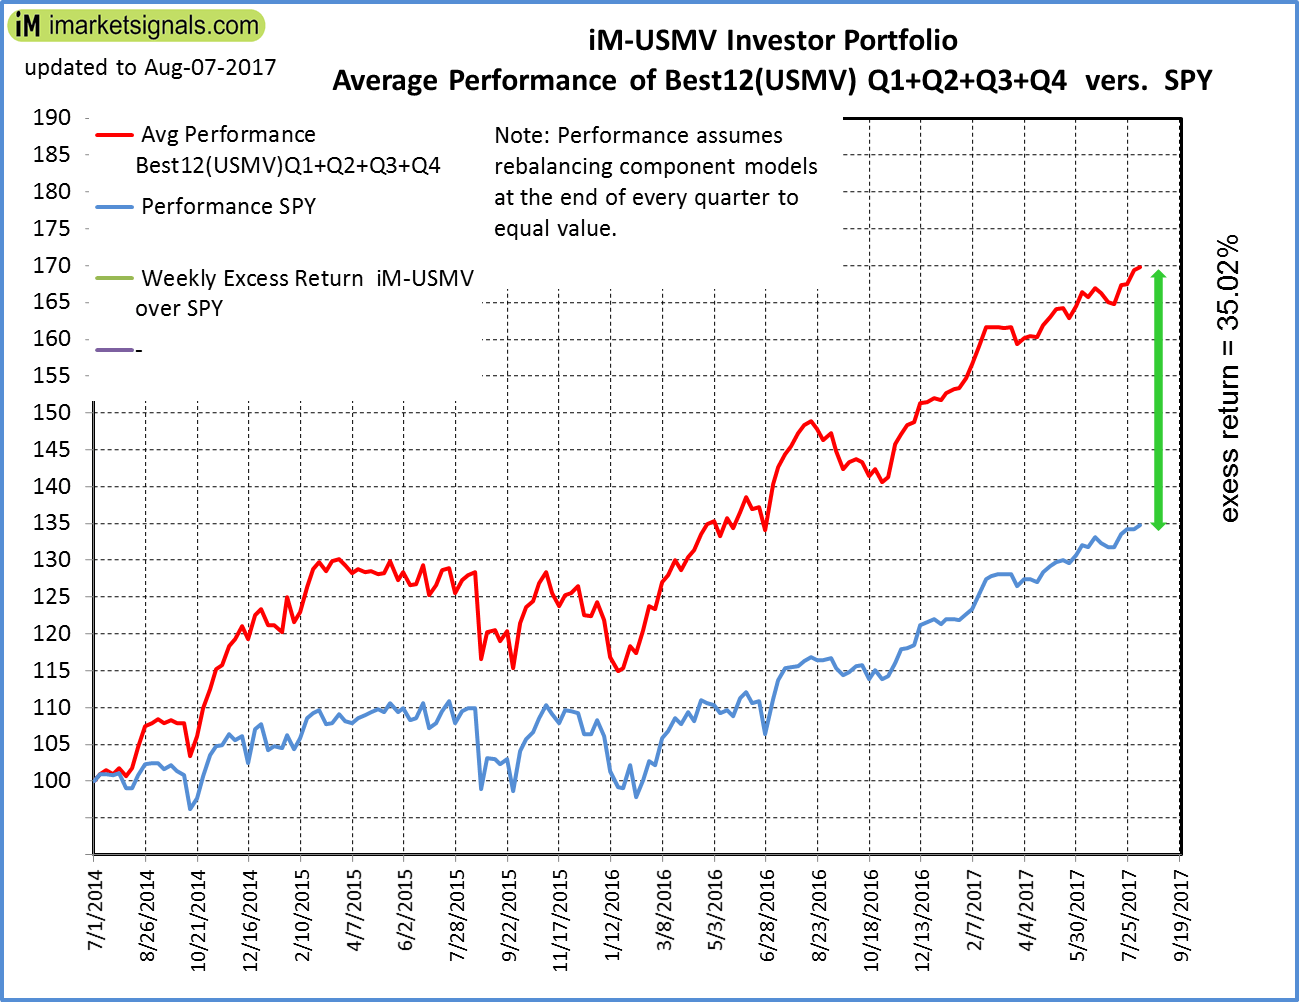
Average Performance of iM-Best12(USMV)Q1+Q2+Q3+Q4-Investor resulted in an excess return of 35.02% over SPY. (see iM-USMV Investor Portfolio) |
|
|
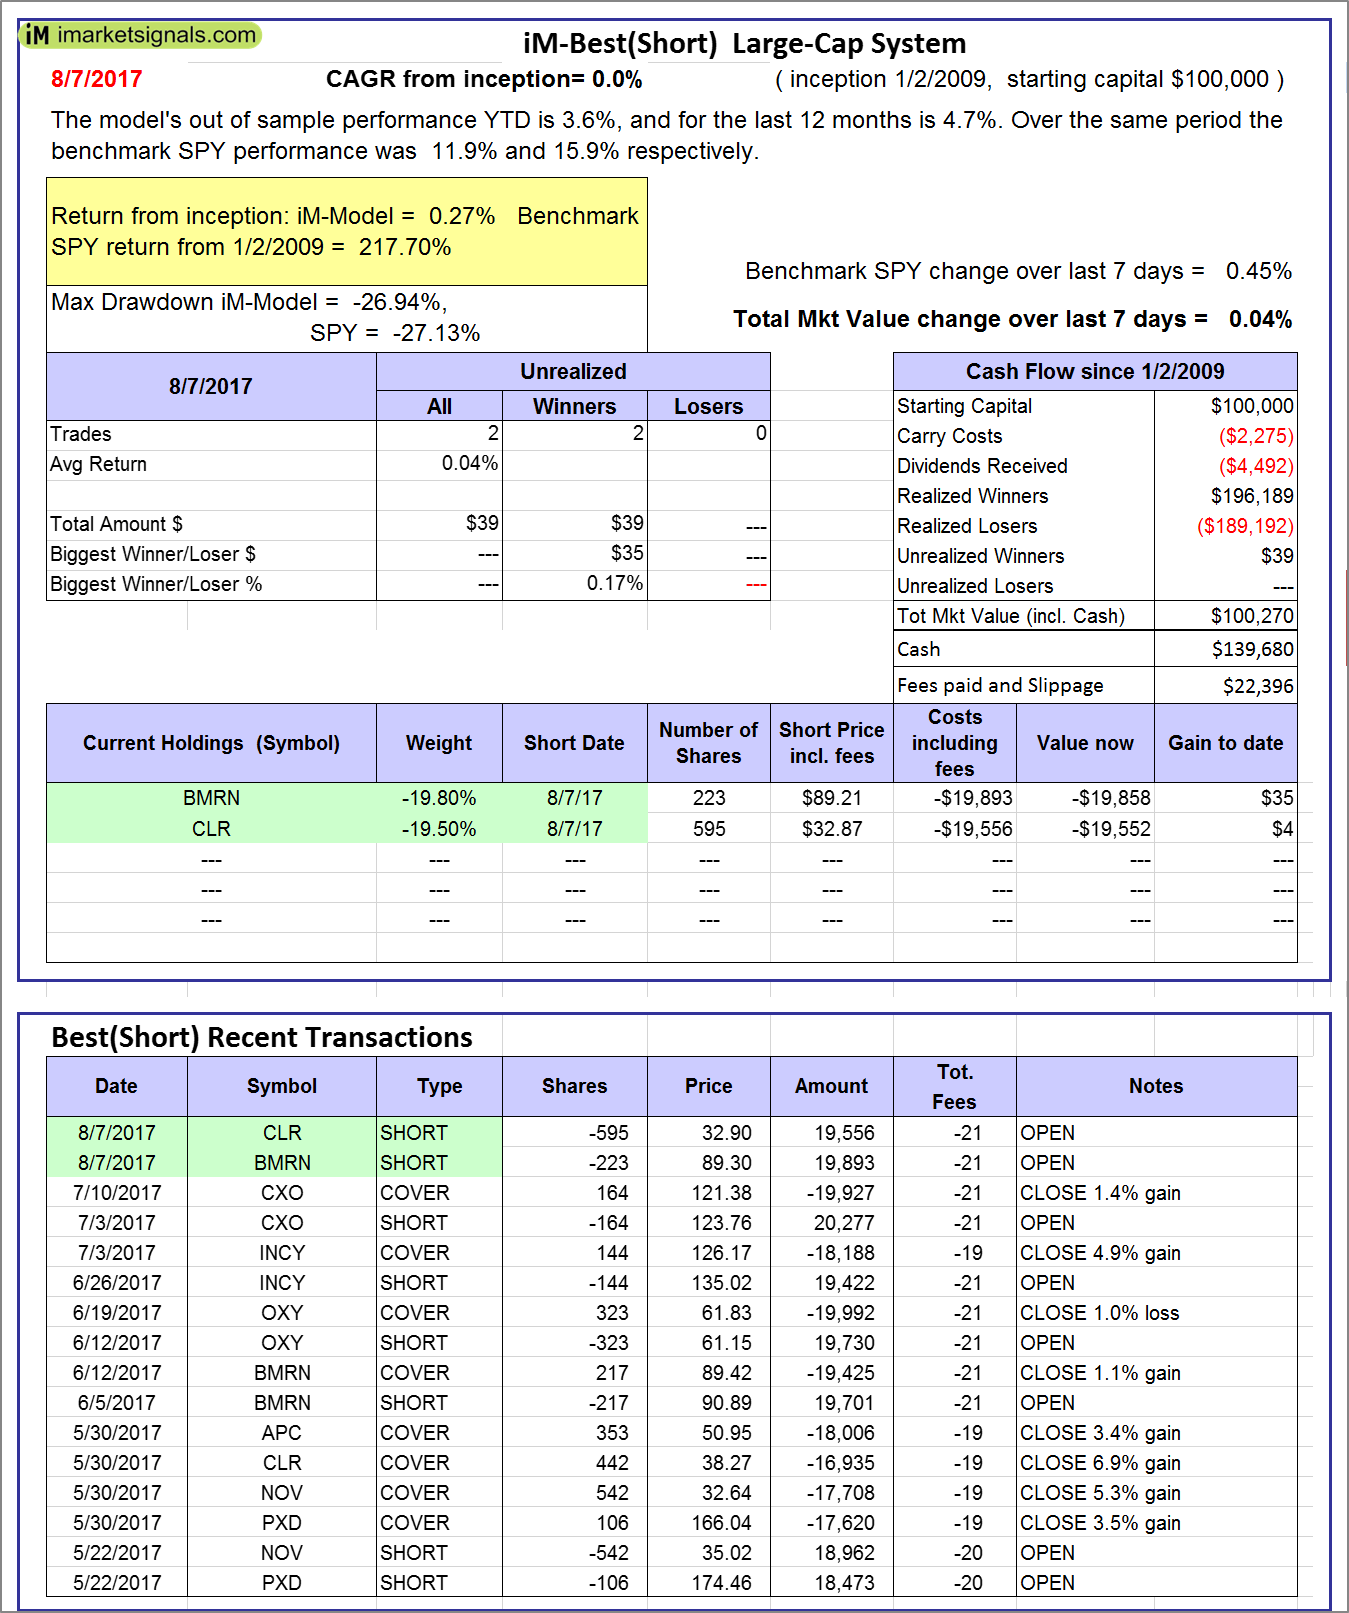
iM-Best(Short): The model’s out of sample performance YTD is 3.6%, and for the last 12 months is 4.7%. Over the same period the benchmark SPY performance was 11.9% and 15.9% respectively. Over the previous week the market value of iM-Best(Short) gained 0.04% at a time when SPY gained 0.45%. Over the period 1/2/2009 to 8/7/2017 the starting capital of $100,000 would have grown to $100,270 which includes $139,680 cash and excludes $22,396 spent on fees and slippage. |
|
|
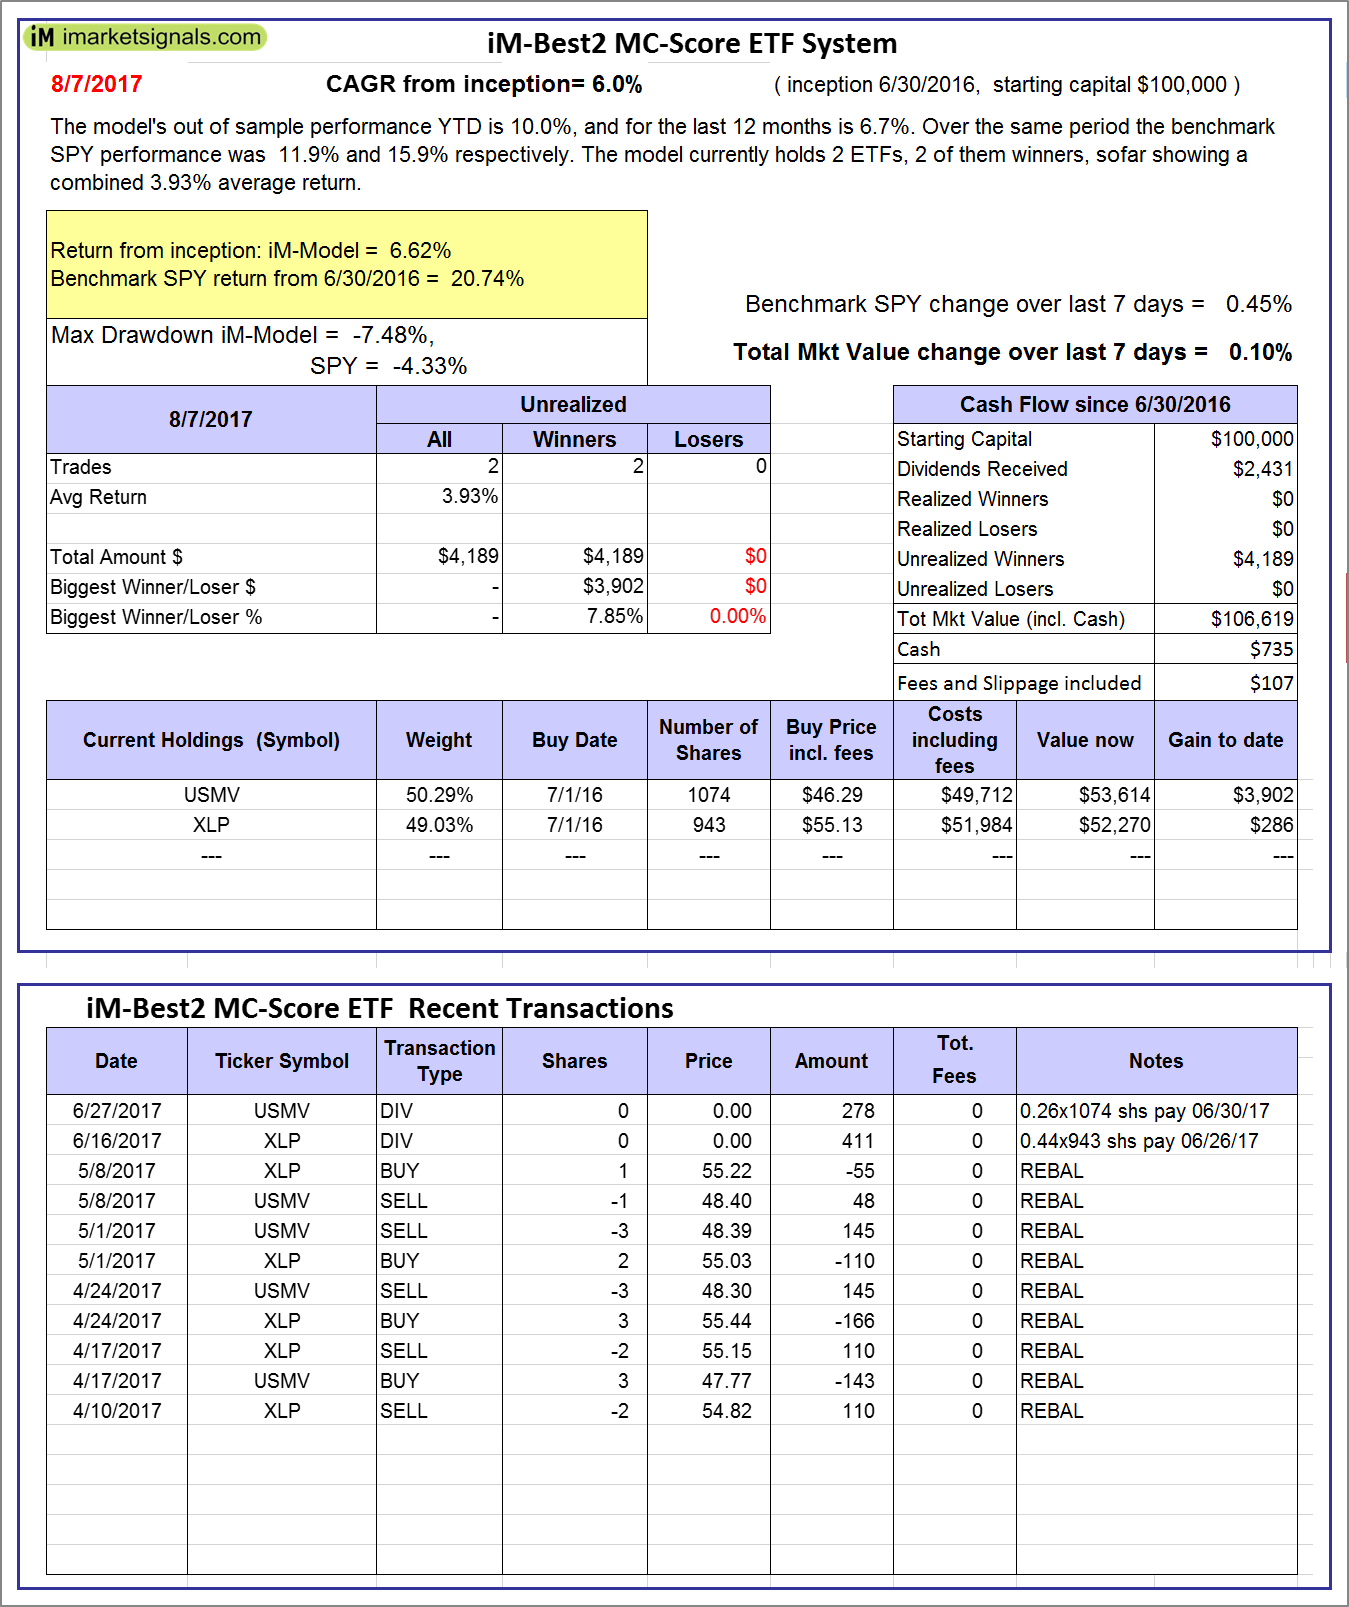
iM-Best2 MC-Score ETF System: The model’s out of sample performance YTD is 10.0%, and for the last 12 months is 6.7%. Over the same period the benchmark SPY performance was 11.9% and 15.9% respectively. Over the previous week the market value of the iM-Best2 MC-Score ETF System gained 0.10% at a time when SPY gained 0.45%. A starting capital of $100,000 at inception on 6/30/2016 would have grown to $106,619 which includes $735 cash and excludes $107 spent on fees and slippage. |
|
|
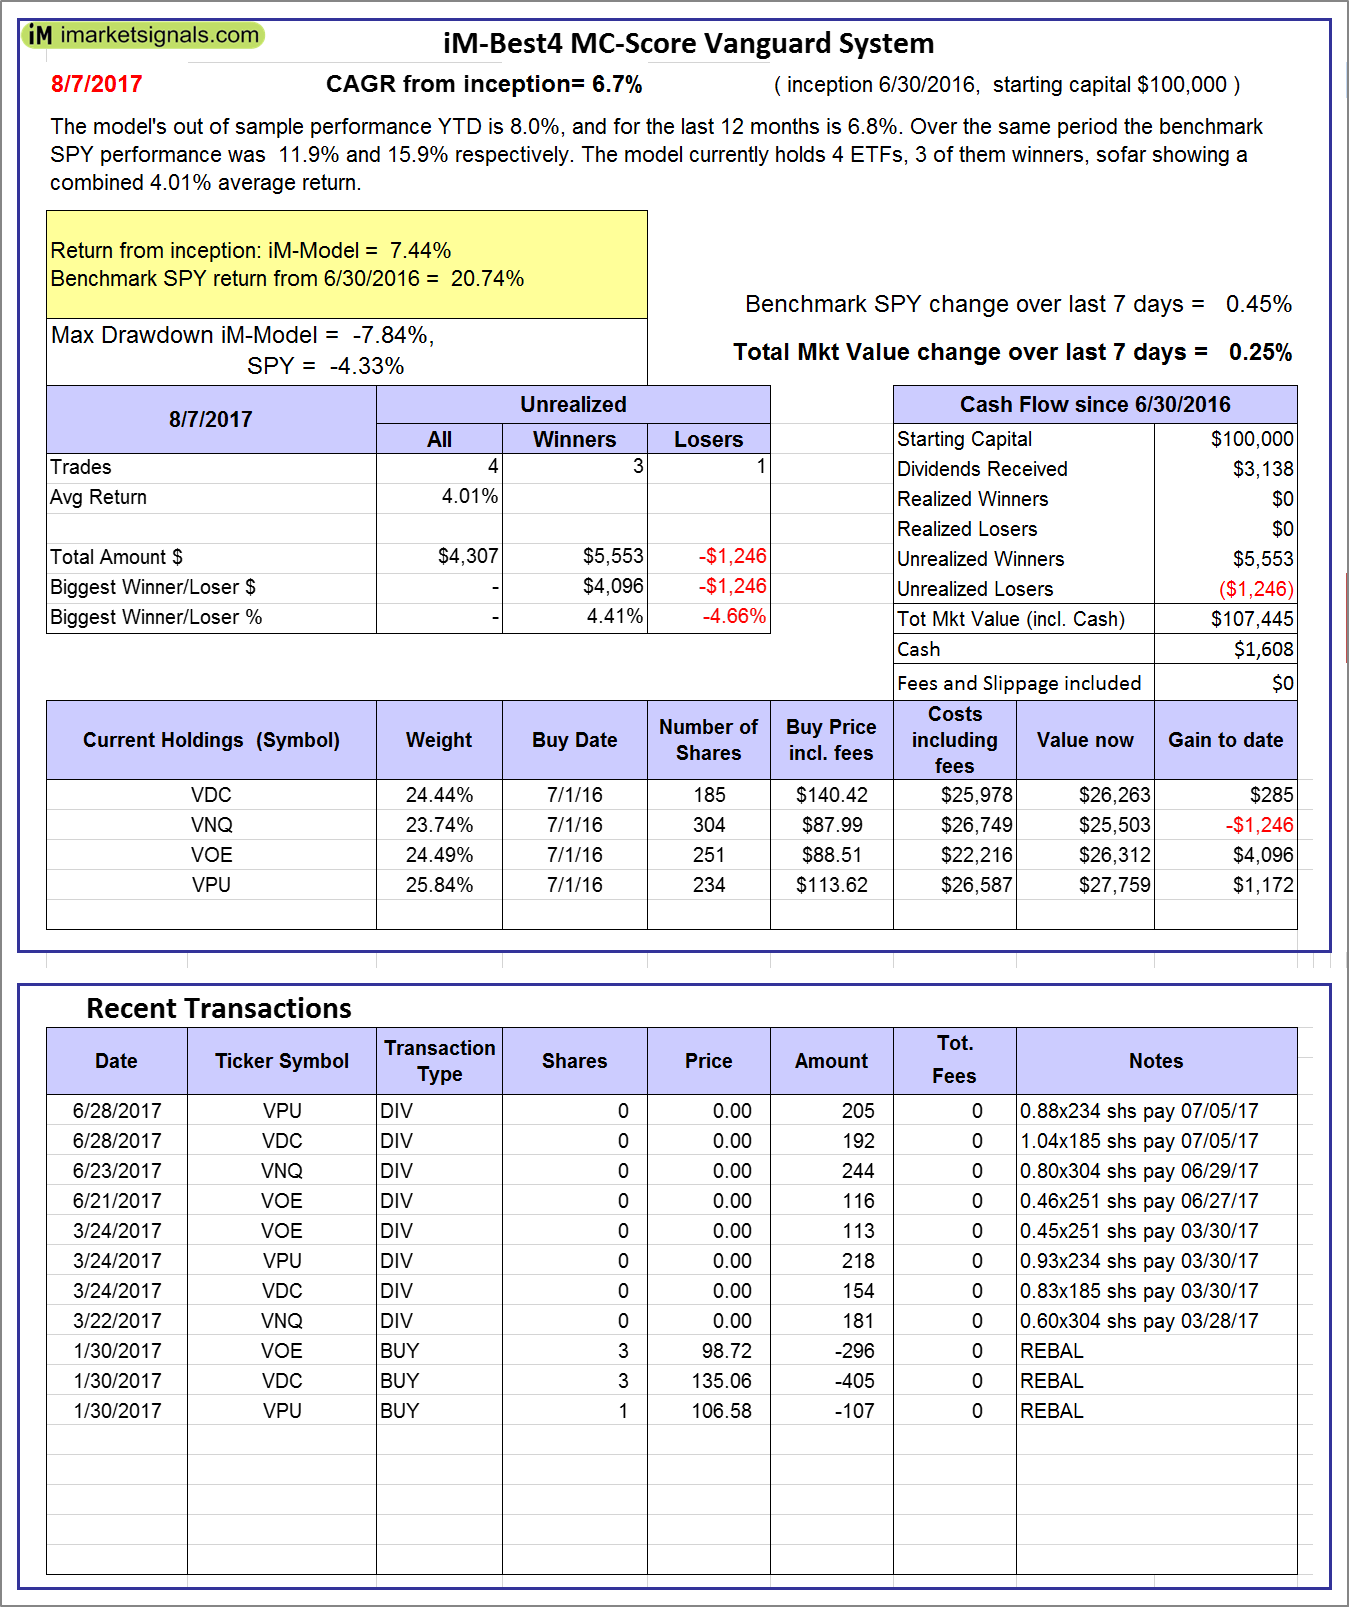
iM-Best4 MC-Score Vanguard System: The model’s out of sample performance YTD is 8.0%, and for the last 12 months is 6.8%. Over the same period the benchmark SPY performance was 11.9% and 15.9% respectively. Over the previous week the market value of the iM-Best4 MC-Score Vanguard System gained 0.25% at a time when SPY gained 0.45%. A starting capital of $100,000 at inception on 6/30/2016 would have grown to $107,445 which includes $1,608 cash and excludes $00 spent on fees and slippage. |
|
|
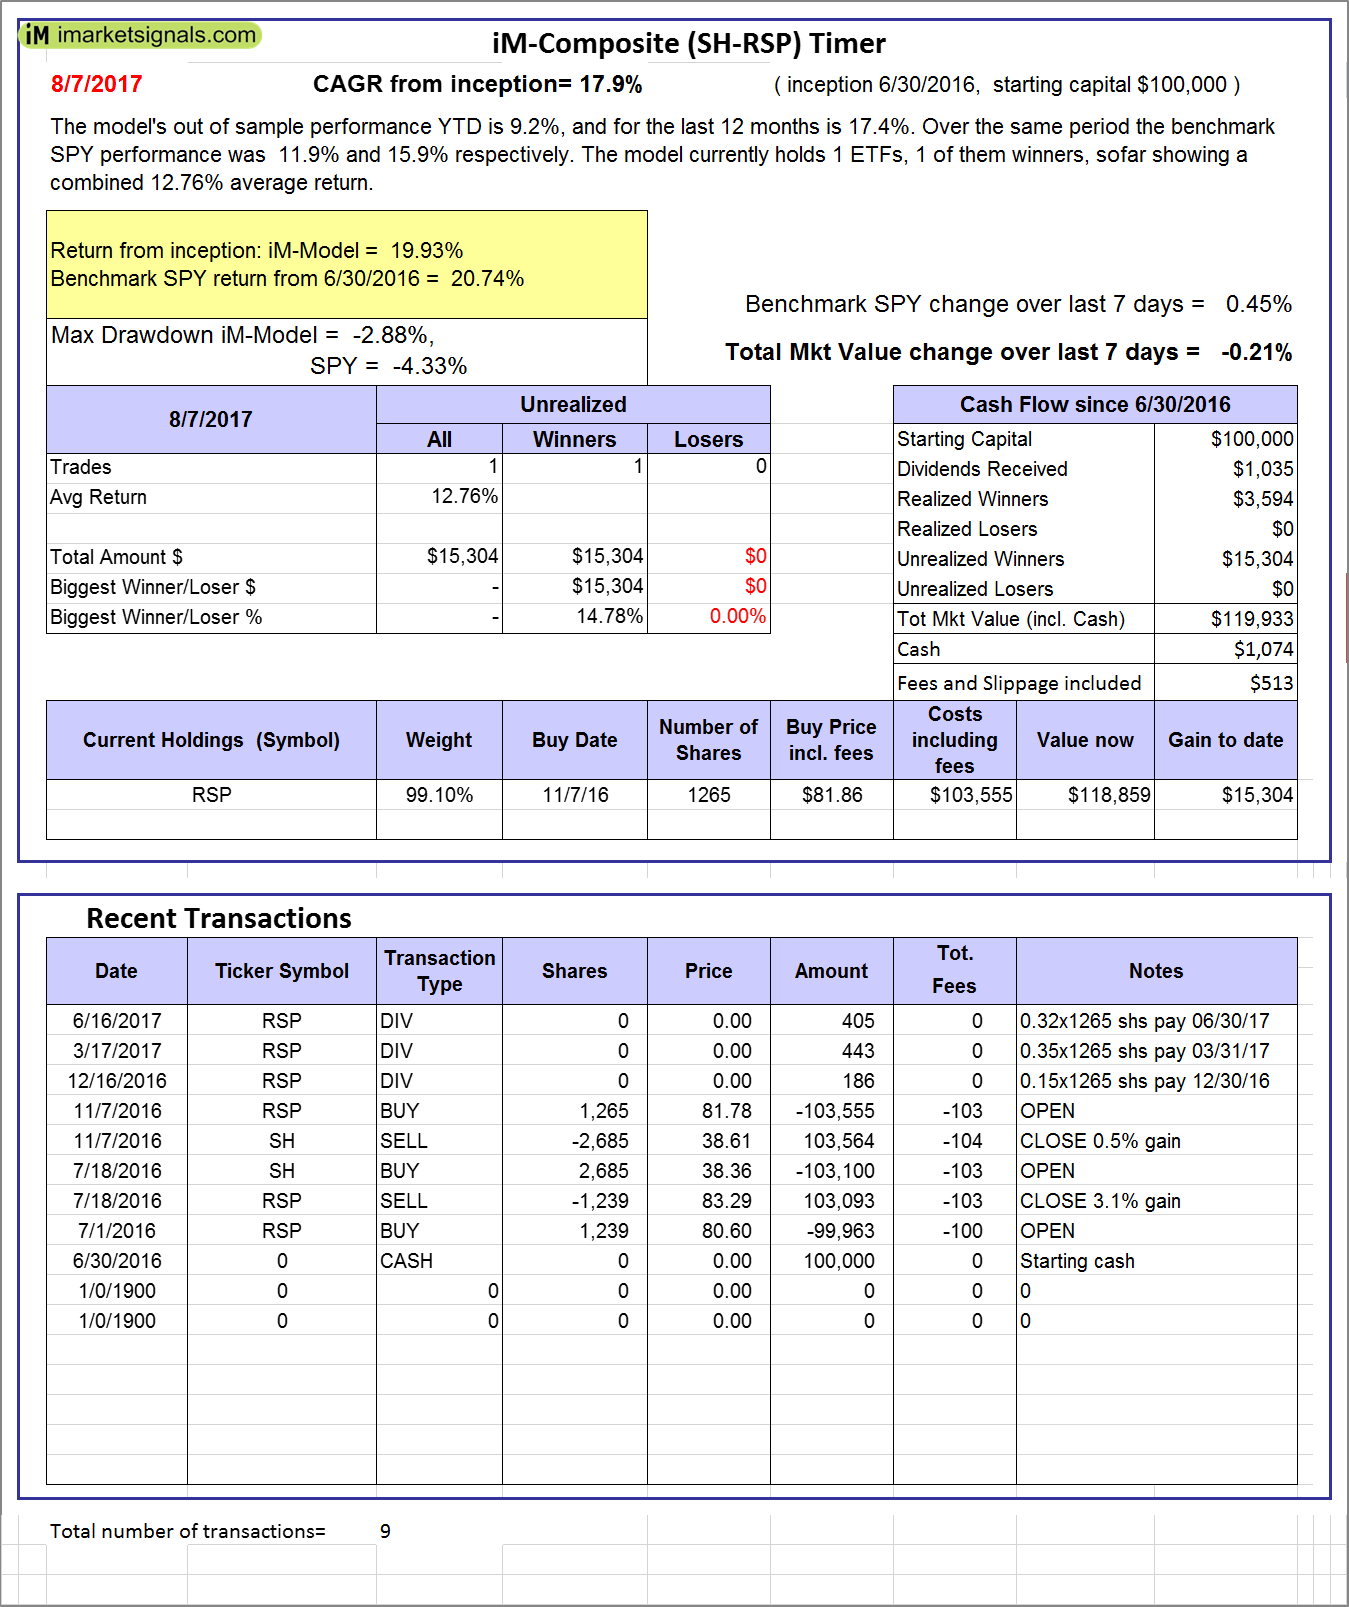
iM-Composite (SH-RSP) Timer: The model’s out of sample performance YTD is 9.2%, and for the last 12 months is 17.4%. Over the same period the benchmark SPY performance was 11.9% and 15.9% respectively. Over the previous week the market value of the iM-Composite (SH-RSP) Timer gained -0.21% at a time when SPY gained 0.45%. A starting capital of $100,000 at inception on 6/30/2016 would have grown to $119,933 which includes $1,074 cash and excludes $513 spent on fees and slippage. |
|
|
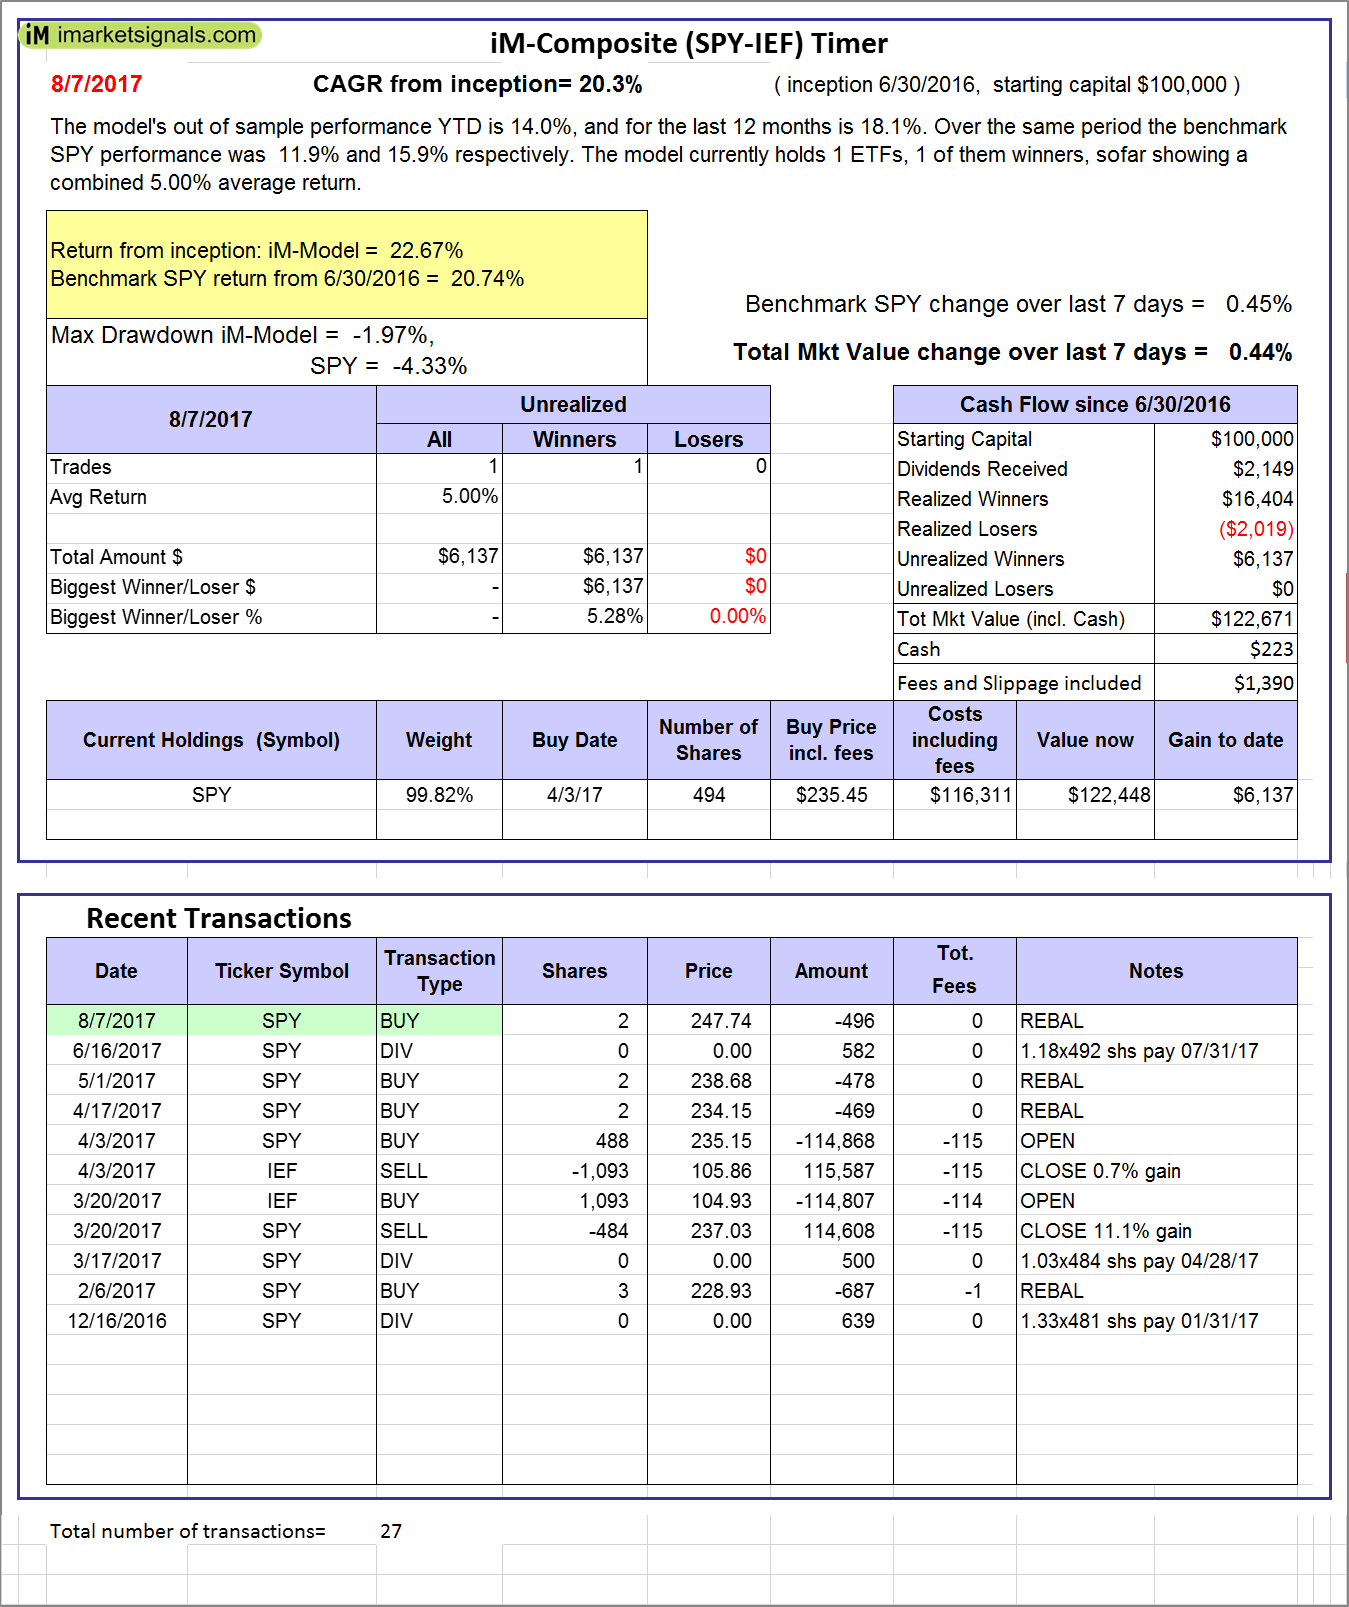
iM-Composite (SPY-IEF) Timer: The model’s out of sample performance YTD is 14.0%, and for the last 12 months is 18.1%. Over the same period the benchmark SPY performance was 11.9% and 15.9% respectively. Over the previous week the market value of the iM-Composite (SPY-IEF) Timer gained 0.44% at a time when SPY gained 0.45%. A starting capital of $100,000 at inception on 6/30/2016 would have grown to $122,671 which includes $223 cash and excludes $1,390 spent on fees and slippage. |
|
|
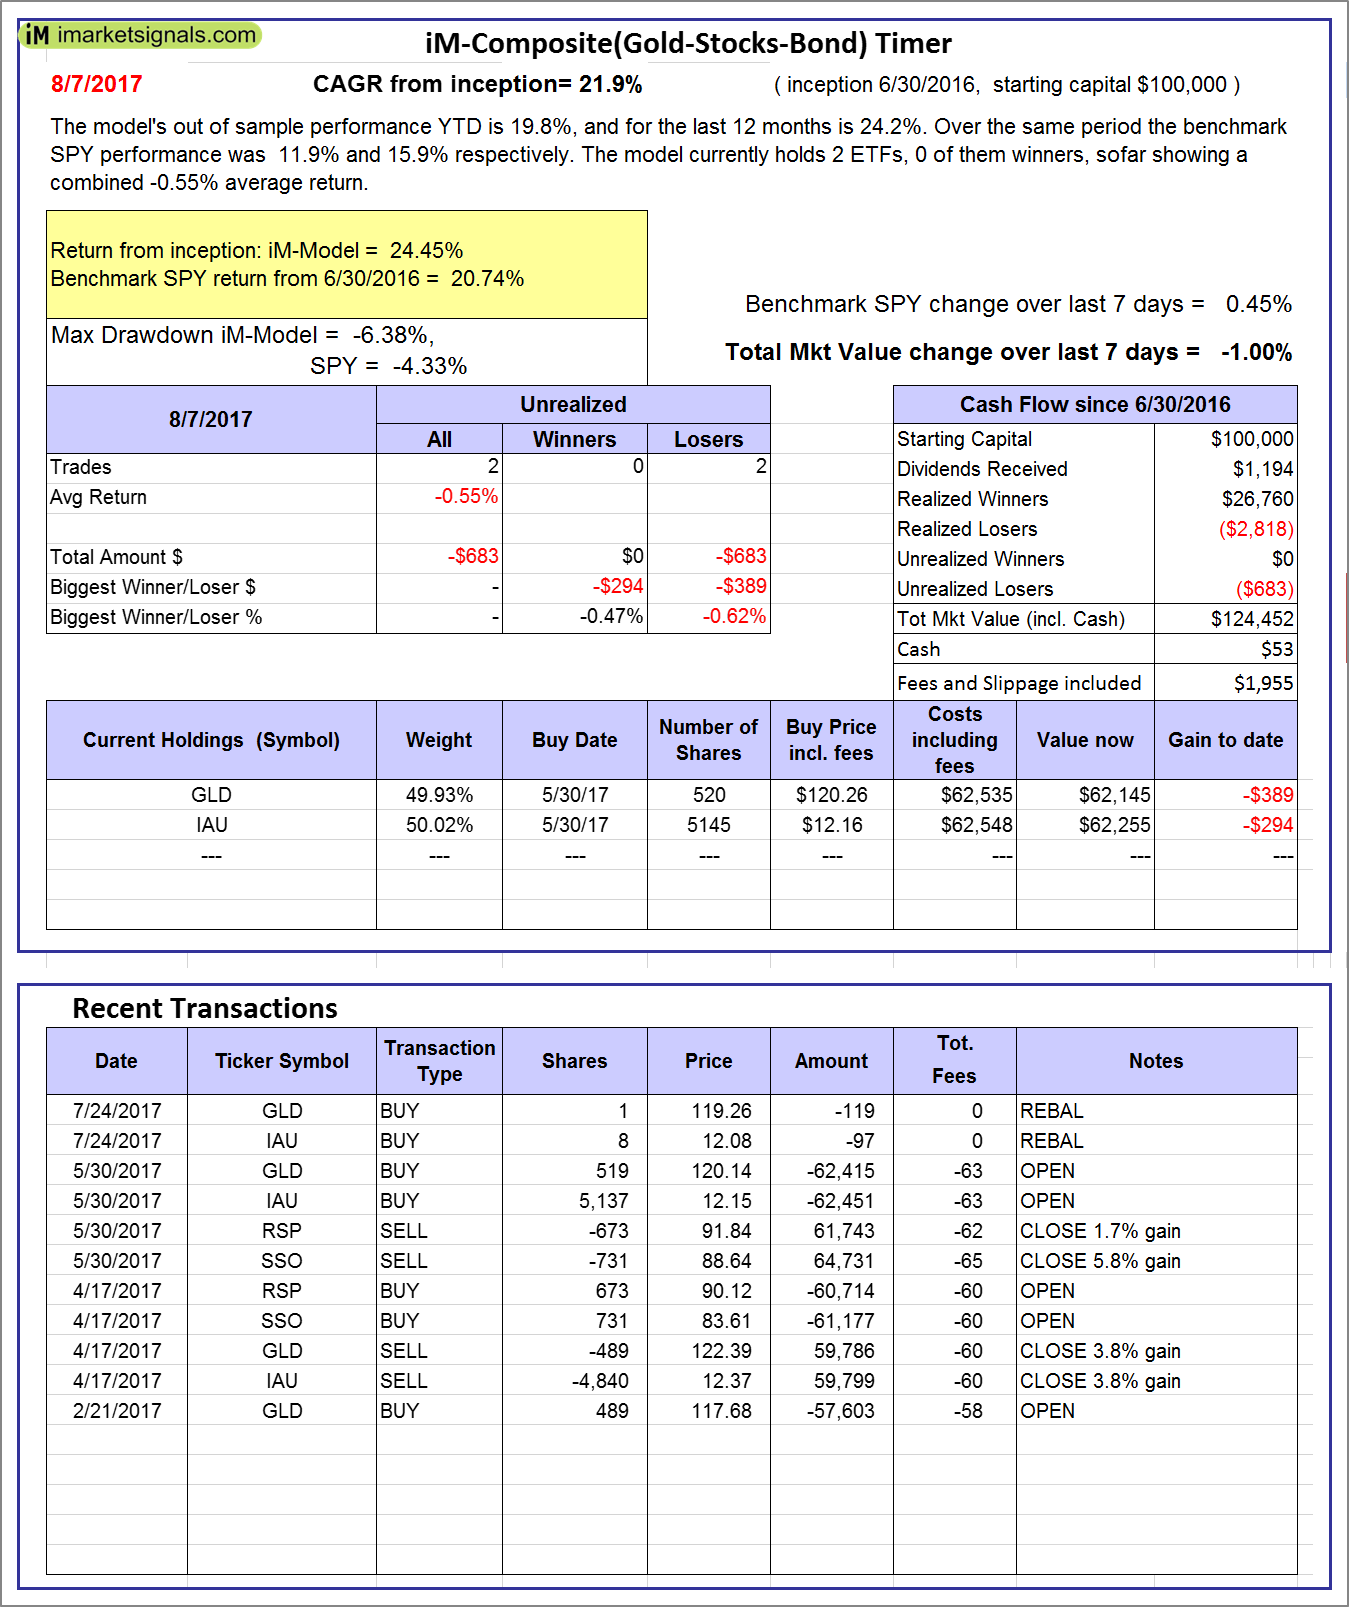
iM-Composite(Gold-Stocks-Bond) Timer: The model’s out of sample performance YTD is 19.8%, and for the last 12 months is 24.2%. Over the same period the benchmark SPY performance was 11.9% and 15.9% respectively. Over the previous week the market value of the iM-Composite(Gold-Stocks-Bond) Timer gained -1.00% at a time when SPY gained 0.45%. A starting capital of $100,000 at inception on 6/30/2016 would have grown to $124,452 which includes $53 cash and excludes $1,955 spent on fees and slippage. |
|
|
iM-Low Turnover Composite Timer Combo: The model’s out of sample performance from inception is 2.8%. The benchmark SPY performance over the same period is 6.5%. Over the previous week the market value of the iM-Low Turnover Composite Timer Combo gained -0.18% at a time when SPY gained 0.45%. A starting capital of $100,000 at inception on 3/24/27 would have grown to $102,815 which includes $645 cash and excludes $69 spent on fees and slippage. |
|
|
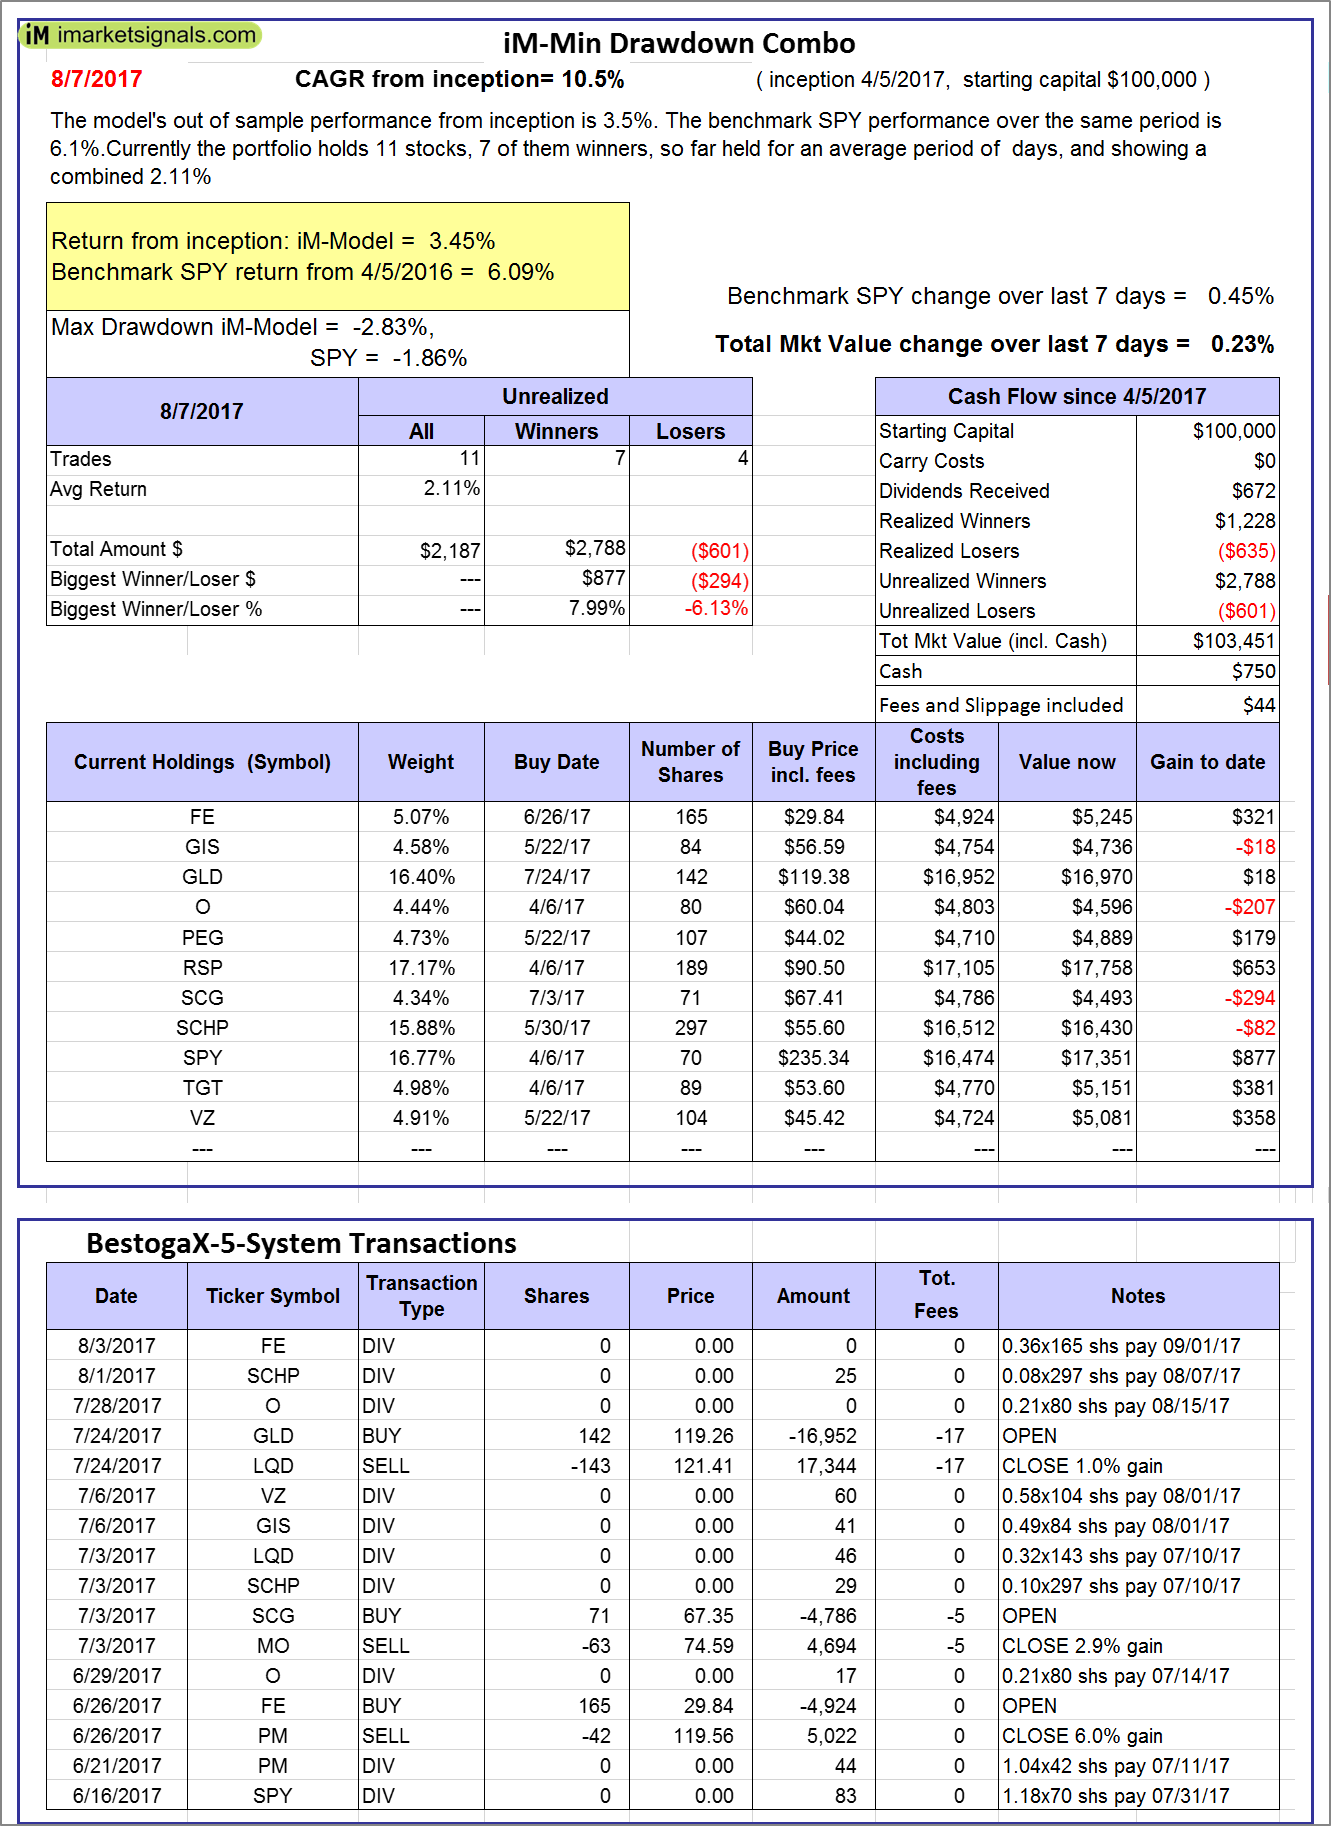
iM-Min Drawdown Combo: The model’s out of sample performance from inception is 3.5%. The benchmark SPY performance over the same period is 6.1%. Over the previous week the market value of the iM-Min Drawdown Combo gained 0.23% at a time when SPY gained 0.45%. A starting capital of $100,000 at inception on 4/5/2017 would have grown to $103,451 which includes $750 cash and excludes $44 spent on fees and slippage. |
|
|
iM-5ETF Trader (includes leveraged ETFs): The model’s out of sample performance YTD is 12.4%, and since inception 15.6%. Over the same period the benchmark SPY performance was 11.9% and 18.4% respectively. Over the previous week the market value of the iM-5ETF Trader (includes leveraged ETFs) gained 0.67% at a time when SPY gained 0.45%. A starting capital of $100,000 at inception on 10/30/2016 would have grown to $139,347 which includes $552 cash and excludes $1,030 spent on fees and slippage. |
|
|
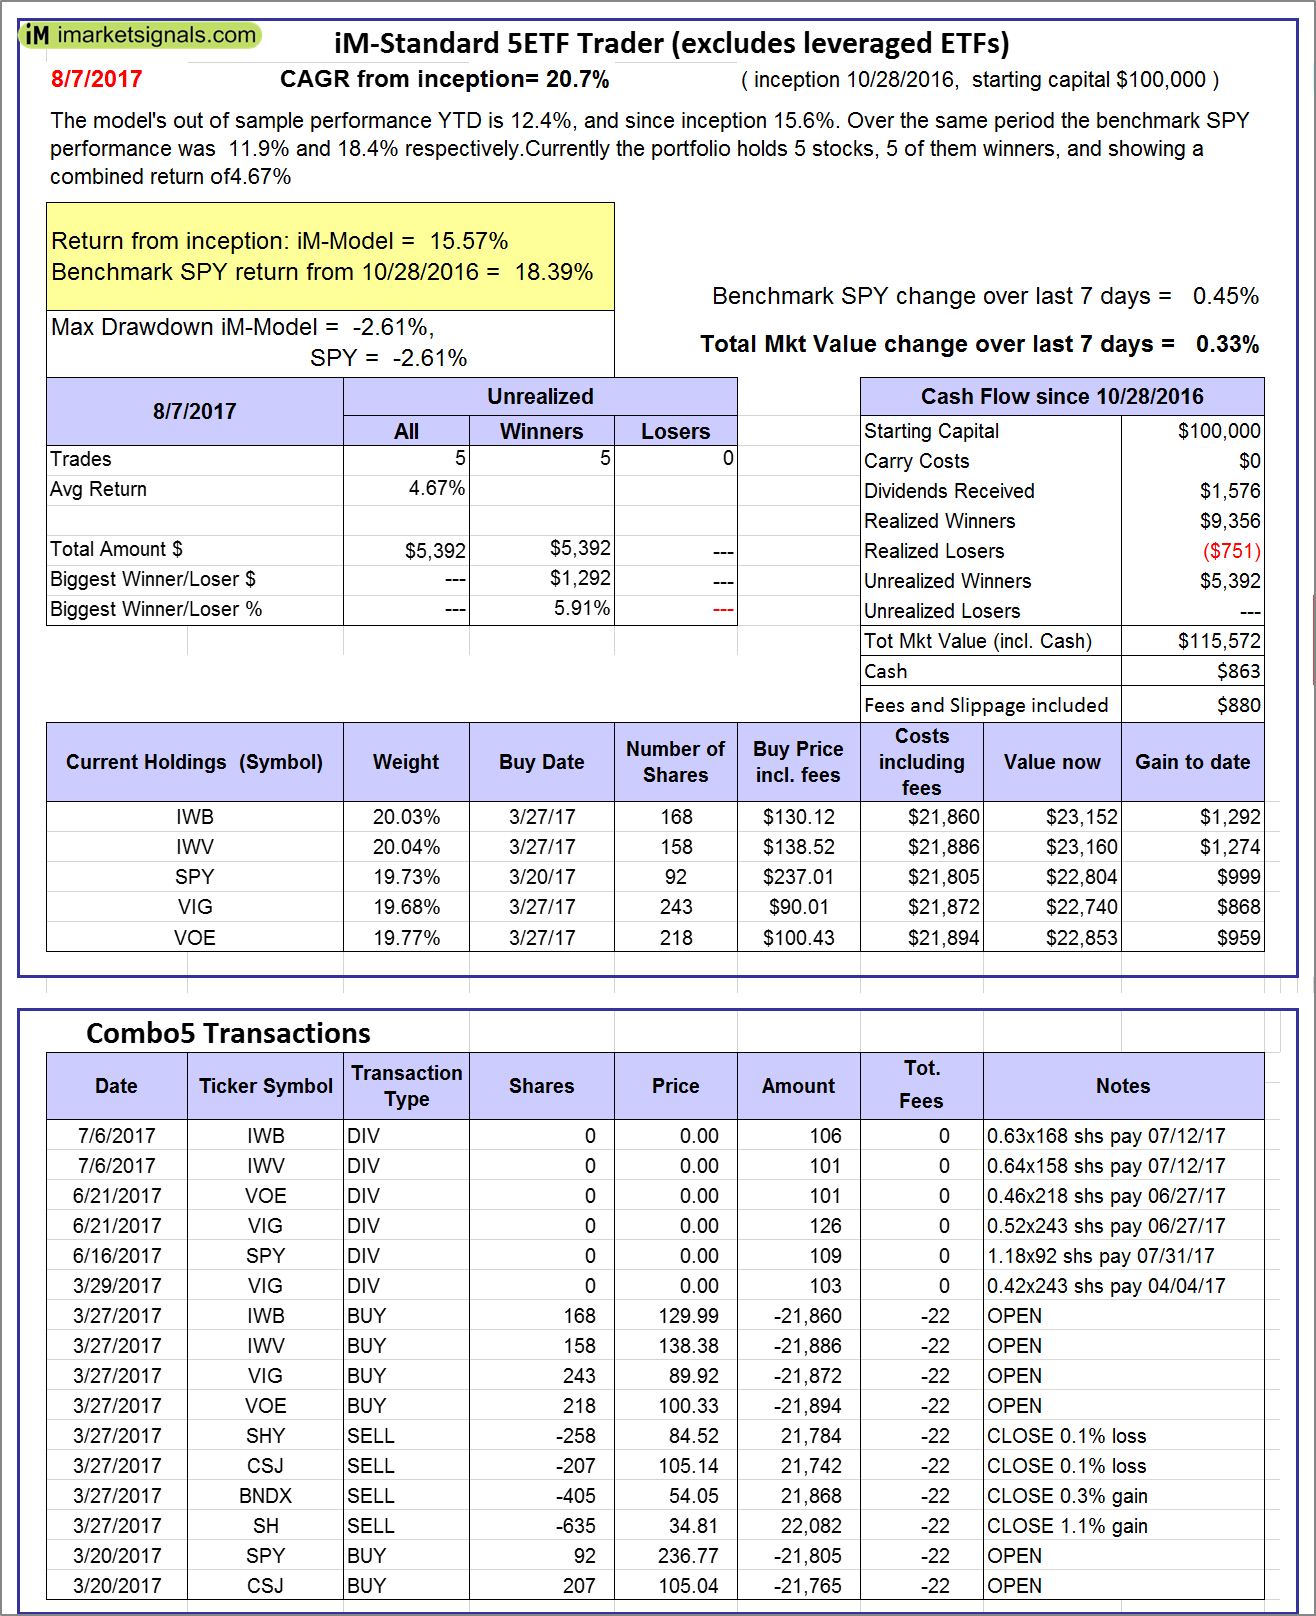
iM-Standard 5ETF Trader (excludes leveraged ETFs): The model’s out of sample performance YTD is 12.4%, and since inception 15.6%. Over the same period the benchmark SPY performance was 11.9% and 18.4% respectively. Over the previous week the market value of the iM-Standard 5ETF Trader (excludes leveraged ETFs) gained 0.33% at a time when SPY gained 0.45%. A starting capital of $100,000 at inception on 10/30/2016 would have grown to $115,572 which includes $863 cash and excludes $880 spent on fees and slippage. |


Leave a Reply
You must be logged in to post a comment.