  |
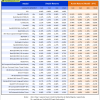
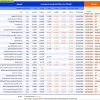
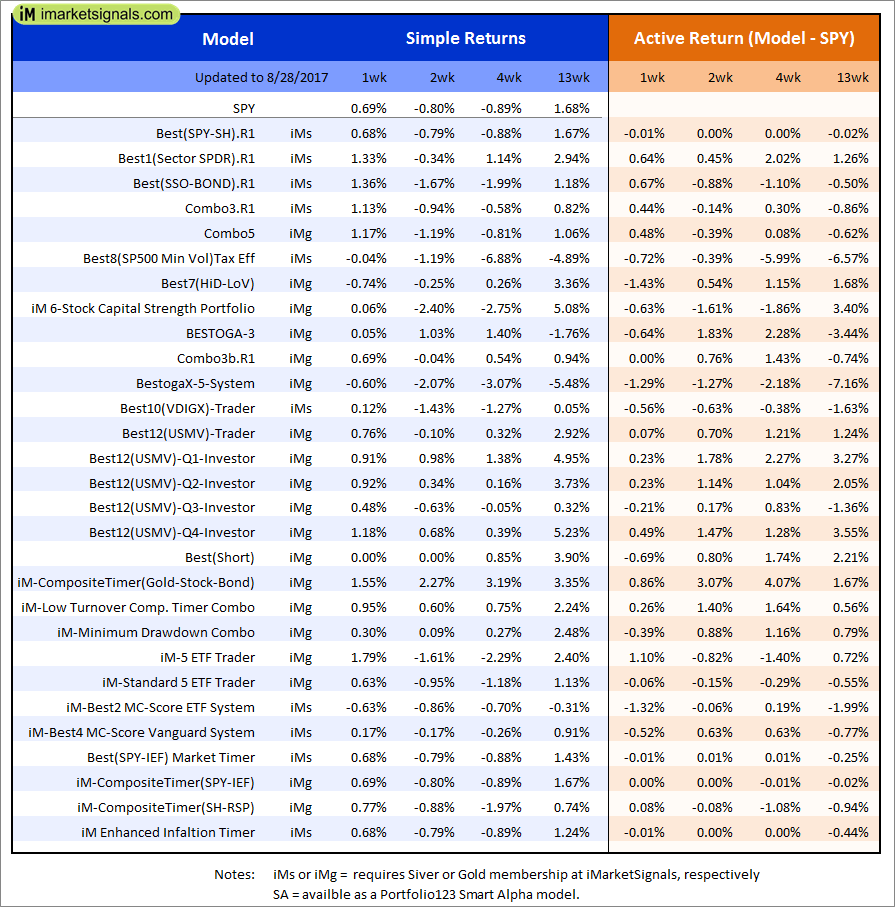
Out of sample performance summary of our models for the past 1, 2, 4 and 13 week periods. The active active return indicates how the models over- or underperformed the benchmark ETF SPY. Also the YTD, and the 1-, 3-, 5- and 10-year annualized returns are shown in the second table |
|
|
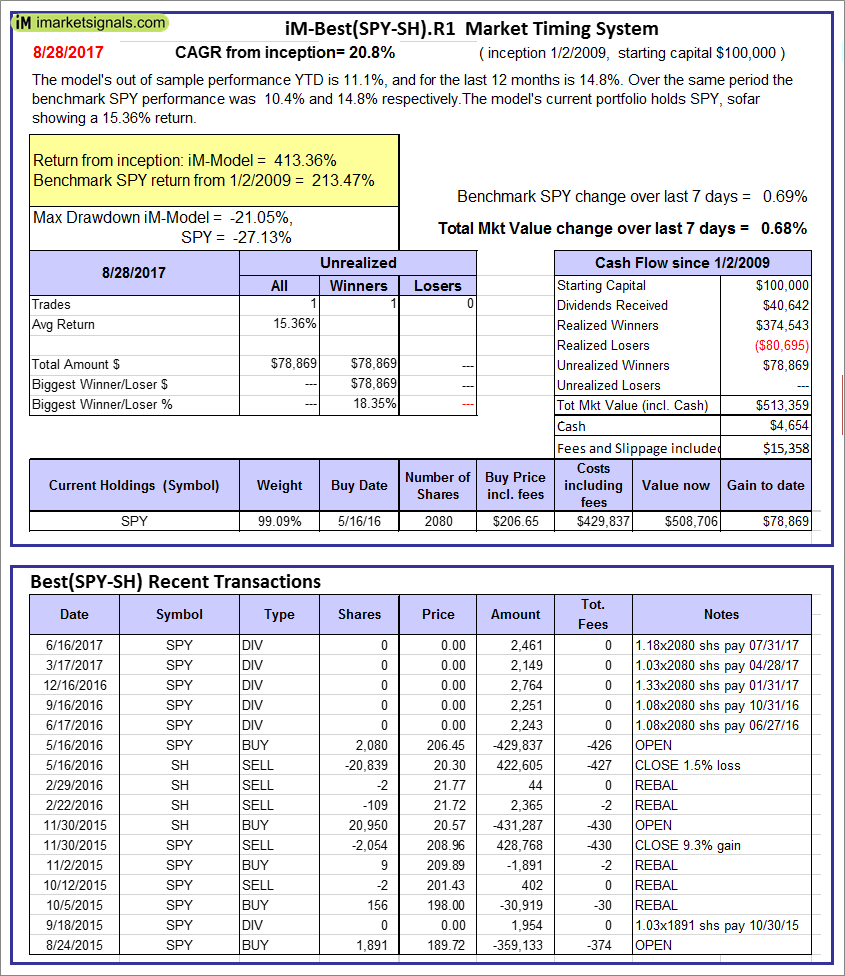
iM-Best(SPY-SH).R1: The model’s out of sample performance YTD is 11.1%, and for the last 12 months is 14.8%. Over the same period the benchmark SPY performance was 10.4% and 14.8% respectively. Over the previous week the market value of Best(SPY-SH) gained 0.68% at a time when SPY gained 0.69%. A starting capital of $100,000 at inception on 1/2/2009 would have grown to $513,359 which includes $4,654 cash and excludes $15,358 spent on fees and slippage. |
|
|
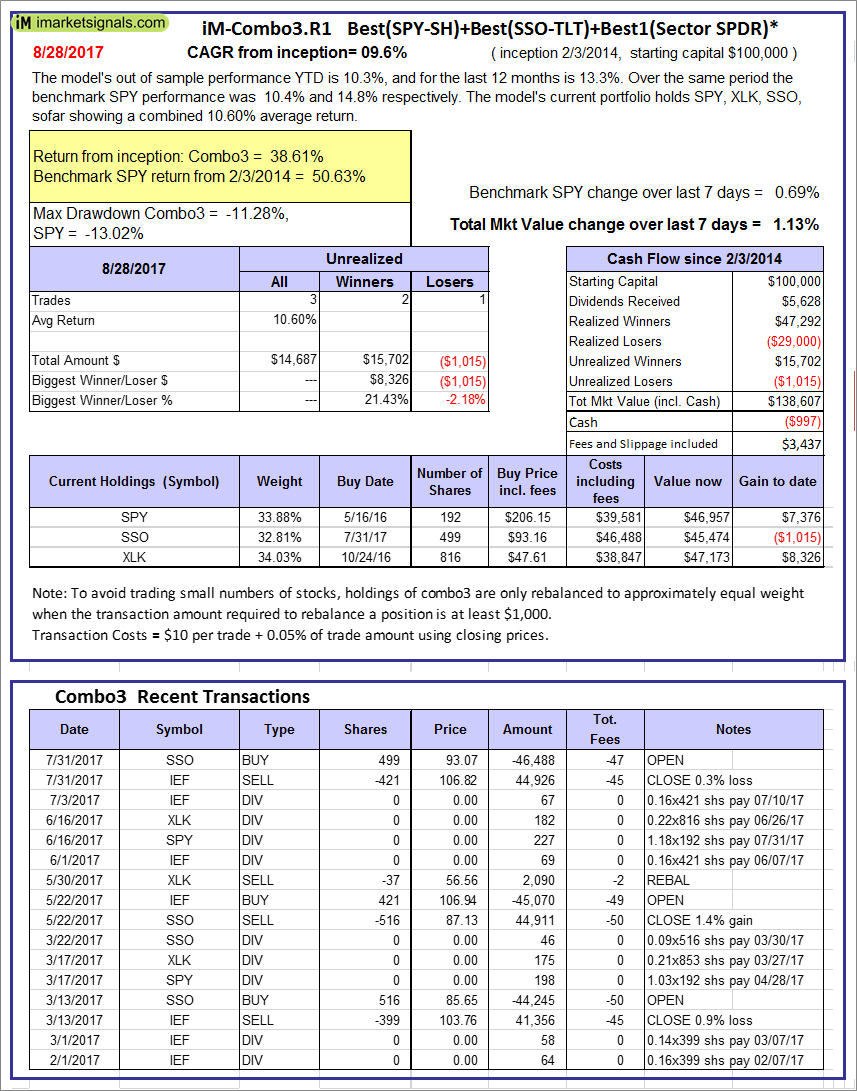
iM-Combo3.R1: The model’s out of sample performance YTD is 10.3%, and for the last 12 months is 13.3%. Over the same period the benchmark SPY performance was 10.4% and 14.8% respectively. Over the previous week the market value of iM-Combo3.R1 gained 1.13% at a time when SPY gained 0.69%. A starting capital of $100,000 at inception on 2/3/2014 would have grown to $138,607 which includes -$997 cash and excludes $3,437 spent on fees and slippage. |
|
|
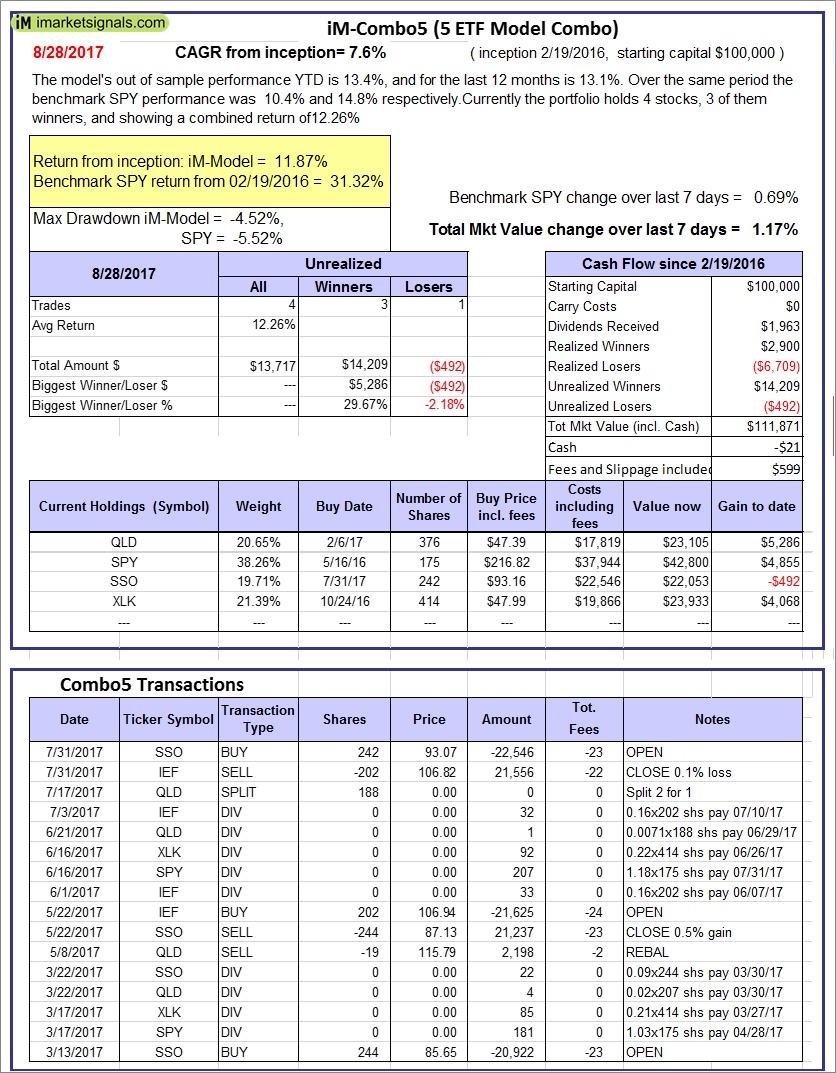
iM-Combo5: The model’s out of sample performance YTD is 13.4%, and for the last 12 months is 13.1%. Over the same period the benchmark SPY performance was 10.4% and 14.8% respectively. Over the previous week the market value of iM-Combo5 gained 1.17% at a time when SPY gained 0.69%. A starting capital of $100,000 at inception on 2/22/2016 would have grown to $111,871 which includes -$21 cash and excludes $599 spent on fees and slippage. |
|
|
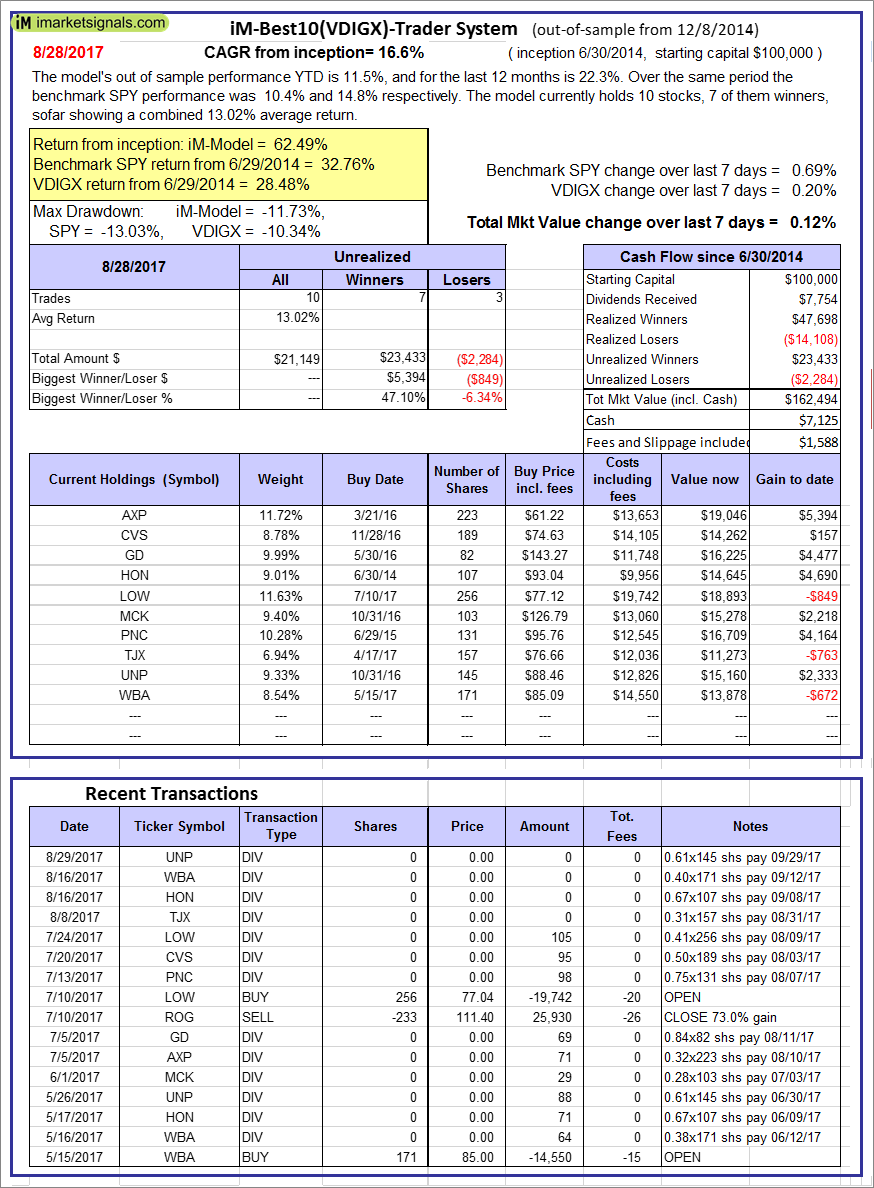
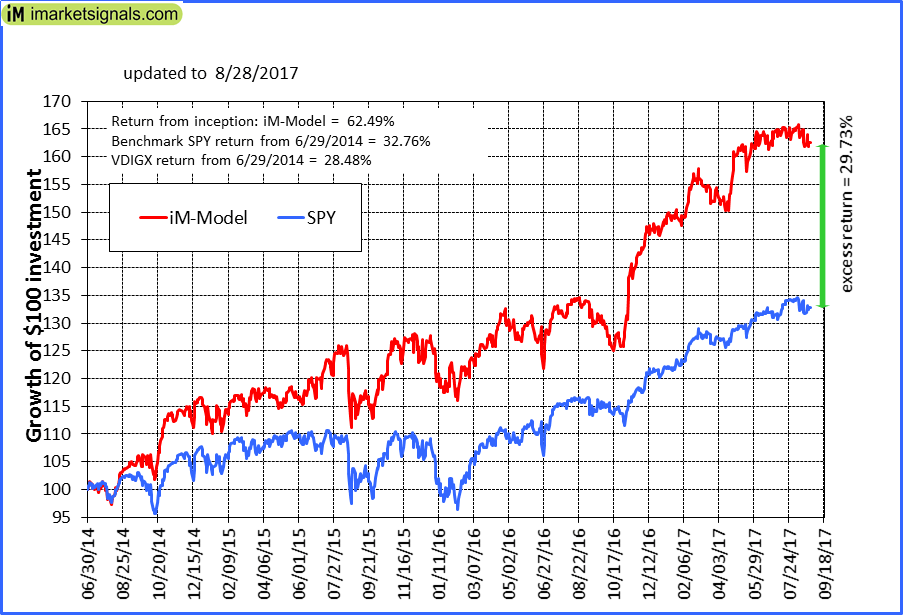
iM-Best10(VDIGX)-Trader: The model’s out of sample performance YTD is 11.5%, and for the last 12 months is 22.3%. Over the same period the benchmark SPY performance was 10.4% and 14.8% respectively. Since inception, on 7/1/2014, the model gained 62.49% while the benchmark SPY gained 32.76% and VDIGX gained 28.48% over the same period. Over the previous week the market value of iM-Best10(VDIGX) gained 0.12% at a time when SPY gained 0.69%. A starting capital of $100,000 at inception on 7/1/2014 would have grown to $162,494 which includes $7,125 cash and excludes $1,588 spent on fees and slippage. |
|
|
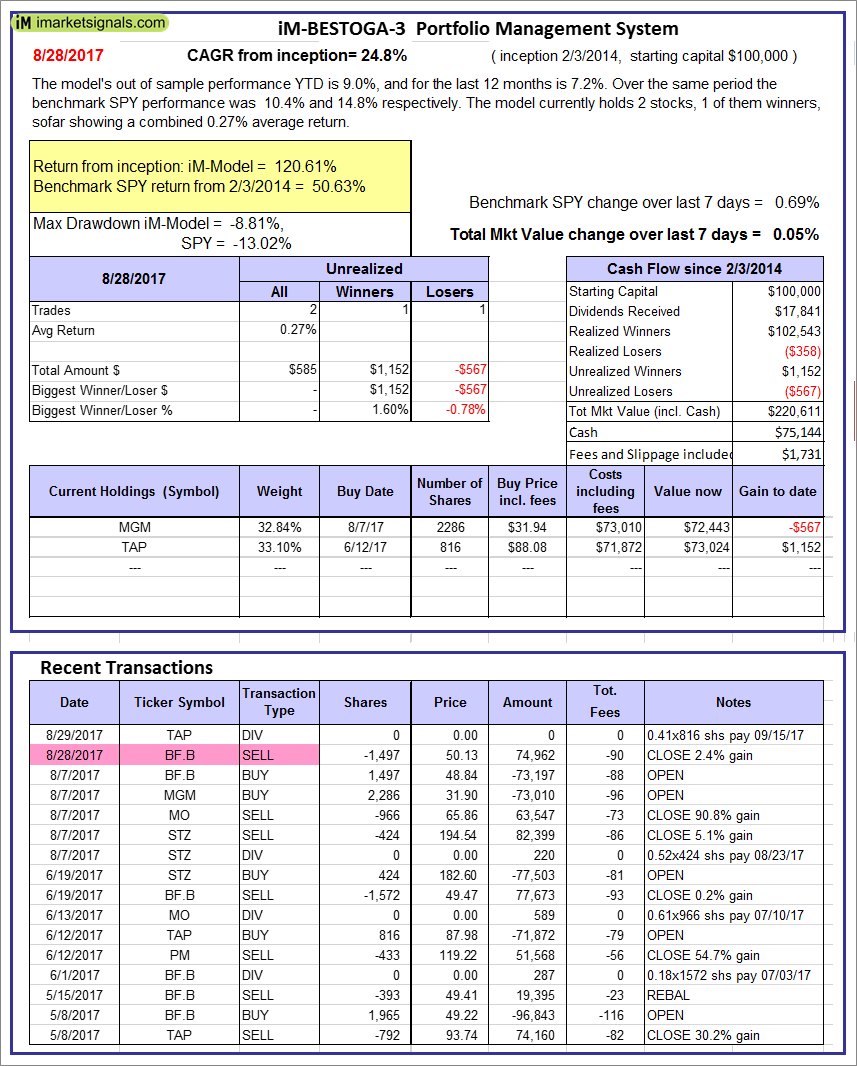
iM-BESTOGA-3: The model’s out of sample performance YTD is 9.0%, and for the last 12 months is 7.2%. Over the same period the benchmark SPY performance was 10.4% and 14.8% respectively. Over the previous week the market value of iM-BESTOGA-3 gained 0.05% at a time when SPY gained 0.69%. A starting capital of $100,000 at inception on 2/3/2014 would have grown to $220,611 which includes $75,144 cash and excludes $1,731 spent on fees and slippage. |
|
|
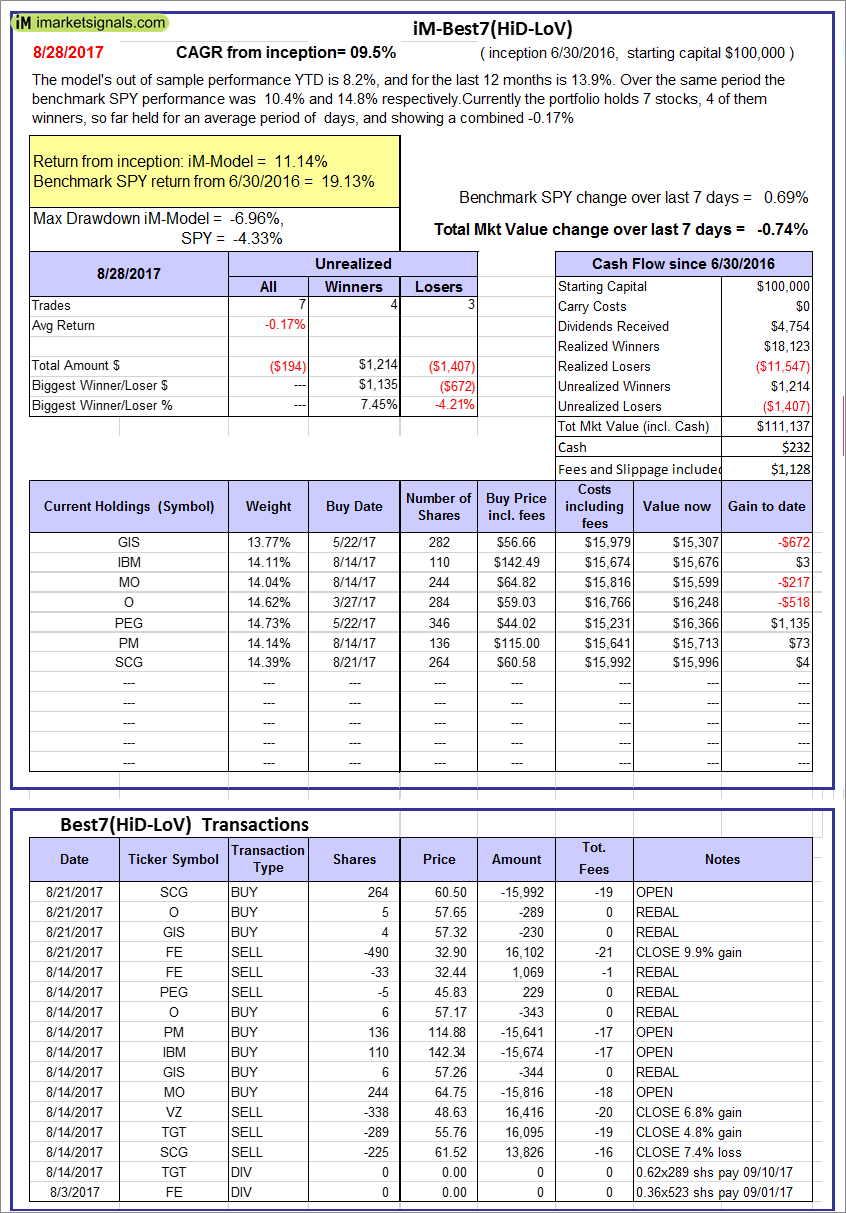
iM-Best7(HiD-LoV): The model’s out of sample performance YTD is 8.2%, and for the last 12 months is 13.9%. Over the same period the benchmark SPY performance was 10.4% and 14.8% respectively. Over the previous week the market value of iM-BESTOGA-3 gained -0.74% at a time when SPY gained 0.69%. A starting capital of $100,000 at inception on 6/30/2016 would have grown to $111,137 which includes $232 cash and excludes $1,128 spent on fees and slippage. |
|
|
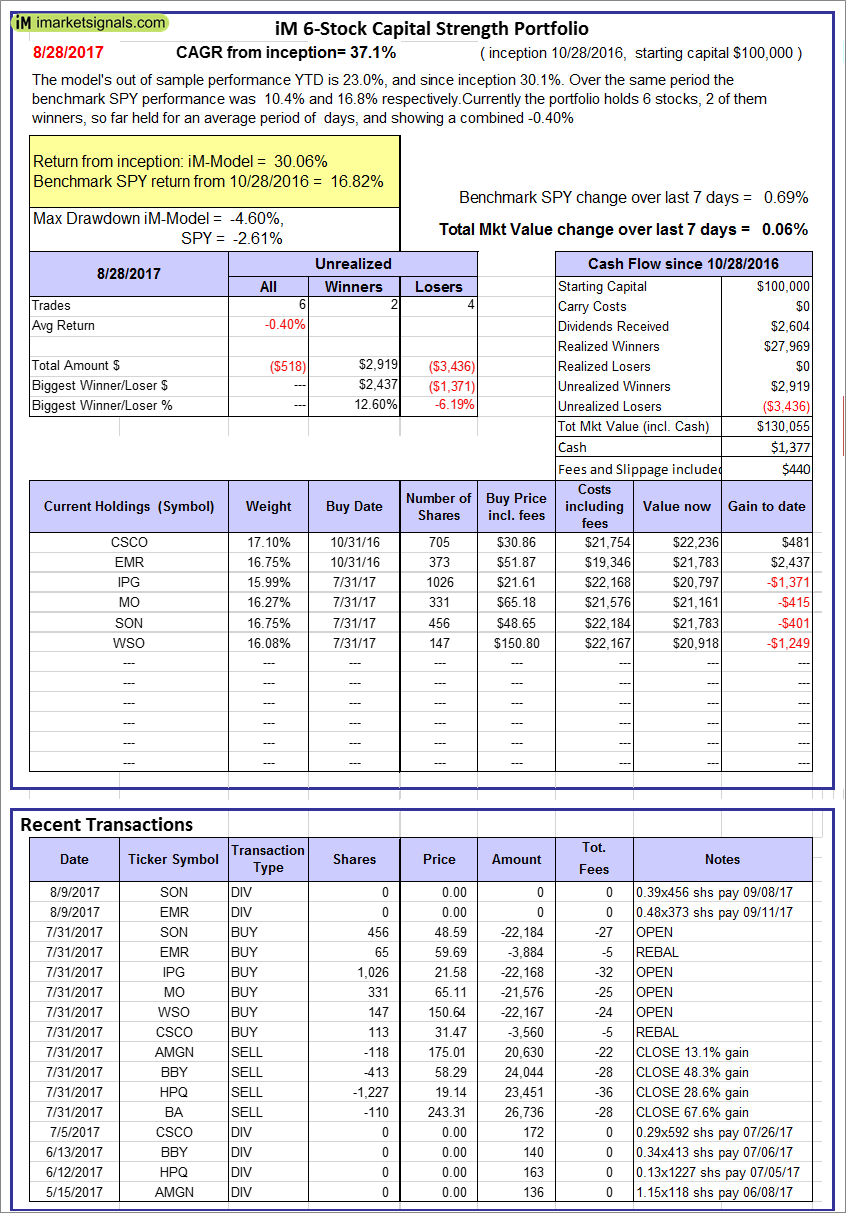
iM 6-Stock Capital Strength Portfolio: The model’s out of sample performance YTD is 23.0%, and since inception 30.1%. Over the same period the benchmark SPY performance was 10.4% and 16.8% respectively. Over the previous week the market value of the iM 6-Stock Capital Strength Portfolio gained 0.06% at a time when SPY gained 0.69%. A starting capital of $100,000 at inception on 10/28/2016 would have grown to $130,055 which includes $1,377 cash and excludes $440 spent on fees and slippage. |
|
|
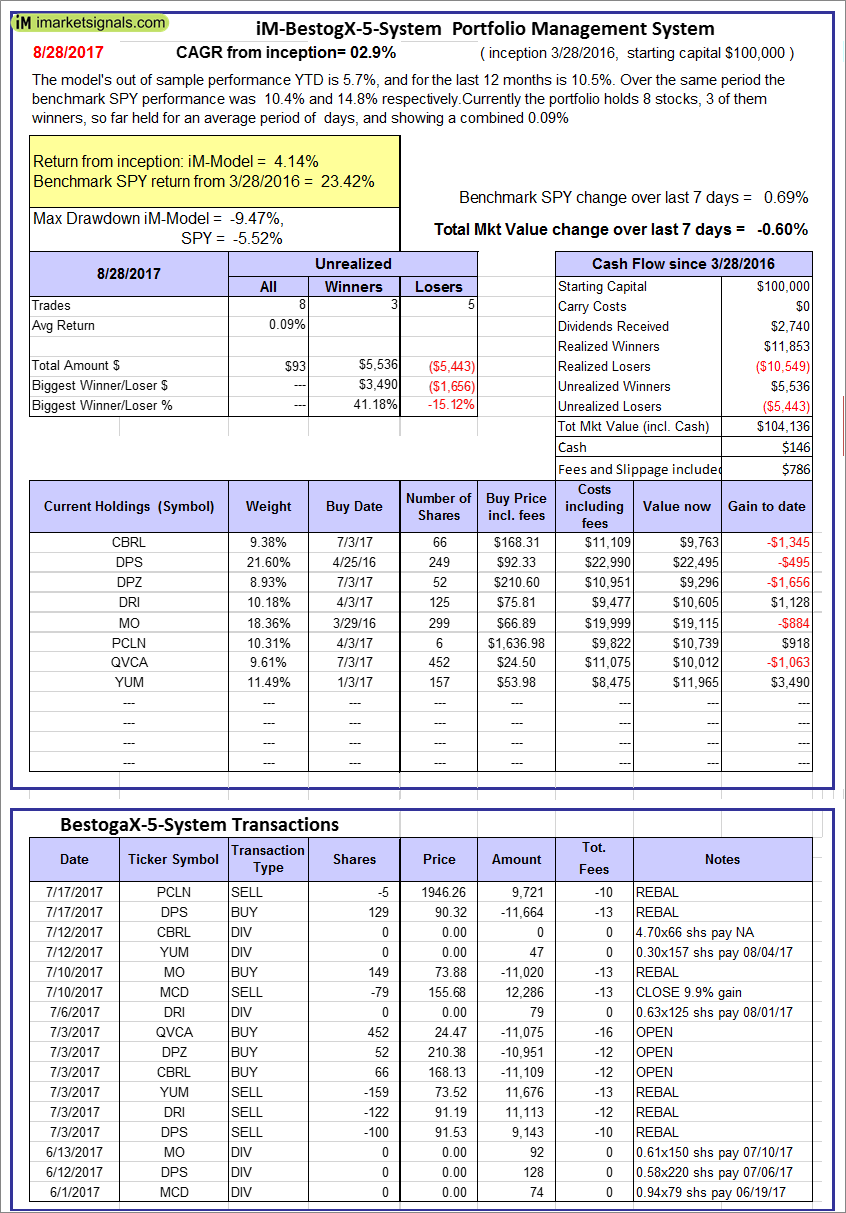
iM-BestogaX5-System: The model’s out of sample performance YTD is 5.7%, and for the last 12 months is 10.5%. Over the same period the benchmark SPY performance was 10.4% and 14.8% respectively. Over the previous week the market value of iM-Best8(S&P 500)Tax-Eff. gained -0.60% at a time when SPY gained 0.69%. A starting capital of $100,000 at inception on 3/28/2016 would have grown to $104,136 which includes $146 cash and excludes $786 spent on fees and slippage. |
|
|
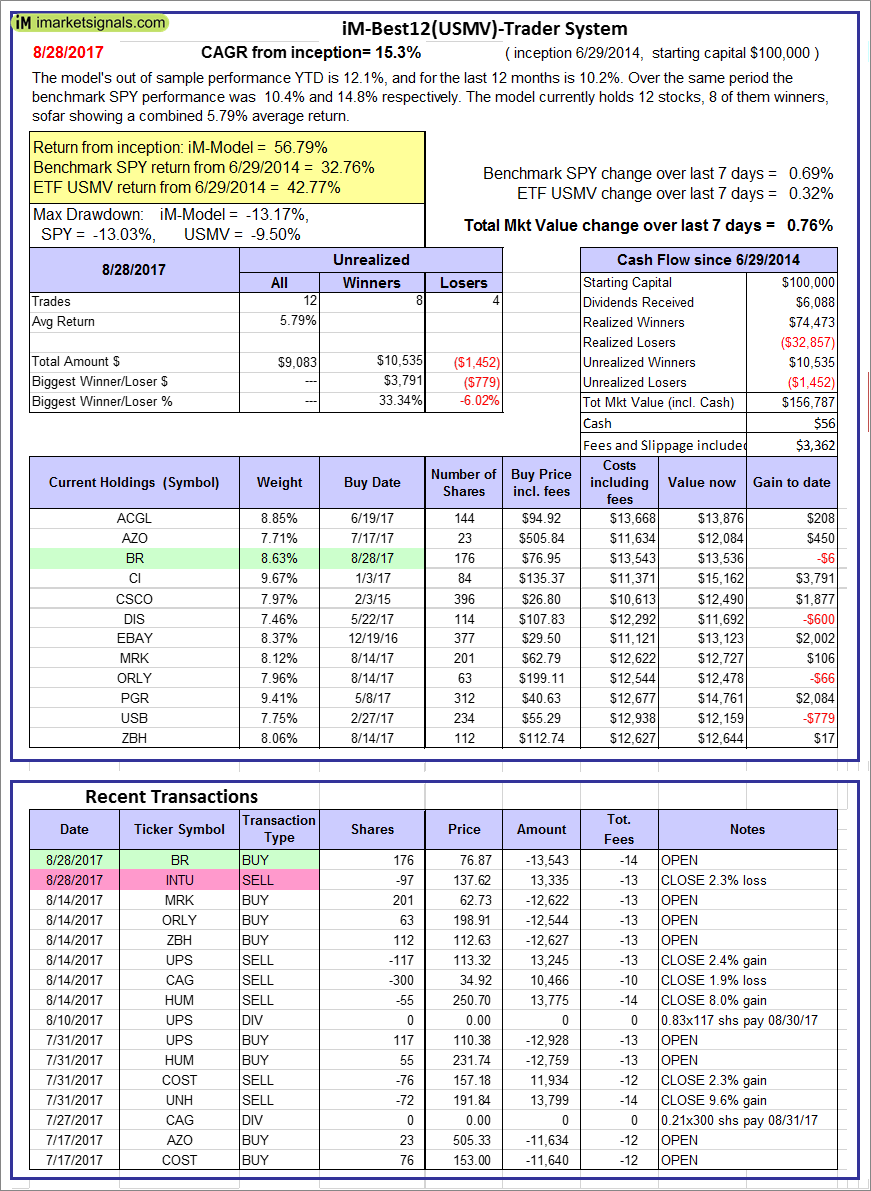
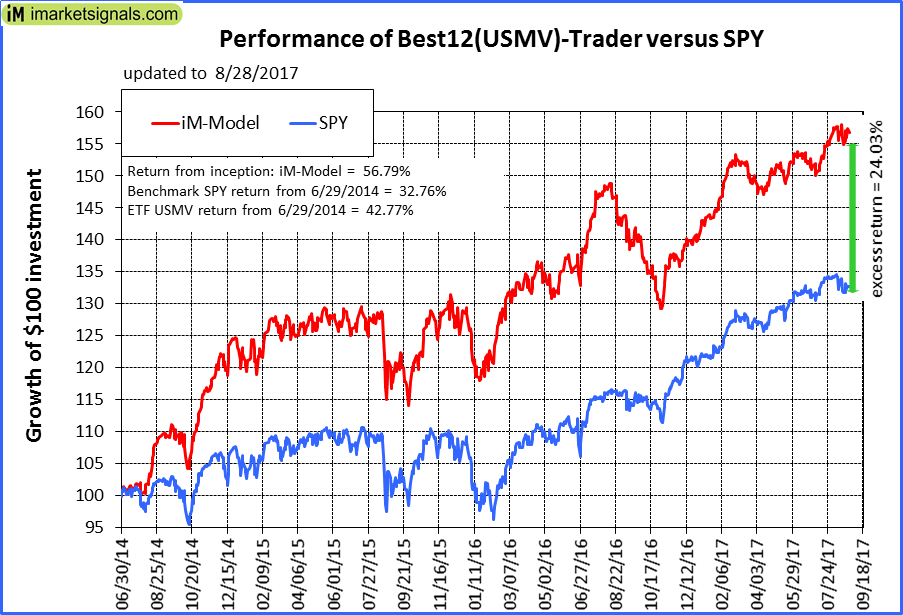
iM-Best12(USMV)-Trader: The model’s out of sample performance YTD is 12.1%, and for the last 12 months is 10.2%. Over the same period the benchmark SPY performance was 10.4% and 14.8% respectively. Since inception, on 6/30/2014, the model gained 56.79% while the benchmark SPY gained 32.76% and the ETF USMV gained 42.77% over the same period. Over the previous week the market value of iM-Best12(USMV)-Trader gained 0.76% at a time when SPY gained 0.69%. A starting capital of $100,000 at inception on 6/30/2014 would have grown to $156,787 which includes $56 cash and excludes $3,362 spent on fees and slippage. |
|
|
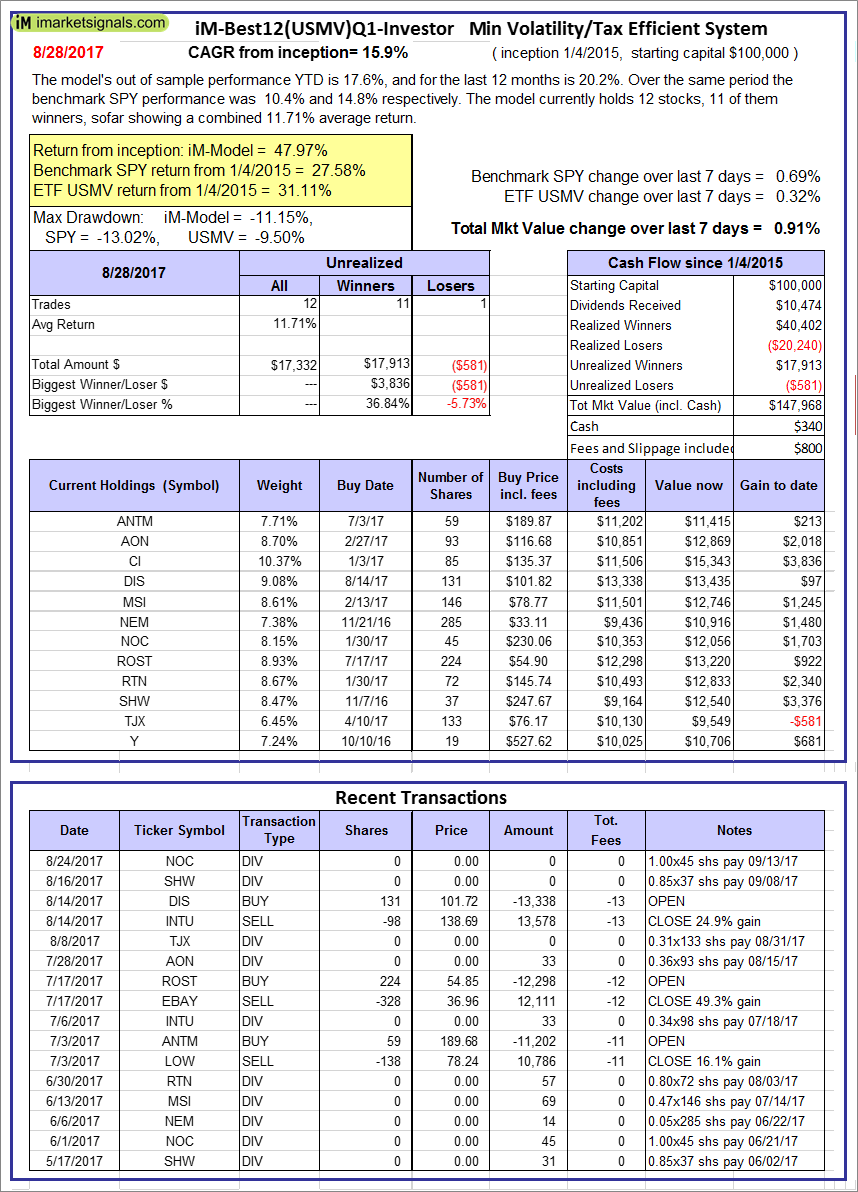
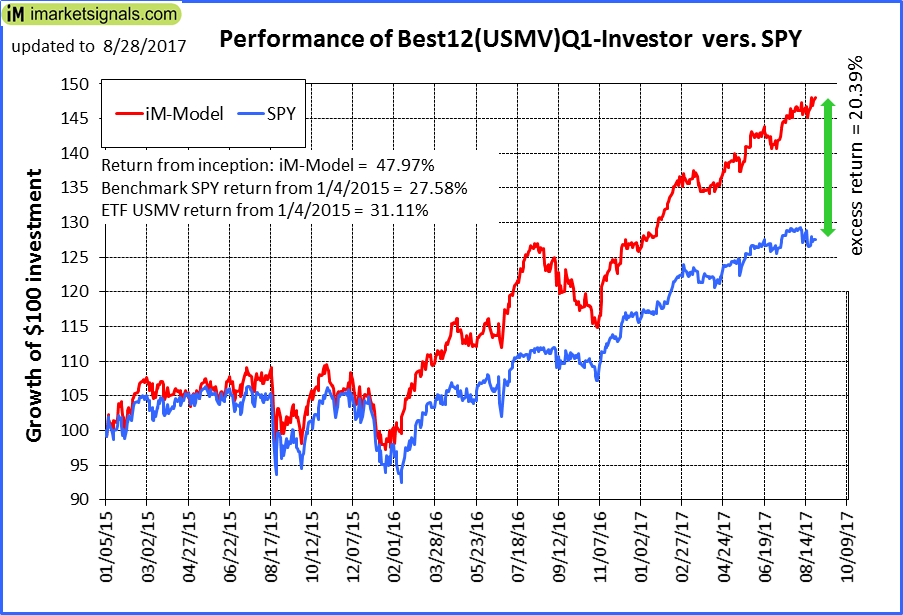
iM-Best12(USMV)Q1-Investor: The model’s out of sample performance YTD is 17.6%, and for the last 12 months is 20.2%. Over the same period the benchmark SPY performance was 10.4% and 14.8% respectively. Since inception, on 1/5/2015, the model gained 47.97% while the benchmark SPY gained 27.58% and the ETF USMV gained 31.11% over the same period. Over the previous week the market value of iM-Best12(USMV)Q1 gained 0.91% at a time when SPY gained 0.69%. A starting capital of $100,000 at inception on 1/5/2015 would have grown to $147,968 which includes $340 cash and excludes $800 spent on fees and slippage. |
|
|
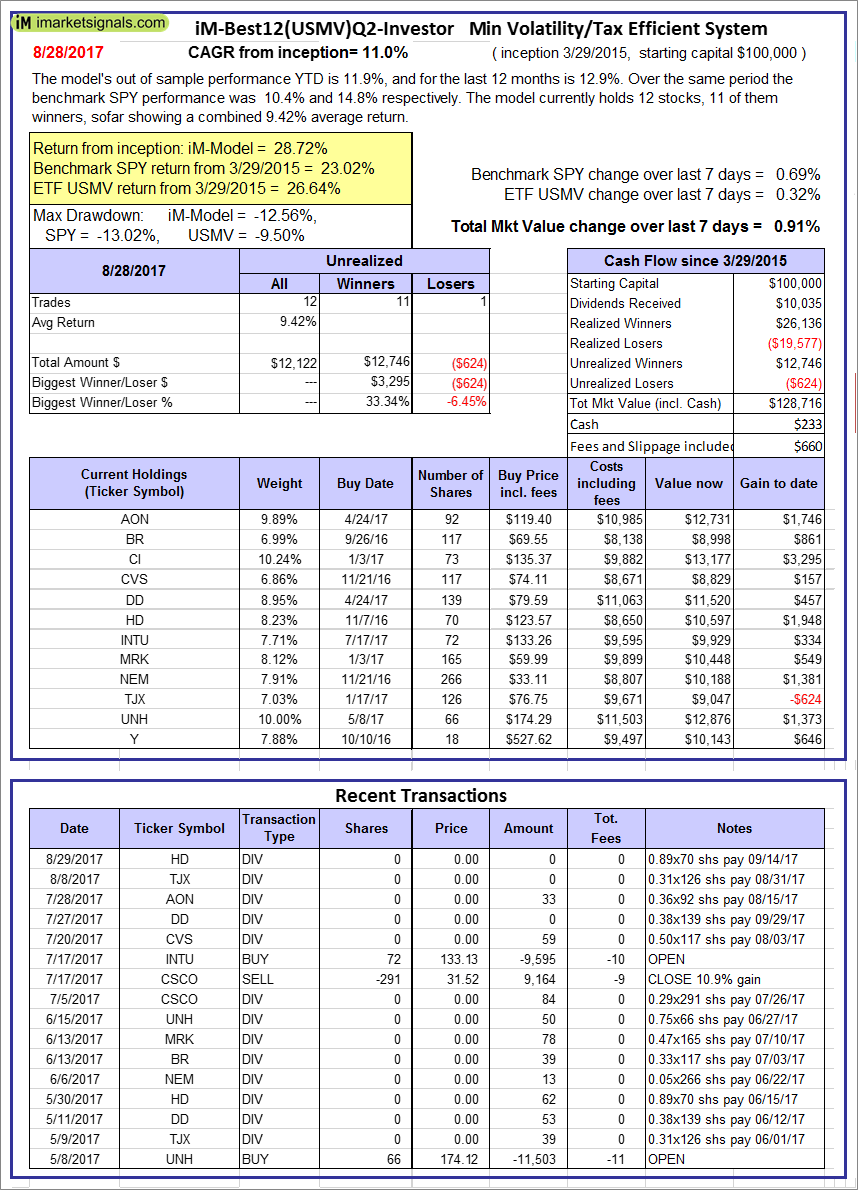
iM-Best12(USMV)Q2-Investor: The model’s out of sample performance YTD is 11.9%, and for the last 12 months is 12.9%. Over the same period the benchmark SPY performance was 10.4% and 14.8% respectively. Since inception, on 3/30/2015, the model gained 28.72% while the benchmark SPY gained 23.02% and the ETF USMV gained 26.64% over the same period. Over the previous week the market value of iM-Best12(USMV)Q2 gained 0.91% at a time when SPY gained 0.69%. A starting capital of $100,000 at inception on 3/30/2015 would have grown to $128,716 which includes $233 cash and excludes $660 spent on fees and slippage. |
|
|
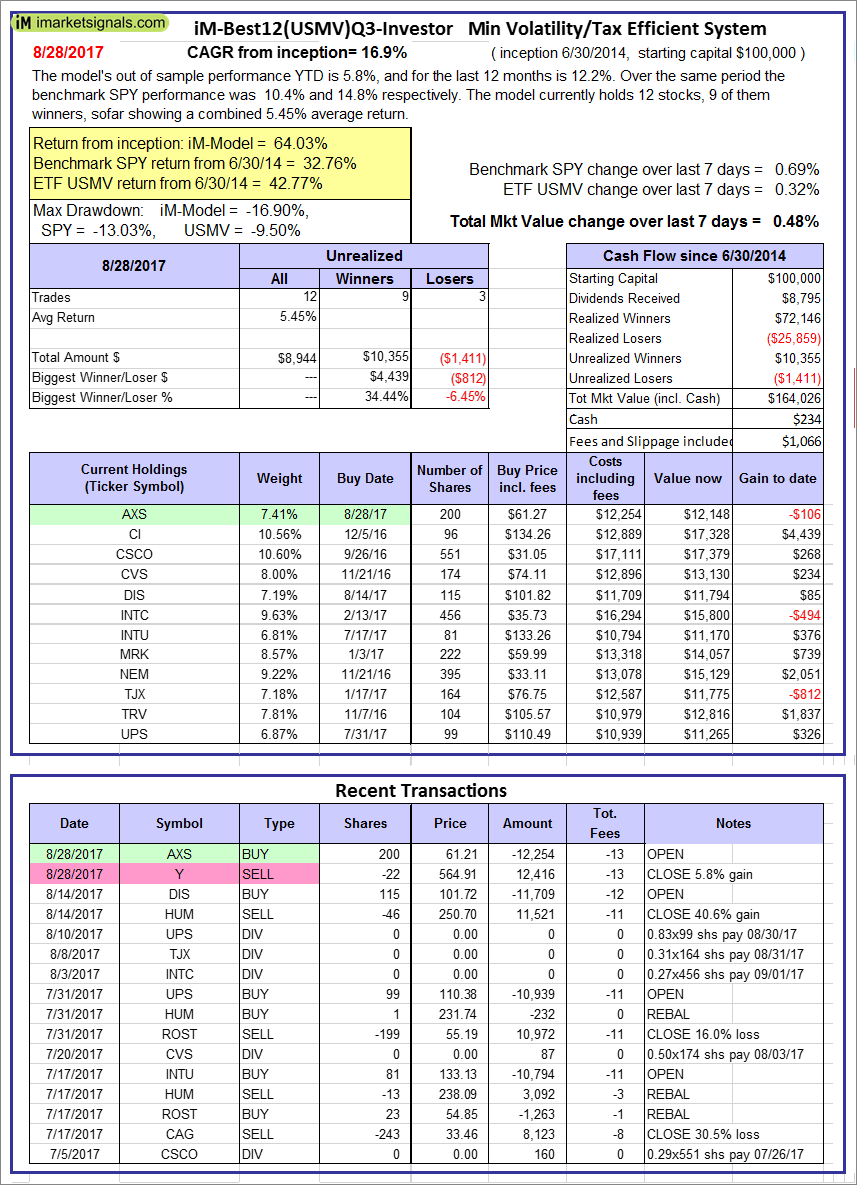
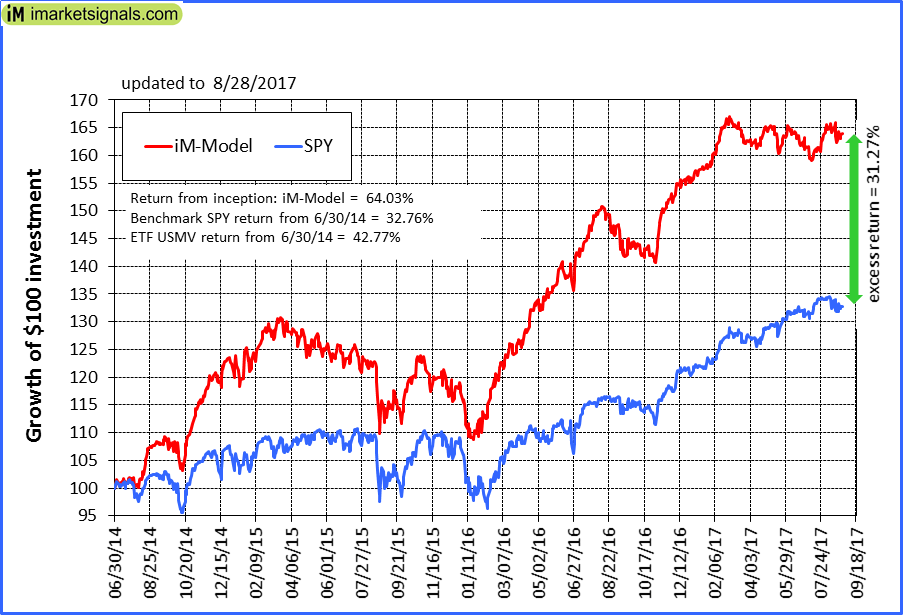
iM-Best12(USMV)Q3-Investor: The model’s out of sample performance YTD is 5.8%, and for the last 12 months is 12.2%. Over the same period the benchmark SPY performance was 10.4% and 14.8% respectively. Since inception, on 7/1/2014, the model gained 64.03% while the benchmark SPY gained 32.76% and the ETF USMV gained 42.77% over the same period. Over the previous week the market value of iM-Best12(USMV)Q3 gained 0.48% at a time when SPY gained 0.69%. A starting capital of $100,000 at inception on 7/1/2014 would have grown to $164,026 which includes $234 cash and excludes $1,066 spent on fees and slippage. |
|
|
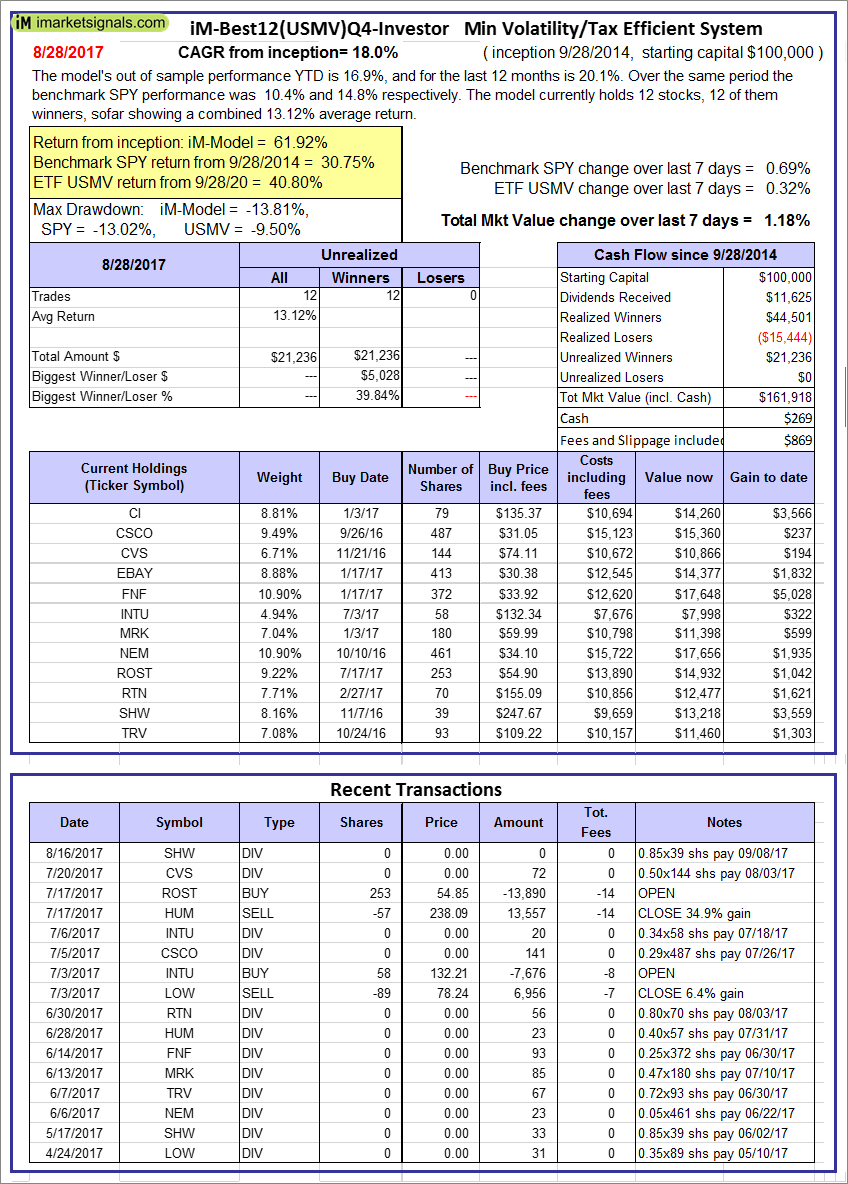
iM-Best12(USMV)Q4-Investor: Since inception, on 9/29/2014, the model gained 61.92% while the benchmark SPY gained 30.75% and the ETF USMV gained 40.80% over the same period. Over the previous week the market value of iM-Best12(USMV)Q4 gained 1.18% at a time when SPY gained 0.69%. A starting capital of $100,000 at inception on 9/29/2014 would have grown to $161,918 which includes $269 cash and excludes $869 spent on fees and slippage. |
|
|
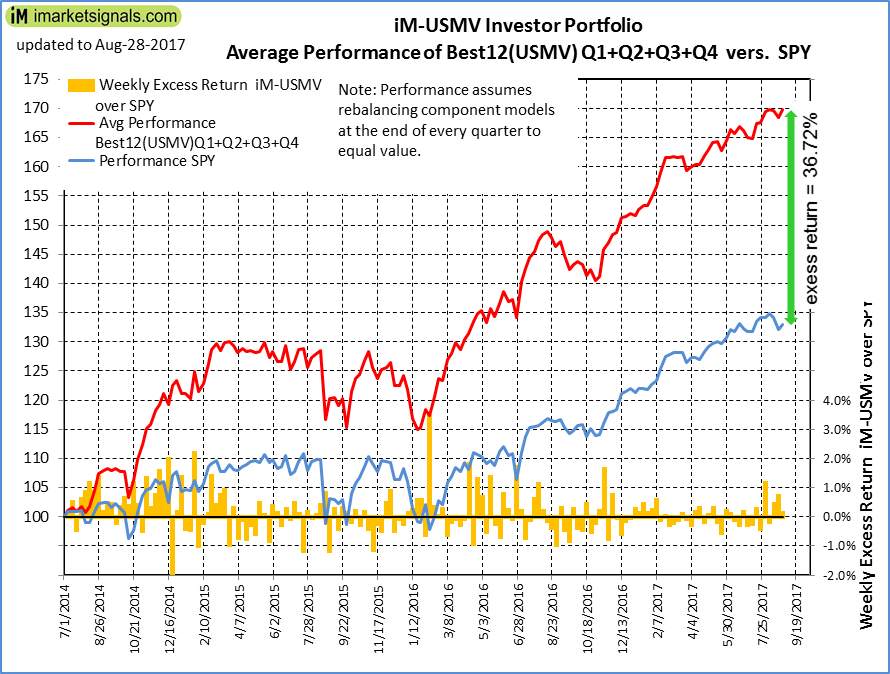
Average Performance of iM-Best12(USMV)Q1+Q2+Q3+Q4-Investor resulted in an excess return of 36.72% over SPY. (see iM-USMV Investor Portfolio) |
|
|
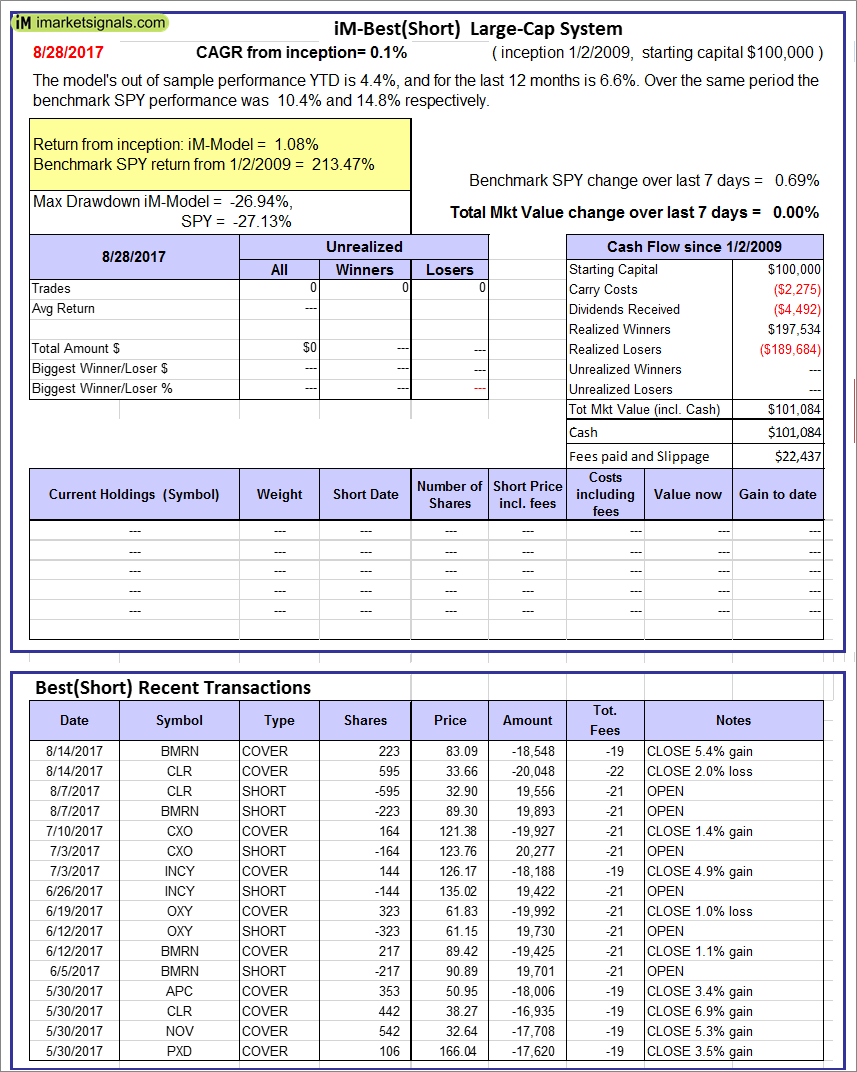
iM-Best(Short): The model’s out of sample performance YTD is 4.4%, and for the last 12 months is 6.6%. Over the same period the benchmark SPY performance was 10.4% and 14.8% respectively. Over the previous week the market value of iM-Best(Short) gained 0.00% at a time when SPY gained 0.69%. Over the period 1/2/2009 to 8/28/2017 the starting capital of $100,000 would have grown to $101,084 which includes $101,084 cash and excludes $22,437 spent on fees and slippage. |
|
|
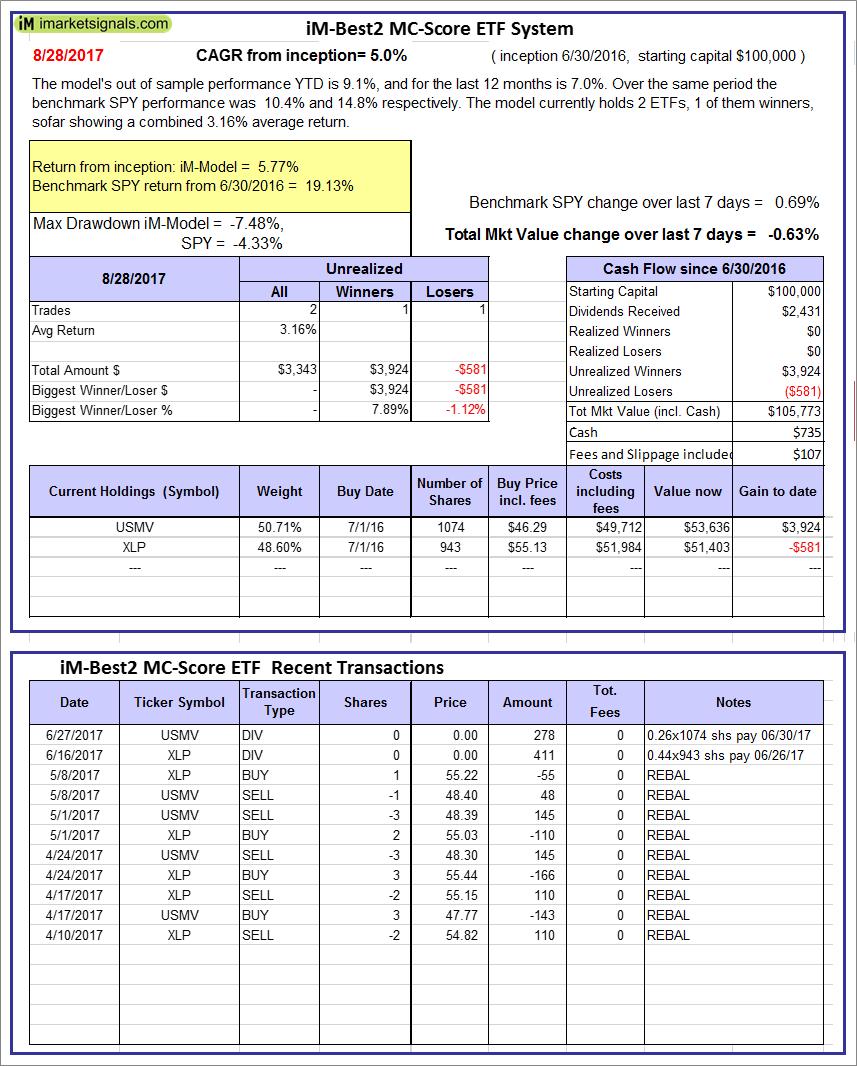
iM-Best2 MC-Score ETF System: The model’s out of sample performance YTD is 9.1%, and for the last 12 months is 7.0%. Over the same period the benchmark SPY performance was 10.4% and 14.8% respectively. Over the previous week the market value of the iM-Best2 MC-Score ETF System gained -0.63% at a time when SPY gained 0.69%. A starting capital of $100,000 at inception on 6/30/2016 would have grown to $105,773 which includes $735 cash and excludes $107 spent on fees and slippage. |
|
|
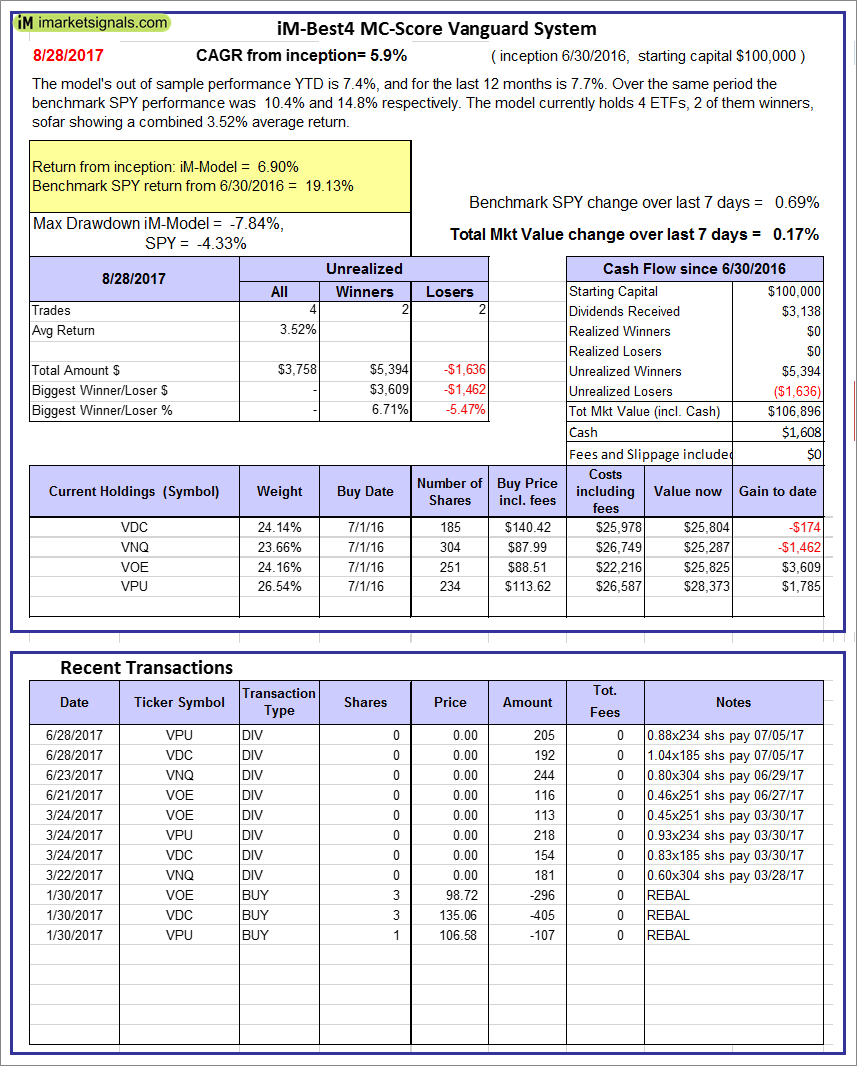
iM-Best4 MC-Score Vanguard System: The model’s out of sample performance YTD is 7.4%, and for the last 12 months is 7.7%. Over the same period the benchmark SPY performance was 10.4% and 14.8% respectively. Over the previous week the market value of the iM-Best4 MC-Score Vanguard System gained 0.17% at a time when SPY gained 0.69%. A starting capital of $100,000 at inception on 6/30/2016 would have grown to $106,896 which includes $1,608 cash and excludes $00 spent on fees and slippage. |
|
|
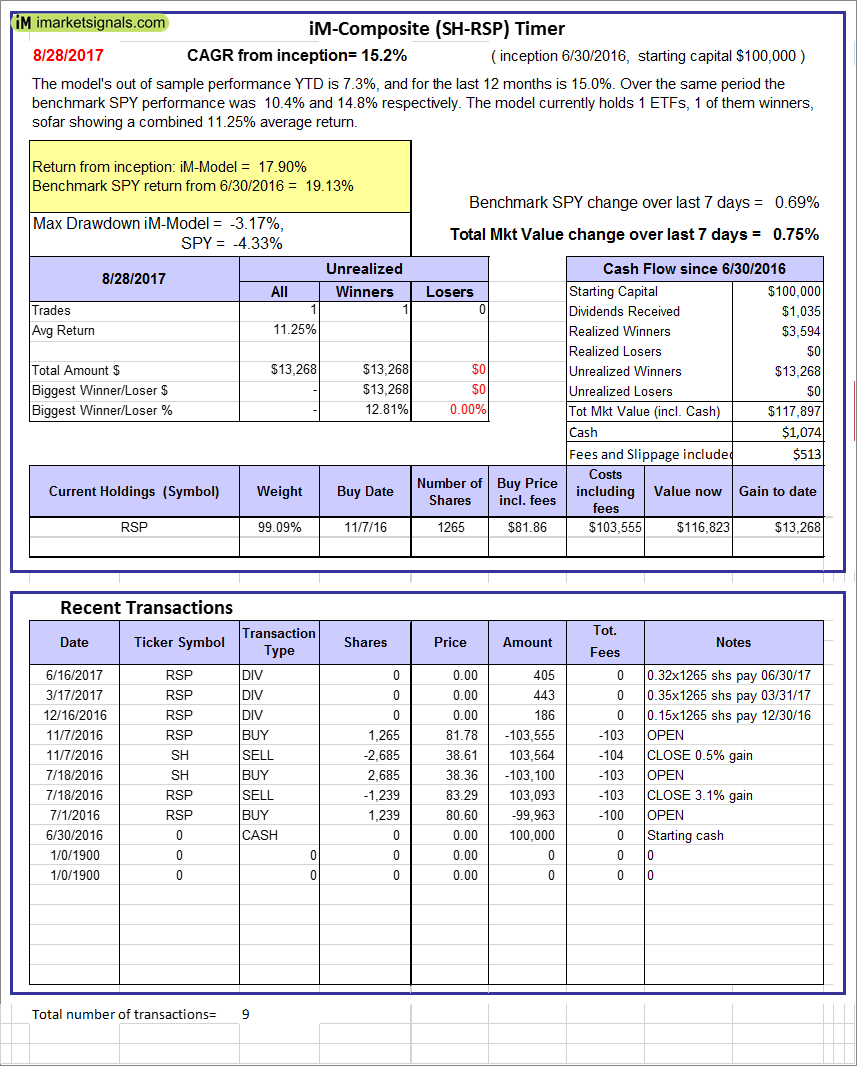
iM-Composite (SH-RSP) Timer: The model’s out of sample performance YTD is 7.3%, and for the last 12 months is 15.0%. Over the same period the benchmark SPY performance was 10.4% and 14.8% respectively. Over the previous week the market value of the iM-Composite (SH-RSP) Timer gained 0.75% at a time when SPY gained 0.69%. A starting capital of $100,000 at inception on 6/30/2016 would have grown to $117,897 which includes $1,074 cash and excludes $513 spent on fees and slippage. |
|
|
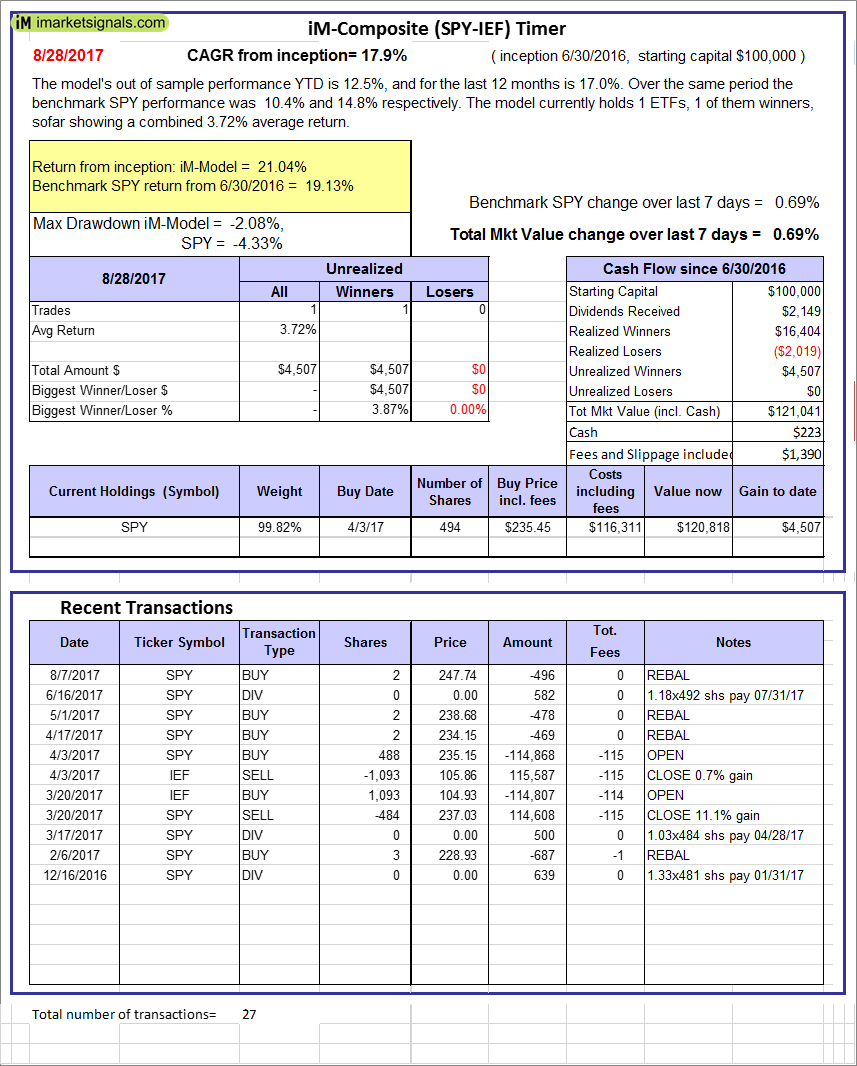
iM-Composite (SPY-IEF) Timer: The model’s out of sample performance YTD is 12.5%, and for the last 12 months is 17.0%. Over the same period the benchmark SPY performance was 10.4% and 14.8% respectively. Over the previous week the market value of the iM-Composite (SPY-IEF) Timer gained 0.69% at a time when SPY gained 0.69%. A starting capital of $100,000 at inception on 6/30/2016 would have grown to $121,041 which includes $223 cash and excludes $1,390 spent on fees and slippage. |
|
|
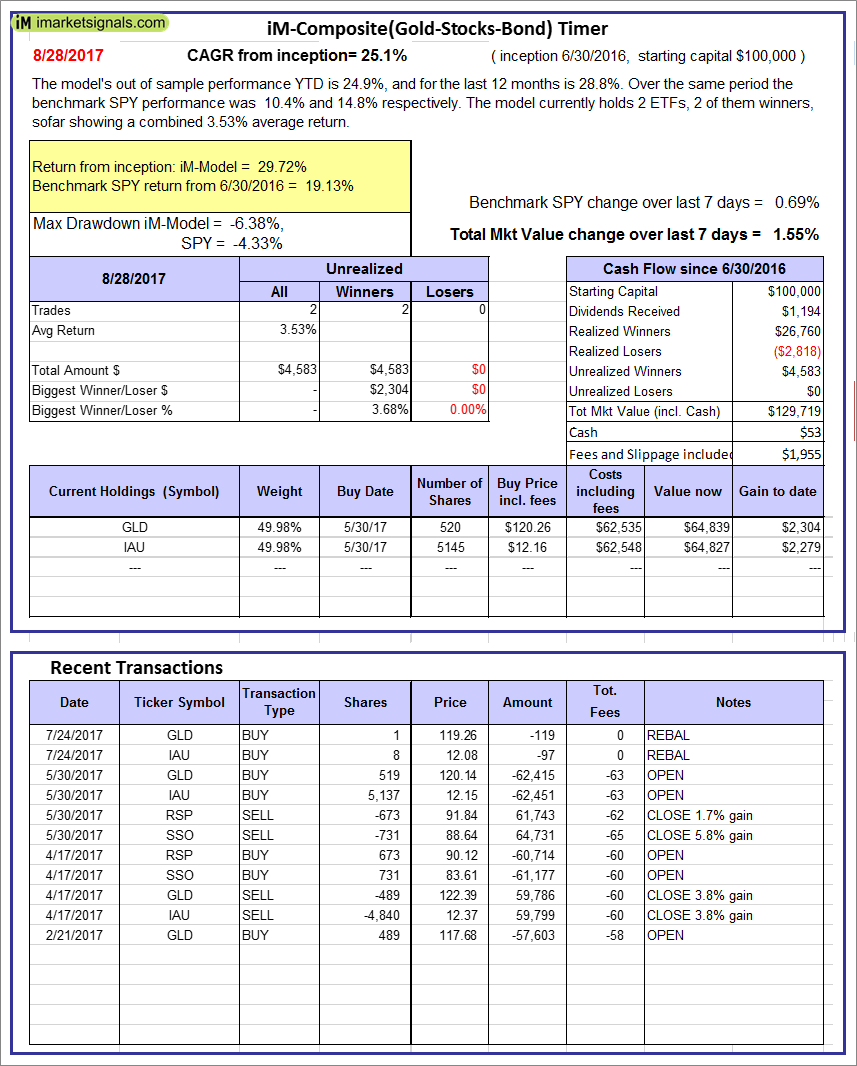
iM-Composite(Gold-Stocks-Bond) Timer: The model’s out of sample performance YTD is 24.9%, and for the last 12 months is 28.8%. Over the same period the benchmark SPY performance was 10.4% and 14.8% respectively. Over the previous week the market value of the iM-Composite(Gold-Stocks-Bond) Timer gained 1.55% at a time when SPY gained 0.69%. A starting capital of $100,000 at inception on 6/30/2016 would have grown to $129,719 which includes $53 cash and excludes $1,955 spent on fees and slippage. |
|
|
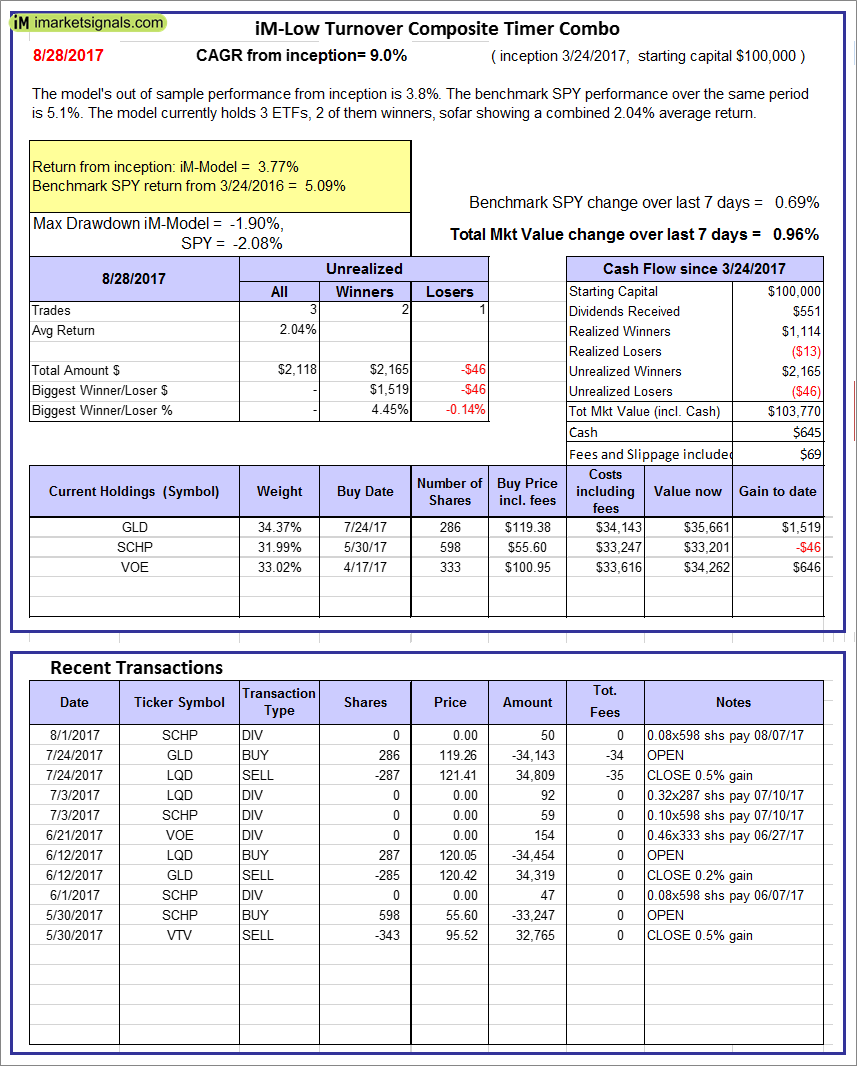
iM-Low Turnover Composite Timer Combo: The model’s out of sample performance from inception is 3.8%. The benchmark SPY performance over the same period is 5.1%. Over the previous week the market value of the iM-Low Turnover Composite Timer Combo gained 0.96% at a time when SPY gained 0.69%. A starting capital of $100,000 at inception on 3/24/27 would have grown to $103,770 which includes $645 cash and excludes $69 spent on fees and slippage. |
|
|
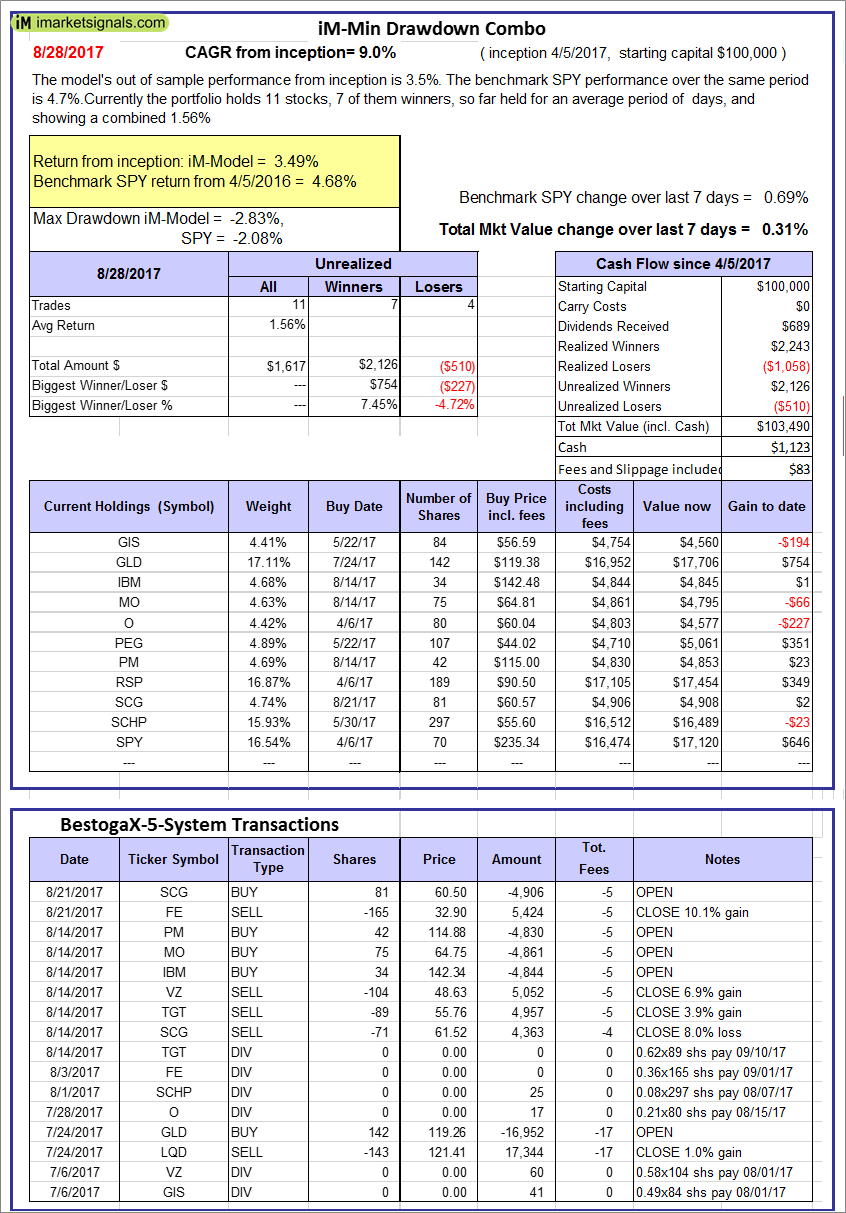
iM-Min Drawdown Combo: The model’s out of sample performance from inception is 3.5%. The benchmark SPY performance over the same period is 4.7%. Over the previous week the market value of the iM-Min Drawdown Combo gained 0.31% at a time when SPY gained 0.69%. A starting capital of $100,000 at inception on 4/5/2017 would have grown to $103,490 which includes $1,123 cash and excludes $83 spent on fees and slippage. |
|
|
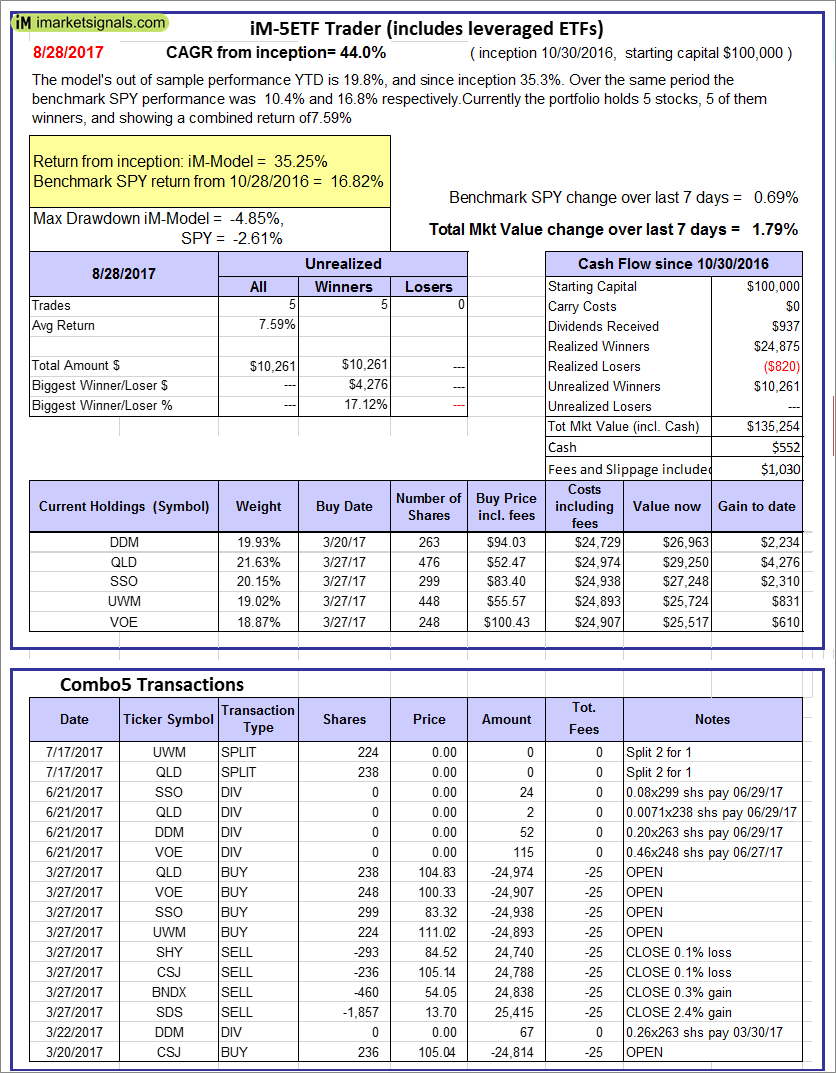
iM-5ETF Trader (includes leveraged ETFs): The model’s out of sample performance YTD is 10.7%, and since inception 13.8%. Over the same period the benchmark SPY performance was 10.4% and 16.8% respectively. Over the previous week the market value of the iM-5ETF Trader (includes leveraged ETFs) gained 1.79% at a time when SPY gained 0.69%. A starting capital of $100,000 at inception on 10/30/2016 would have grown to $135,254 which includes $552 cash and excludes $1,030 spent on fees and slippage. |
|
|
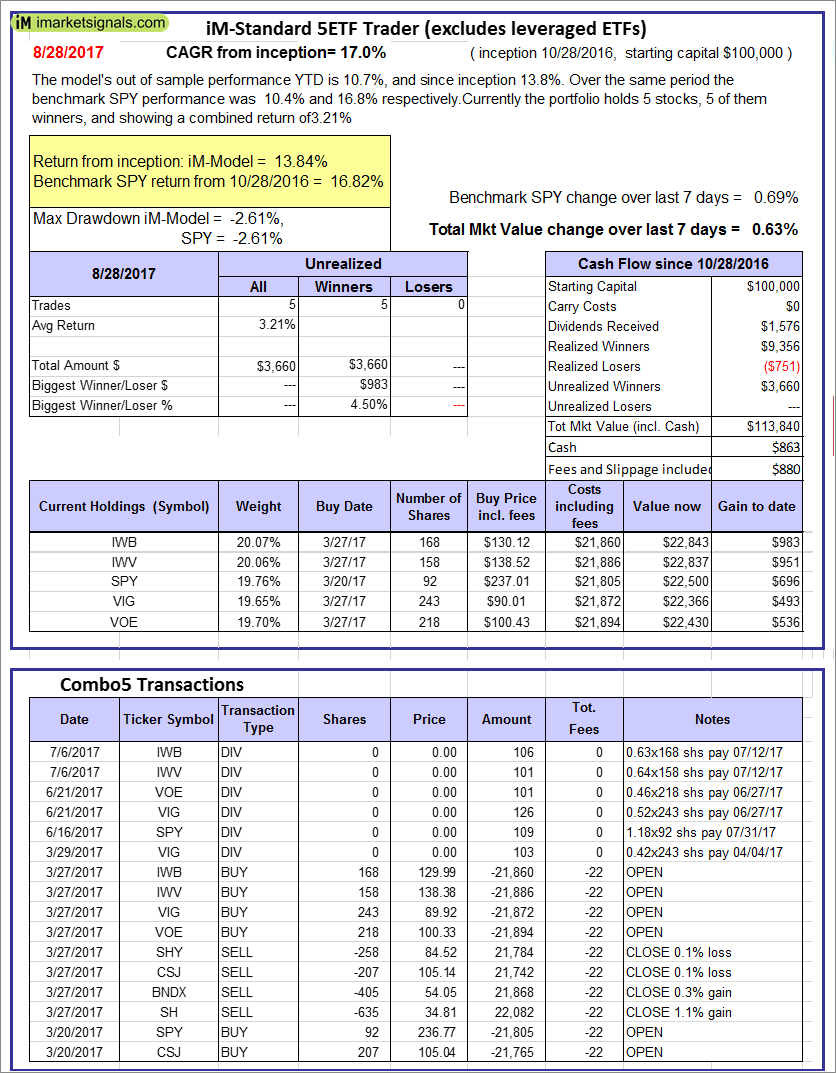
iM-Standard 5ETF Trader (excludes leveraged ETFs): The model’s out of sample performance YTD is 10.7%, and since inception 13.8%. Over the same period the benchmark SPY performance was 10.4% and 16.8% respectively. Over the previous week the market value of the iM-Standard 5ETF Trader (excludes leveraged ETFs) gained 0.63% at a time when SPY gained 0.69%. A starting capital of $100,000 at inception on 10/30/2016 would have grown to $113,840 which includes $863 cash and excludes $880 spent on fees and slippage. |


Leave a Reply
You must be logged in to post a comment.