
Blog Archives
iM-Best Reports – 12/17/2018
Posted in pmp SPY-SH
iM-Best Reports – 11/5/2018
 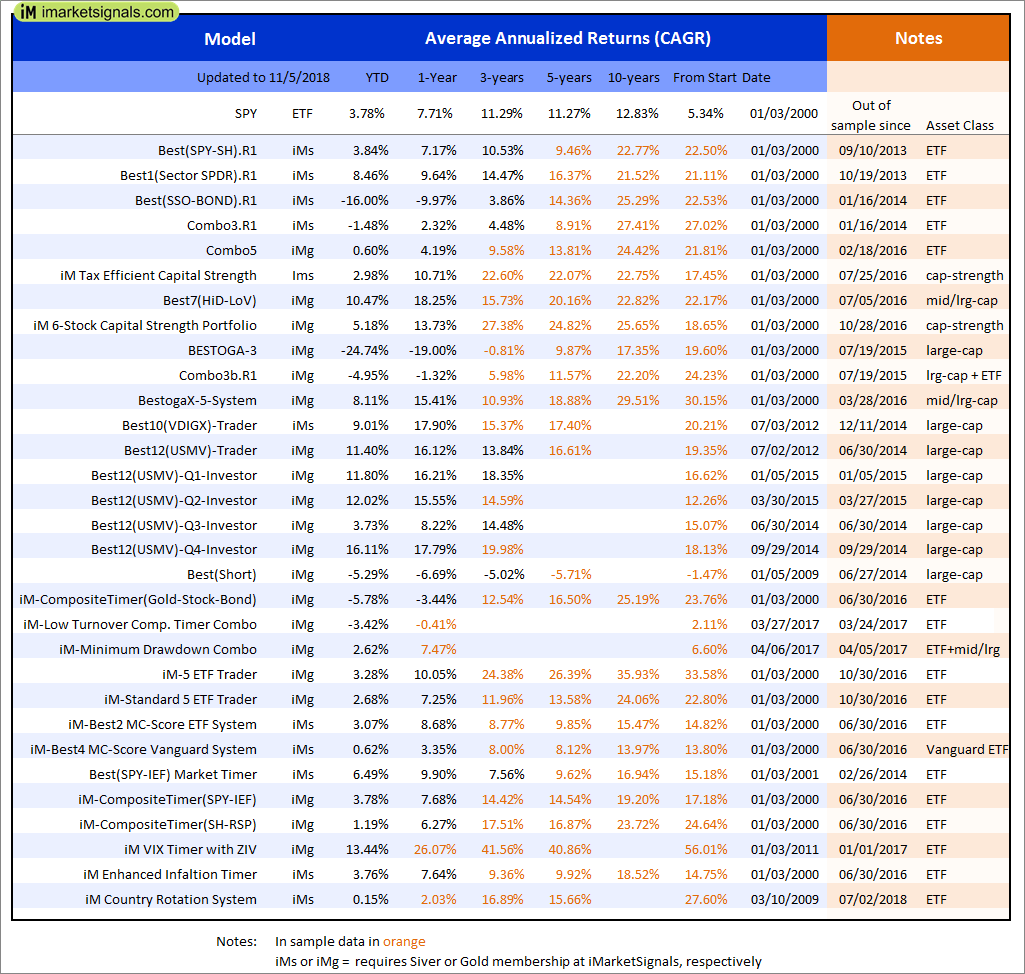 |
Out of sample performance summary of our models for the past 1, 2, 4 and 13 week periods. The active active return indicates how the models over- or underperformed the benchmark ETF SPY. Also the YTD, and the 1-, 3-, 5- and 10-year annualized returns are shown in the second table |
 |
iM-Best(SPY-SH).R1: The model’s out of sample performance YTD is 3.3%, and for the last 12 months is 7.2%. Over the same period the benchmark SPY performance was 3.8% and 7.7% respectively. Over the previous week the market value of Best(SPY-SH) gained 3.59% at a time when SPY gained 3.61%. A starting capital of $100,000 at inception on 1/2/2009 would have grown to $583,884 which includes $2,930 cash and excludes $17,699 spent on fees and slippage. |
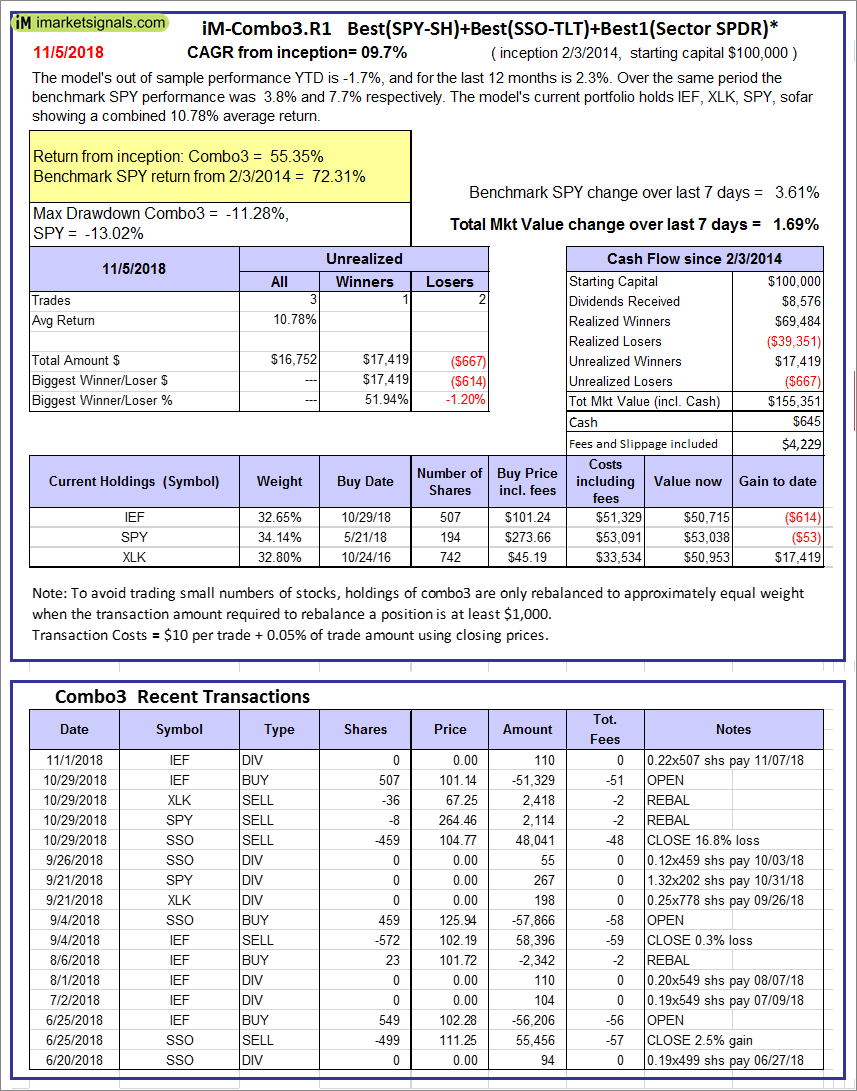 |
iM-Combo3.R1: The model’s out of sample performance YTD is -1.7%, and for the last 12 months is 2.3%. Over the same period the benchmark SPY performance was 3.8% and 7.7% respectively. Over the previous week the market value of iM-Combo3.R1 gained 1.69% at a time when SPY gained 3.61%. A starting capital of $100,000 at inception on 2/3/2014 would have grown to $155,351 which includes $645 cash and excludes $4,229 spent on fees and slippage. |
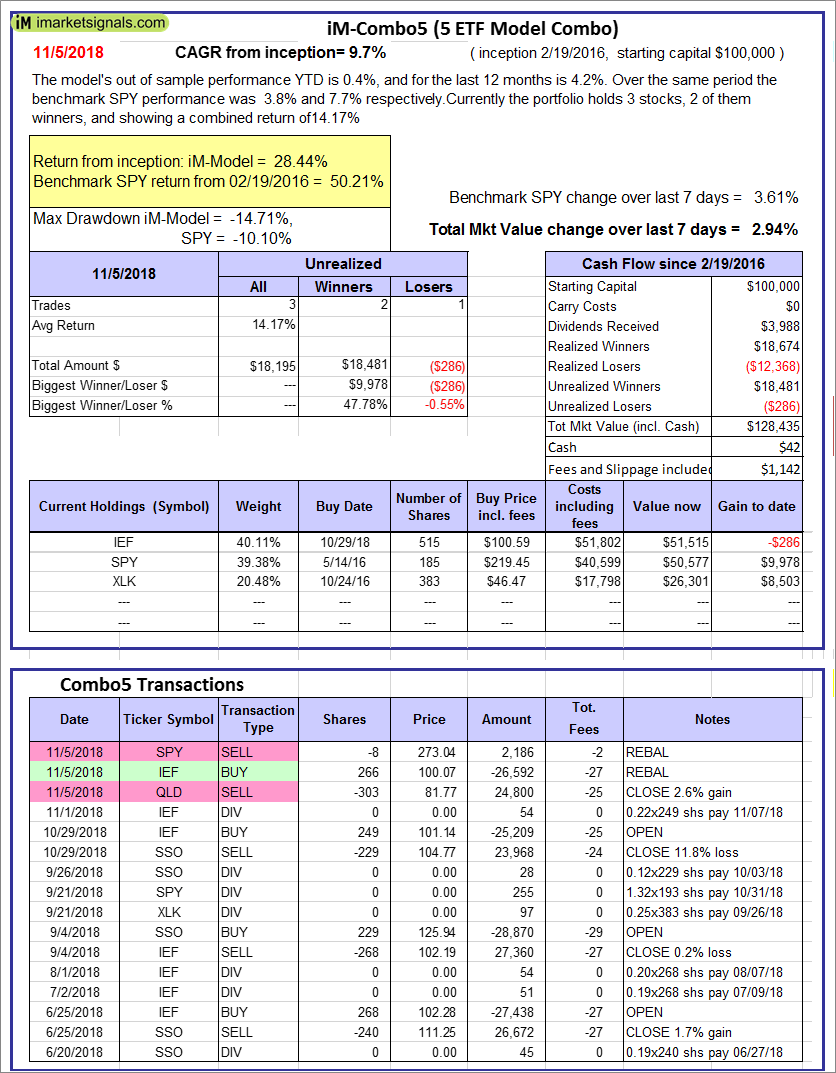 |
iM-Combo5: The model’s out of sample performance YTD is 0.4%, and for the last 12 months is 4.2%. Over the same period the benchmark SPY performance was 3.8% and 7.7% respectively. Over the previous week the market value of iM-Combo5 gained 2.94% at a time when SPY gained 3.61%. A starting capital of $100,000 at inception on 2/22/2016 would have grown to $128,435 which includes $42 cash and excludes $1,142 spent on fees and slippage. |
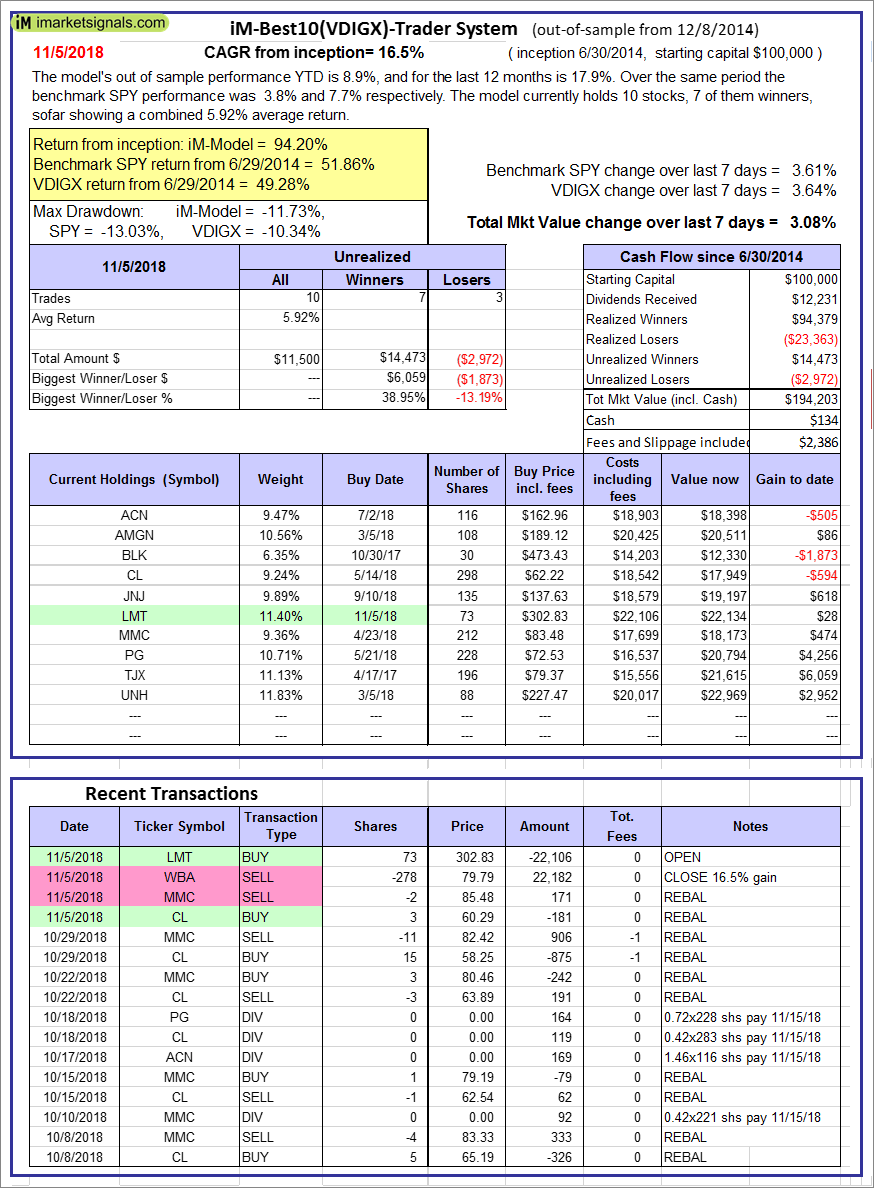  |
iM-Best10(VDIGX)-Trader: The model’s out of sample performance YTD is 8.9%, and for the last 12 months is 17.9%. Over the same period the benchmark SPY performance was 3.8% and 7.7% respectively. Since inception, on 7/1/2014, the model gained 94.20% while the benchmark SPY gained 51.86% and VDIGX gained 49.28% over the same period. Over the previous week the market value of iM-Best10(VDIGX) gained 3.08% at a time when SPY gained 3.61%. A starting capital of $100,000 at inception on 7/1/2014 would have grown to $194,203 which includes $134 cash and excludes $2,386 spent on fees and slippage. |
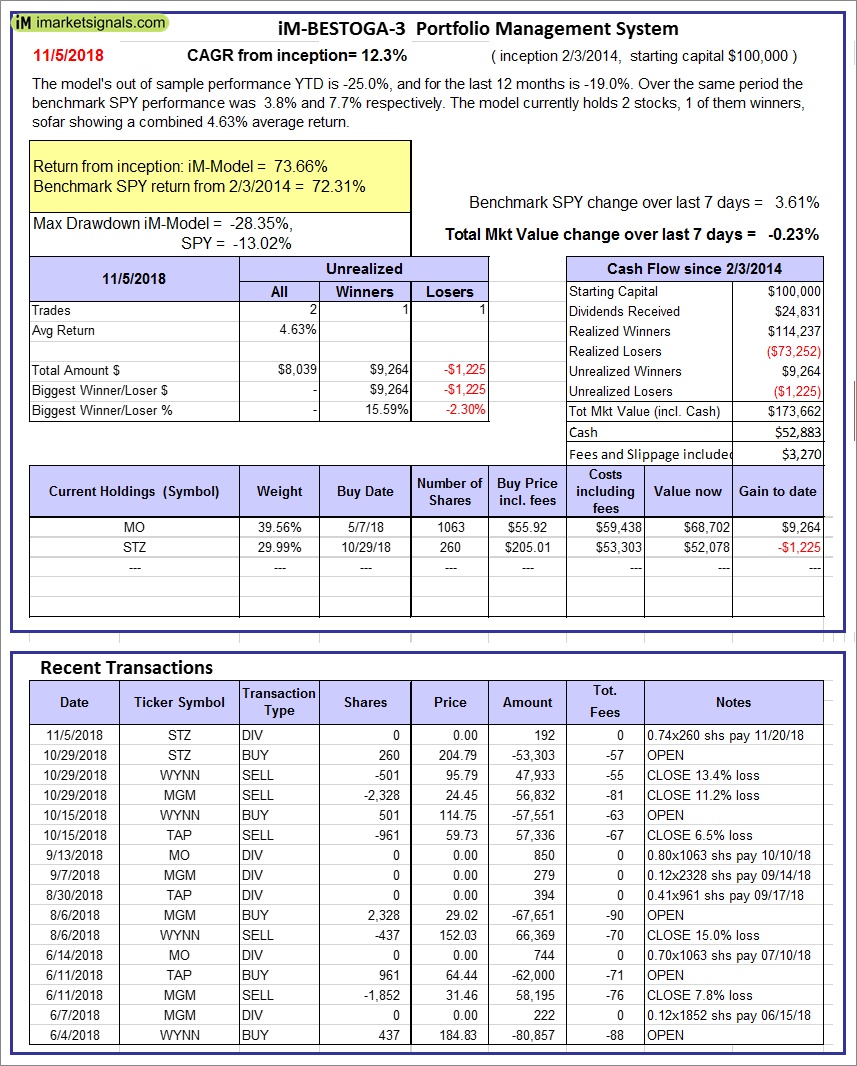 |
iM-BESTOGA-3: The model’s out of sample performance YTD is -25.0%, and for the last 12 months is -19.0%. Over the same period the benchmark SPY performance was 3.8% and 7.7% respectively. Over the previous week the market value of iM-BESTOGA-3 gained -0.23% at a time when SPY gained 3.61%. A starting capital of $100,000 at inception on 2/3/2014 would have grown to $173,662 which includes $52,883 cash and excludes $3,270 spent on fees and slippage. |
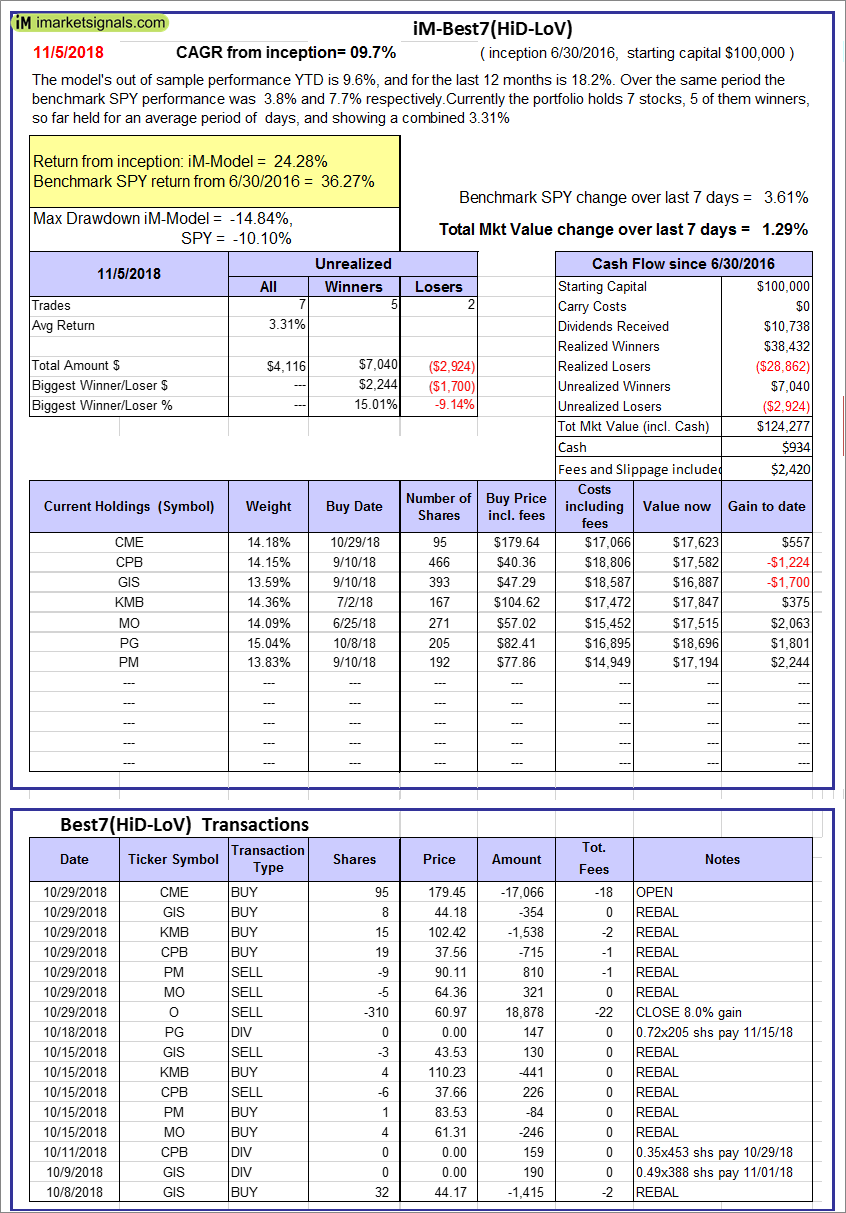 |
iM-Best7(HiD-LoV): The model’s out of sample performance YTD is 9.6%, and for the last 12 months is 18.2%. Over the same period the benchmark SPY performance was 3.8% and 7.7% respectively. Over the previous week the market value of iM-BESTOGA-3 gained 1.29% at a time when SPY gained 3.61%. A starting capital of $100,000 at inception on 6/30/2016 would have grown to $124,277 which includes $934 cash and excludes $2,420 spent on fees and slippage. |
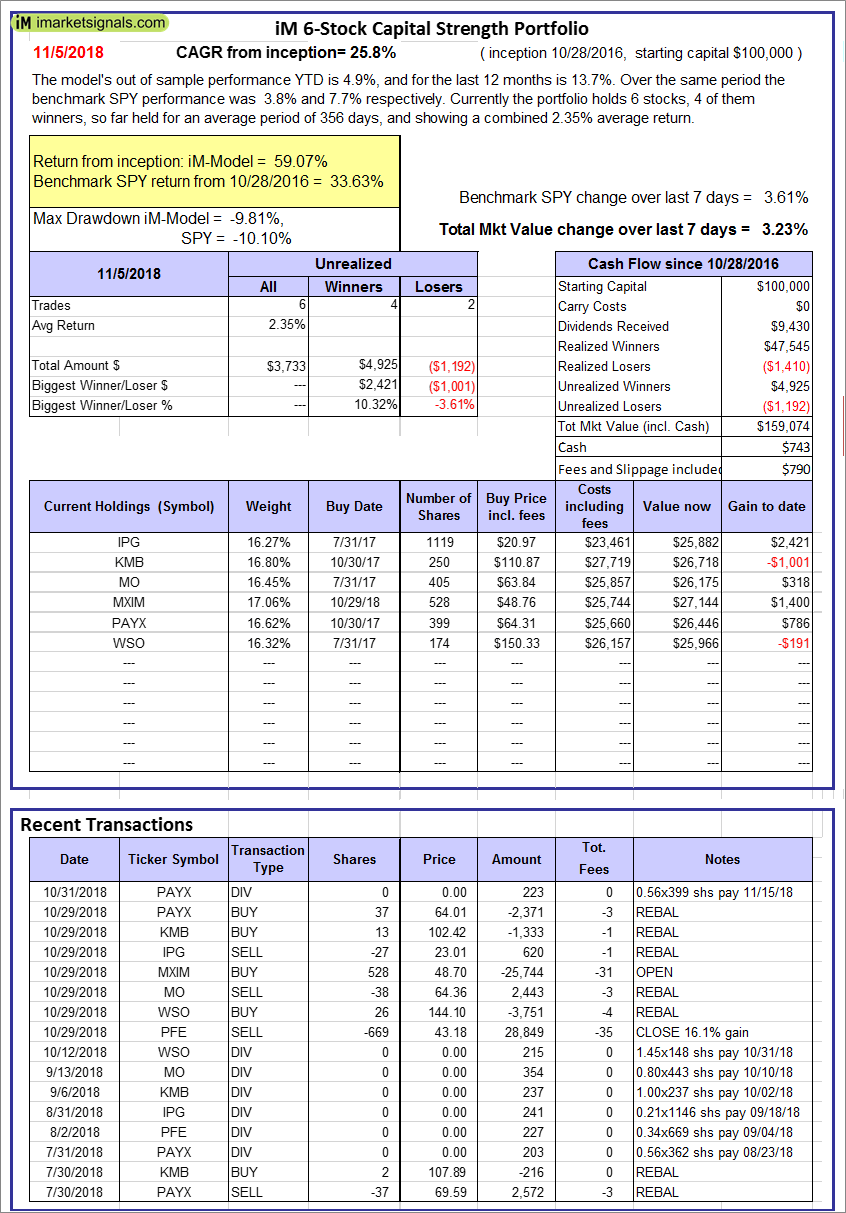 |
iM 6-Stock Capital Strength Portfolio: The model’s out of sample performance YTD is 4.9%, and for the last 12 months is 13.7%. Over the same period the benchmark SPY performance was 3.8% and 7.7% respectively. Over the previous week the market value of the iM 6-Stock Capital Strength Portfolio gained 3.23% at a time when SPY gained 3.61%. A starting capital of $100,000 at inception on 10/28/2016 would have grown to $159,074 which includes $743 cash and excludes $790 spent on fees and slippage. |
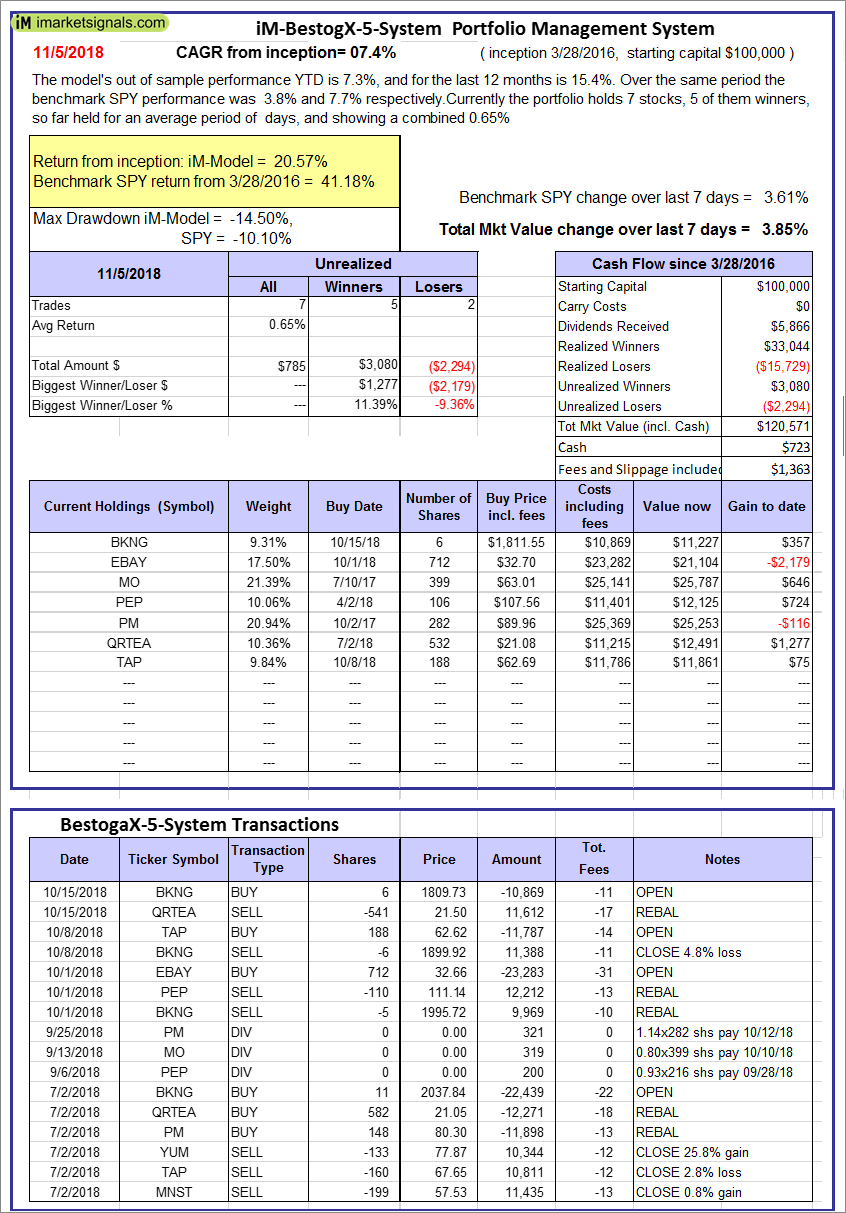 |
iM-BestogaX5-System: The model’s out of sample performance YTD is 7.3%, and for the last 12 months is 15.4%. Over the same period the benchmark SPY performance was 3.8% and 7.7% respectively. Over the previous week the market value of iM-BestogaX5-System gained 3.85% at a time when SPY gained 3.61%. A starting capital of $100,000 at inception on 3/28/2016 would have grown to $120,571 which includes $723 cash and excludes $1,363 spent on fees and slippage. |
 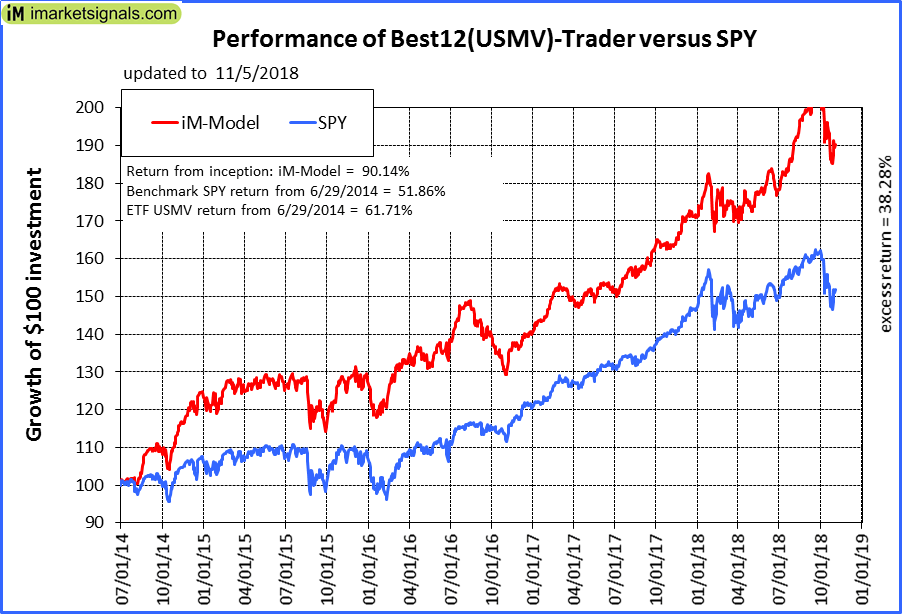 |
iM-Best12(USMV)-Trader: The model’s out of sample performance YTD is 11.2%, and for the last 12 months is 16.1%. Over the same period the benchmark SPY performance was 3.8% and 7.7% respectively. Since inception, on 6/30/2014, the model gained 90.14% while the benchmark SPY gained 51.86% and the ETF USMV gained 61.71% over the same period. Over the previous week the market value of iM-Best12(USMV)-Trader gained 2.64% at a time when SPY gained 3.61%. A starting capital of $100,000 at inception on 6/30/2014 would have grown to $190,264 which includes $977 cash and excludes $4,678 spent on fees and slippage. |
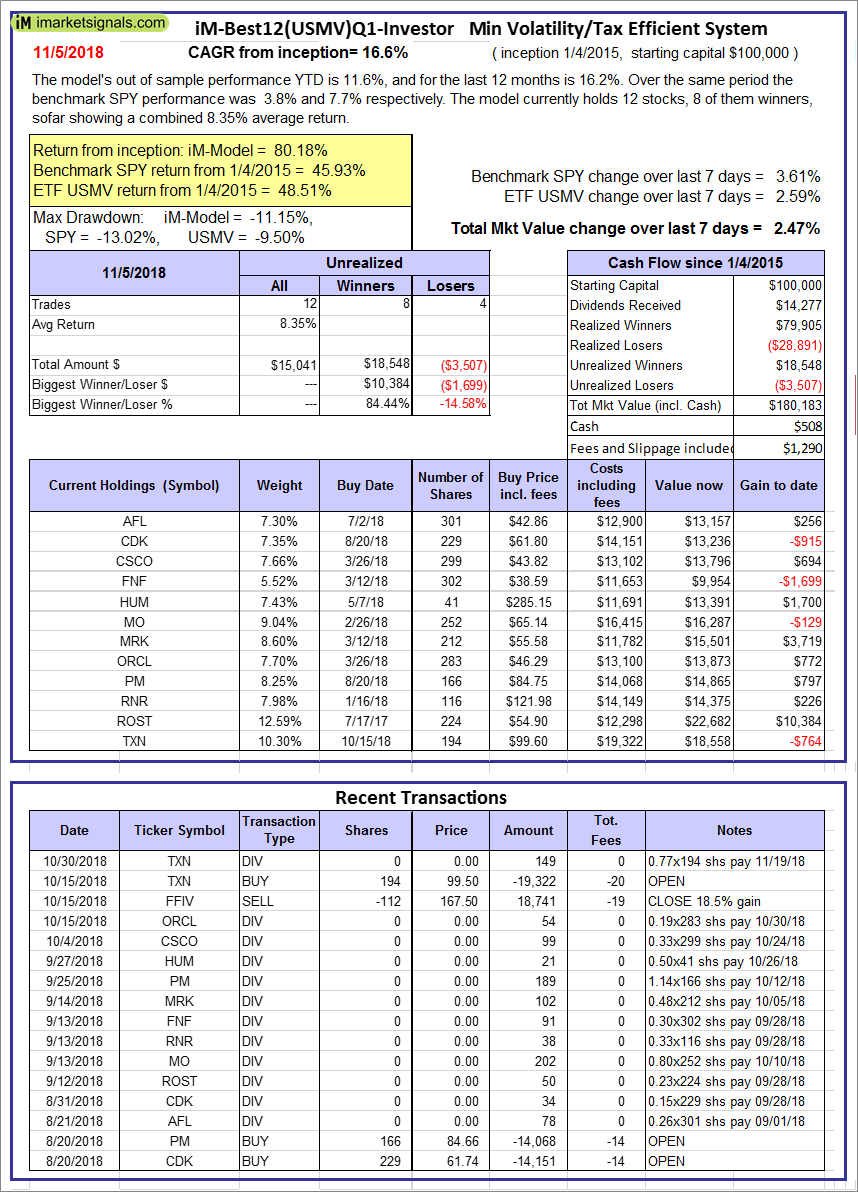  |
iM-Best12(USMV)Q1-Investor: The model’s out of sample performance YTD is 11.6%, and for the last 12 months is 16.2%. Over the same period the benchmark SPY performance was 3.8% and 7.7% respectively. Since inception, on 1/5/2015, the model gained 80.18% while the benchmark SPY gained 45.93% and the ETF USMV gained 48.51% over the same period. Over the previous week the market value of iM-Best12(USMV)Q1 gained 2.47% at a time when SPY gained 3.61%. A starting capital of $100,000 at inception on 1/5/2015 would have grown to $180,183 which includes $508 cash and excludes $1,290 spent on fees and slippage. |
  |
iM-Best12(USMV)Q2-Investor: The model’s out of sample performance YTD is 11.8%, and for the last 12 months is 15.5%. Over the same period the benchmark SPY performance was 3.8% and 7.7% respectively. Since inception, on 3/30/2015, the model gained 51.67% while the benchmark SPY gained 40.72% and the ETF USMV gained 43.44% over the same period. Over the previous week the market value of iM-Best12(USMV)Q2 gained 2.49% at a time when SPY gained 3.61%. A starting capital of $100,000 at inception on 3/30/2015 would have grown to $151,669 which includes $444 cash and excludes $1,125 spent on fees and slippage. |
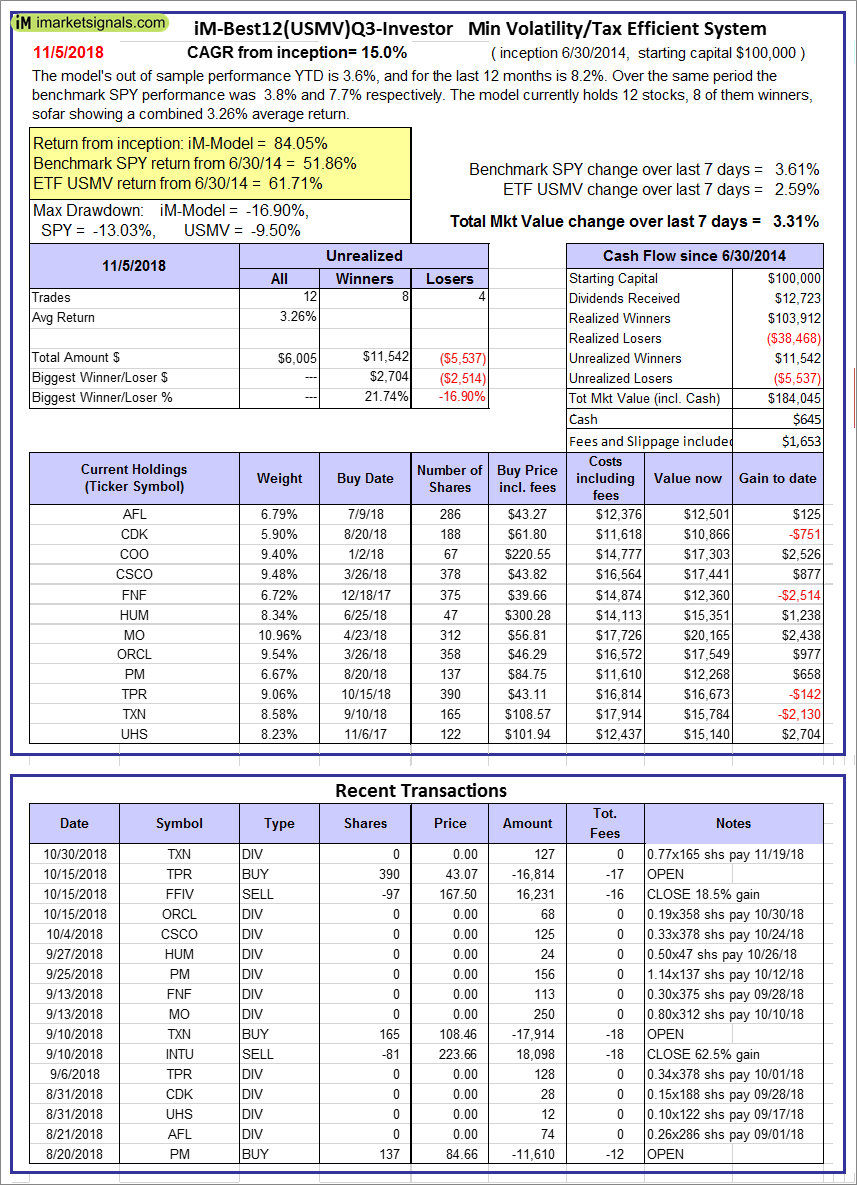  |
iM-Best12(USMV)Q3-Investor: The model’s out of sample performance YTD is 3.6%, and for the last 12 months is 8.2%. Over the same period the benchmark SPY performance was 3.8% and 7.7% respectively. Since inception, on 7/1/2014, the model gained 84.05% while the benchmark SPY gained 51.86% and the ETF USMV gained 61.71% over the same period. Over the previous week the market value of iM-Best12(USMV)Q3 gained 3.31% at a time when SPY gained 3.61%. A starting capital of $100,000 at inception on 7/1/2014 would have grown to $184,045 which includes $645 cash and excludes $1,653 spent on fees and slippage. |
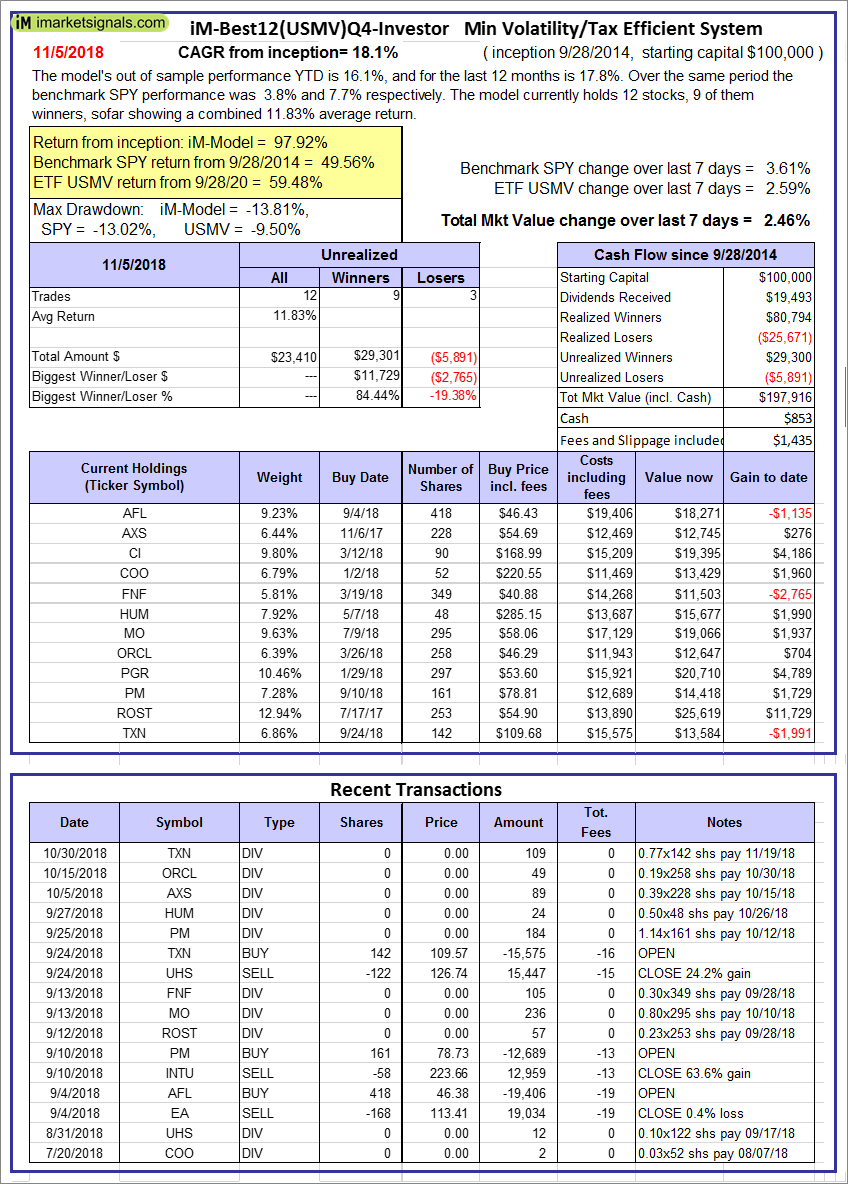 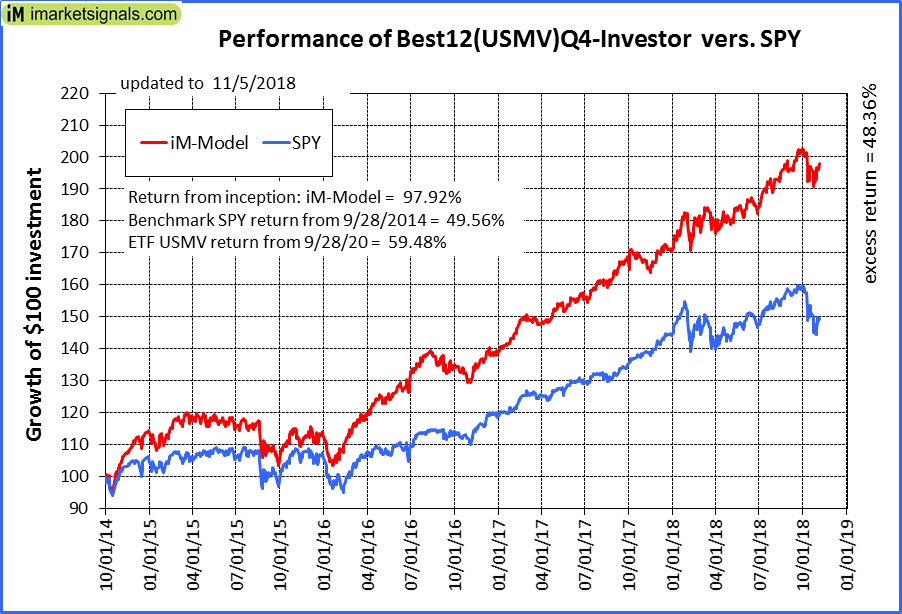 |
iM-Best12(USMV)Q4-Investor: Since inception, on 9/29/2014, the model gained 97.92% while the benchmark SPY gained 49.56% and the ETF USMV gained 59.48% over the same period. Over the previous week the market value of iM-Best12(USMV)Q4 gained 2.46% at a time when SPY gained 3.61%. A starting capital of $100,000 at inception on 9/29/2014 would have grown to $197,916 which includes $853 cash and excludes $1,435 spent on fees and slippage. |
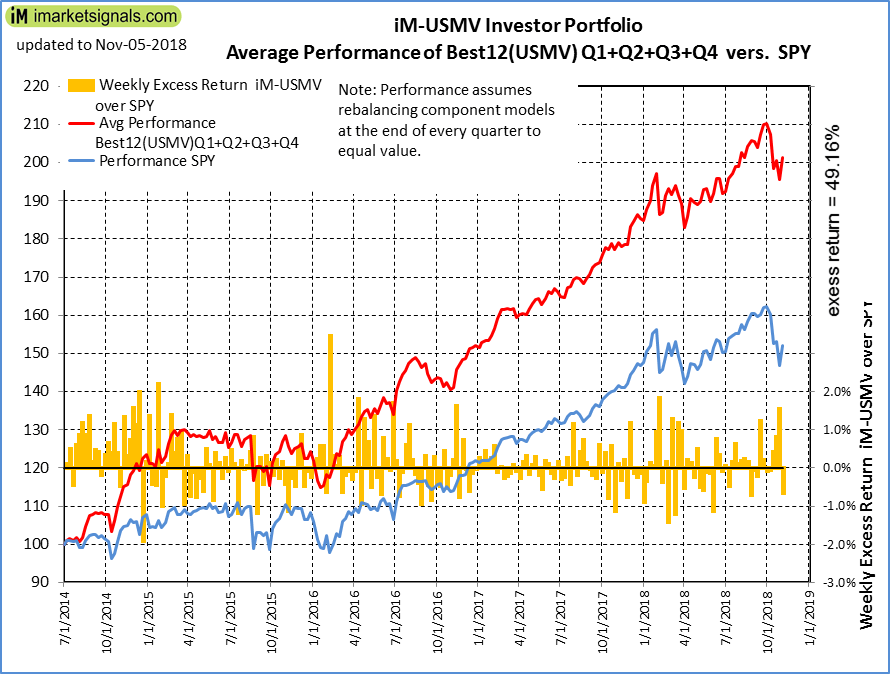 |
Average Performance of iM-Best12(USMV)Q1+Q2+Q3+Q4-Investor resulted in an excess return of 49.16% over SPY. (see iM-USMV Investor Portfolio) |
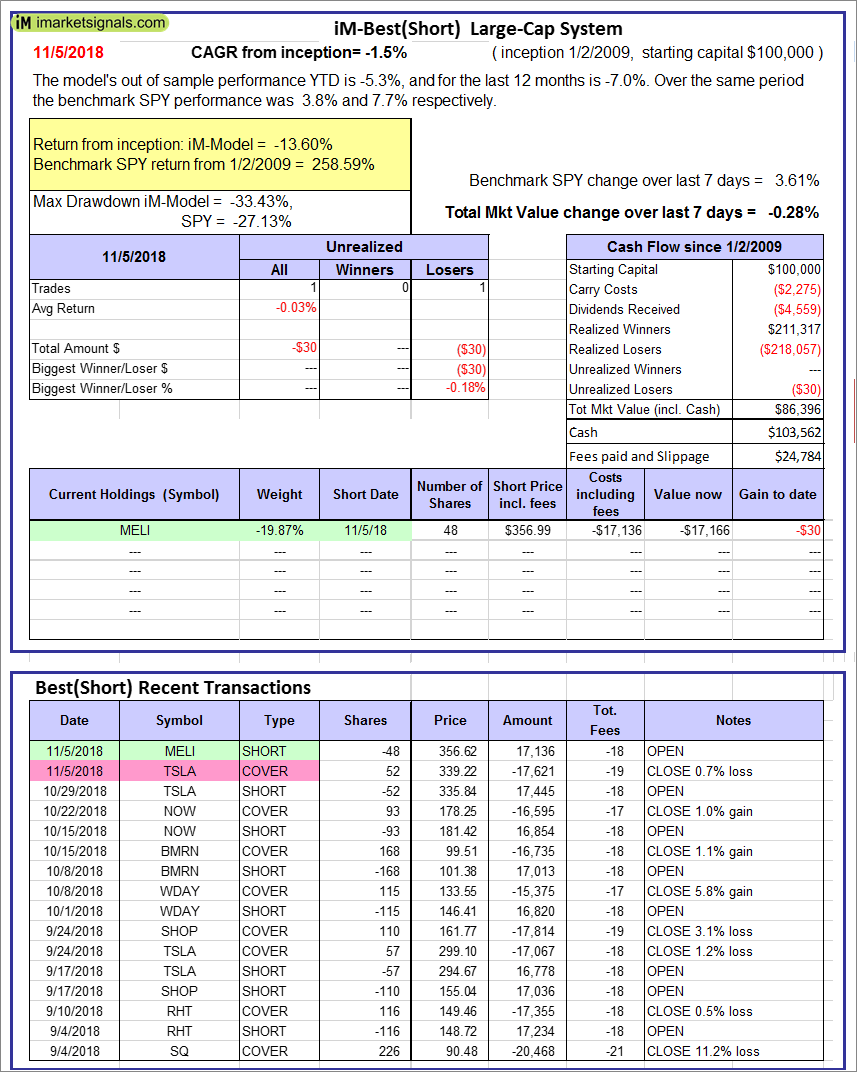 |
iM-Best(Short): The model’s out of sample performance YTD is -5.3%, and for the last 12 months is -7.0%. Over the same period the benchmark SPY performance was 3.8% and 7.7% respectively. Over the previous week the market value of iM-Best(Short) gained -0.28% at a time when SPY gained 3.61%. Over the period 1/2/2009 to 11/5/2018 the starting capital of $100,000 would have grown to $86,396 which includes $103,562 cash and excludes $24,784 spent on fees and slippage. |
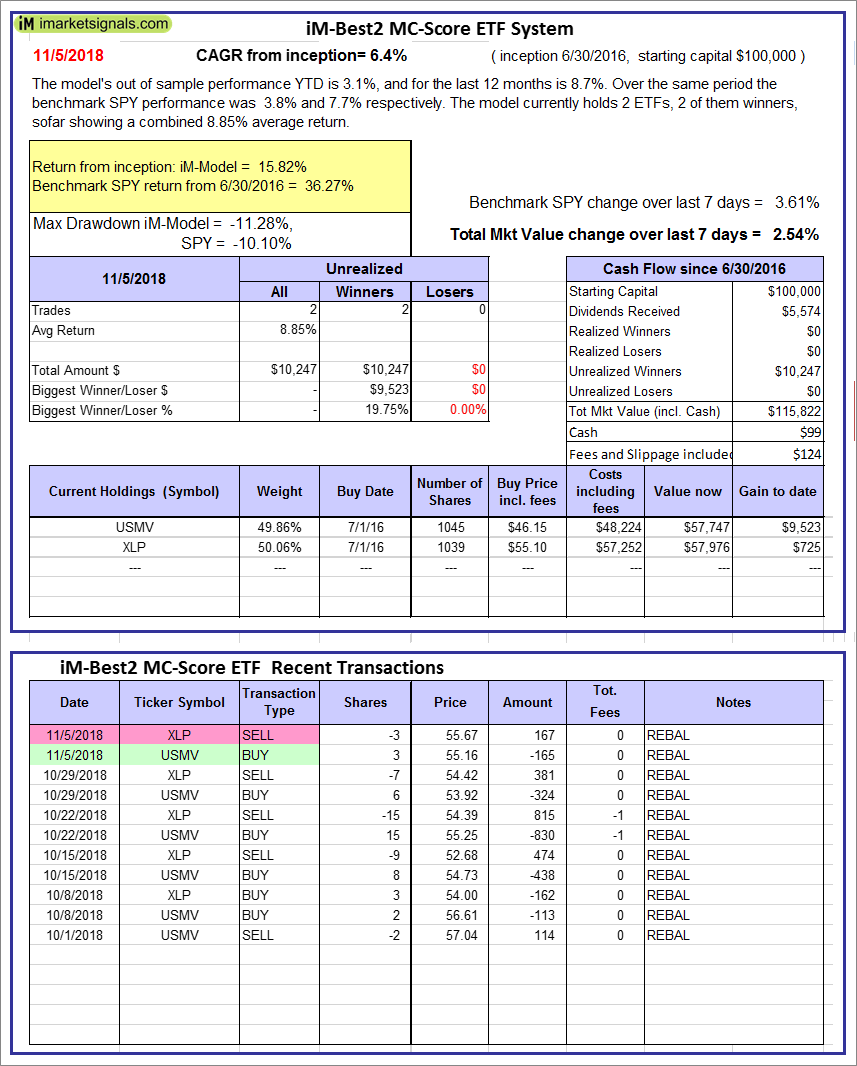 |
iM-Best2 MC-Score ETF System: The model’s out of sample performance YTD is 3.1%, and for the last 12 months is 8.7%. Over the same period the benchmark SPY performance was 3.8% and 7.7% respectively. Over the previous week the market value of the iM-Best2 MC-Score ETF System gained 2.54% at a time when SPY gained 3.61%. A starting capital of $100,000 at inception on 6/30/2016 would have grown to $115,822 which includes $99 cash and excludes $124 spent on fees and slippage. |
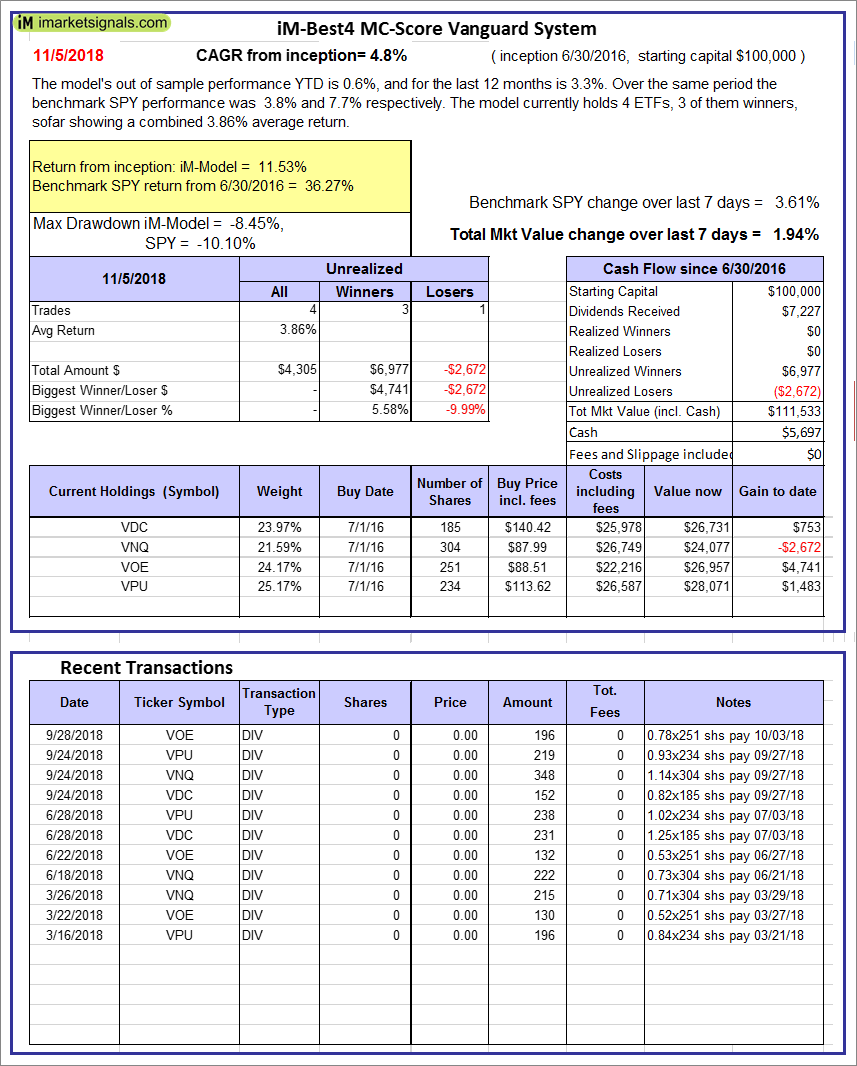 |
iM-Best4 MC-Score Vanguard System: The model’s out of sample performance YTD is 0.6%, and for the last 12 months is 3.3%. Over the same period the benchmark SPY performance was 3.8% and 7.7% respectively. Over the previous week the market value of the iM-Best4 MC-Score Vanguard System gained 1.94% at a time when SPY gained 3.61%. A starting capital of $100,000 at inception on 6/30/2016 would have grown to $111,533 which includes $5,697 cash and excludes $00 spent on fees and slippage. |
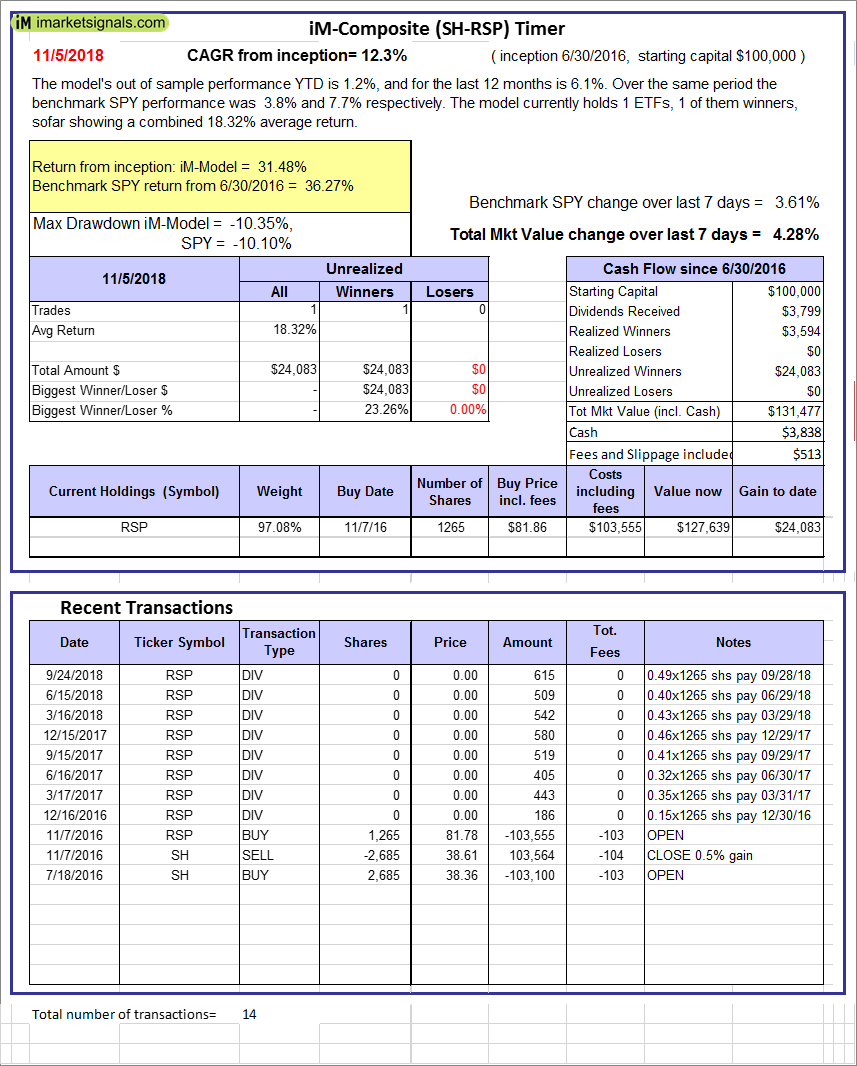 |
iM-Composite (SH-RSP) Timer: The model’s out of sample performance YTD is 1.2%, and for the last 12 months is 6.1%. Over the same period the benchmark SPY performance was 3.8% and 7.7% respectively. Over the previous week the market value of the iM-Composite (SH-RSP) Timer gained 4.28% at a time when SPY gained 3.61%. A starting capital of $100,000 at inception on 6/30/2016 would have grown to $131,477 which includes $3,838 cash and excludes $513 spent on fees and slippage. |
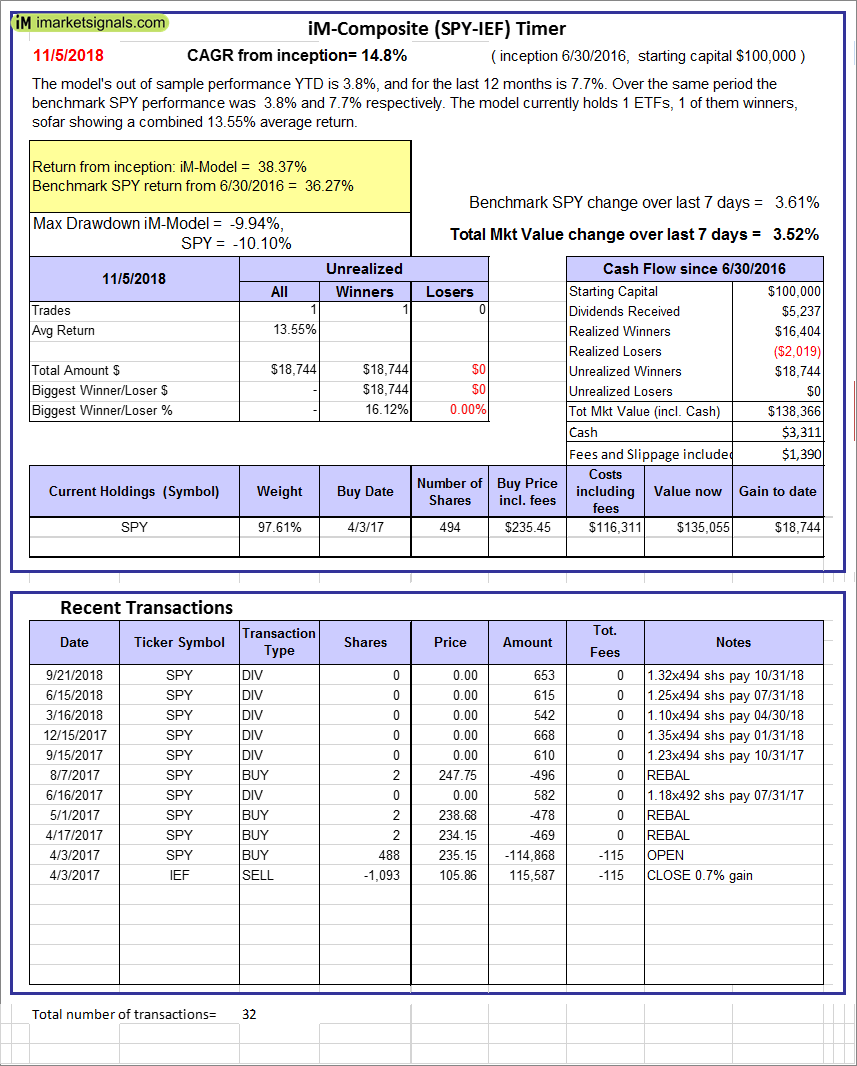 |
iM-Composite (SPY-IEF) Timer: The model’s out of sample performance YTD is 3.8%, and for the last 12 months is 7.7%. Over the same period the benchmark SPY performance was 3.8% and 7.7% respectively. Over the previous week the market value of the iM-Composite (SPY-IEF) Timer gained 3.52% at a time when SPY gained 3.61%. A starting capital of $100,000 at inception on 6/30/2016 would have grown to $138,366 which includes $3,311 cash and excludes $1,390 spent on fees and slippage. |
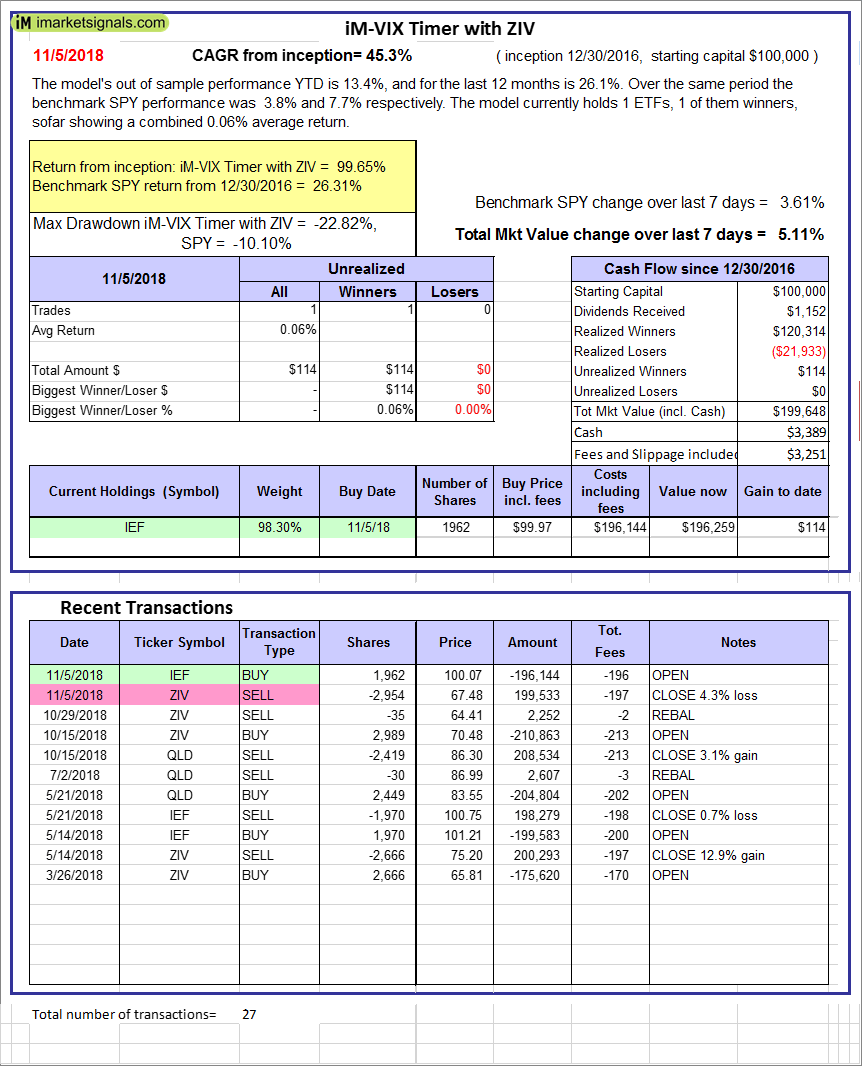 |
iM-VIX Timer with ZIV: The model’s out of sample performance YTD is 13.4%, and for the last 12 months is 26.1%. Over the same period the benchmark SPY performance was 3.8% and 7.7% respectively. Over the previous week the market value of the iM-VIX Timer with ZIV gained 5.11% at a time when SPY gained 3.61%. A starting capital of $100,000 at inception on 6/30/2016 would have grown to $199,648 which includes $3,389 cash and excludes $3,251 spent on fees and slippage. |
 |
iM-Composite(Gold-Stocks-Bond) Timer: The model’s out of sample performance YTD is -5.9%, and for the last 12 months is -3.7%. Over the same period the benchmark SPY performance was 0.2% and 4.3% respectively. Over the previous week the market value of the iM-Composite(Gold-Stocks-Bond) Timer gained 0.51% at a time when SPY gained -4.05%. A starting capital of $100,000 at inception on 6/30/2016 would have grown to $121,141 which includes $99 cash and excludes $1,956 spent on fees and slippage. |
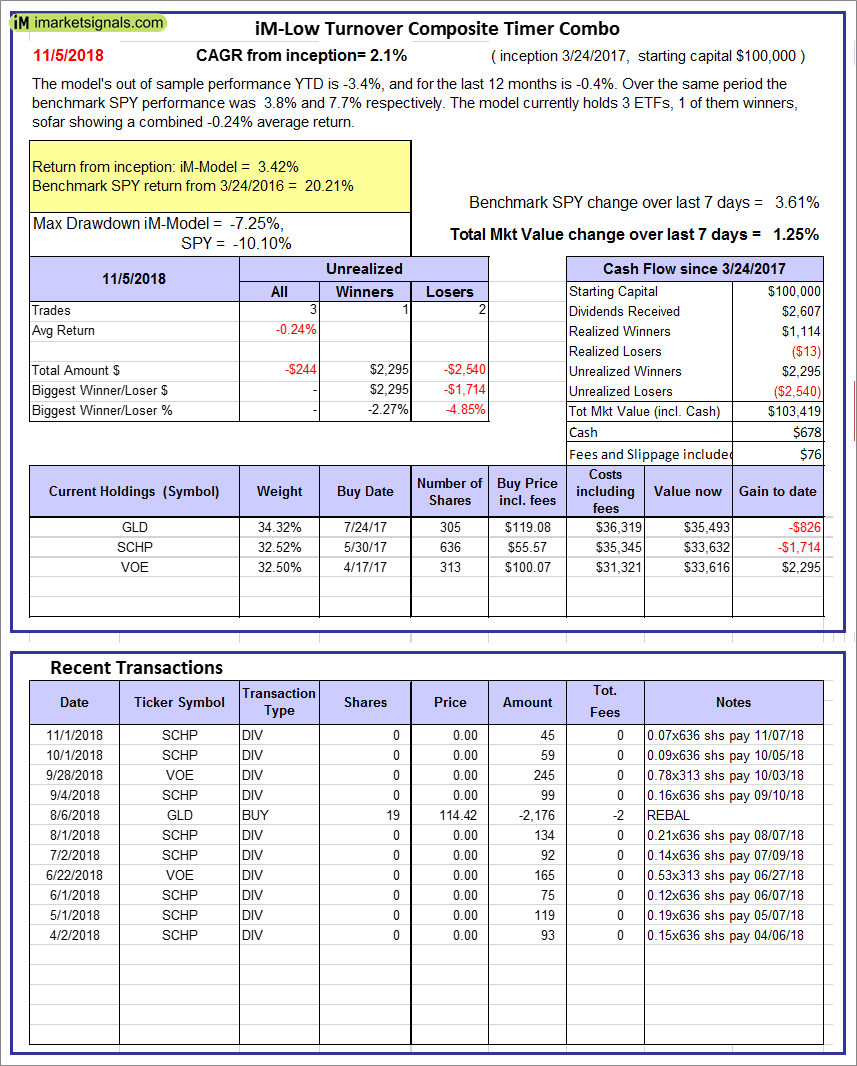 |
iM-Low Turnover Composite Timer Combo: The model’s out of sample performance YTD is -3.4%, and for the last 12 months is -0.4%. Over the same period the benchmark SPY performance was 3.8% and 7.7% respectively. Over the previous week the market value of the iM-Low Turnover Composite Timer Combo gained 1.25% at a time when SPY gained 3.61%. A starting capital of $100,000 at inception on 3/24/27 would have grown to $103,419 which includes $678 cash and excludes $76 spent on fees and slippage. |
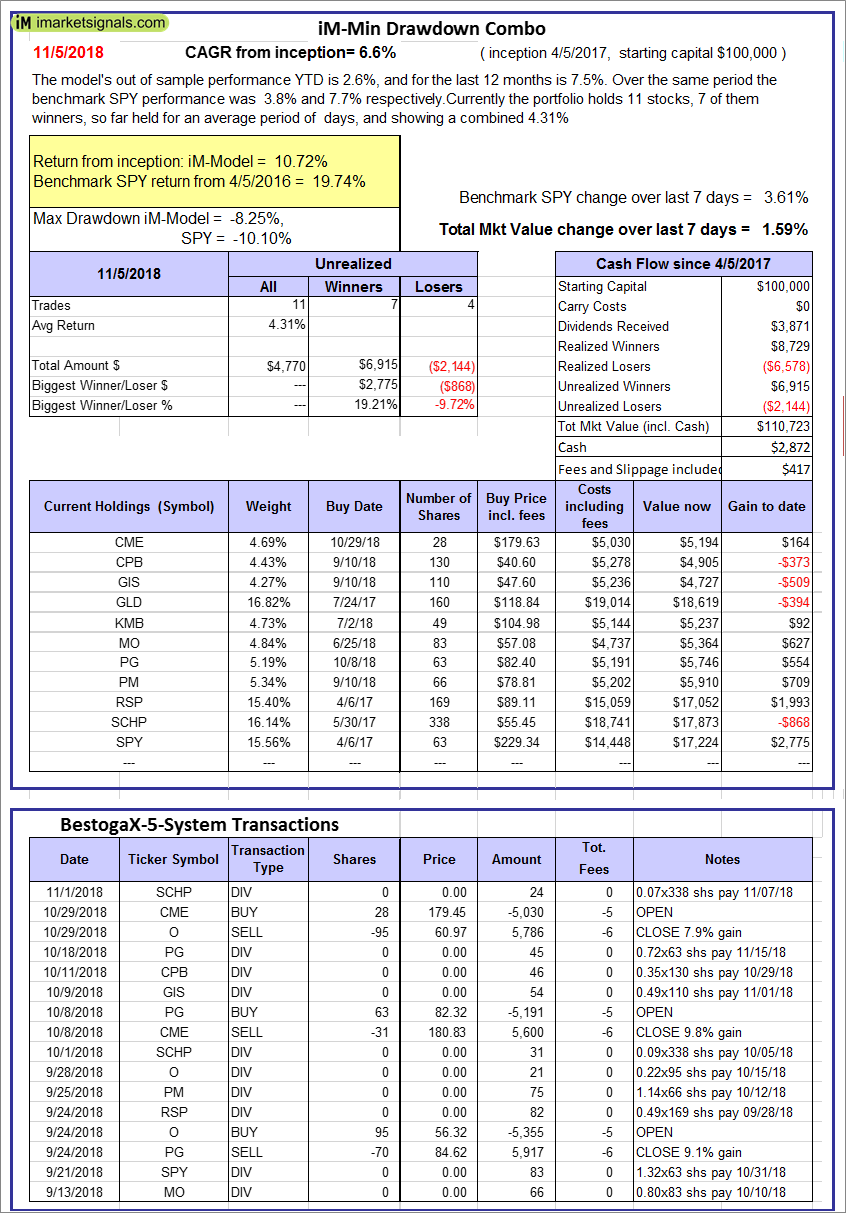 |
iM-Min Drawdown Combo: The model’s out of sample performance YTD is 2.6%, and for the last 12 months is 7.5%. Over the same period the benchmark SPY performance was 3.8% and 7.7% respectively. Over the previous week the market value of the iM-Min Drawdown Combo gained 1.59% at a time when SPY gained 3.61%. A starting capital of $100,000 at inception on 4/5/2017 would have grown to $110,723 which includes $2,872 cash and excludes $417 spent on fees and slippage. |
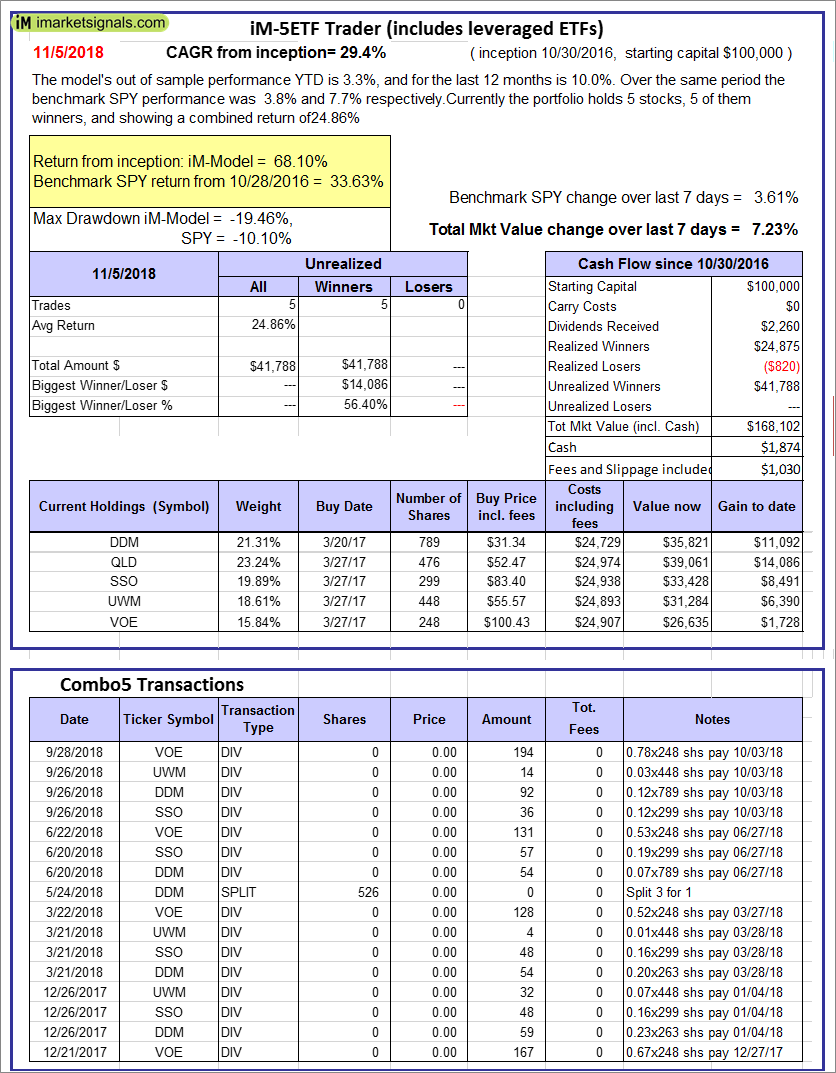 |
iM-5ETF Trader (includes leveraged ETFs): The model’s out of sample performance YTD is 3.3%, and for the last 12 months is 10.0%. Over the same period the benchmark SPY performance was 3.8% and 7.7% respectively. Over the previous week the market value of the iM-5ETF Trader (includes leveraged ETFs) gained 7.23% at a time when SPY gained 3.61%. A starting capital of $100,000 at inception on 10/30/2016 would have grown to $168,102 which includes $1,874 cash and excludes $1,030 spent on fees and slippage. |
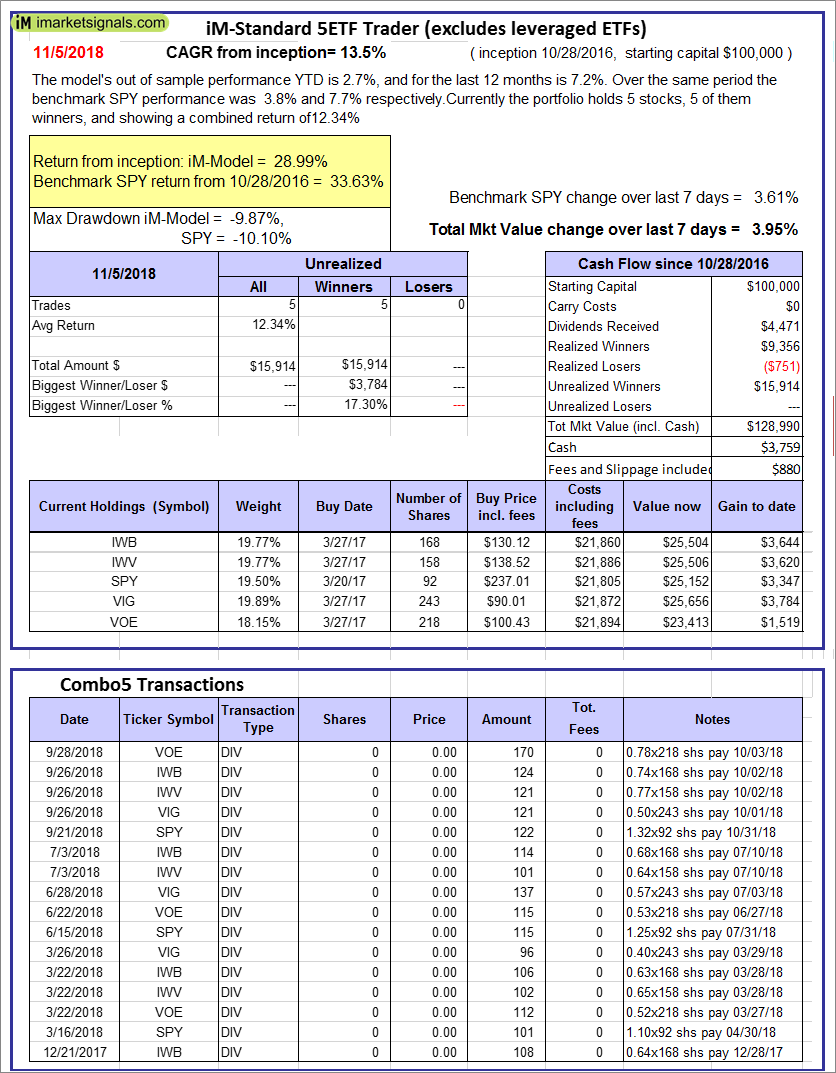 |
iM-Standard 5ETF Trader (excludes leveraged ETFs): The model’s out of sample performance YTD is 2.7%, and for the last 12 months is 7.2%. Over the same period the benchmark SPY performance was 3.8% and 7.7% respectively. Over the previous week the market value of the iM-Standard 5ETF Trader (excludes leveraged ETFs) gained 3.95% at a time when SPY gained 3.61%. A starting capital of $100,000 at inception on 10/30/2016 would have grown to $128,990 which includes $3,759 cash and excludes $880 spent on fees and slippage. |
Posted in pmp SPY-SH
With reference to Section 202(a)(11)(D) of the Investment Advisers Act:
We are Engineers and not Investment Advisers,
read more ...
By the mere act of reading this page and navigating this site you acknowledge, agree to, and abide by the
Terms of Use / Disclaimer