–

Blog Archives
iM-Best Reports – 4/15/2019
Posted in pmp SPY-SH
iM-Best Reports – 3/18/2019
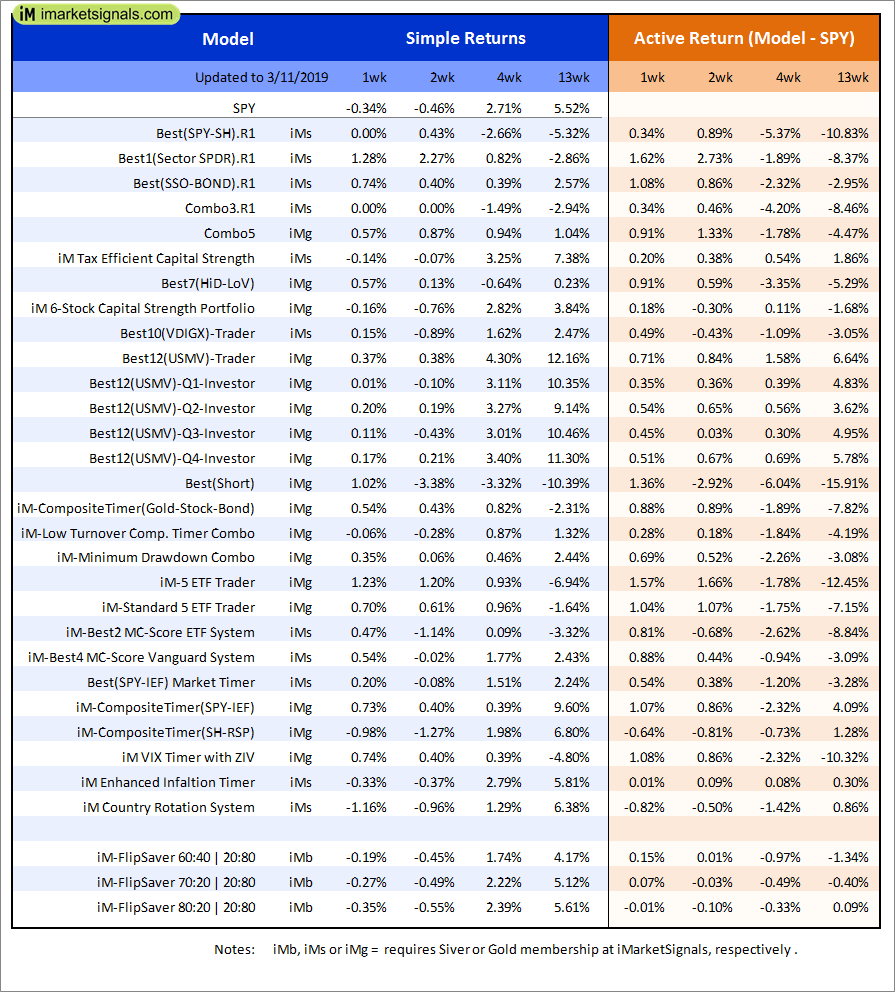 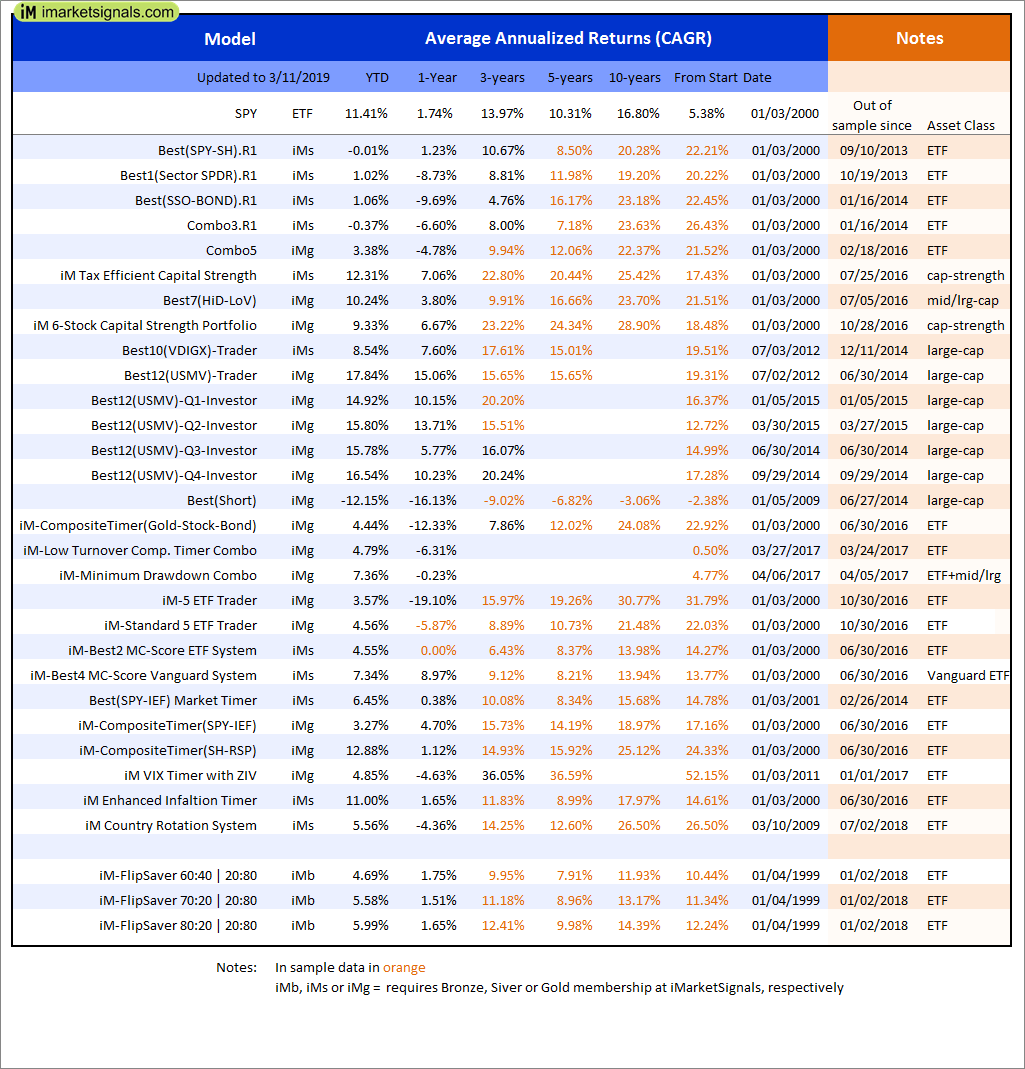 |
Out of sample performance summary of our models for the past 1, 2, 4 and 13 week periods. The active active return indicates how the models over- or underperformed the benchmark ETF SPY. Also the YTD, and the 1-, 3-, 5- and 10-year annualized returns are shown in the second table |
 |
iM-FlipSaver 60:40 | 20:80 – 2017: The model’s out of sample performance YTD is 6.3%, and for the last 12 months is 3.4%. Over the same period the benchmark SPY performance was 8.7% and 4.8% respectively. Over the previous week the market value of iM-FlipSaver 80:20 | 20:80 gained 1.09% at a time when SPY gained 1.19%. A starting capital of $100,000 at inception on 7/16/2015 would have grown to $119,019 which includes $183 cash and excludes $788 spent on fees and slippage. |
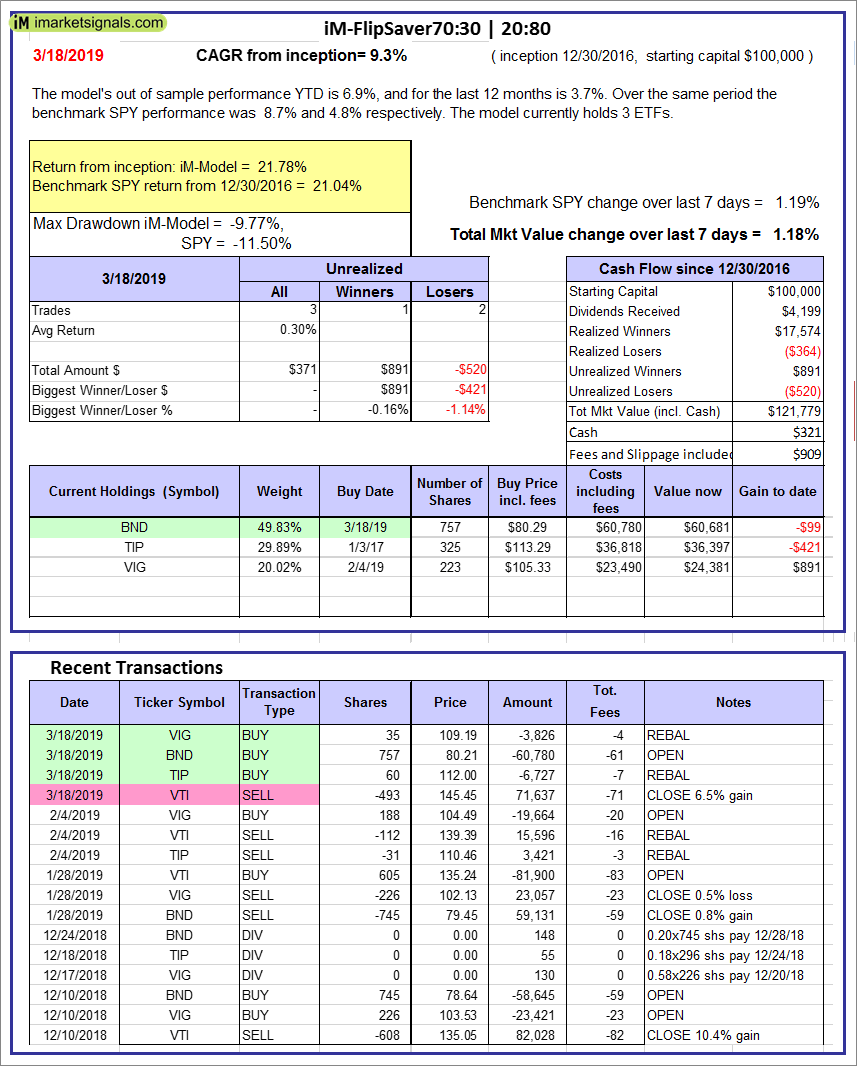 |
iM-FlipSaver 70:30 | 20:80 – 2017: The model’s out of sample performance YTD is 6.9%, and for the last 12 months is 3.7%. Over the same period the benchmark SPY performance was 8.7% and 4.8% respectively. Over the previous week the market value of iM-FlipSaver 70:30 | 20:80 gained 1.18% at a time when SPY gained 1.19%. A starting capital of $100,000 at inception on 7/15/2015 would have grown to $121,779 which includes $321 cash and excludes $909 spent on fees and slippage. |
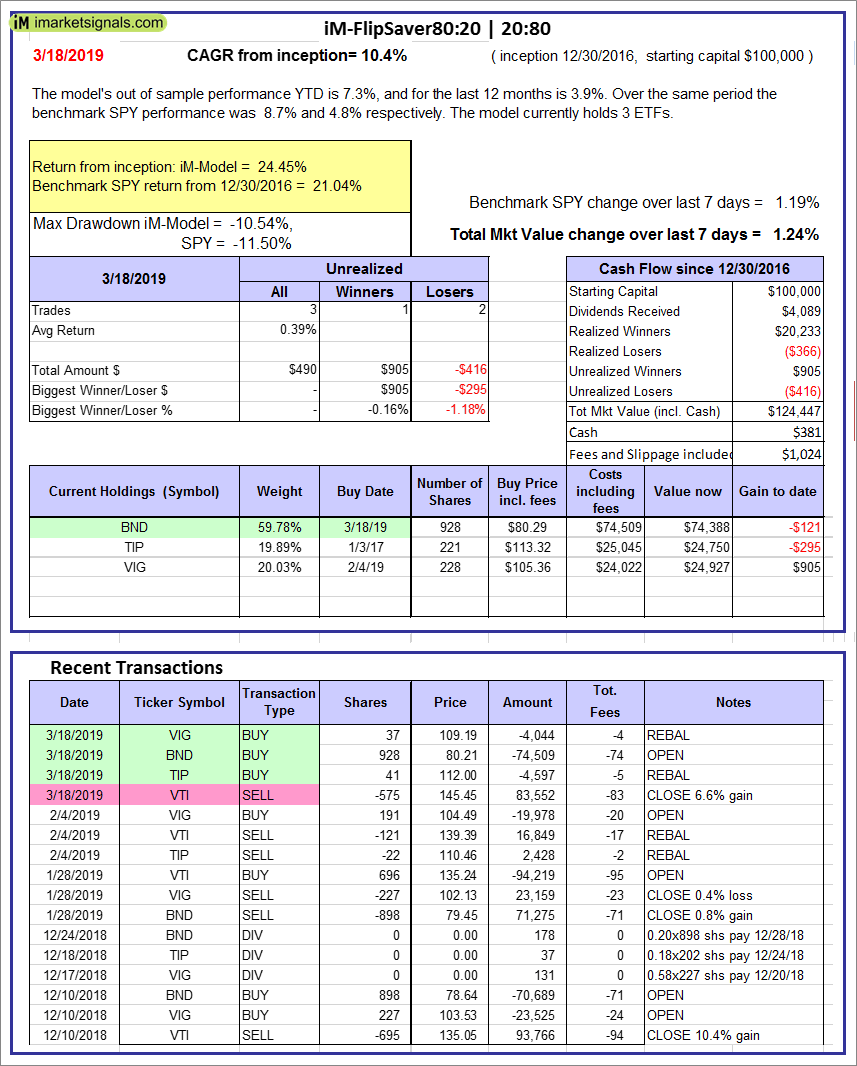 |
iM-FlipSaver 80:20 | 20:80 – 2017: The model’s out of sample performance YTD is 7.3%, and for the last 12 months is 3.9%. Over the same period the benchmark SPY performance was 8.7% and 4.8% respectively. Over the previous week the market value of iM-FlipSaver 80:20 | 20:80 gained 1.24% at a time when SPY gained 1.19%. A starting capital of $100,000 at inception on 1/2/2017 would have grown to $124,447 which includes $381 cash and excludes $1,024 spent on fees and slippage. |
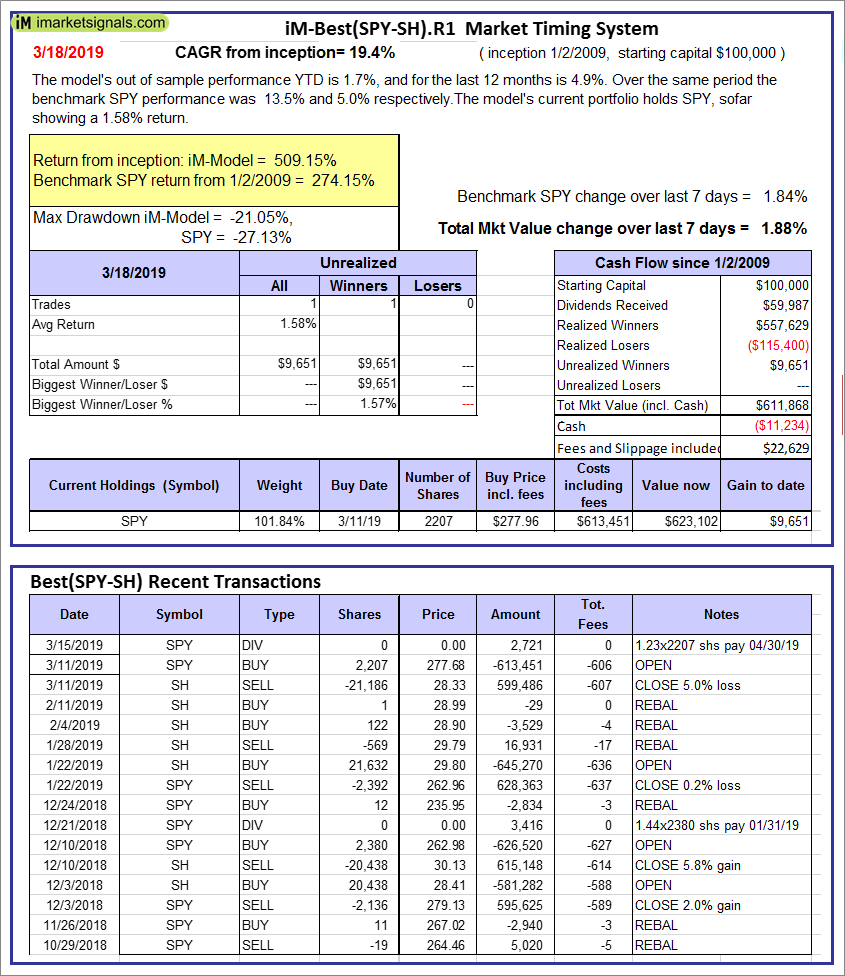 |
iM-Best(SPY-SH).R1: The model’s out of sample performance YTD is 1.7%, and for the last 12 months is 4.9%. Over the same period the benchmark SPY performance was 13.5% and 5.0% respectively. Over the previous week the market value of Best(SPY-SH) gained 1.88% at a time when SPY gained 1.84%. A starting capital of $100,000 at inception on 1/2/2009 would have grown to $611,868 which includes -$11,234 cash and excludes $22,629 spent on fees and slippage. |
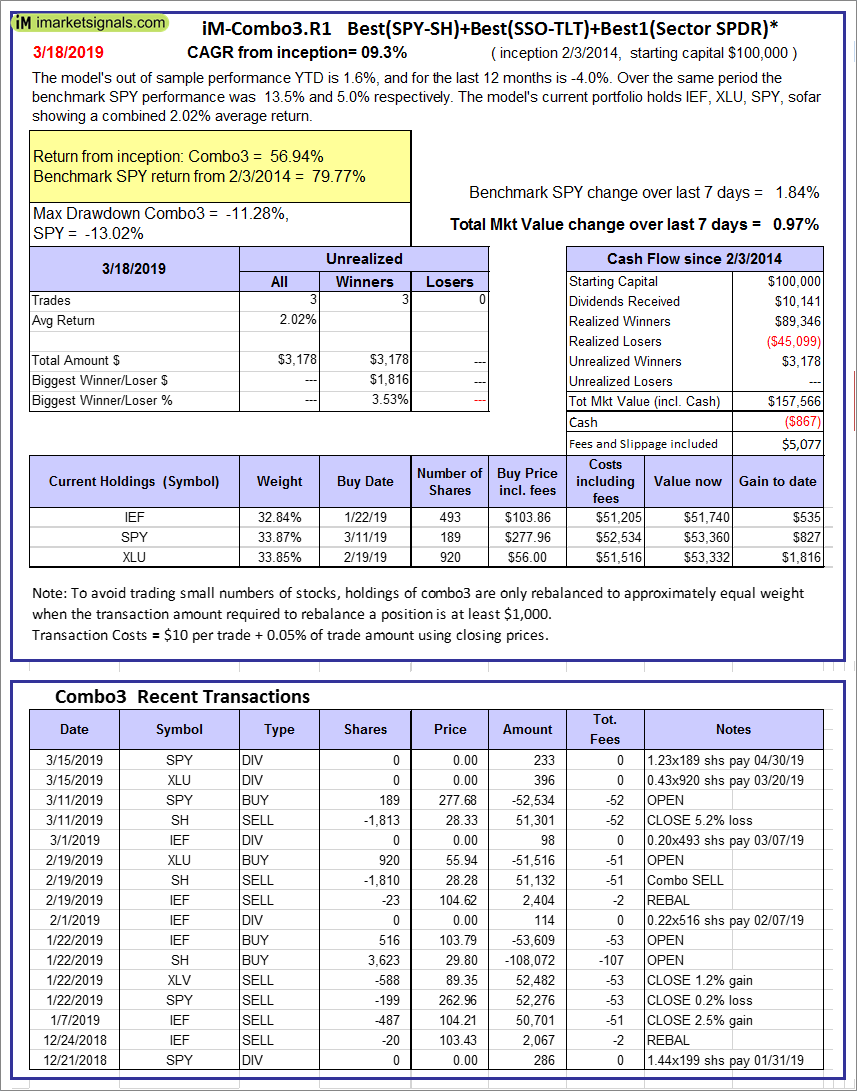 |
iM-Combo3.R1: The model’s out of sample performance YTD is 1.6%, and for the last 12 months is -4.0%. Over the same period the benchmark SPY performance was 13.5% and 5.0% respectively. Over the previous week the market value of iM-Combo3.R1 gained 0.97% at a time when SPY gained 1.84%. A starting capital of $100,000 at inception on 2/3/2014 would have grown to $157,566 which includes -$867 cash and excludes $5,077 spent on fees and slippage. |
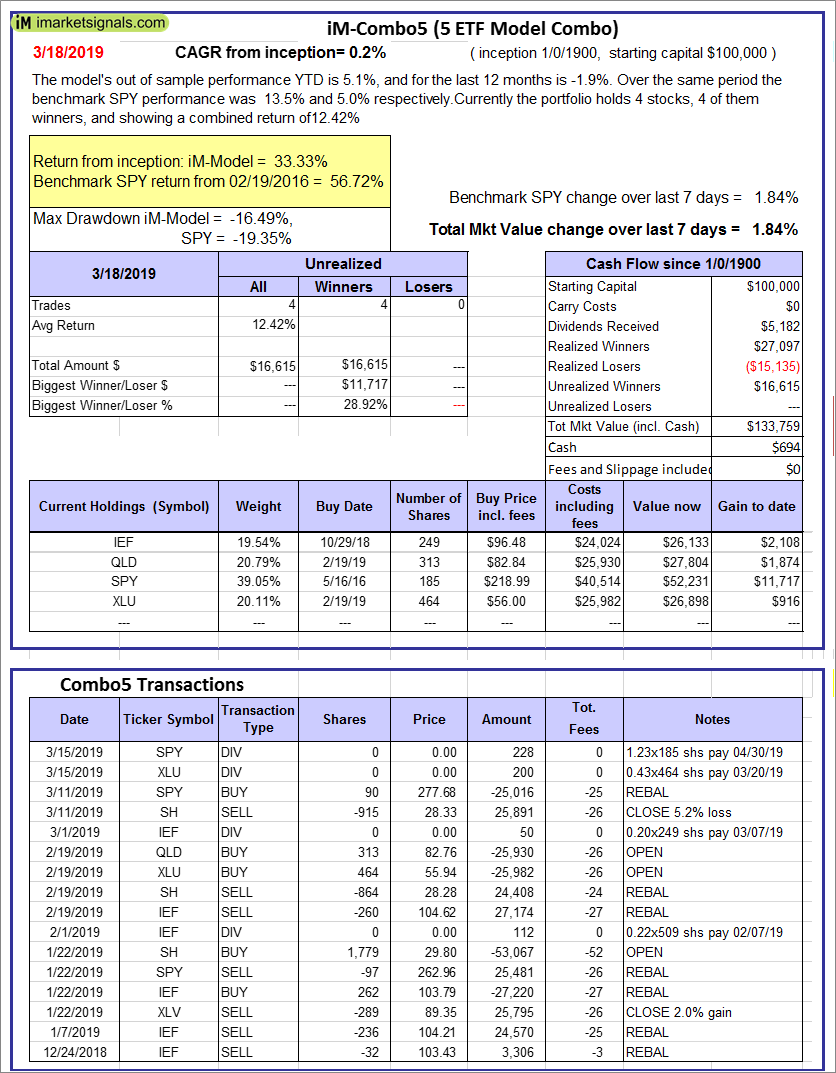 |
iM-Combo5: The model’s out of sample performance YTD is 5.1%, and for the last 12 months is -1.9%. Over the same period the benchmark SPY performance was 13.5% and 5.0% respectively. Over the previous week the market value of iM-Combo5 gained 1.84% at a time when SPY gained 1.84%. A starting capital of $100,000 at inception on 2/22/2016 would have grown to $133,759 which includes $694 cash and excludes $0 spent on fees and slippage. |
 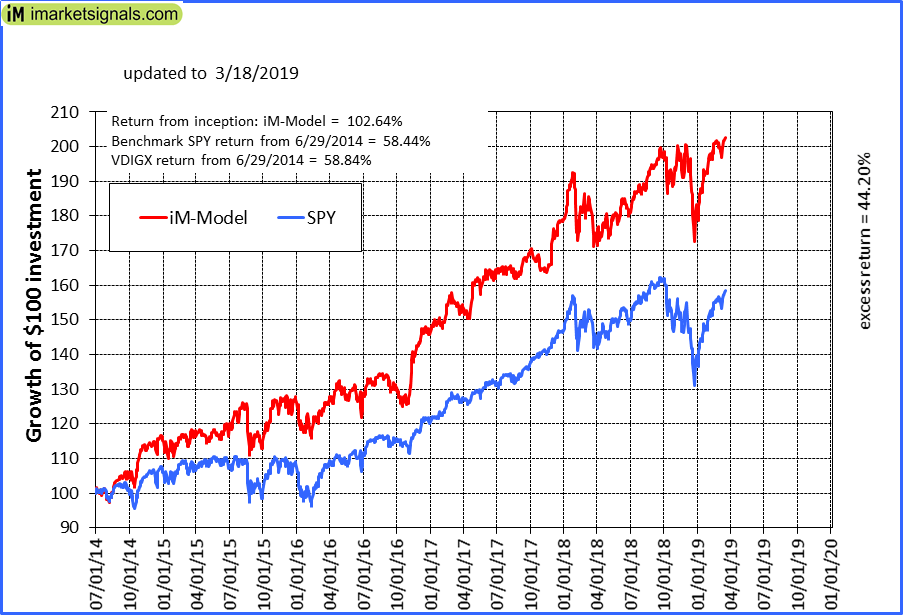 |
iM-Best10(VDIGX)-Trader: The model’s out of sample performance YTD is 10.5%, and for the last 12 months is 11.3%. Over the same period the benchmark SPY performance was 13.5% and 5.0% respectively. Since inception, on 7/1/2014, the model gained 102.64% while the benchmark SPY gained 58.44% and VDIGX gained 58.84% over the same period. Over the previous week the market value of iM-Best10(VDIGX) gained 1.51% at a time when SPY gained 1.84%. A starting capital of $100,000 at inception on 7/1/2014 would have grown to $202,643 which includes $685 cash and excludes $2,508 spent on fees and slippage. |
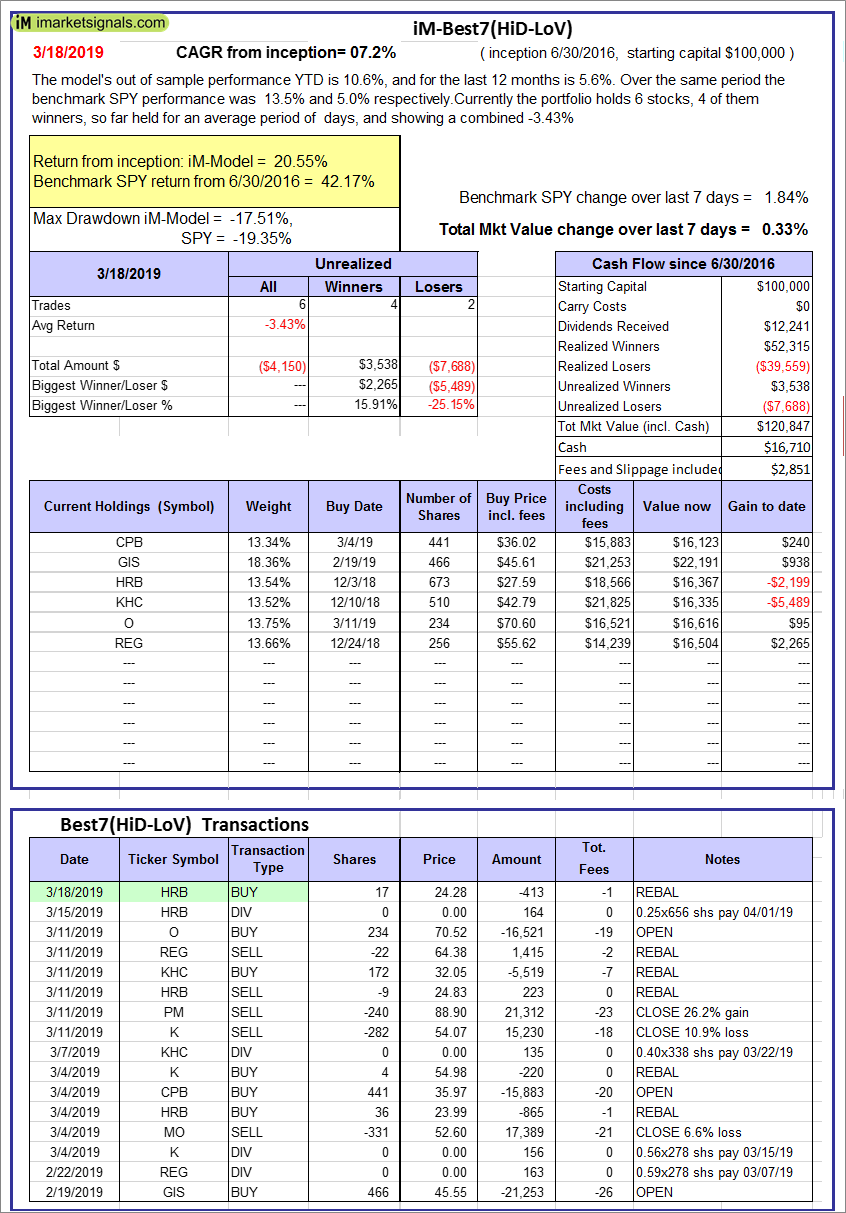 |
iM-Best7(HiD-LoV): The model’s out of sample performance YTD is 10.6%, and for the last 12 months is 5.6%. Over the same period the benchmark SPY performance was 13.5% and 5.0% respectively. Over the previous week the market value of iM-BESTOGA-3 gained 0.33% at a time when SPY gained 1.84%. A starting capital of $100,000 at inception on 6/30/2016 would have grown to $120,847 which includes $16,710 cash and excludes $2,851 spent on fees and slippage. |
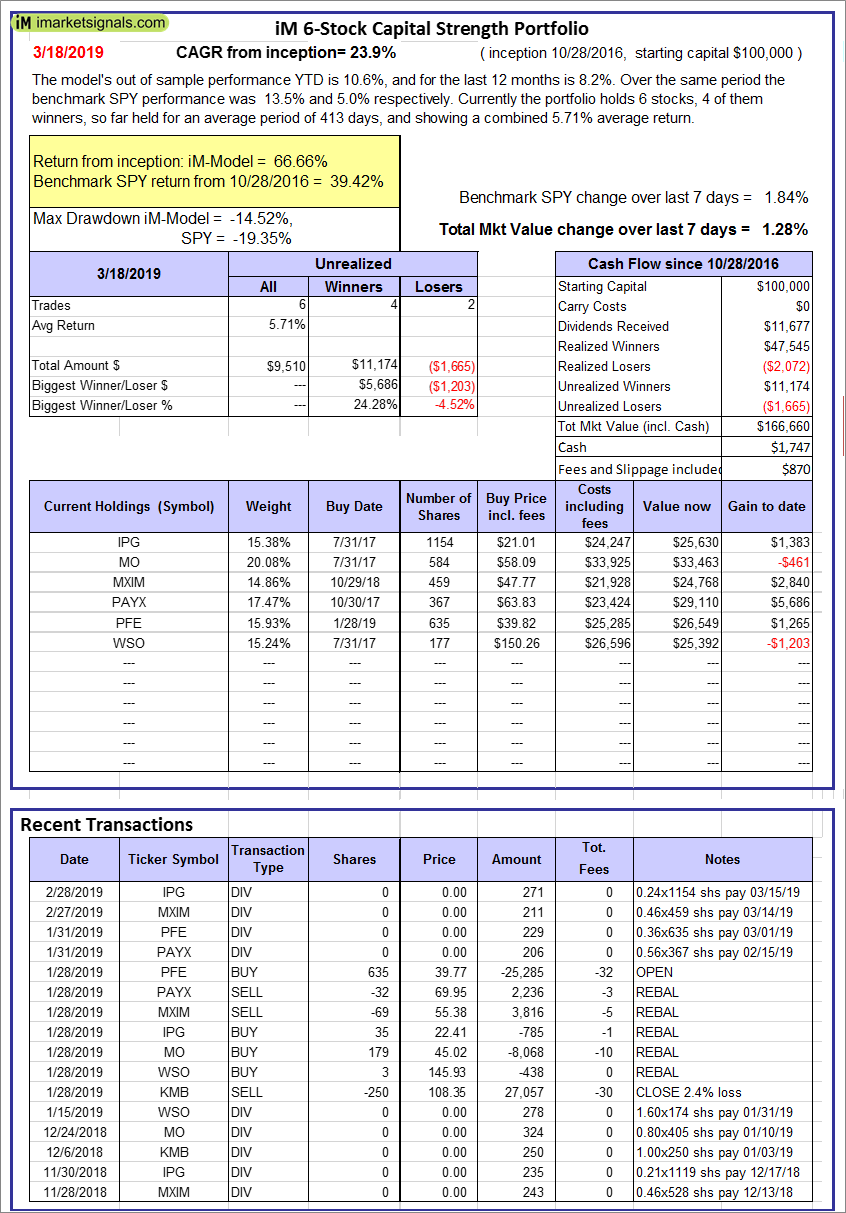 |
iM 6-Stock Capital Strength Portfolio: The model’s out of sample performance YTD is 10.6%, and for the last 12 months is 8.2%. Over the same period the benchmark SPY performance was 13.5% and 5.0% respectively. Over the previous week the market value of the iM 6-Stock Capital Strength Portfolio gained 1.28% at a time when SPY gained 1.84%. A starting capital of $100,000 at inception on 10/28/2016 would have grown to $166,660 which includes $1,747 cash and excludes $870 spent on fees and slippage. |
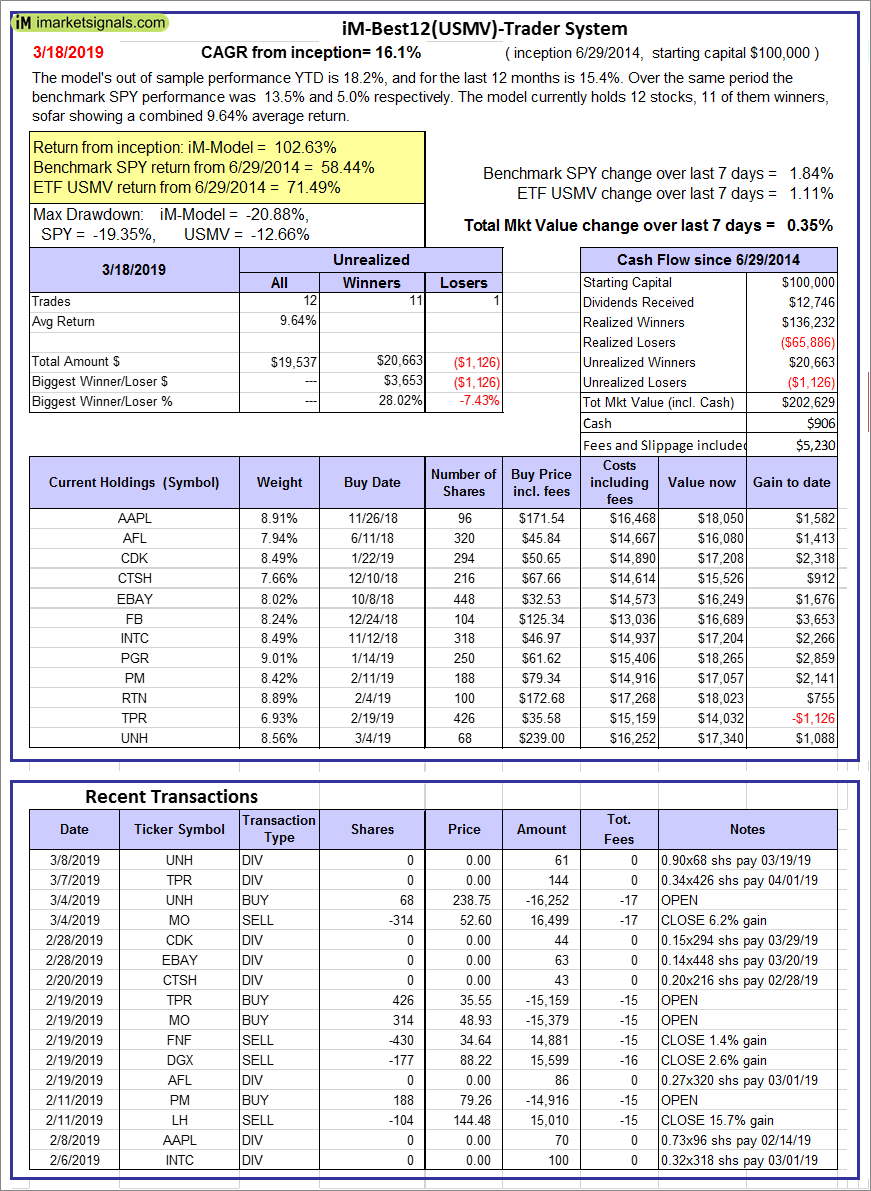 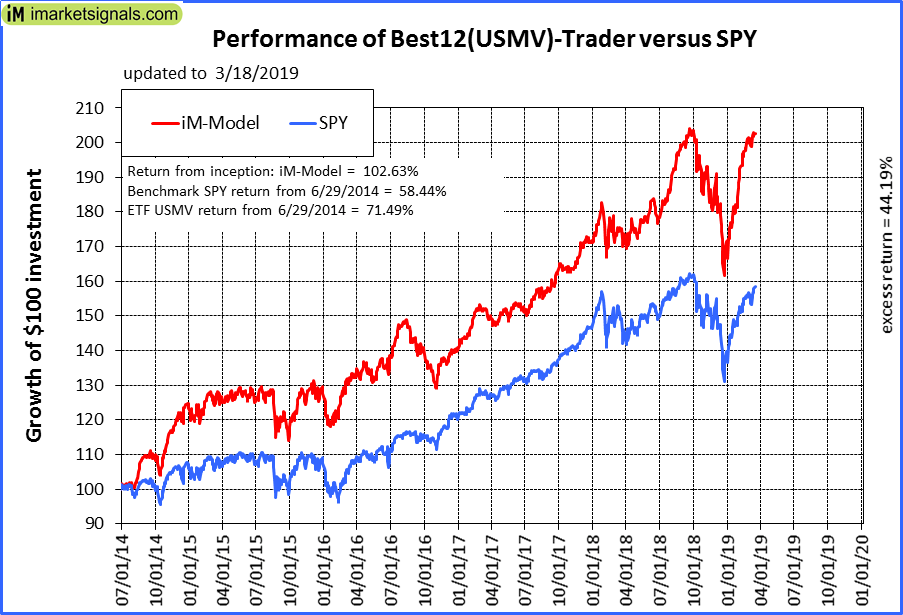 |
iM-Best12(USMV)-Trader: The model’s out of sample performance YTD is 18.2%, and for the last 12 months is 15.4%. Over the same period the benchmark SPY performance was 13.5% and 5.0% respectively. Since inception, on 6/30/2014, the model gained 102.63% while the benchmark SPY gained 58.44% and the ETF USMV gained 71.49% over the same period. Over the previous week the market value of iM-Best12(USMV)-Trader gained 0.35% at a time when SPY gained 1.84%. A starting capital of $100,000 at inception on 6/30/2014 would have grown to $202,629 which includes $906 cash and excludes $5,230 spent on fees and slippage. |
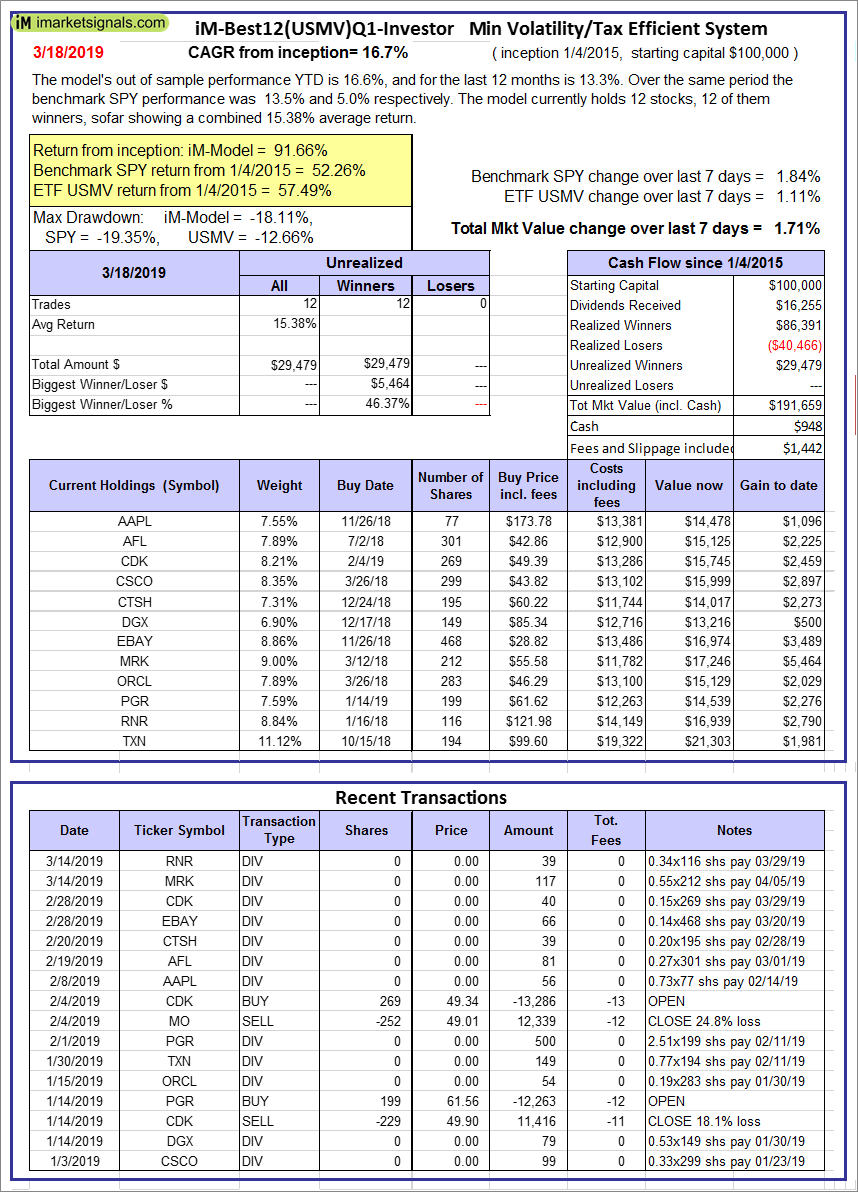 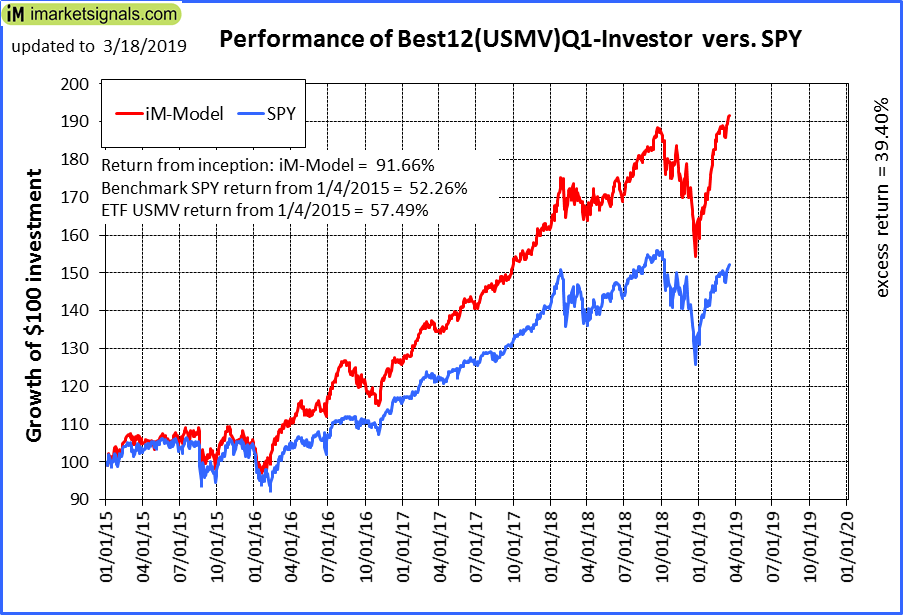 |
iM-Best12(USMV)Q1-Investor: The model’s out of sample performance YTD is 16.6%, and for the last 12 months is 13.3%. Over the same period the benchmark SPY performance was 13.5% and 5.0% respectively. Since inception, on 1/5/2015, the model gained 91.66% while the benchmark SPY gained 52.26% and the ETF USMV gained 57.49% over the same period. Over the previous week the market value of iM-Best12(USMV)Q1 gained 1.71% at a time when SPY gained 1.84%. A starting capital of $100,000 at inception on 1/5/2015 would have grown to $191,659 which includes $948 cash and excludes $1,442 spent on fees and slippage. |
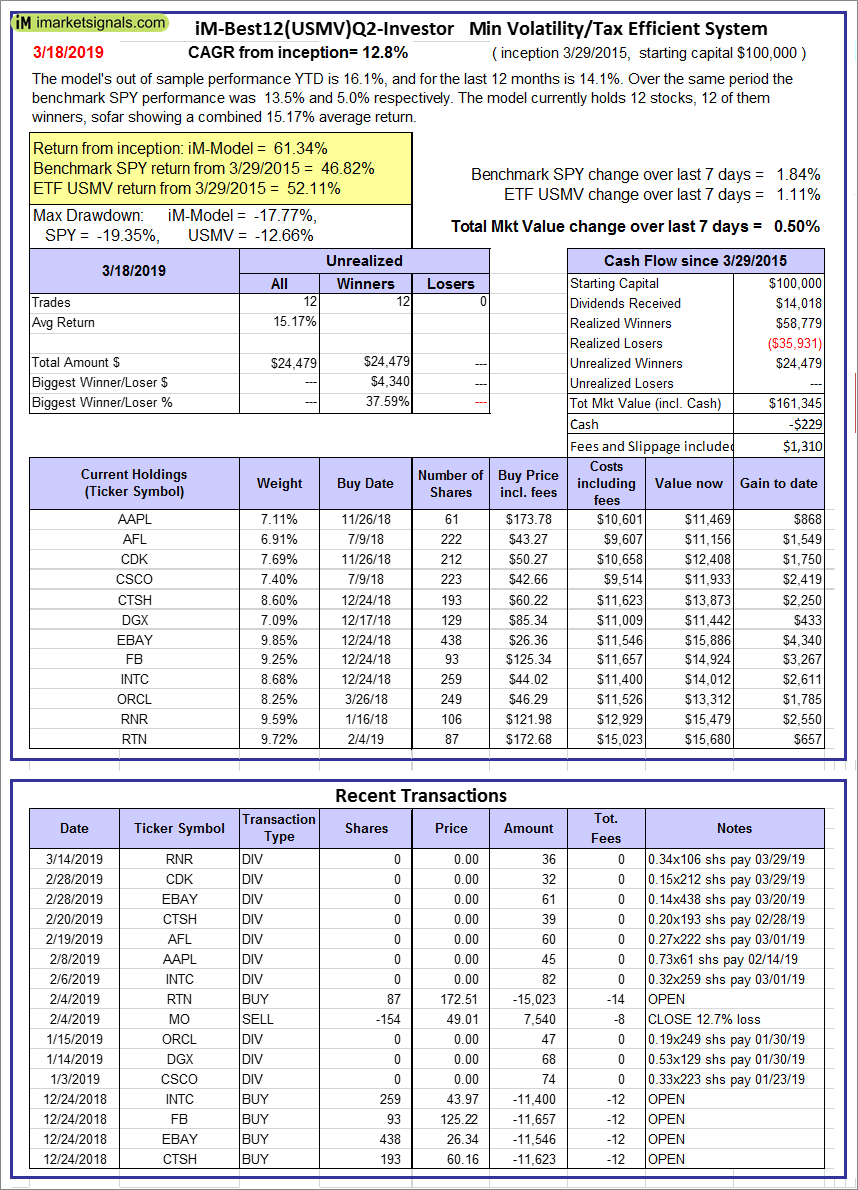 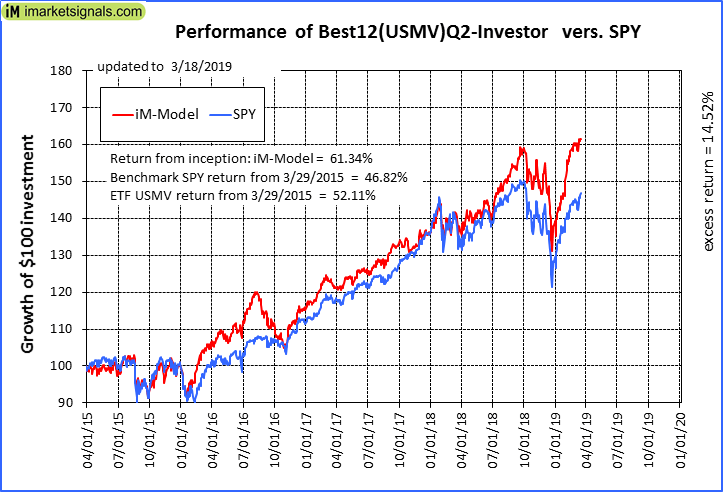 |
iM-Best12(USMV)Q2-Investor: The model’s out of sample performance YTD is 16.1%, and for the last 12 months is 14.1%. Over the same period the benchmark SPY performance was 13.5% and 5.0% respectively. Since inception, on 3/30/2015, the model gained 61.34% while the benchmark SPY gained 46.82% and the ETF USMV gained 52.11% over the same period. Over the previous week the market value of iM-Best12(USMV)Q2 gained 0.50% at a time when SPY gained 1.84%. A starting capital of $100,000 at inception on 3/30/2015 would have grown to $161,345 which includes -$229 cash and excludes $1,310 spent on fees and slippage. |
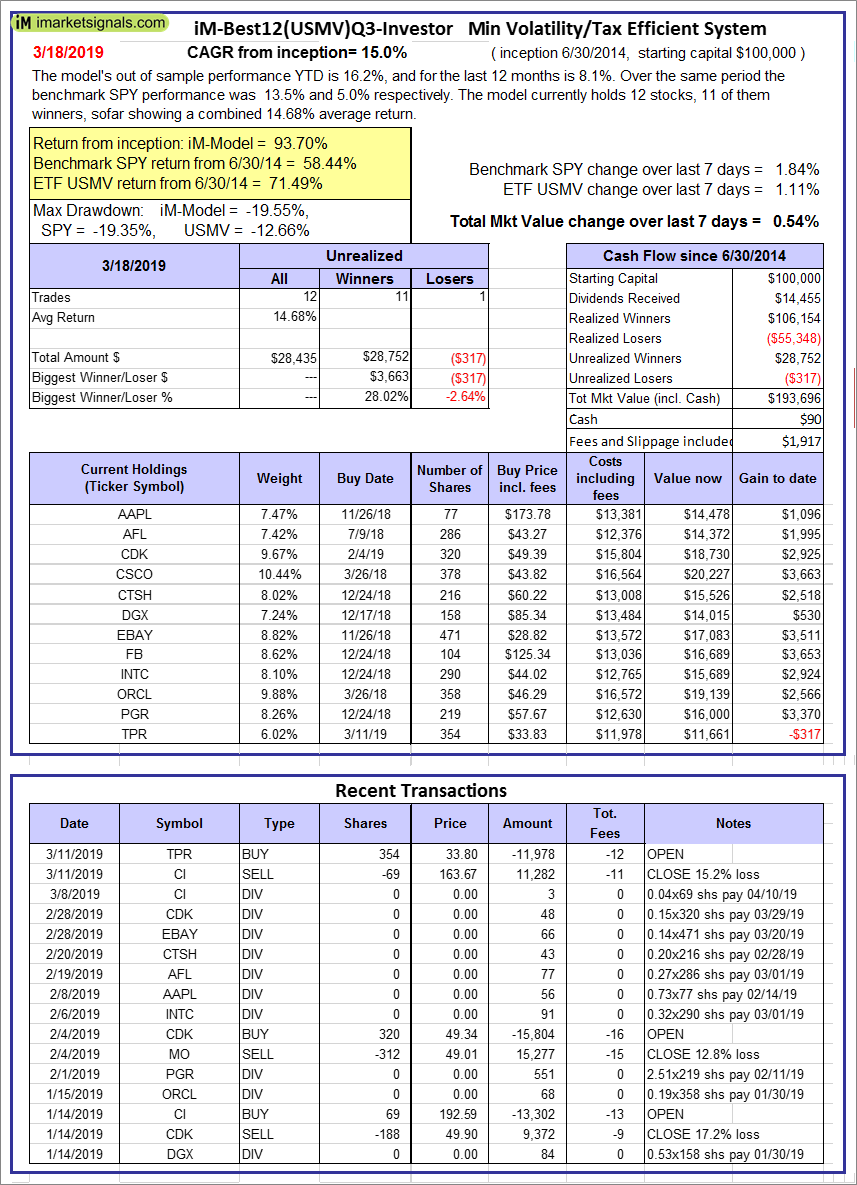 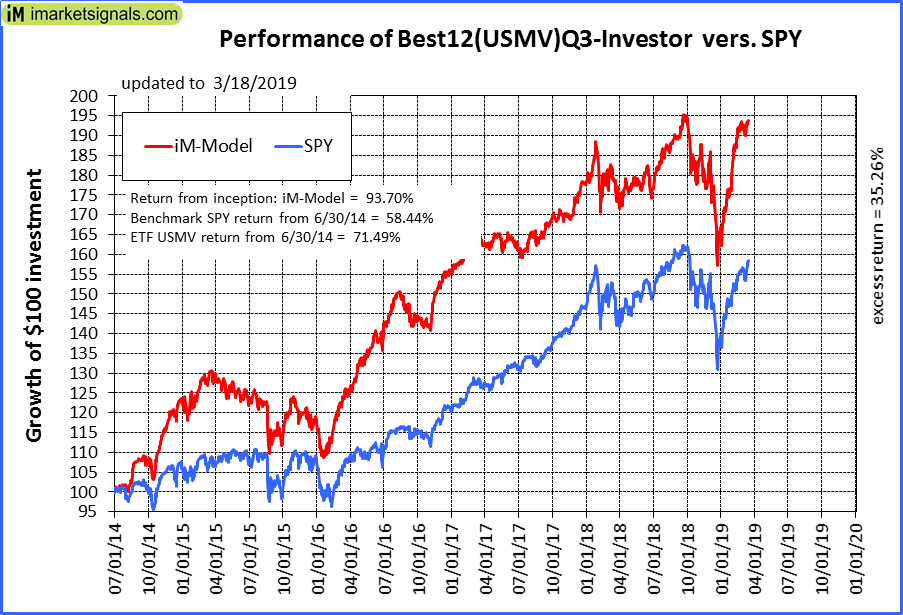 |
iM-Best12(USMV)Q3-Investor: The model’s out of sample performance YTD is 16.2%, and for the last 12 months is 8.1%. Over the same period the benchmark SPY performance was 13.5% and 5.0% respectively. Since inception, on 7/1/2014, the model gained 93.70% while the benchmark SPY gained 58.44% and the ETF USMV gained 71.49% over the same period. Over the previous week the market value of iM-Best12(USMV)Q3 gained 0.54% at a time when SPY gained 1.84%. A starting capital of $100,000 at inception on 7/1/2014 would have grown to $193,696 which includes $90 cash and excludes $1,917 spent on fees and slippage. |
 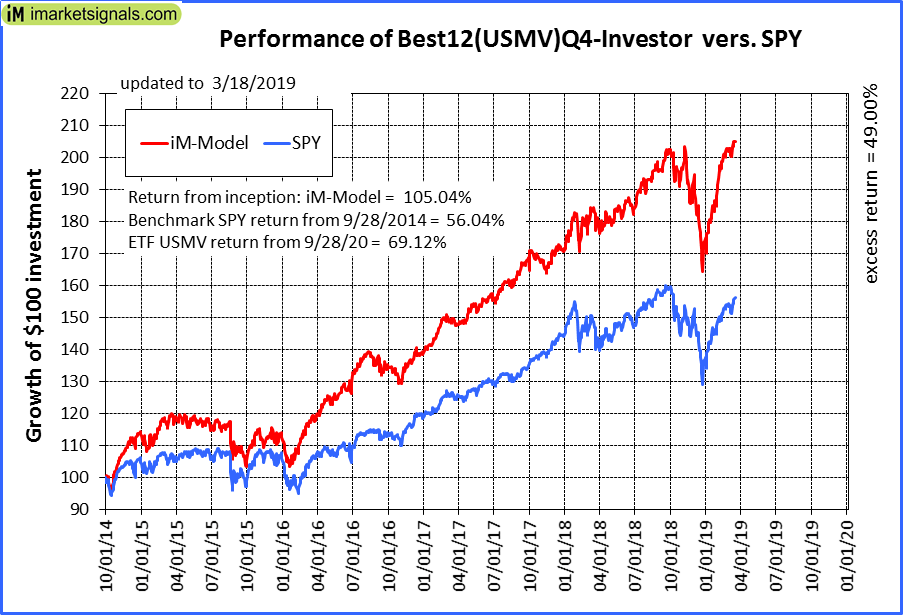 |
iM-Best12(USMV)Q4-Investor: Since inception, on 9/29/2014, the model gained 105.04% while the benchmark SPY gained 56.04% and the ETF USMV gained 69.12% over the same period. Over the previous week the market value of iM-Best12(USMV)Q4 gained 0.85% at a time when SPY gained 1.84%. A starting capital of $100,000 at inception on 9/29/2014 would have grown to $205,037 which includes $150 cash and excludes $1,723 spent on fees and slippage. |
 |
Average Performance of iM-Best12(USMV)Q1+Q2+Q3+Q4-Investor resulted in an excess return of 54.32% over SPY. (see iM-USMV Investor Portfolio) |
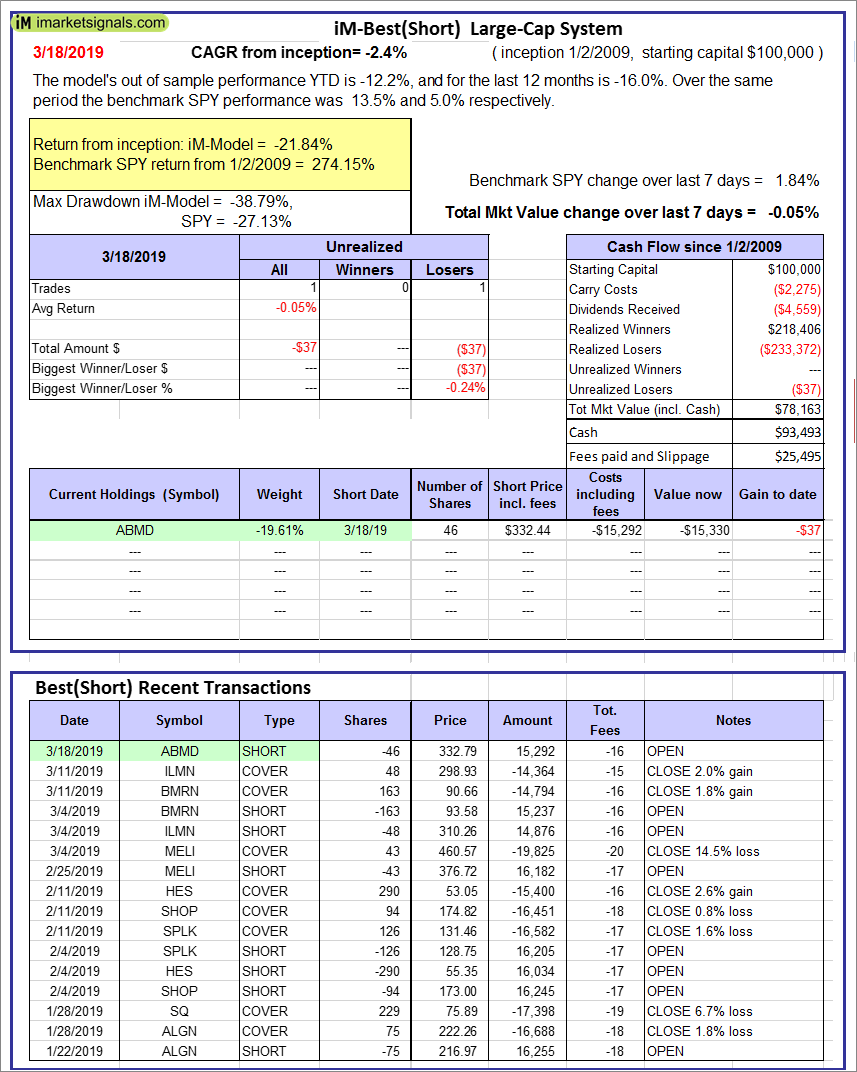 |
iM-Best(Short): The model’s out of sample performance YTD is -12.2%, and for the last 12 months is -16.0%. Over the same period the benchmark SPY performance was 13.5% and 5.0% respectively. Over the previous week the market value of iM-Best(Short) gained -0.05% at a time when SPY gained 1.84%. Over the period 1/2/2009 to 3/18/2019 the starting capital of $100,000 would have grown to $78,163 which includes $93,493 cash and excludes $25,495 spent on fees and slippage. |
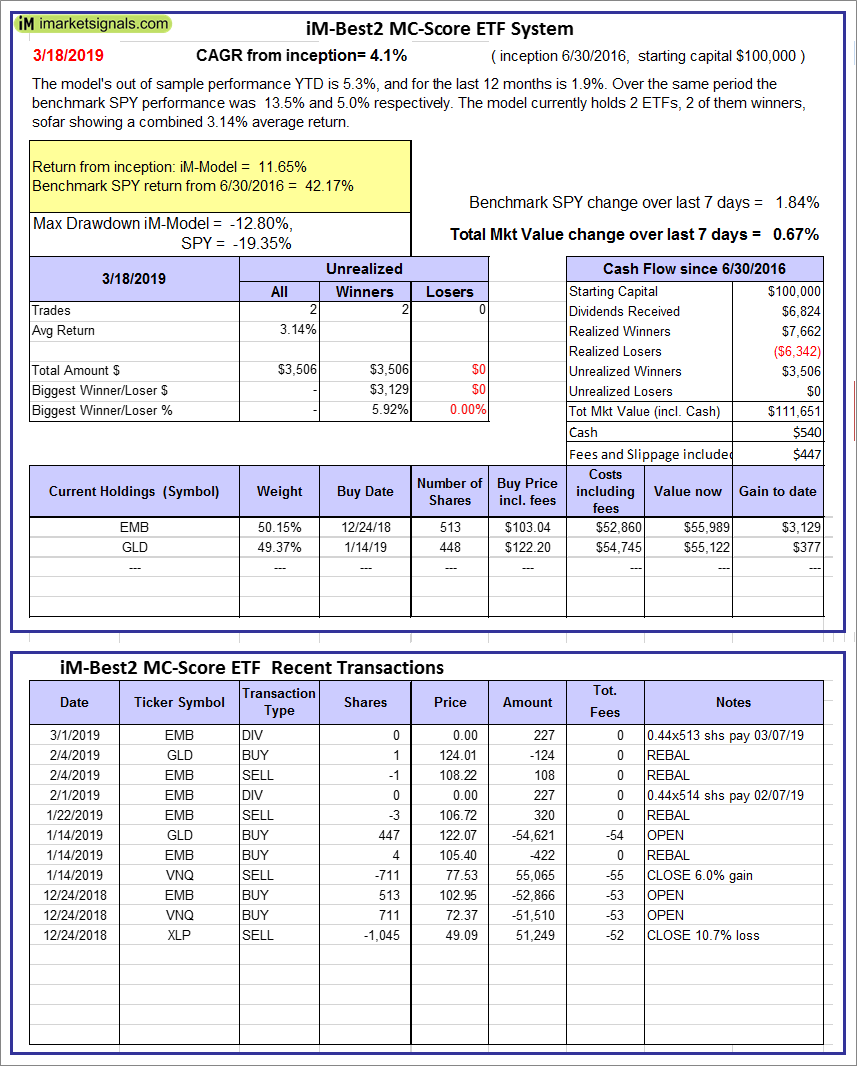 |
iM-Best2 MC-Score ETF System: The model’s out of sample performance YTD is 5.3%, and for the last 12 months is 1.9%. Over the same period the benchmark SPY performance was 13.5% and 5.0% respectively. Over the previous week the market value of the iM-Best2 MC-Score ETF System gained 0.67% at a time when SPY gained 1.84%. A starting capital of $100,000 at inception on 6/30/2016 would have grown to $111,651 which includes $540 cash and excludes $447 spent on fees and slippage. |
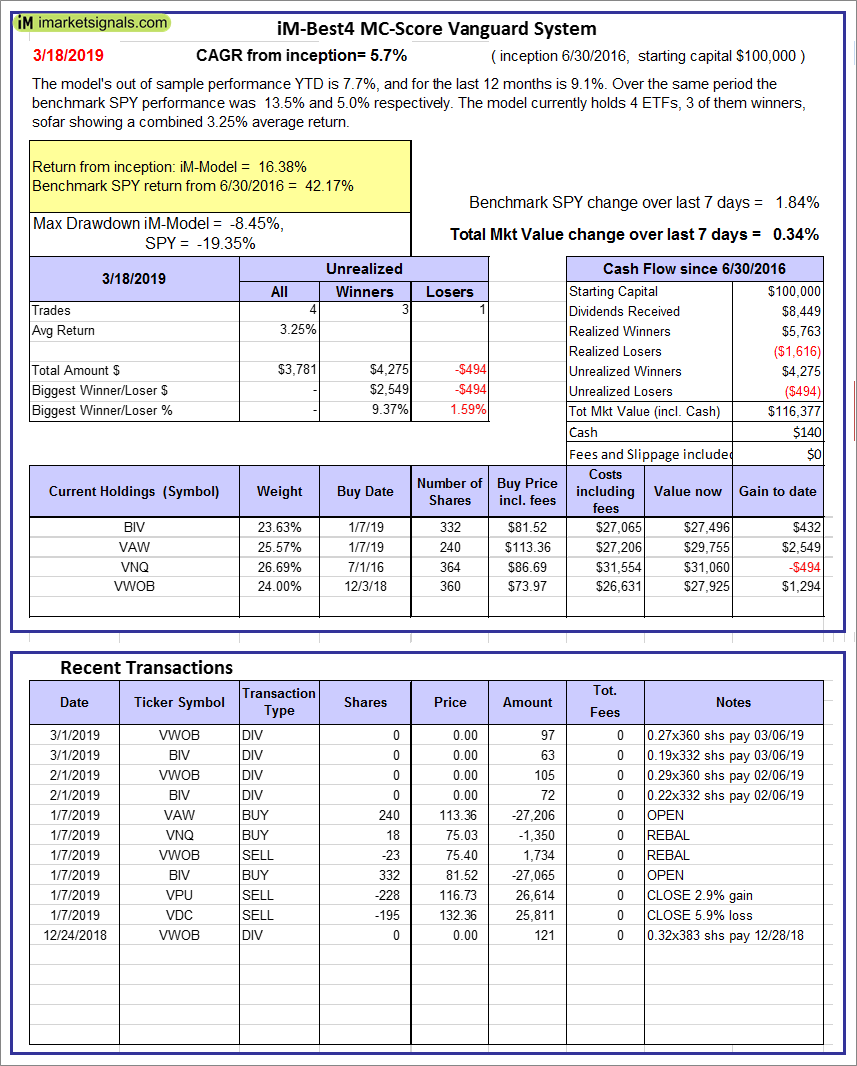 |
iM-Best4 MC-Score Vanguard System: The model’s out of sample performance YTD is 7.7%, and for the last 12 months is 9.1%. Over the same period the benchmark SPY performance was 13.5% and 5.0% respectively. Over the previous week the market value of the iM-Best4 MC-Score Vanguard System gained 0.34% at a time when SPY gained 1.84%. A starting capital of $100,000 at inception on 6/30/2016 would have grown to $116,377 which includes $140 cash and excludes $00 spent on fees and slippage. |
 |
iM-Composite (SH-RSP) Timer: The model’s out of sample performance YTD is 14.2%, and for the last 12 months is 3.7%. Over the same period the benchmark SPY performance was 13.5% and 5.0% respectively. Over the previous week the market value of the iM-Composite (SH-RSP) Timer gained 1.57% at a time when SPY gained 1.84%. A starting capital of $100,000 at inception on 6/30/2016 would have grown to $137,208 which includes $5,116 cash and excludes $513 spent on fees and slippage. |
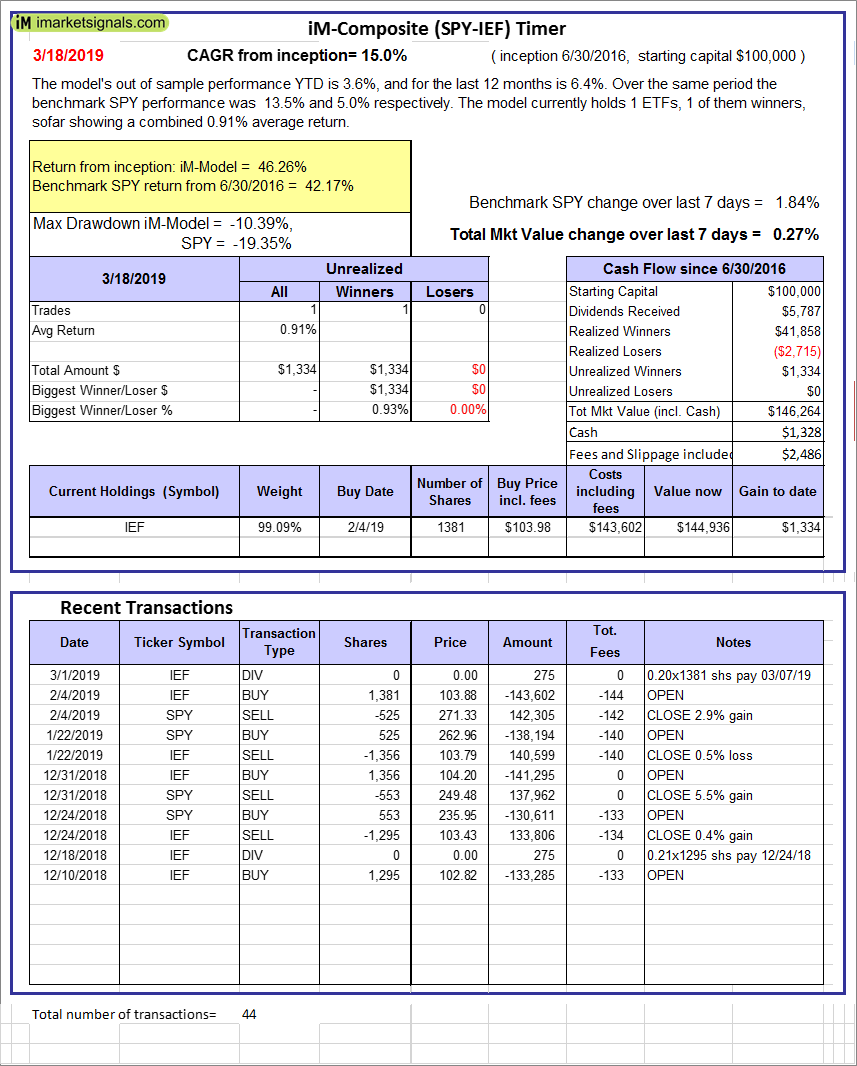 |
iM-Composite (SPY-IEF) Timer: The model’s out of sample performance YTD is 3.6%, and for the last 12 months is 6.4%. Over the same period the benchmark SPY performance was 13.5% and 5.0% respectively. Over the previous week the market value of the iM-Composite (SPY-IEF) Timer gained 0.27% at a time when SPY gained 1.84%. A starting capital of $100,000 at inception on 6/30/2016 would have grown to $146,264 which includes $1,328 cash and excludes $2,486 spent on fees and slippage. |
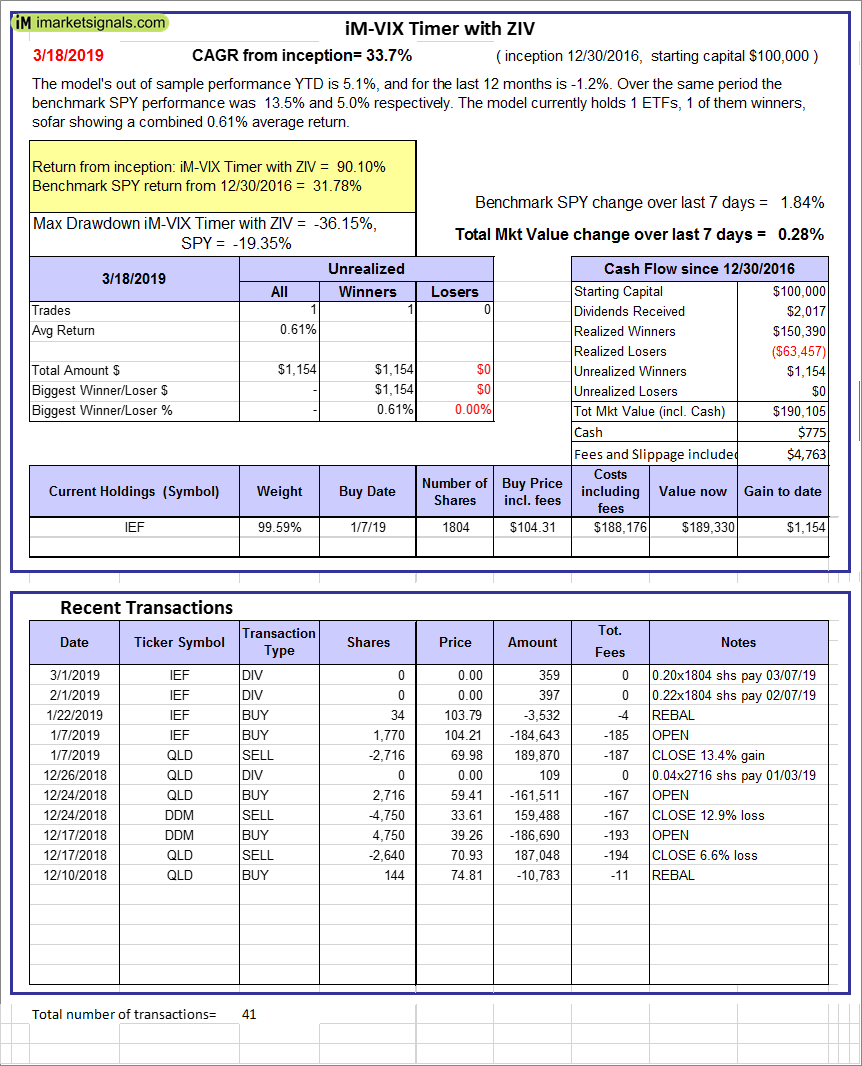 |
iM-VIX Timer with ZIV: The model’s out of sample performance YTD is 5.1%, and for the last 12 months is -1.2%. Over the same period the benchmark SPY performance was 13.5% and 5.0% respectively. Over the previous week the market value of the iM-VIX Timer with ZIV gained 0.28% at a time when SPY gained 1.84%. A starting capital of $100,000 at inception on 6/30/2016 would have grown to $190,105 which includes $775 cash and excludes $4,763 spent on fees and slippage. |
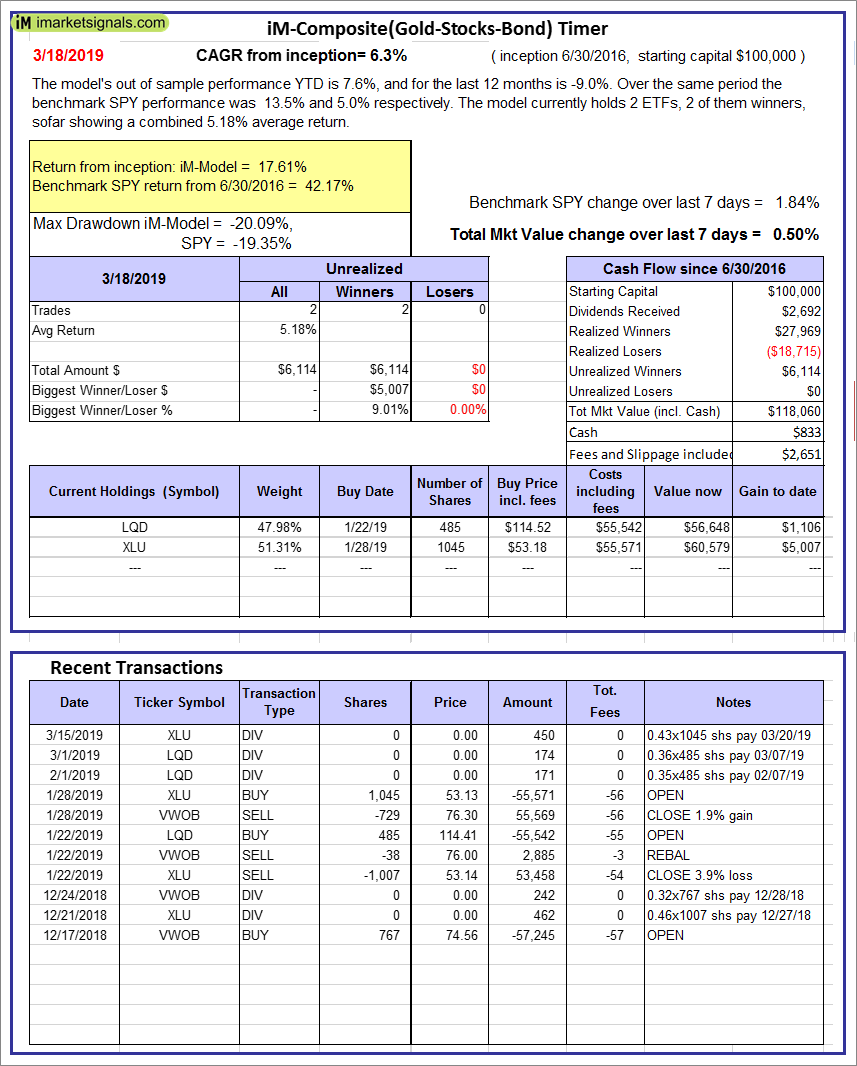 |
iM-Composite(Gold-Stocks-Bond) Timer: The model’s out of sample performance YTD is 7.6%, and for the last 12 months is -9.0%. Over the same period the benchmark SPY performance was 13.5% and 5.0% respectively. Over the previous week the market value of the iM-Composite(Gold-Stocks-Bond) Timer gained 0.50% at a time when SPY gained 1.84%. A starting capital of $100,000 at inception on 6/30/2016 would have grown to $118,060 which includes $833 cash and excludes $2,651 spent on fees and slippage. |
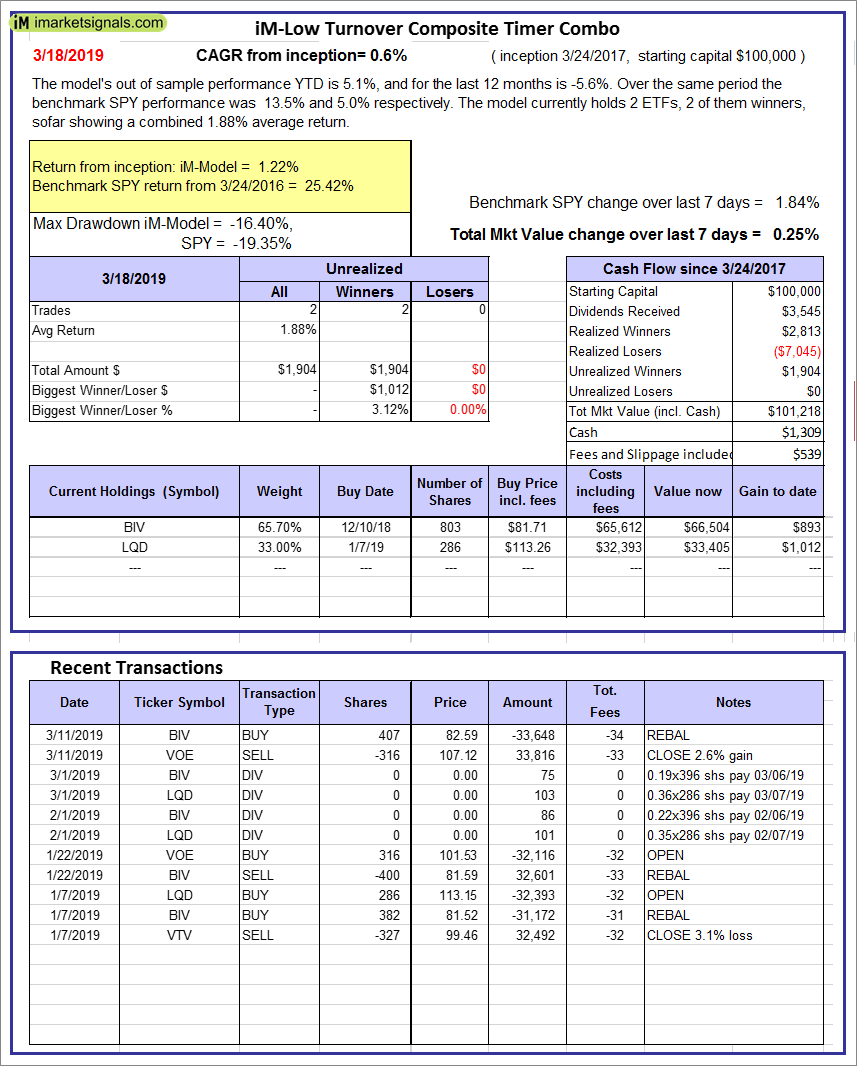 |
iM-Low Turnover Composite Timer Combo: The model’s out of sample performance YTD is 5.1%, and for the last 12 months is -5.6%. Over the same period the benchmark SPY performance was 13.5% and 5.0% respectively. Over the previous week the market value of the iM-Low Turnover Composite Timer Combo gained 0.25% at a time when SPY gained 1.84%. A starting capital of $100,000 at inception on 3/24/27 would have grown to $101,218 which includes $1,309 cash and excludes $539 spent on fees and slippage. |
 |
iM-Min Drawdown Combo: The model’s out of sample performance YTD is 8.0%, and for the last 12 months is 1.3%. Over the same period the benchmark SPY performance was 13.5% and 5.0% respectively. Over the previous week the market value of the iM-Min Drawdown Combo gained 0.50% at a time when SPY gained 1.84%. A starting capital of $100,000 at inception on 4/5/2017 would have grown to $110,176 which includes $9,694 cash and excludes $831 spent on fees and slippage. |
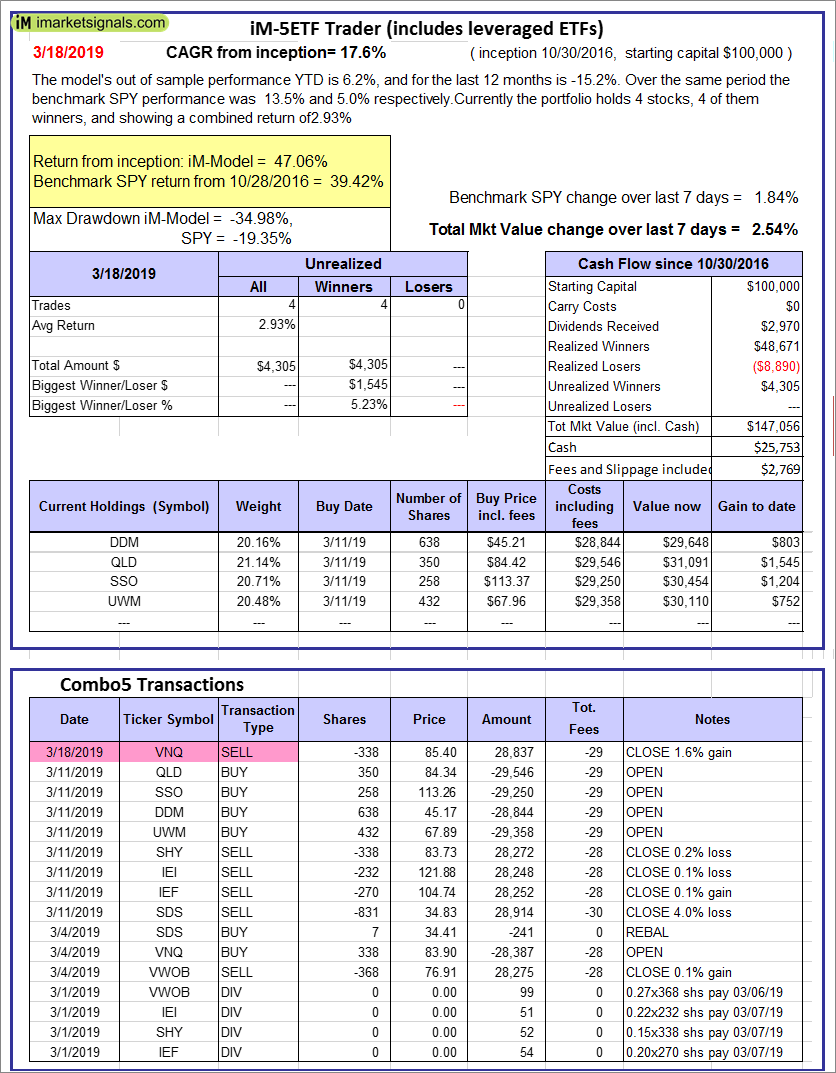 |
iM-5ETF Trader (includes leveraged ETFs): The model’s out of sample performance YTD is 6.2%, and for the last 12 months is -15.2%. Over the same period the benchmark SPY performance was 13.5% and 5.0% respectively. Over the previous week the market value of the iM-5ETF Trader (includes leveraged ETFs) gained 2.54% at a time when SPY gained 1.84%. A starting capital of $100,000 at inception on 10/30/2016 would have grown to $147,056 which includes $25,753 cash and excludes $2,769 spent on fees and slippage. |
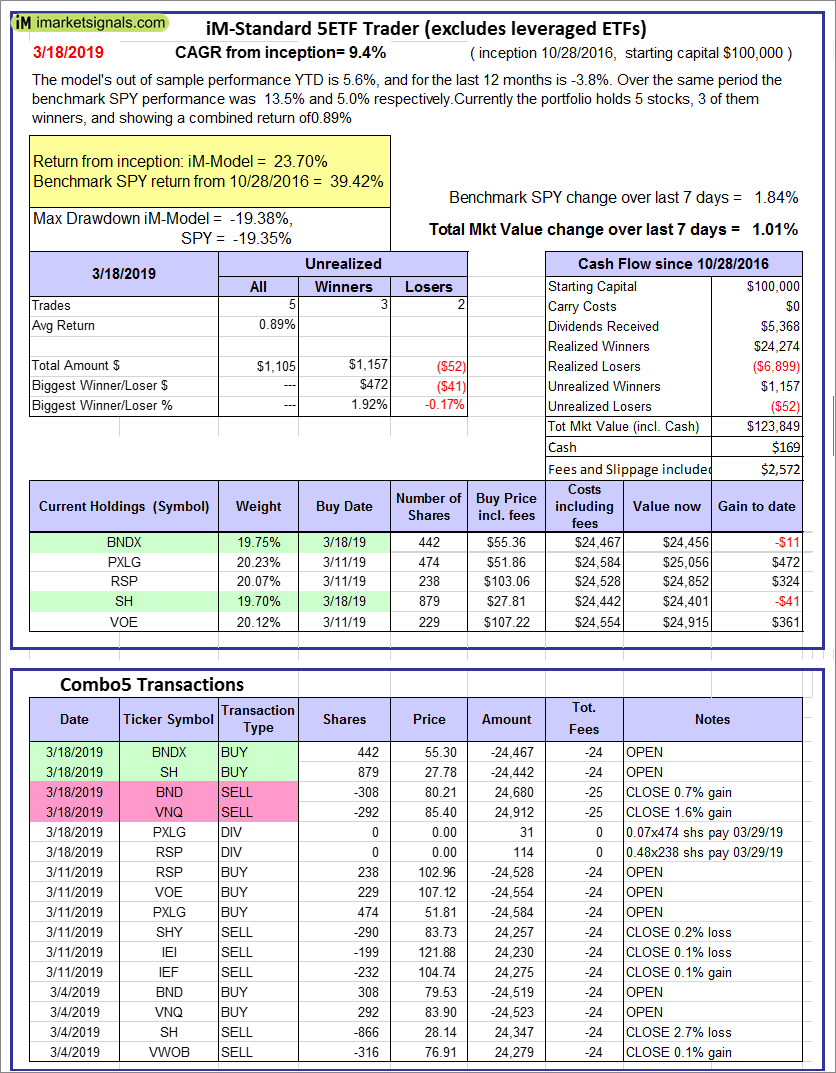 |
iM-Standard 5ETF Trader (excludes leveraged ETFs): The model’s out of sample performance YTD is 5.6%, and for the last 12 months is -3.8%. Over the same period the benchmark SPY performance was 13.5% and 5.0% respectively. Over the previous week the market value of the iM-Standard 5ETF Trader (excludes leveraged ETFs) gained 1.01% at a time when SPY gained 1.84%. A starting capital of $100,000 at inception on 10/30/2016 would have grown to $123,849 which includes $169 cash and excludes $2,572 spent on fees and slippage. |
Posted in pmp SPY-SH
iM-Best Reports – 3/11/2019
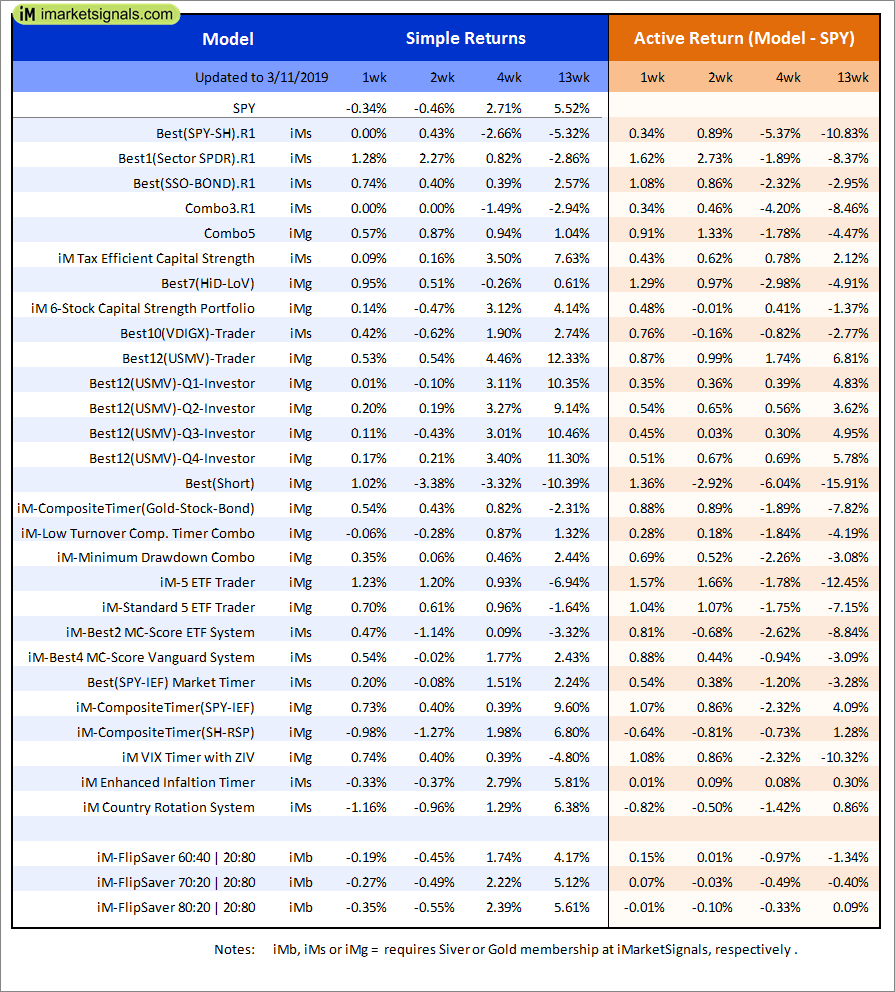 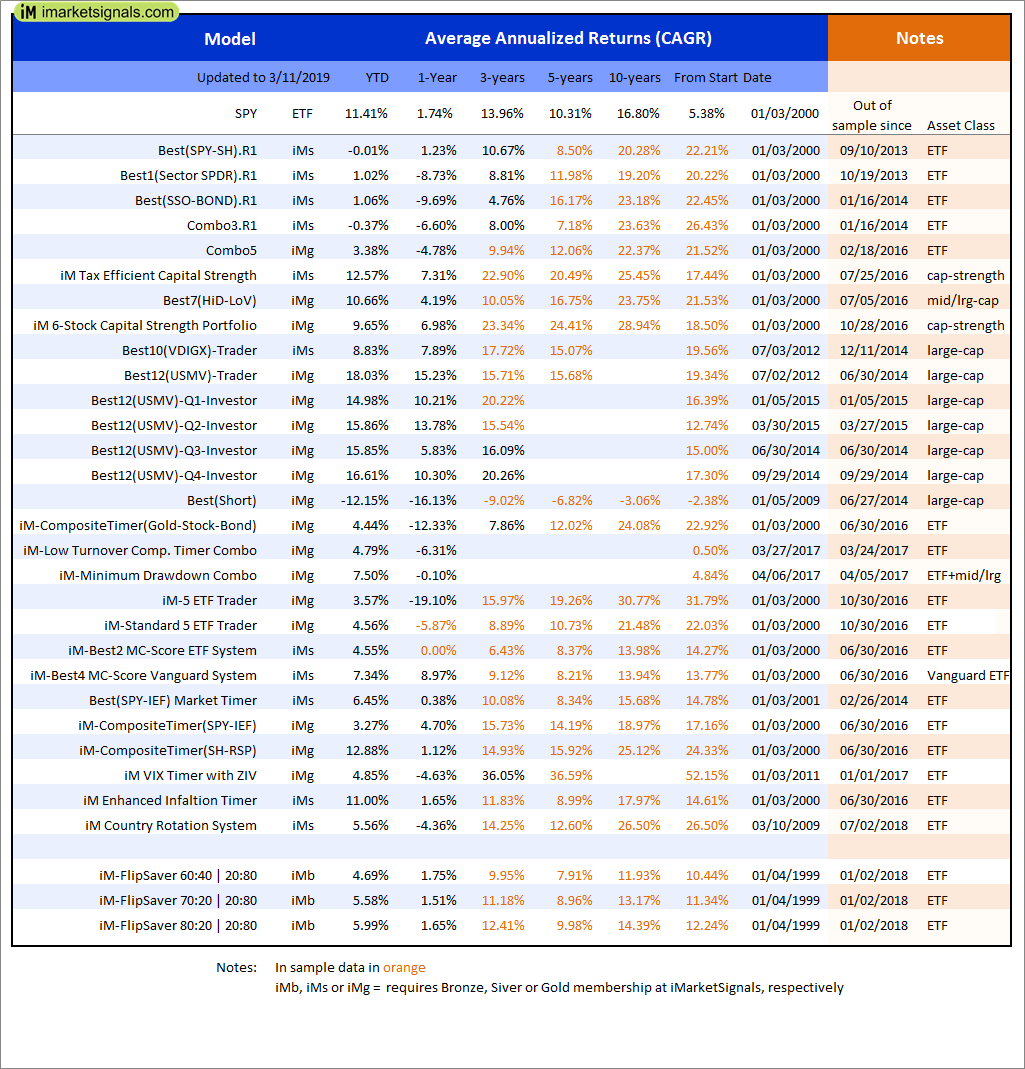 |
Out of sample performance summary of our models for the past 1, 2, 4 and 13 week periods. The active active return indicates how the models over- or underperformed the benchmark ETF SPY. Also the YTD, and the 1-, 3-, 5- and 10-year annualized returns are shown in the second table |
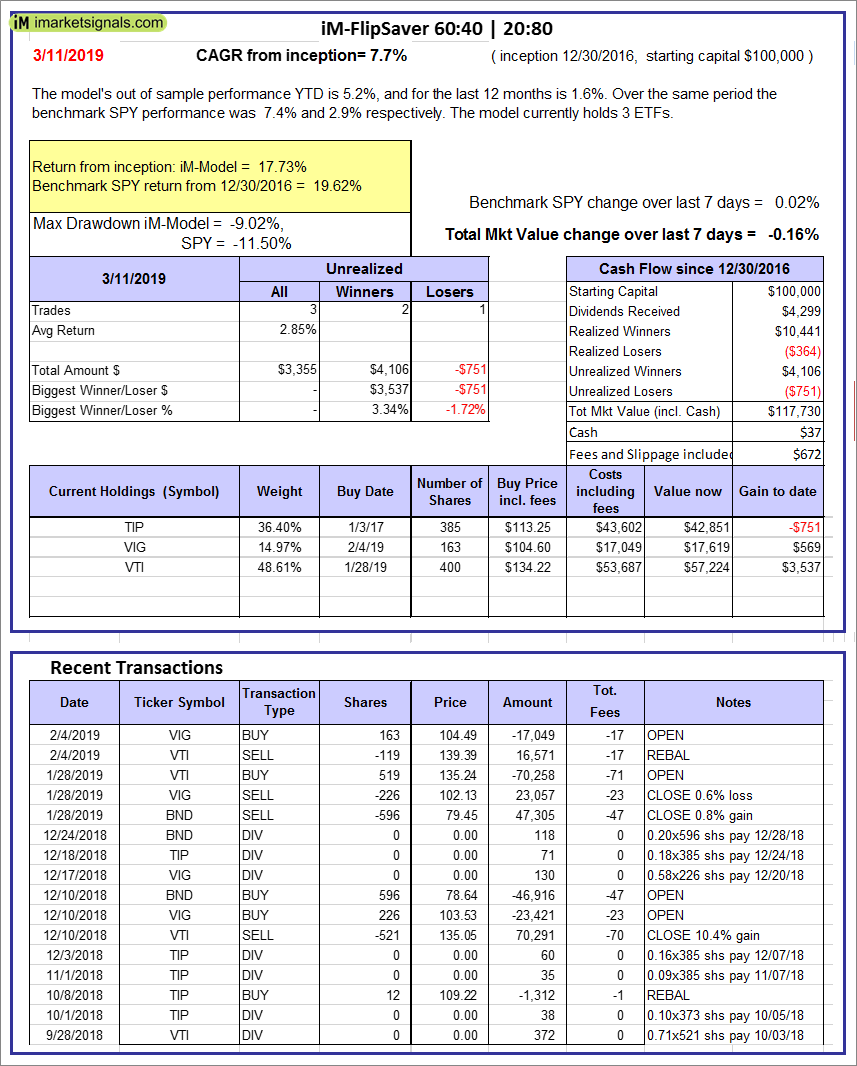 |
iM-FlipSaver 60:40 | 20:80 – 2017: The model’s out of sample performance YTD is 5.2%, and for the last 12 months is 1.6%. Over the same period the benchmark SPY performance was 7.4% and 2.9% respectively. Over the previous week the market value of iM-FlipSaver 80:20 | 20:80 gained -0.16% at a time when SPY gained 0.02%. A starting capital of $100,000 at inception on 7/16/2015 would have grown to $117,730 which includes $37 cash and excludes $672 spent on fees and slippage. |
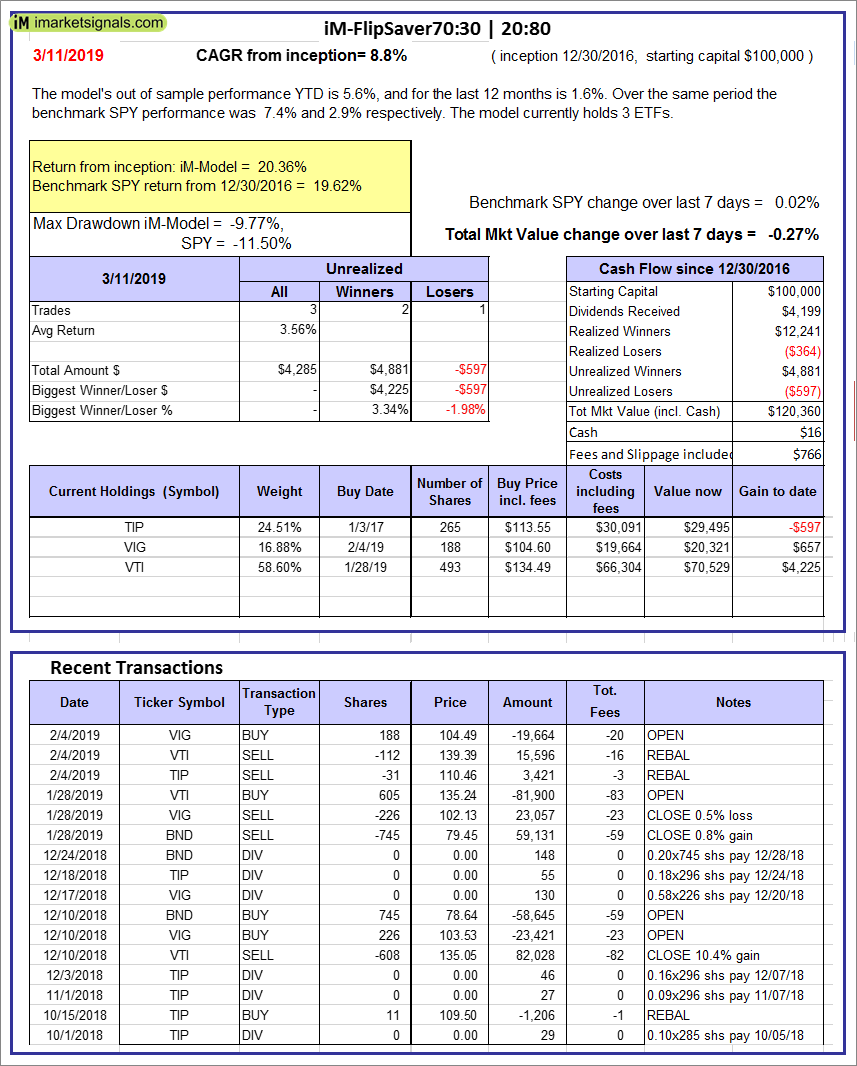 |
iM-FlipSaver 70:30 | 20:80 – 2017: The model’s out of sample performance YTD is 5.6%, and for the last 12 months is 1.6%. Over the same period the benchmark SPY performance was 7.4% and 2.9% respectively. Over the previous week the market value of iM-FlipSaver 70:30 | 20:80 gained -0.27% at a time when SPY gained 0.02%. A starting capital of $100,000 at inception on 7/15/2015 would have grown to $120,360 which includes $16 cash and excludes $766 spent on fees and slippage. |
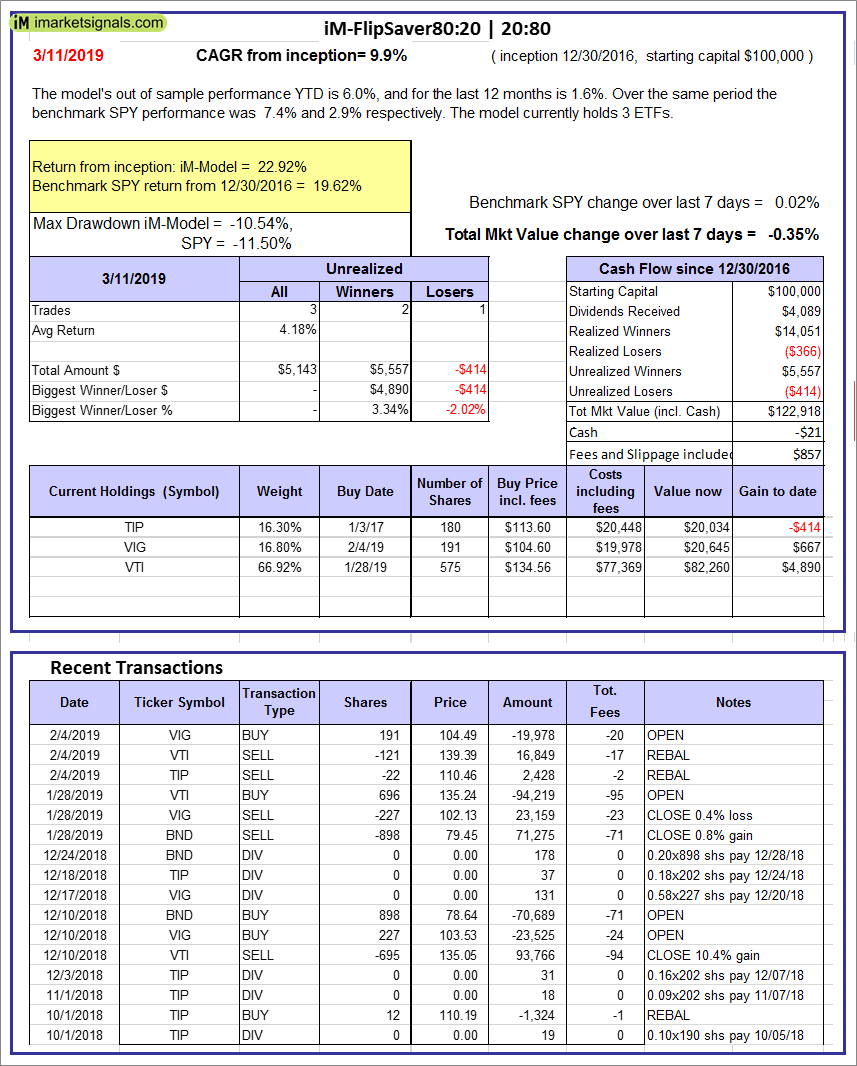 |
iM-FlipSaver 80:20 | 20:80 – 2017: The model’s out of sample performance YTD is 6.0%, and for the last 12 months is 1.6%. Over the same period the benchmark SPY performance was 7.4% and 2.9% respectively. Over the previous week the market value of iM-FlipSaver 80:20 | 20:80 gained -0.35% at a time when SPY gained 0.02%. A starting capital of $100,000 at inception on 1/2/2017 would have grown to $122,918 which includes -$21 cash and excludes $857 spent on fees and slippage. |
 |
iM-Best(SPY-SH).R1: The model’s out of sample performance YTD is -0.1%, and for the last 12 months is 1.7%. Over the same period the benchmark SPY performance was 11.4% and 1.7% respectively. Over the previous week the market value of Best(SPY-SH) gained 0.73% at a time when SPY gained -0.34%. A starting capital of $100,000 at inception on 1/2/2009 would have grown to $600,561 which includes -$13,956 cash and excludes $22,629 spent on fees and slippage. |
 |
iM-Combo3.R1: The model’s out of sample performance YTD is 0.6%, and for the last 12 months is -5.5%. Over the same period the benchmark SPY performance was 11.4% and 1.7% respectively. Over the previous week the market value of iM-Combo3.R1 gained 0.92% at a time when SPY gained -0.34%. A starting capital of $100,000 at inception on 2/3/2014 would have grown to $156,050 which includes -$1,496 cash and excludes $5,077 spent on fees and slippage. |
 |
iM-Combo5: The model’s out of sample performance YTD is 3.2%, and for the last 12 months is -4.8%. Over the same period the benchmark SPY performance was 11.4% and 1.7% respectively. Over the previous week the market value of iM-Combo5 gained 0.53% at a time when SPY gained -0.34%. A starting capital of $100,000 at inception on 2/22/2016 would have grown to $131,336 which includes $266 cash and excludes $0 spent on fees and slippage. |
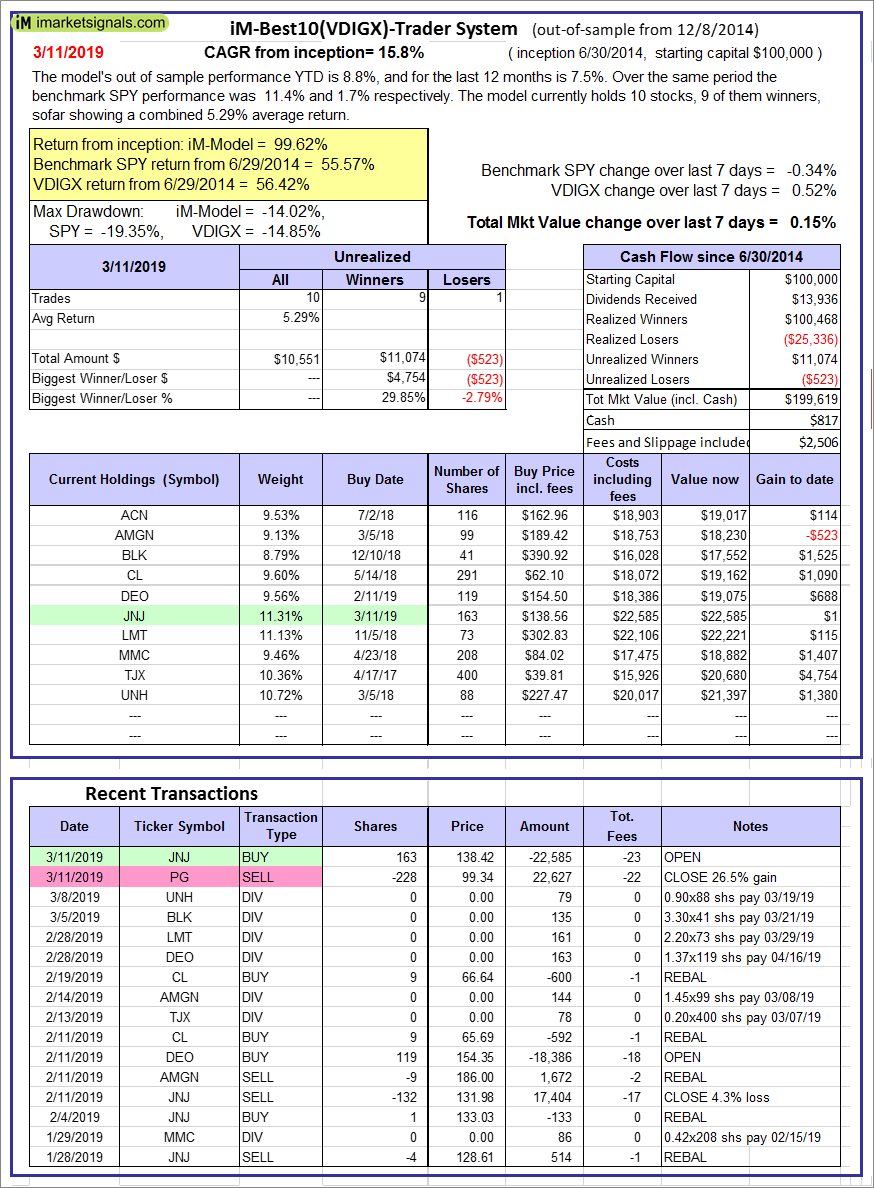 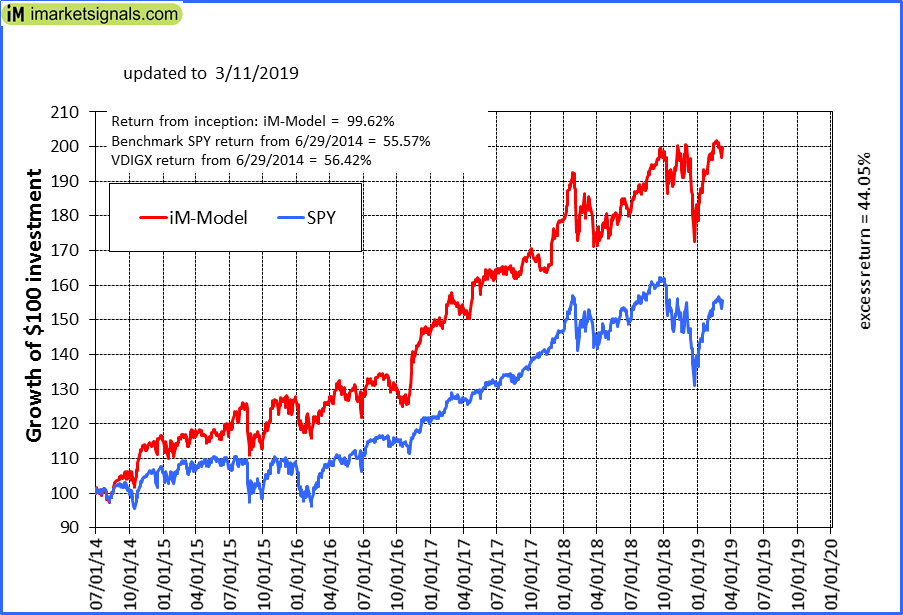 |
iM-Best10(VDIGX)-Trader: The model’s out of sample performance YTD is 8.8%, and for the last 12 months is 7.5%. Over the same period the benchmark SPY performance was 11.4% and 1.7% respectively. Since inception, on 7/1/2014, the model gained 99.62% while the benchmark SPY gained 55.57% and VDIGX gained 56.42% over the same period. Over the previous week the market value of iM-Best10(VDIGX) gained 0.15% at a time when SPY gained -0.34%. A starting capital of $100,000 at inception on 7/1/2014 would have grown to $199,619 which includes $817 cash and excludes $2,506 spent on fees and slippage. |
 |
iM-Best7(HiD-LoV): The model’s out of sample performance YTD is 10.2%, and for the last 12 months is 3.9%. Over the same period the benchmark SPY performance was 11.4% and 1.7% respectively. Over the previous week the market value of iM-BESTOGA-3 gained 0.55% at a time when SPY gained -0.34%. A starting capital of $100,000 at inception on 6/30/2016 would have grown to $120,445 which includes $16,959 cash and excludes $2,851 spent on fees and slippage. |
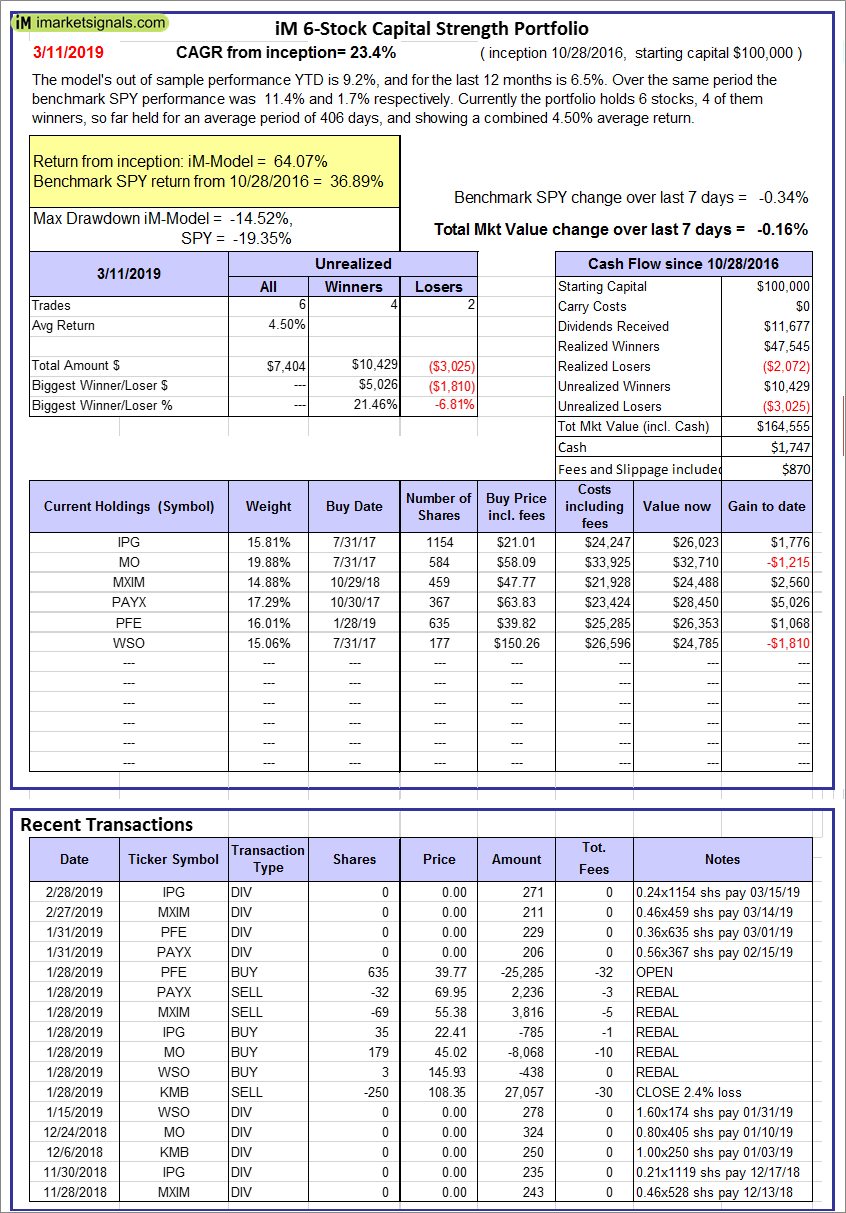 |
iM 6-Stock Capital Strength Portfolio: The model’s out of sample performance YTD is 9.2%, and for the last 12 months is 6.5%. Over the same period the benchmark SPY performance was 11.4% and 1.7% respectively. Over the previous week the market value of the iM 6-Stock Capital Strength Portfolio gained -0.16% at a time when SPY gained -0.34%. A starting capital of $100,000 at inception on 10/28/2016 would have grown to $164,555 which includes $1,747 cash and excludes $870 spent on fees and slippage. |
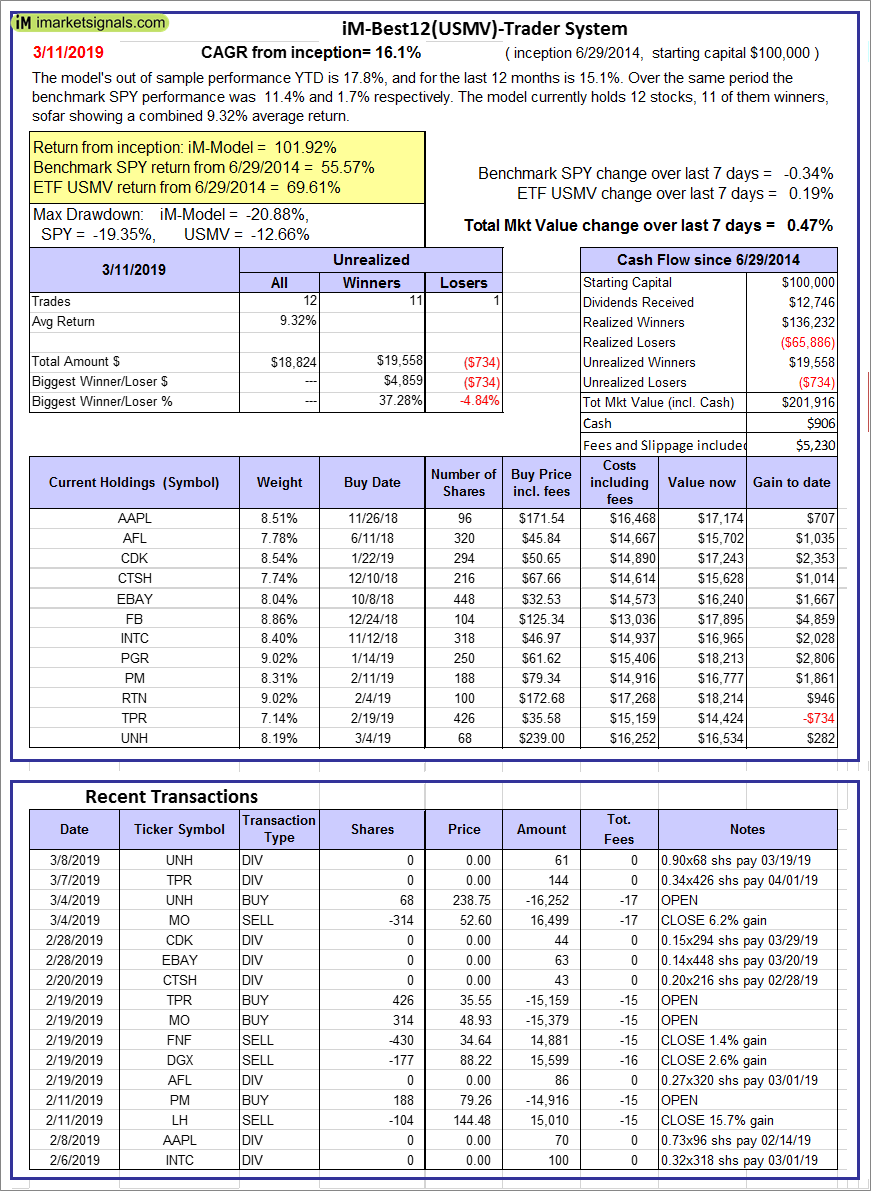 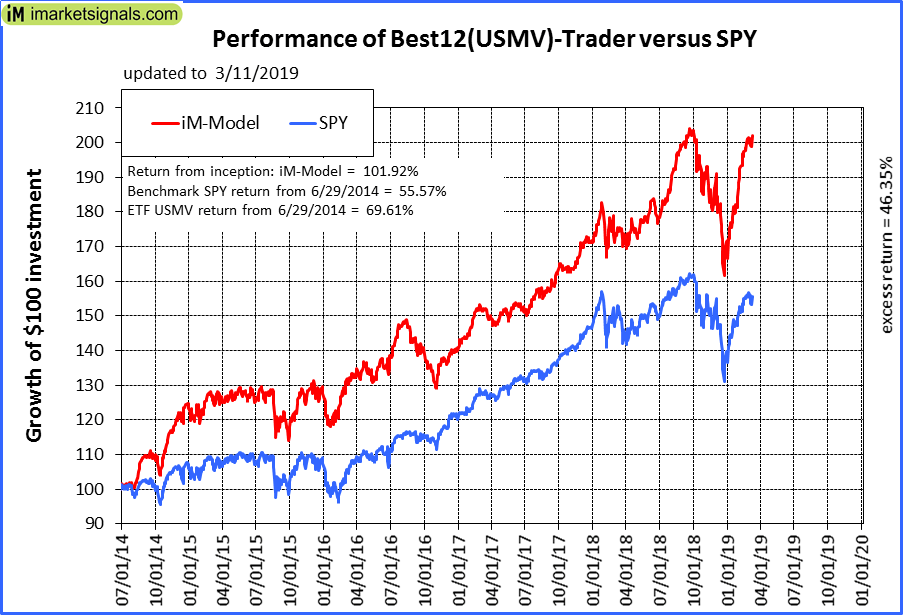 |
iM-Best12(USMV)-Trader: The model’s out of sample performance YTD is 17.8%, and for the last 12 months is 15.1%. Over the same period the benchmark SPY performance was 11.4% and 1.7% respectively. Since inception, on 6/30/2014, the model gained 101.92% while the benchmark SPY gained 55.57% and the ETF USMV gained 69.61% over the same period. Over the previous week the market value of iM-Best12(USMV)-Trader gained 0.47% at a time when SPY gained -0.34%. A starting capital of $100,000 at inception on 6/30/2014 would have grown to $201,916 which includes $906 cash and excludes $5,230 spent on fees and slippage. |
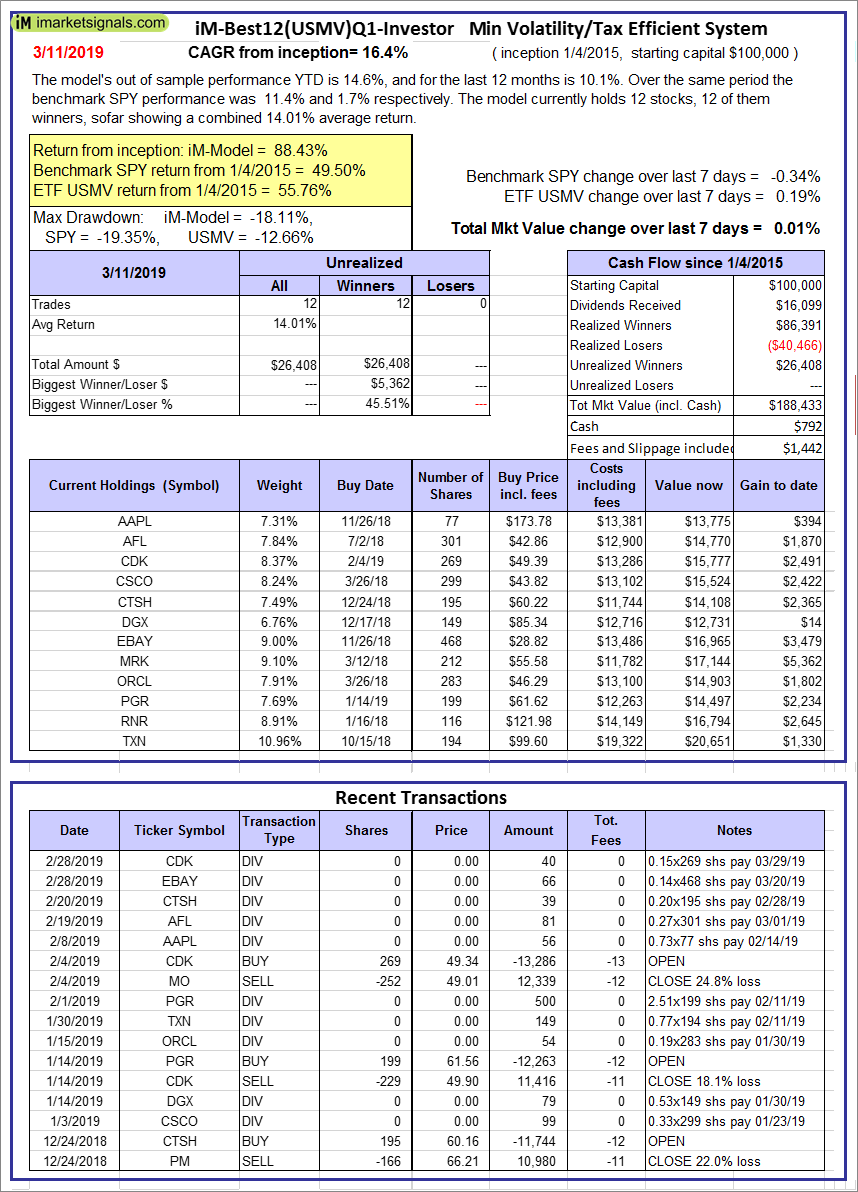  |
iM-Best12(USMV)Q1-Investor: The model’s out of sample performance YTD is 14.6%, and for the last 12 months is 10.1%. Over the same period the benchmark SPY performance was 11.4% and 1.7% respectively. Since inception, on 1/5/2015, the model gained 88.43% while the benchmark SPY gained 49.50% and the ETF USMV gained 55.76% over the same period. Over the previous week the market value of iM-Best12(USMV)Q1 gained 0.01% at a time when SPY gained -0.34%. A starting capital of $100,000 at inception on 1/5/2015 would have grown to $188,433 which includes $792 cash and excludes $1,442 spent on fees and slippage. |
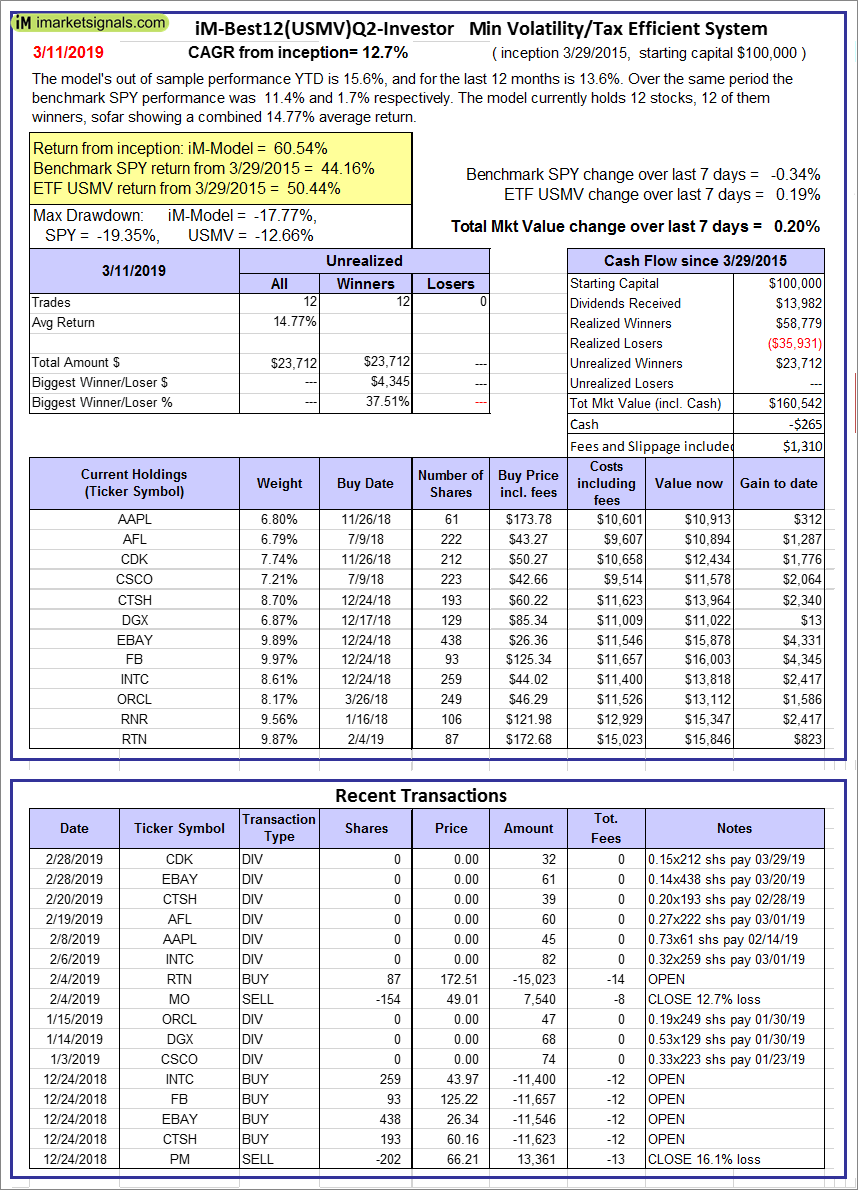 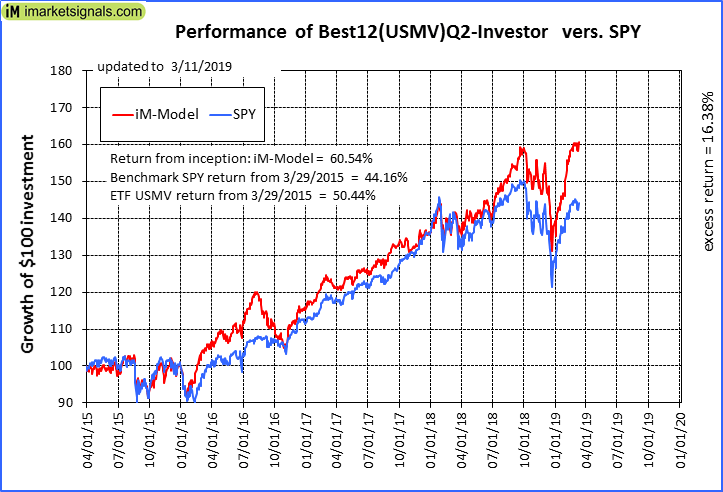 |
iM-Best12(USMV)Q2-Investor: The model’s out of sample performance YTD is 15.6%, and for the last 12 months is 13.6%. Over the same period the benchmark SPY performance was 11.4% and 1.7% respectively. Since inception, on 3/30/2015, the model gained 60.54% while the benchmark SPY gained 44.16% and the ETF USMV gained 50.44% over the same period. Over the previous week the market value of iM-Best12(USMV)Q2 gained 0.20% at a time when SPY gained -0.34%. A starting capital of $100,000 at inception on 3/30/2015 would have grown to $160,542 which includes -$265 cash and excludes $1,310 spent on fees and slippage. |
 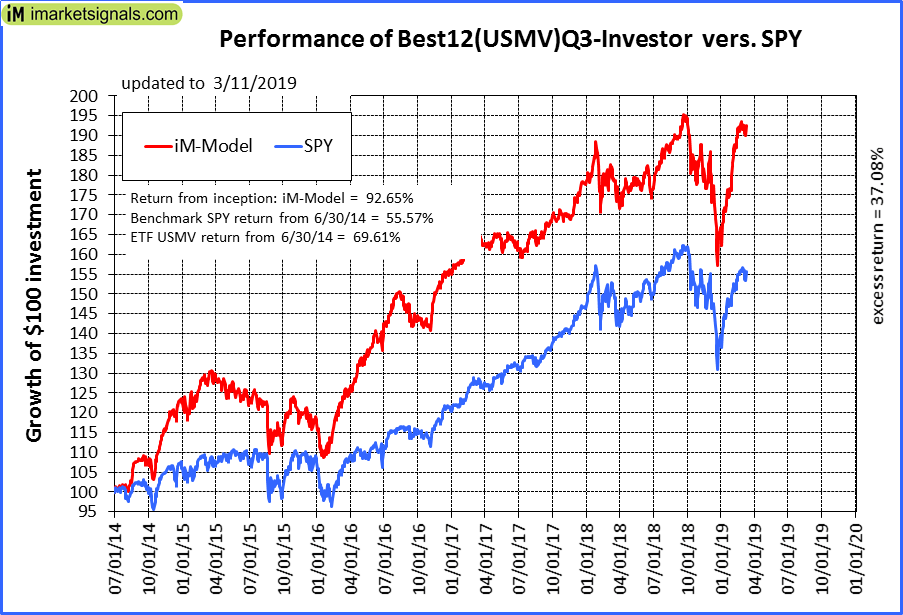 |
iM-Best12(USMV)Q3-Investor: The model’s out of sample performance YTD is 15.6%, and for the last 12 months is 5.7%. Over the same period the benchmark SPY performance was 11.4% and 1.7% respectively. Since inception, on 7/1/2014, the model gained 92.65% while the benchmark SPY gained 55.57% and the ETF USMV gained 69.61% over the same period. Over the previous week the market value of iM-Best12(USMV)Q3 gained 0.11% at a time when SPY gained -0.34%. A starting capital of $100,000 at inception on 7/1/2014 would have grown to $192,653 which includes $89 cash and excludes $1,917 spent on fees and slippage. |
  |
iM-Best12(USMV)Q4-Investor: Since inception, on 9/29/2014, the model gained 103.18% while the benchmark SPY gained 53.22% and the ETF USMV gained 67.27% over the same period. Over the previous week the market value of iM-Best12(USMV)Q4 gained 0.11% at a time when SPY gained -0.34%. A starting capital of $100,000 at inception on 9/29/2014 would have grown to $203,183 which includes $150 cash and excludes $1,723 spent on fees and slippage. |
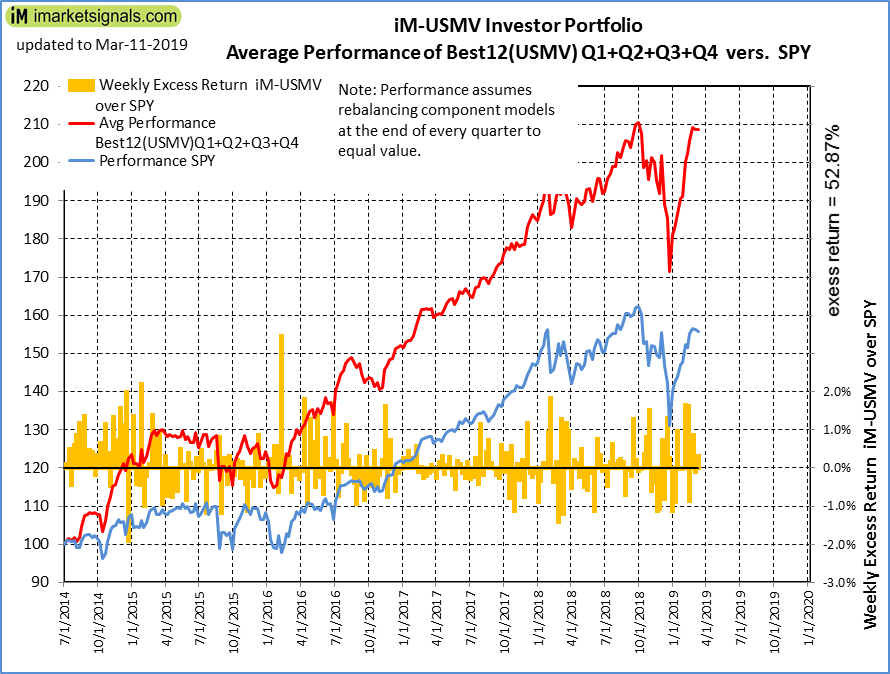 |
Average Performance of iM-Best12(USMV)Q1+Q2+Q3+Q4-Investor resulted in an excess return of 52.87% over SPY. (see iM-USMV Investor Portfolio) |
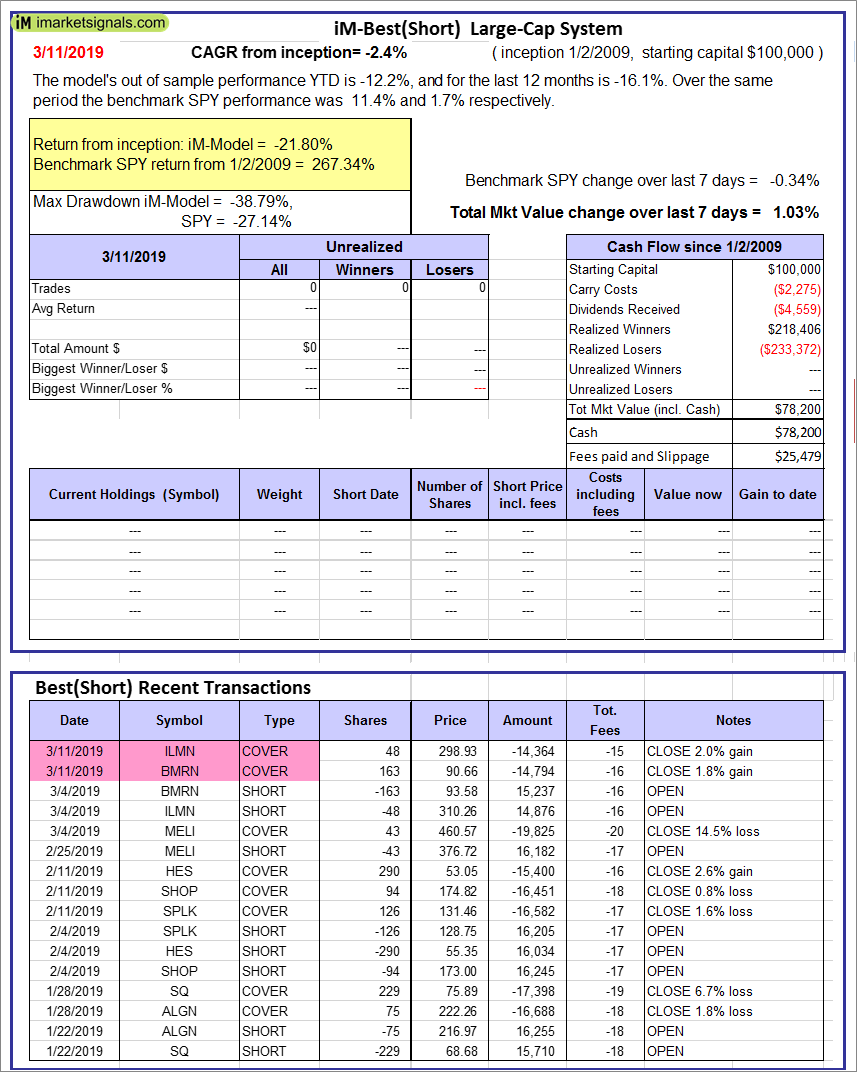 |
iM-Best(Short): The model’s out of sample performance YTD is -12.2%, and for the last 12 months is -16.1%. Over the same period the benchmark SPY performance was 11.4% and 1.7% respectively. Over the previous week the market value of iM-Best(Short) gained 1.03% at a time when SPY gained -0.34%. Over the period 1/2/2009 to 3/11/2019 the starting capital of $100,000 would have grown to $78,200 which includes $78,200 cash and excludes $25,479 spent on fees and slippage. |
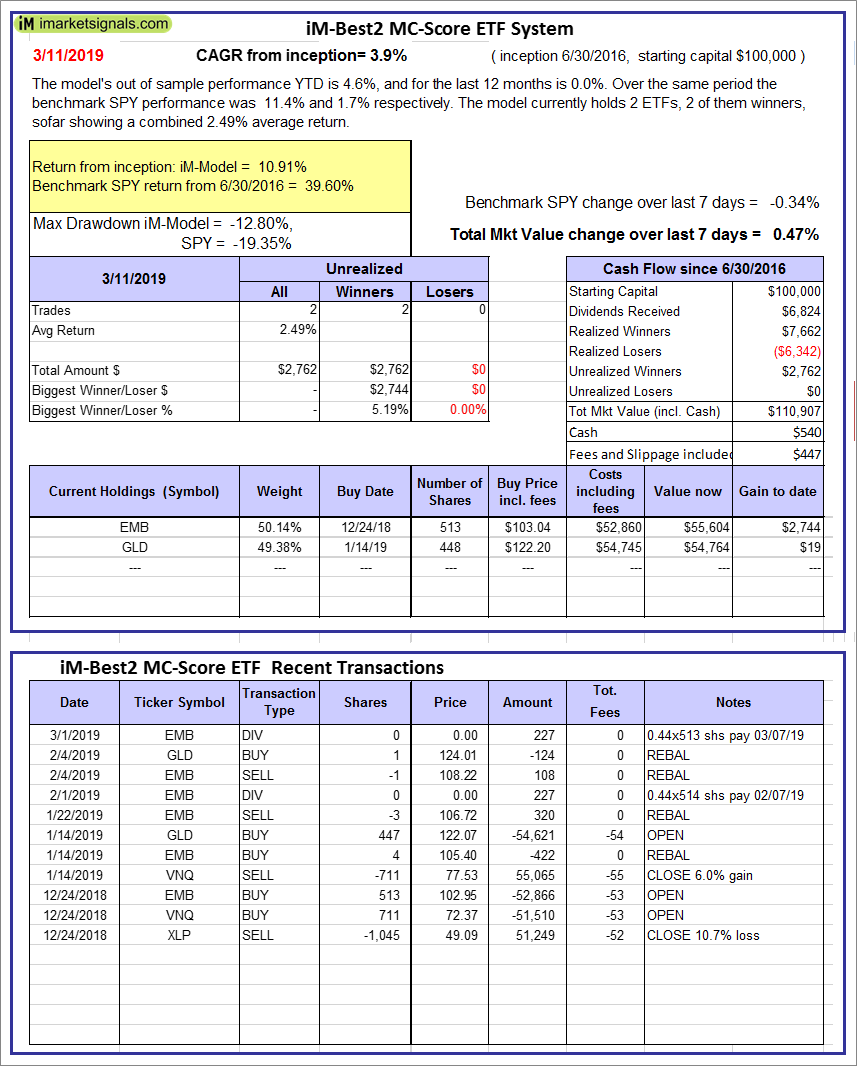 |
iM-Best2 MC-Score ETF System: The model’s out of sample performance YTD is 4.6%, and for the last 12 months is 0.0%. Over the same period the benchmark SPY performance was 11.4% and 1.7% respectively. Over the previous week the market value of the iM-Best2 MC-Score ETF System gained 0.47% at a time when SPY gained -0.34%. A starting capital of $100,000 at inception on 6/30/2016 would have grown to $110,907 which includes $540 cash and excludes $447 spent on fees and slippage. |
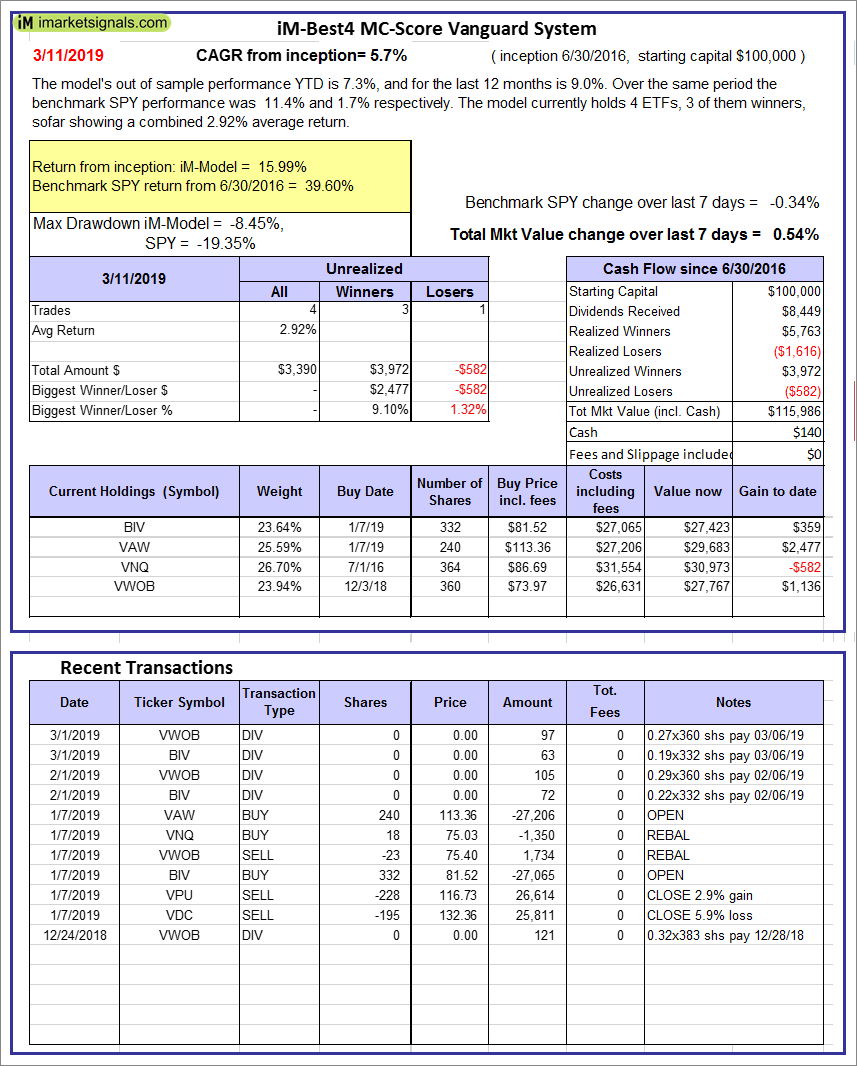 |
iM-Best4 MC-Score Vanguard System: The model’s out of sample performance YTD is 7.3%, and for the last 12 months is 9.0%. Over the same period the benchmark SPY performance was 11.4% and 1.7% respectively. Over the previous week the market value of the iM-Best4 MC-Score Vanguard System gained 0.54% at a time when SPY gained -0.34%. A starting capital of $100,000 at inception on 6/30/2016 would have grown to $115,986 which includes $140 cash and excludes $00 spent on fees and slippage. |
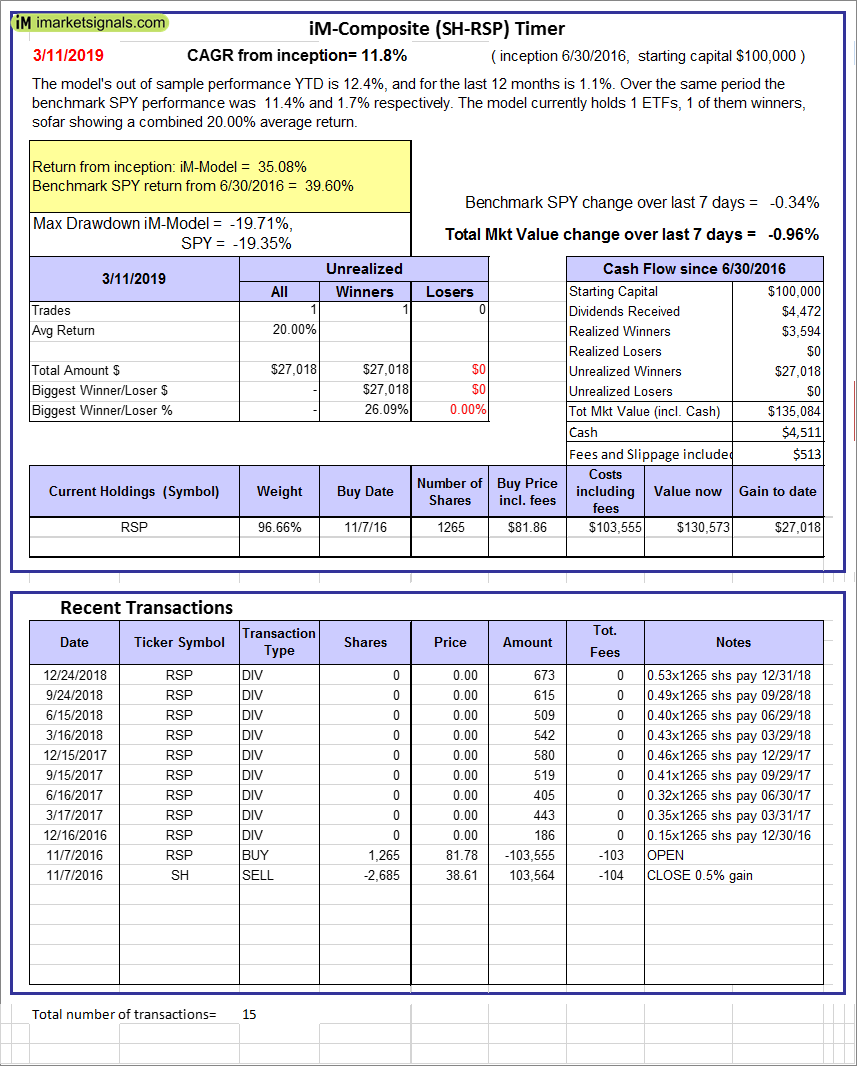 |
iM-Composite (SH-RSP) Timer: The model’s out of sample performance YTD is 12.4%, and for the last 12 months is 1.1%. Over the same period the benchmark SPY performance was 11.4% and 1.7% respectively. Over the previous week the market value of the iM-Composite (SH-RSP) Timer gained -0.96% at a time when SPY gained -0.34%. A starting capital of $100,000 at inception on 6/30/2016 would have grown to $135,084 which includes $4,511 cash and excludes $513 spent on fees and slippage. |
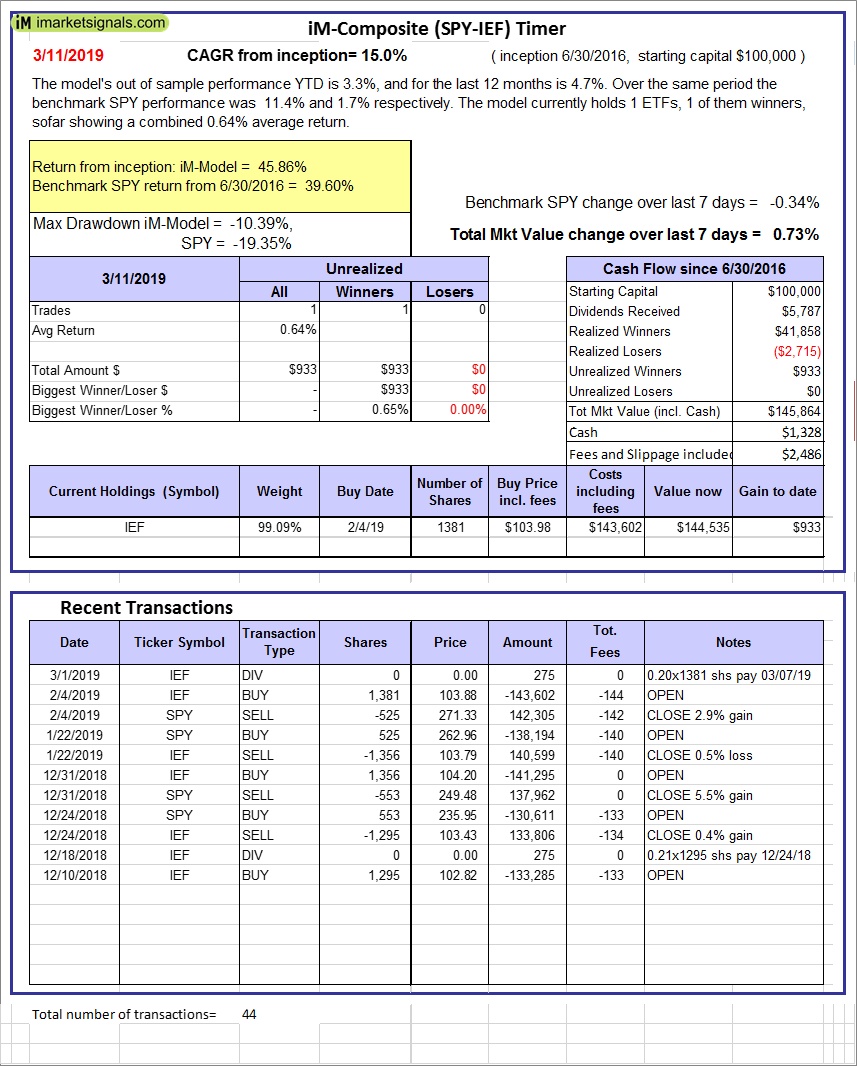 |
iM-Composite (SPY-IEF) Timer: The model’s out of sample performance YTD is 3.3%, and for the last 12 months is 4.7%. Over the same period the benchmark SPY performance was 11.4% and 1.7% respectively. Over the previous week the market value of the iM-Composite (SPY-IEF) Timer gained 0.73% at a time when SPY gained -0.34%. A starting capital of $100,000 at inception on 6/30/2016 would have grown to $145,864 which includes $1,328 cash and excludes $2,486 spent on fees and slippage. |
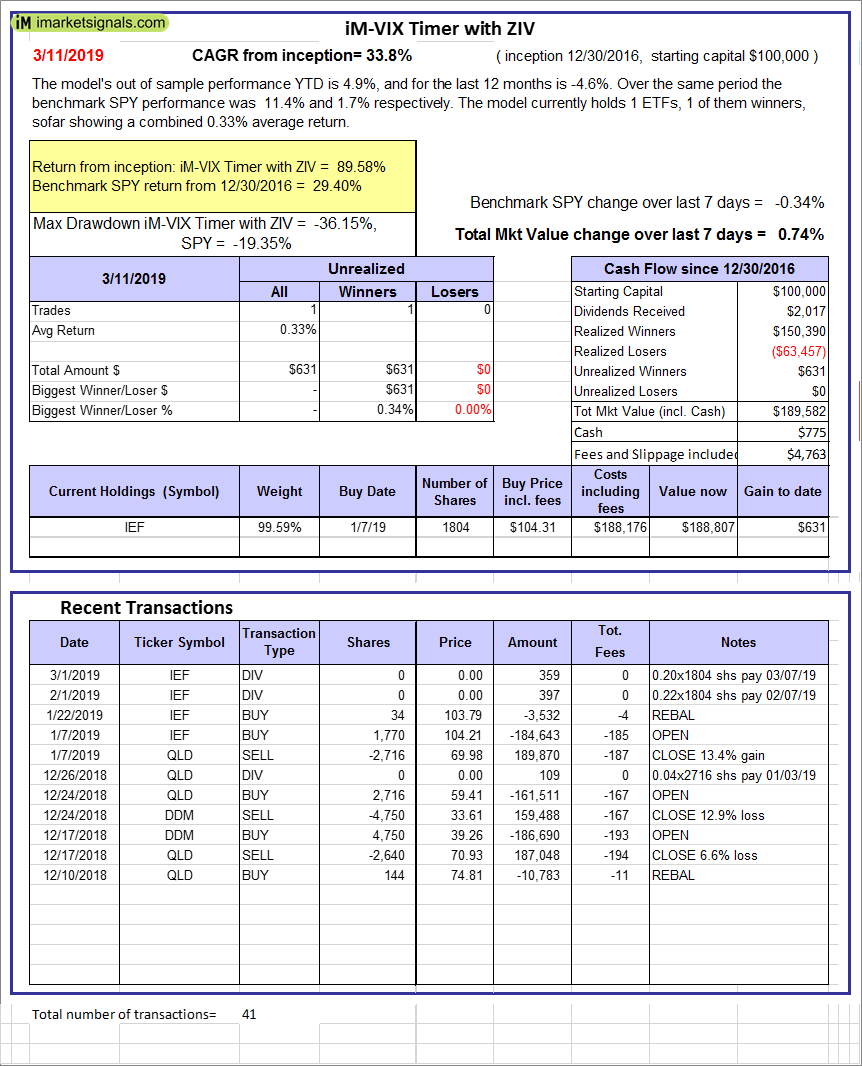 |
iM-VIX Timer with ZIV: The model’s out of sample performance YTD is 4.9%, and for the last 12 months is -4.6%. Over the same period the benchmark SPY performance was 11.4% and 1.7% respectively. Over the previous week the market value of the iM-VIX Timer with ZIV gained 0.74% at a time when SPY gained -0.34%. A starting capital of $100,000 at inception on 6/30/2016 would have grown to $189,582 which includes $775 cash and excludes $4,763 spent on fees and slippage. |
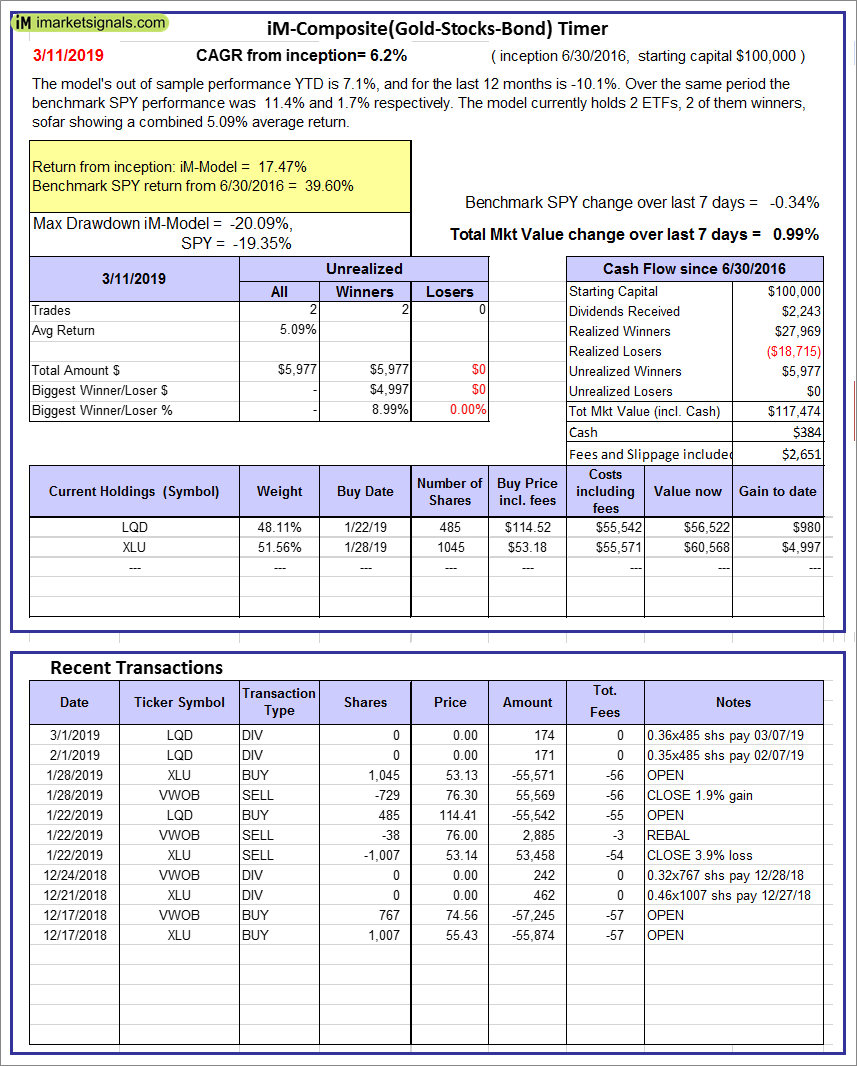 |
iM-Composite(Gold-Stocks-Bond) Timer: The model’s out of sample performance YTD is 7.1%, and for the last 12 months is -10.1%. Over the same period the benchmark SPY performance was 11.4% and 1.7% respectively. Over the previous week the market value of the iM-Composite(Gold-Stocks-Bond) Timer gained 0.99% at a time when SPY gained -0.34%. A starting capital of $100,000 at inception on 6/30/2016 would have grown to $117,474 which includes $384 cash and excludes $2,651 spent on fees and slippage. |
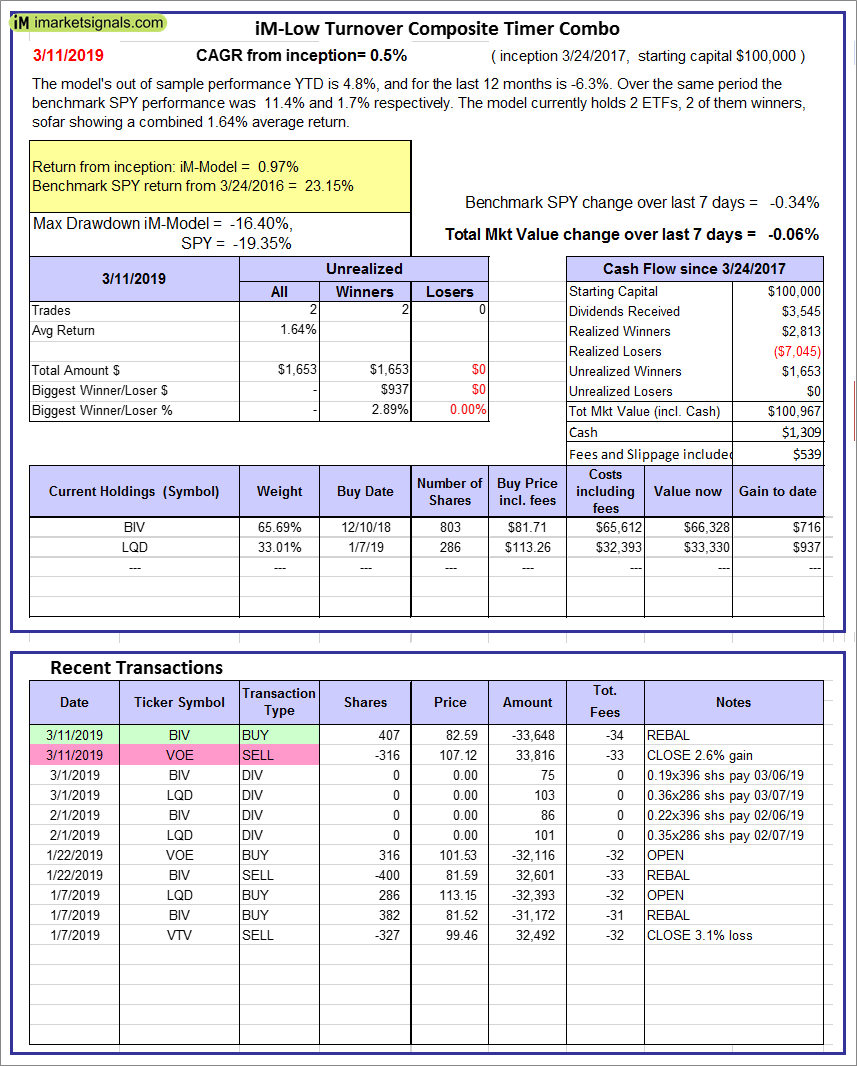 |
iM-Low Turnover Composite Timer Combo: The model’s out of sample performance YTD is 4.8%, and for the last 12 months is -6.3%. Over the same period the benchmark SPY performance was 11.4% and 1.7% respectively. Over the previous week the market value of the iM-Low Turnover Composite Timer Combo gained -0.06% at a time when SPY gained -0.34%. A starting capital of $100,000 at inception on 3/24/27 would have grown to $100,967 which includes $1,309 cash and excludes $539 spent on fees and slippage. |
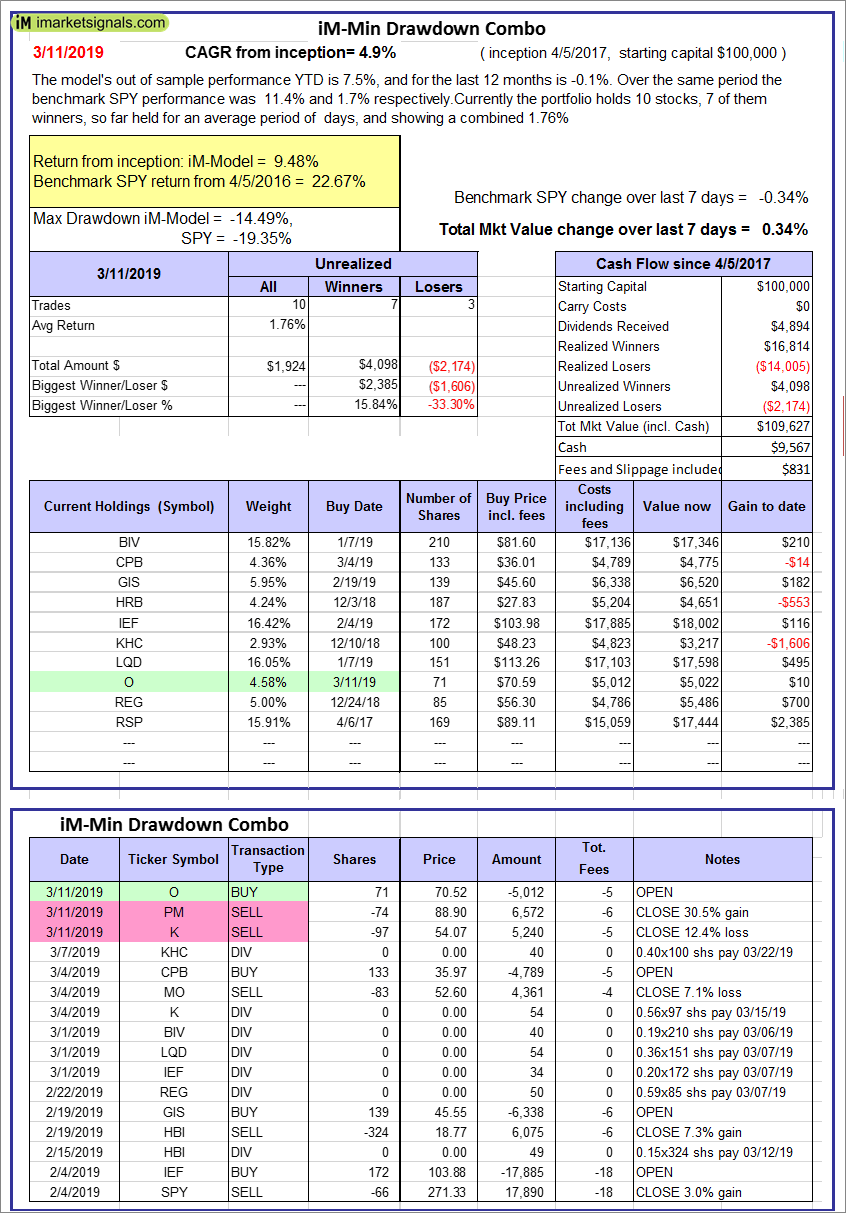 |
iM-Min Drawdown Combo: The model’s out of sample performance YTD is 7.5%, and for the last 12 months is -0.1%. Over the same period the benchmark SPY performance was 11.4% and 1.7% respectively. Over the previous week the market value of the iM-Min Drawdown Combo gained 0.34% at a time when SPY gained -0.34%. A starting capital of $100,000 at inception on 4/5/2017 would have grown to $109,627 which includes $9,567 cash and excludes $831 spent on fees and slippage. |
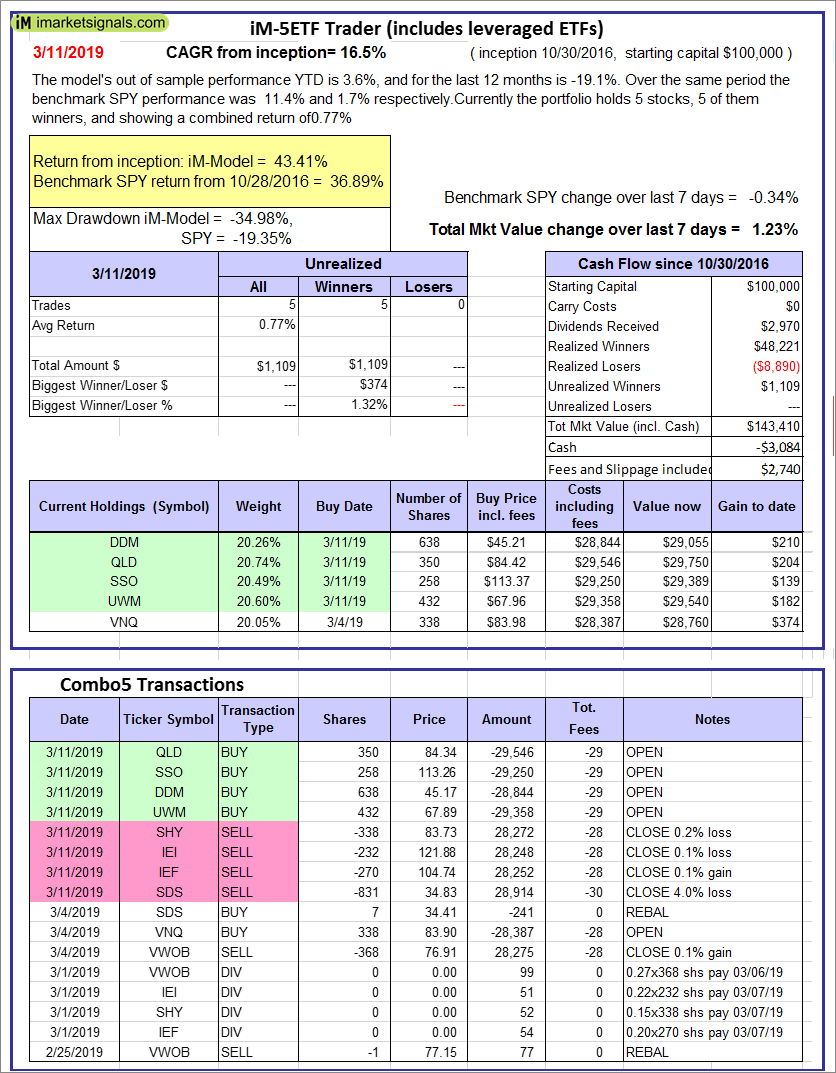 |
iM-5ETF Trader (includes leveraged ETFs): The model’s out of sample performance YTD is 3.6%, and for the last 12 months is -19.1%. Over the same period the benchmark SPY performance was 11.4% and 1.7% respectively. Over the previous week the market value of the iM-5ETF Trader (includes leveraged ETFs) gained 1.23% at a time when SPY gained -0.34%. A starting capital of $100,000 at inception on 10/30/2016 would have grown to $143,410 which includes -$3,084 cash and excludes $2,740 spent on fees and slippage. |
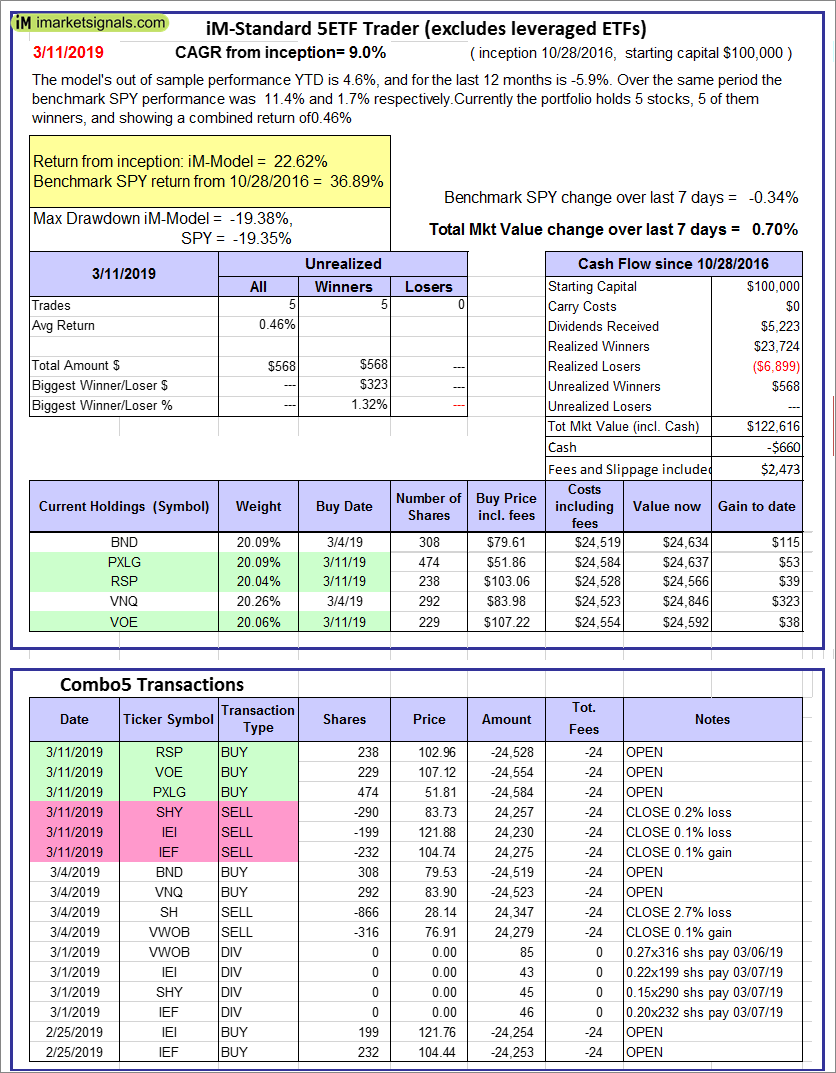 |
iM-Standard 5ETF Trader (excludes leveraged ETFs): The model’s out of sample performance YTD is 4.6%, and for the last 12 months is -5.9%. Over the same period the benchmark SPY performance was 11.4% and 1.7% respectively. Over the previous week the market value of the iM-Standard 5ETF Trader (excludes leveraged ETFs) gained 0.70% at a time when SPY gained -0.34%. A starting capital of $100,000 at inception on 10/30/2016 would have grown to $122,616 which includes -$660 cash and excludes $2,473 spent on fees and slippage. |
Posted in pmp SPY-SH

With reference to Section 202(a)(11)(D) of the Investment Advisers Act:
We are Engineers and not Investment Advisers,
read more ...
By the mere act of reading this page and navigating this site you acknowledge, agree to, and abide by the
Terms of Use / Disclaimer