  |
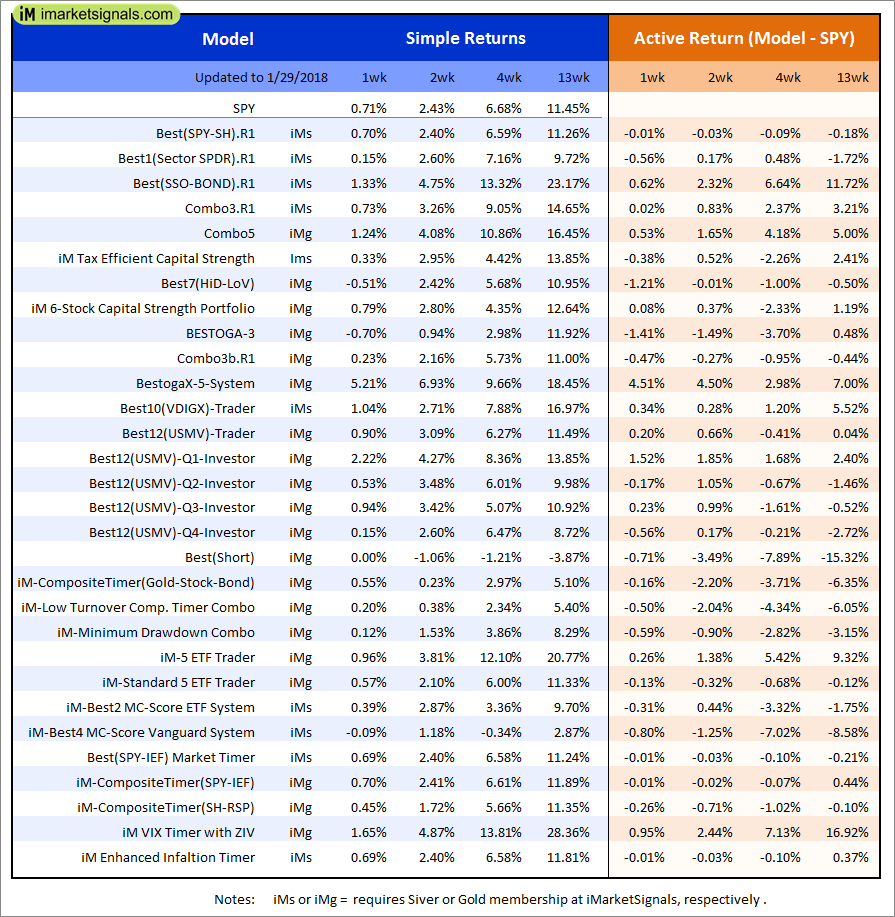
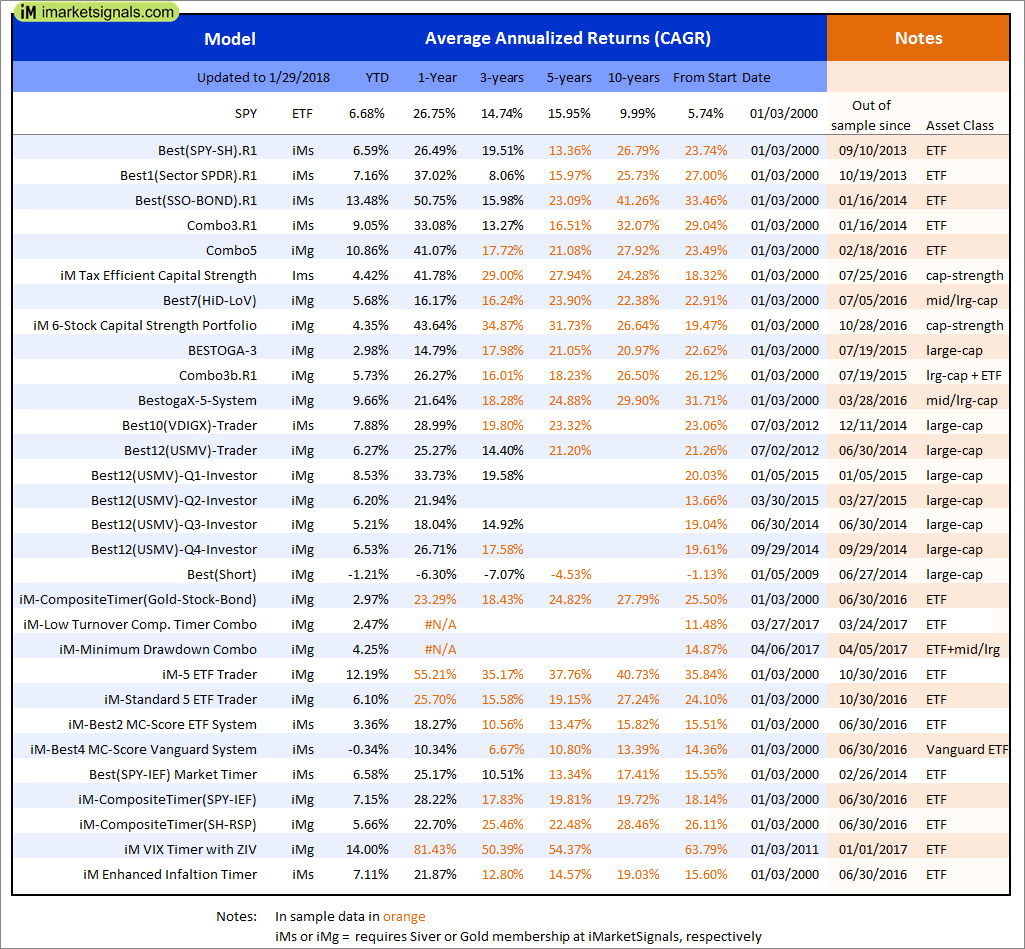
Out of sample performance summary of our models for the past 1, 2, 4 and 13 week periods. The active active return indicates how the models over- or underperformed the benchmark ETF SPY. Also the YTD, and the 1-, 3-, 5- and 10-year annualized returns are shown in the second table |
|
|
iM-Best(SPY-SH).R1: The model’s out of sample performance YTD is 6.6%, and for the last 12 months is 27.2%. Over the same period the benchmark SPY performance was 6.7% and 26.7% respectively. Over the previous week the market value of Best(SPY-SH) gained 0.69% at a time when SPY gained 0.70%. A starting capital of $100,000 at inception on 1/2/2009 would have grown to $599,356 which includes $7,222 cash and excludes $15,358 spent on fees and slippage. |
|
|
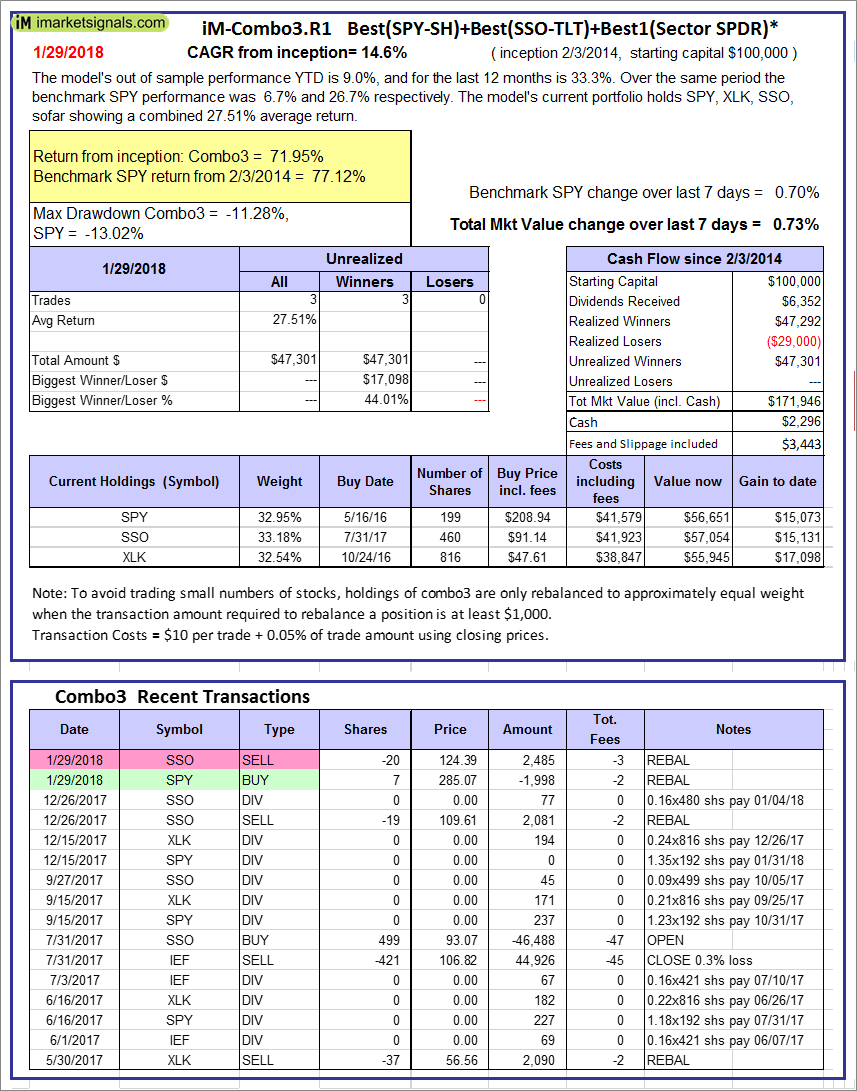
iM-Combo3.R1: The model’s out of sample performance YTD is 9.0%, and for the last 12 months is 33.3%. Over the same period the benchmark SPY performance was 6.7% and 26.7% respectively. Over the previous week the market value of iM-Combo3.R1 gained 0.73% at a time when SPY gained 0.70%. A starting capital of $100,000 at inception on 2/3/2014 would have grown to $171,946 which includes $2,296 cash and excludes $3,443 spent on fees and slippage. |
|
|
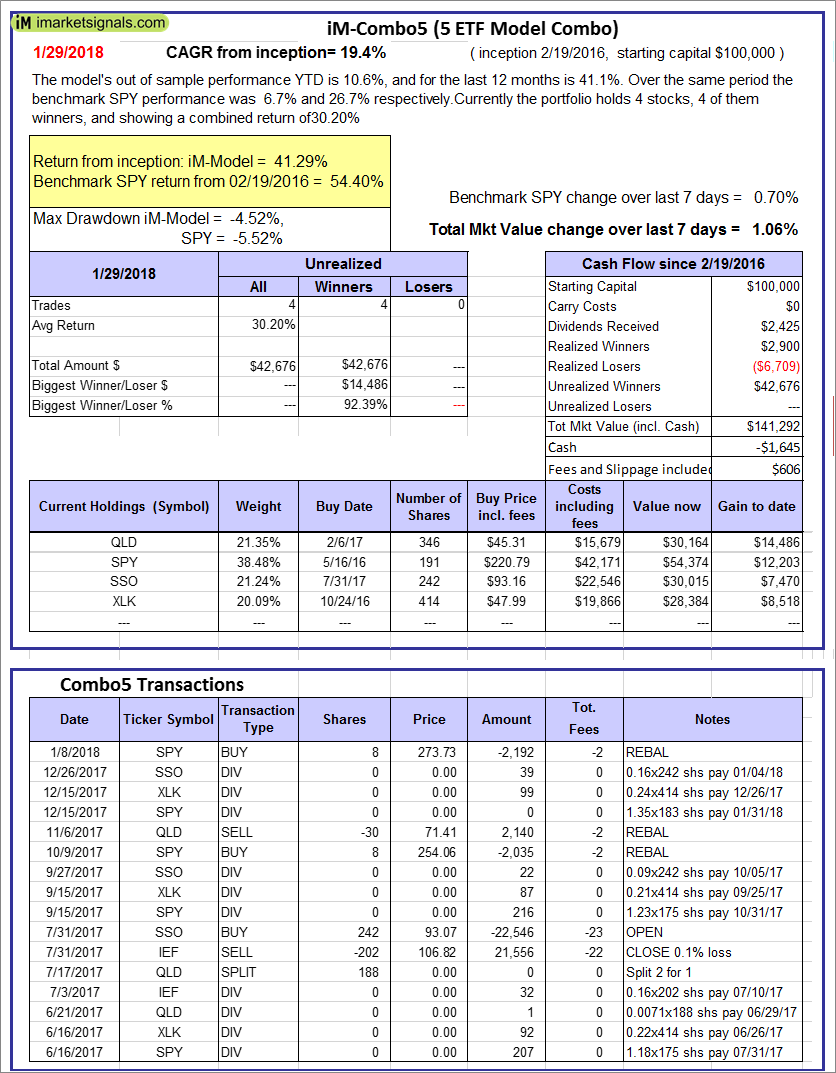
iM-Combo5: The model’s out of sample performance YTD is 10.6%, and for the last 12 months is 41.1%. Over the same period the benchmark SPY performance was 6.7% and 26.7% respectively. Over the previous week the market value of iM-Combo5 gained 1.06% at a time when SPY gained 0.70%. A starting capital of $100,000 at inception on 2/22/2016 would have grown to $141,292 which includes -$1,645 cash and excludes $606 spent on fees and slippage. |
|
|
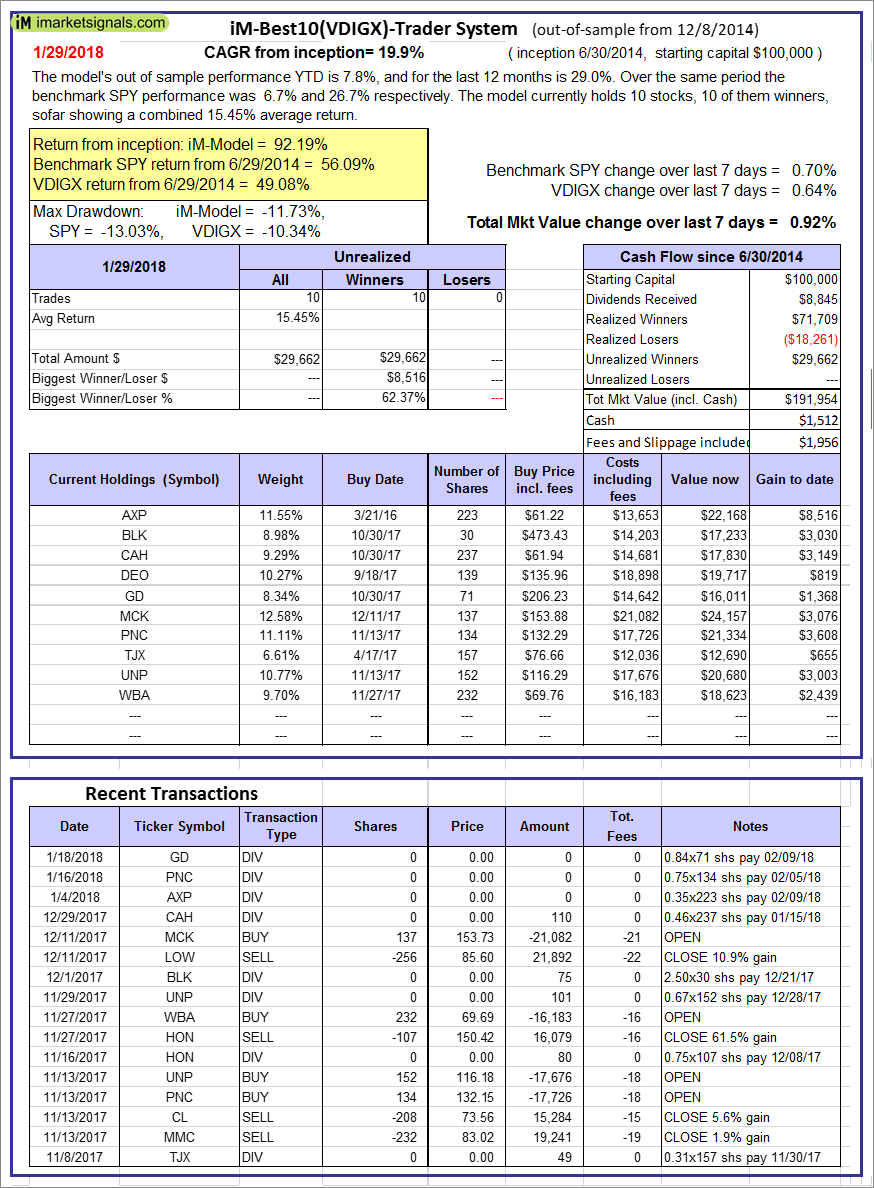
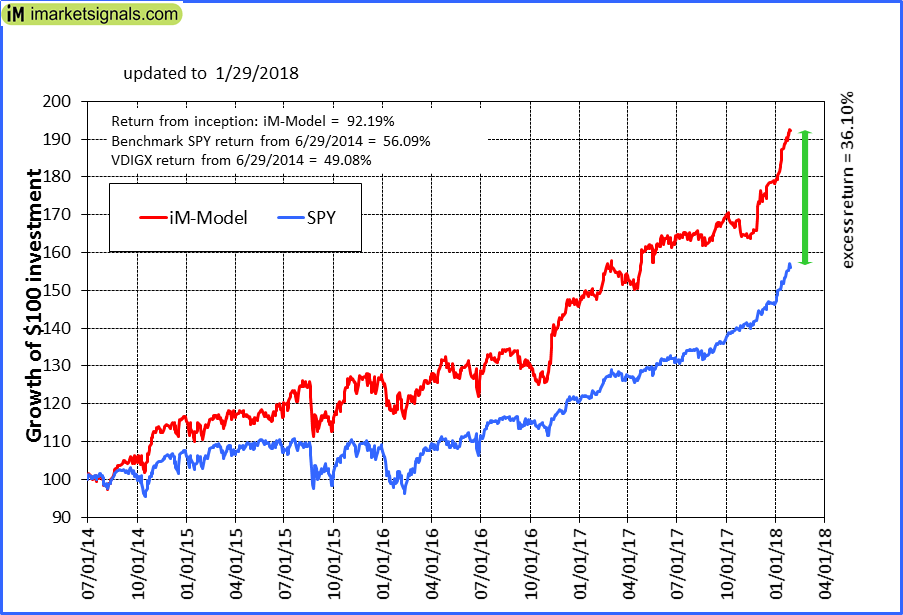
iM-Best10(VDIGX)-Trader: The model’s out of sample performance YTD is 7.8%, and for the last 12 months is 29.0%. Over the same period the benchmark SPY performance was 6.7% and 26.7% respectively. Since inception, on 7/1/2014, the model gained 92.19% while the benchmark SPY gained 56.09% and VDIGX gained 49.08% over the same period. Over the previous week the market value of iM-Best10(VDIGX) gained 0.92% at a time when SPY gained 0.70%. A starting capital of $100,000 at inception on 7/1/2014 would have grown to $191,954 which includes $1,512 cash and excludes $1,956 spent on fees and slippage. |
|
|
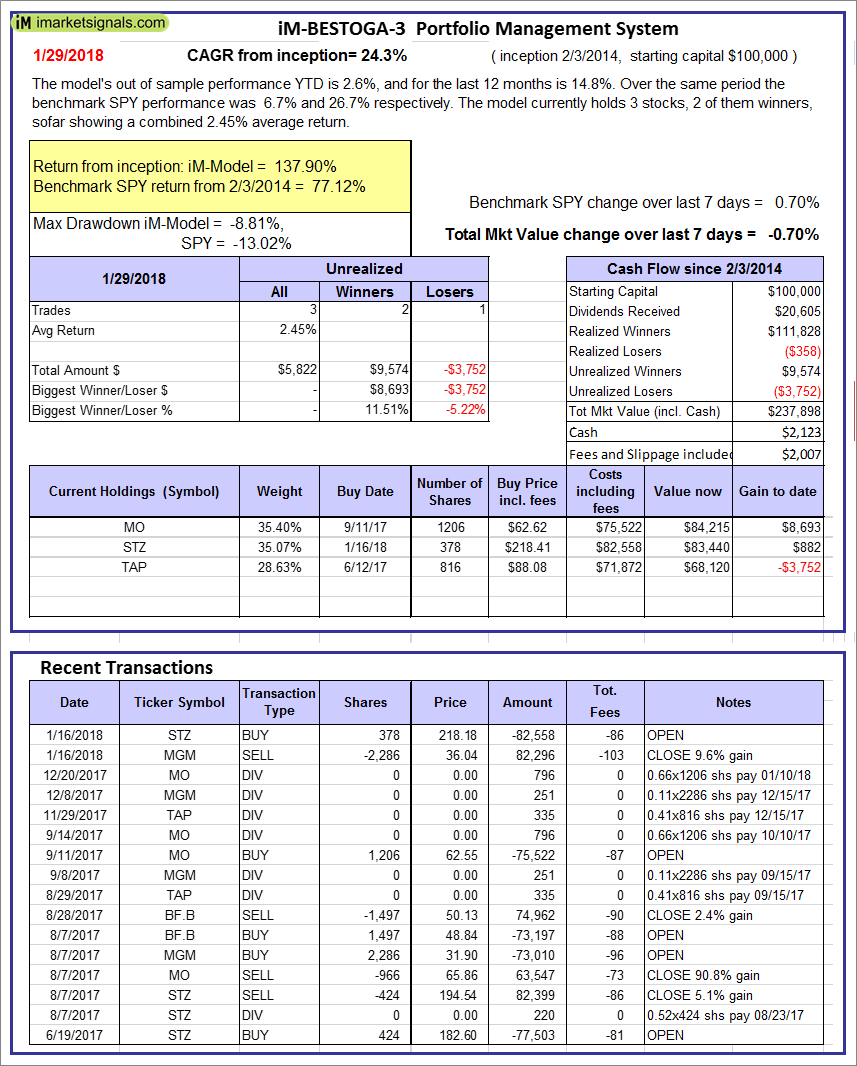
iM-BESTOGA-3: The model’s out of sample performance YTD is 2.6%, and for the last 12 months is 14.8%. Over the same period the benchmark SPY performance was 6.7% and 26.7% respectively. Over the previous week the market value of iM-BESTOGA-3 gained -0.70% at a time when SPY gained 0.70%. A starting capital of $100,000 at inception on 2/3/2014 would have grown to $237,898 which includes $2,123 cash and excludes $2,007 spent on fees and slippage. |
|
|
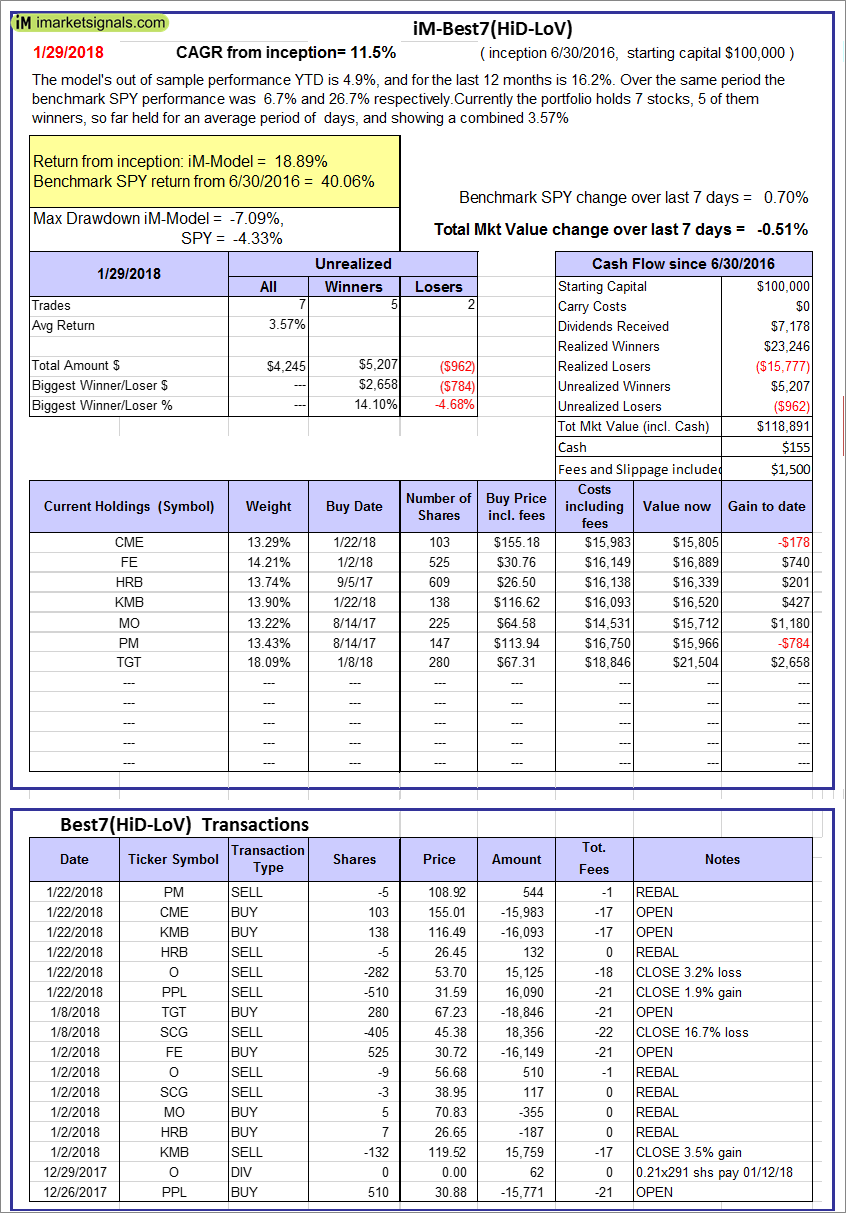
iM-Best7(HiD-LoV): The model’s out of sample performance YTD is 4.9%, and for the last 12 months is 16.2%. Over the same period the benchmark SPY performance was 6.7% and 26.7% respectively. Over the previous week the market value of iM-BESTOGA-3 gained -0.51% at a time when SPY gained 0.70%. A starting capital of $100,000 at inception on 6/30/2016 would have grown to $118,891 which includes $155 cash and excludes $1,500 spent on fees and slippage. |
|
|
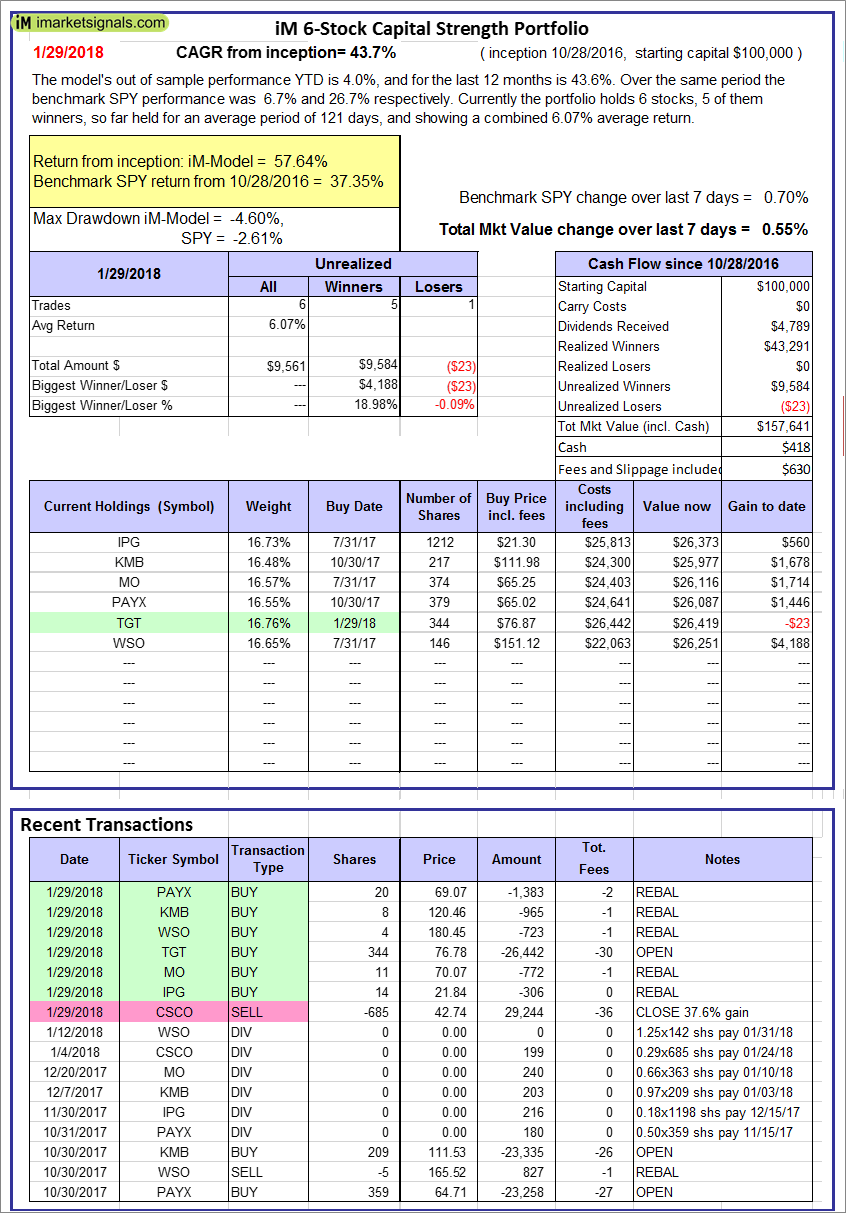
iM 6-Stock Capital Strength Portfolio: The model’s out of sample performance YTD is 4.0%, and for the last 12 months is 43.6%. Over the same period the benchmark SPY performance was 6.7% and 26.7% respectively. Over the previous week the market value of the iM 6-Stock Capital Strength Portfolio gained 0.55% at a time when SPY gained 0.70%. A starting capital of $100,000 at inception on 10/28/2016 would have grown to $157,641 which includes $418 cash and excludes $630 spent on fees and slippage. |
|
|
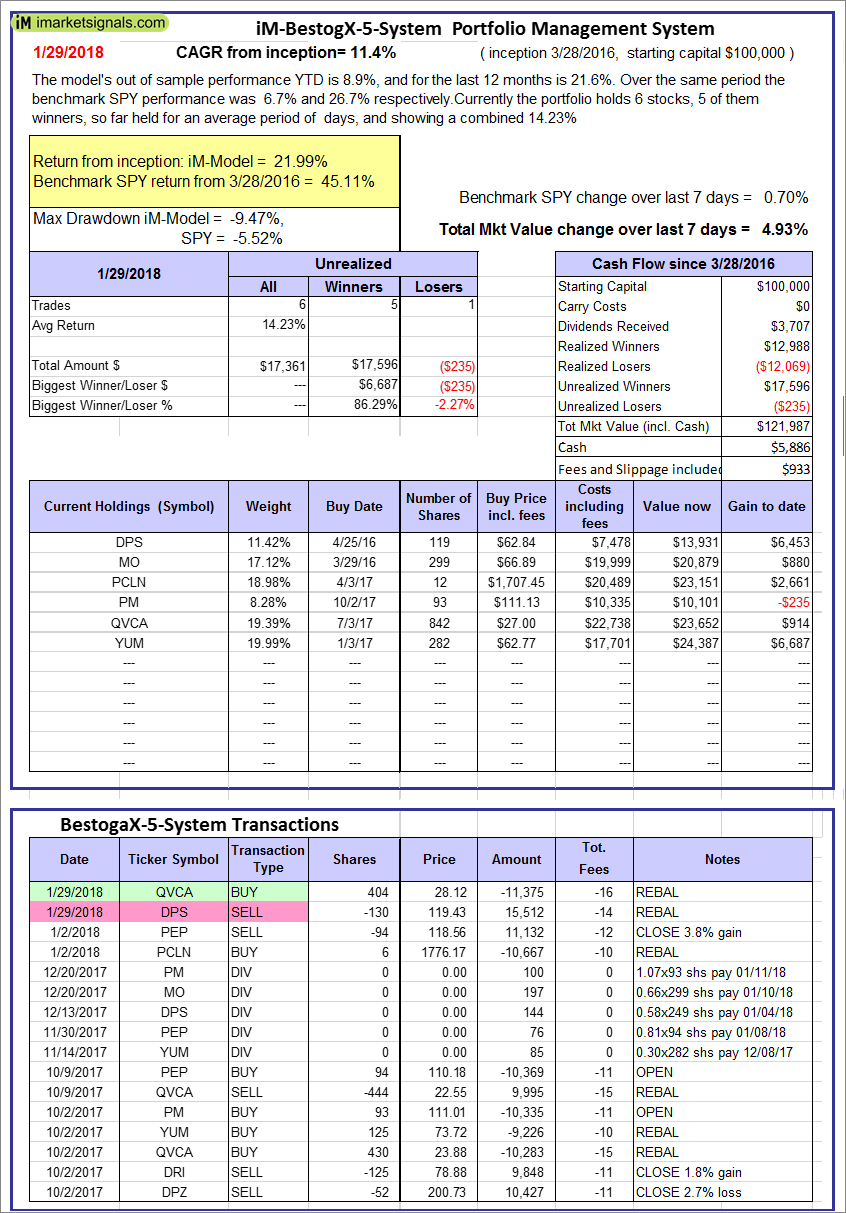
iM-BestogaX5-System: The model’s out of sample performance YTD is 8.9%, and for the last 12 months is 21.6%. Over the same period the benchmark SPY performance was 6.7% and 26.7% respectively. Over the previous week the market value of iM-BestogaX5-System gained 4.93% at a time when SPY gained 0.70%. A starting capital of $100,000 at inception on 3/28/2016 would have grown to $121,987 which includes $5,886 cash and excludes $933 spent on fees and slippage. |
|
|
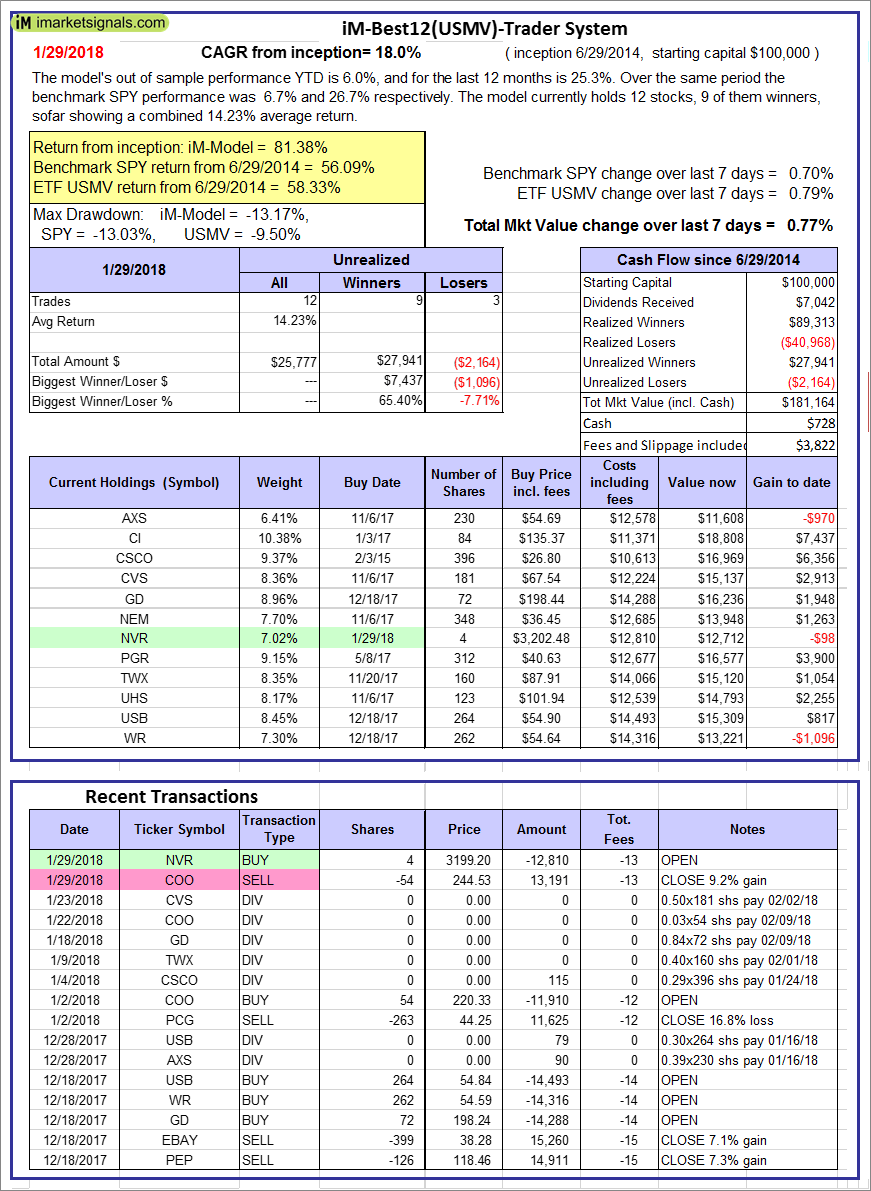
iM-Best12(USMV)-Trader: The model’s out of sample performance YTD is 6.0%, and for the last 12 months is 25.3%. Over the same period the benchmark SPY performance was 6.7% and 26.7% respectively. Since inception, on 6/30/2014, the model gained 81.38% while the benchmark SPY gained 56.09% and the ETF USMV gained 58.33% over the same period. Over the previous week the market value of iM-Best12(USMV)-Trader gained 0.77% at a time when SPY gained 0.70%. A starting capital of $100,000 at inception on 6/30/2014 would have grown to $181,164 which includes $728 cash and excludes $3,822 spent on fees and slippage. |
|
|
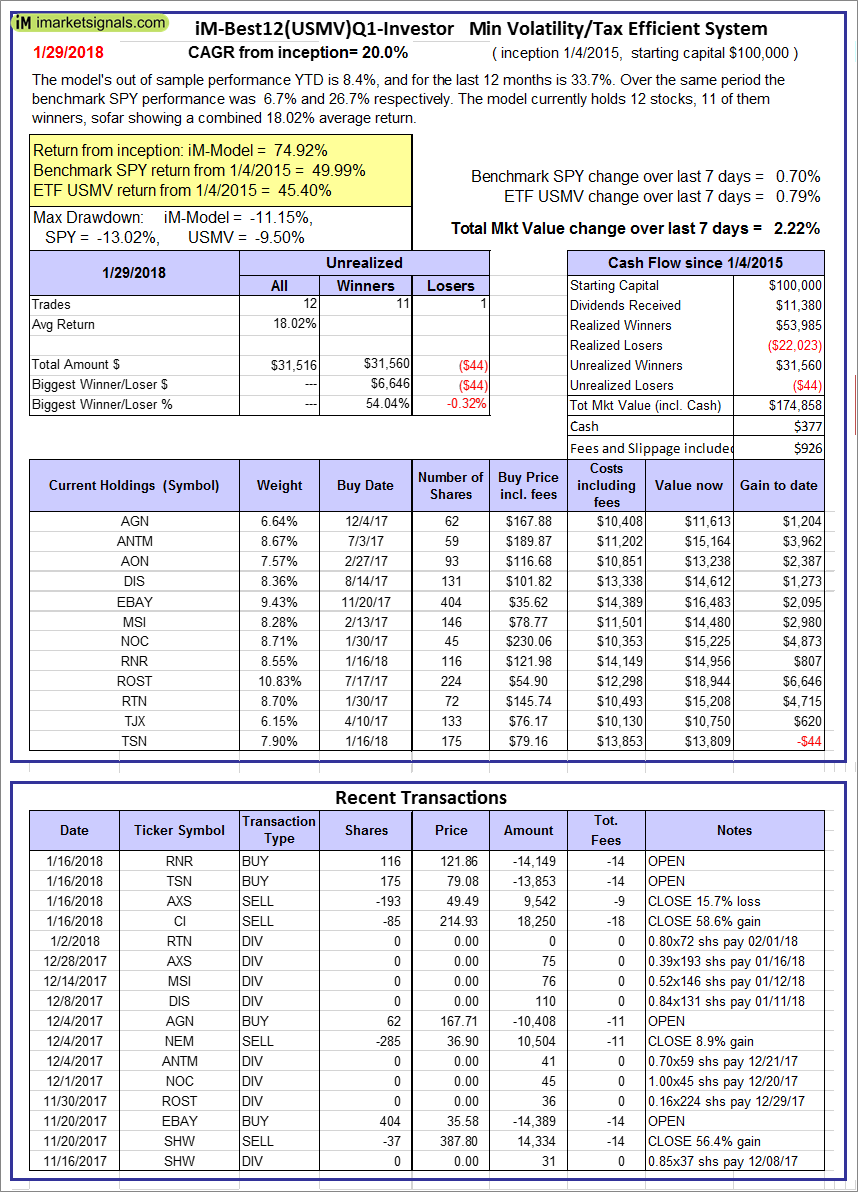
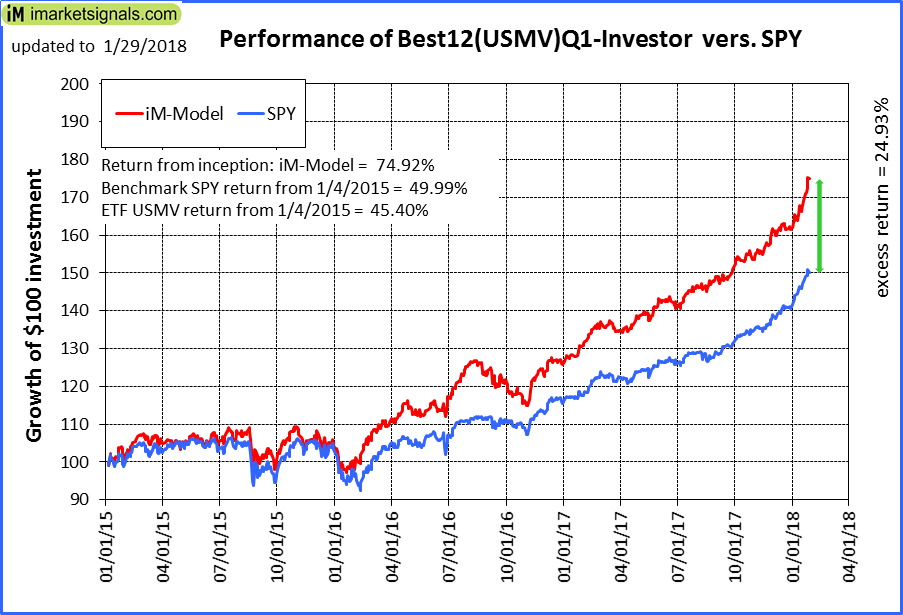
iM-Best12(USMV)Q1-Investor: The model’s out of sample performance YTD is 8.4%, and for the last 12 months is 33.7%. Over the same period the benchmark SPY performance was 6.7% and 26.7% respectively. Since inception, on 1/5/2015, the model gained 74.92% while the benchmark SPY gained 49.99% and the ETF USMV gained 45.40% over the same period. Over the previous week the market value of iM-Best12(USMV)Q1 gained 2.22% at a time when SPY gained 0.70%. A starting capital of $100,000 at inception on 1/5/2015 would have grown to $174,858 which includes $377 cash and excludes $926 spent on fees and slippage. |
|
|
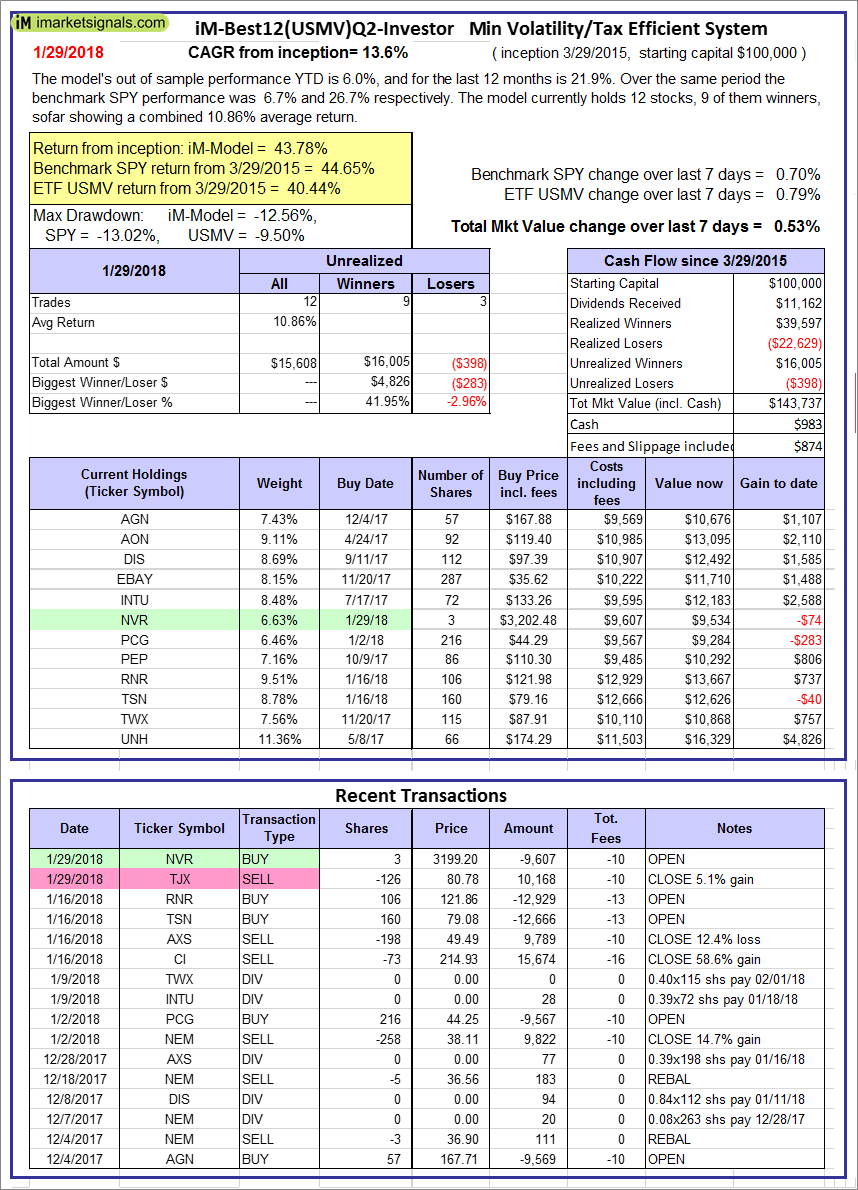
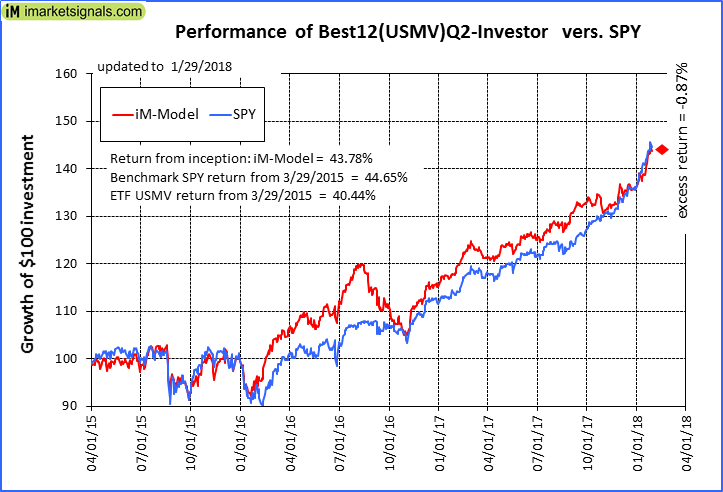
iM-Best12(USMV)Q2-Investor: The model’s out of sample performance YTD is 6.0%, and for the last 12 months is 21.9%. Over the same period the benchmark SPY performance was 6.7% and 26.7% respectively. Since inception, on 3/30/2015, the model gained 43.78% while the benchmark SPY gained 44.65% and the ETF USMV gained 40.44% over the same period. Over the previous week the market value of iM-Best12(USMV)Q2 gained 0.53% at a time when SPY gained 0.70%. A starting capital of $100,000 at inception on 3/30/2015 would have grown to $143,737 which includes $983 cash and excludes $874 spent on fees and slippage. |
|
|
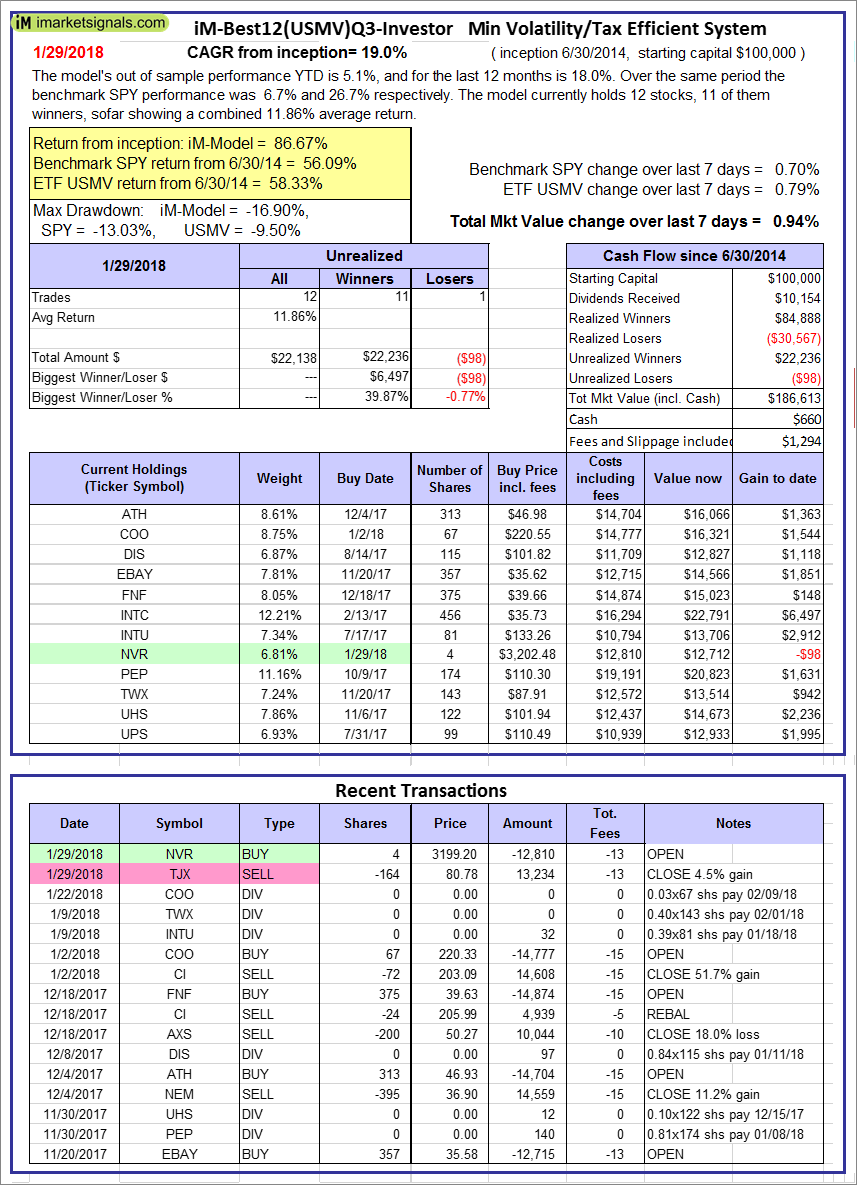
iM-Best12(USMV)Q3-Investor: The model’s out of sample performance YTD is 5.1%, and for the last 12 months is 18.0%. Over the same period the benchmark SPY performance was 6.7% and 26.7% respectively. Since inception, on 7/1/2014, the model gained 86.67% while the benchmark SPY gained 56.09% and the ETF USMV gained 58.33% over the same period. Over the previous week the market value of iM-Best12(USMV)Q3 gained 0.94% at a time when SPY gained 0.70%. A starting capital of $100,000 at inception on 7/1/2014 would have grown to $186,613 which includes $660 cash and excludes $1,294 spent on fees and slippage. |
|
|
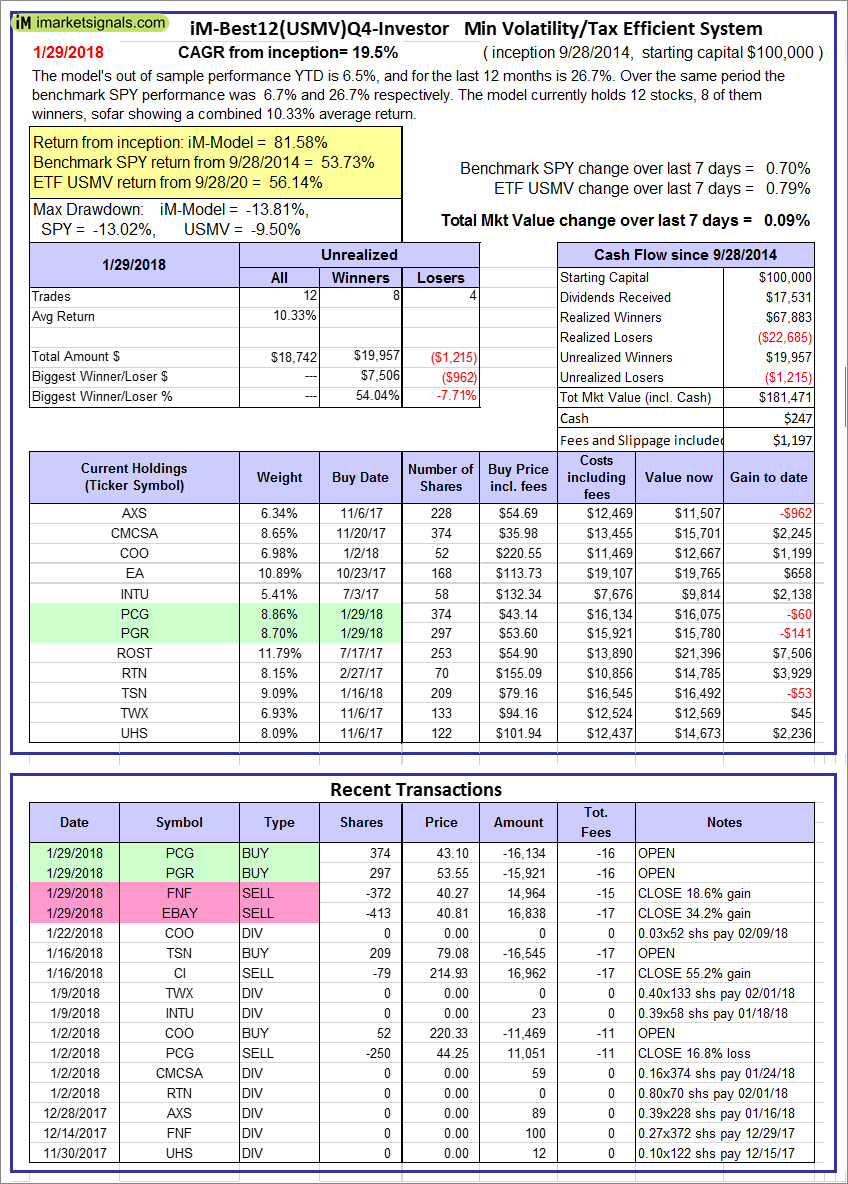
iM-Best12(USMV)Q4-Investor: Since inception, on 9/29/2014, the model gained 81.58% while the benchmark SPY gained 53.73% and the ETF USMV gained 56.14% over the same period. Over the previous week the market value of iM-Best12(USMV)Q4 gained 0.09% at a time when SPY gained 0.70%. A starting capital of $100,000 at inception on 9/29/2014 would have grown to $181,471 which includes $247 cash and excludes $1,197 spent on fees and slippage. |
|
|
Average Performance of iM-Best12(USMV)Q1+Q2+Q3+Q4-Investor resulted in an excess return of 39.60% over SPY. (see iM-USMV Investor Portfolio) |
|
|
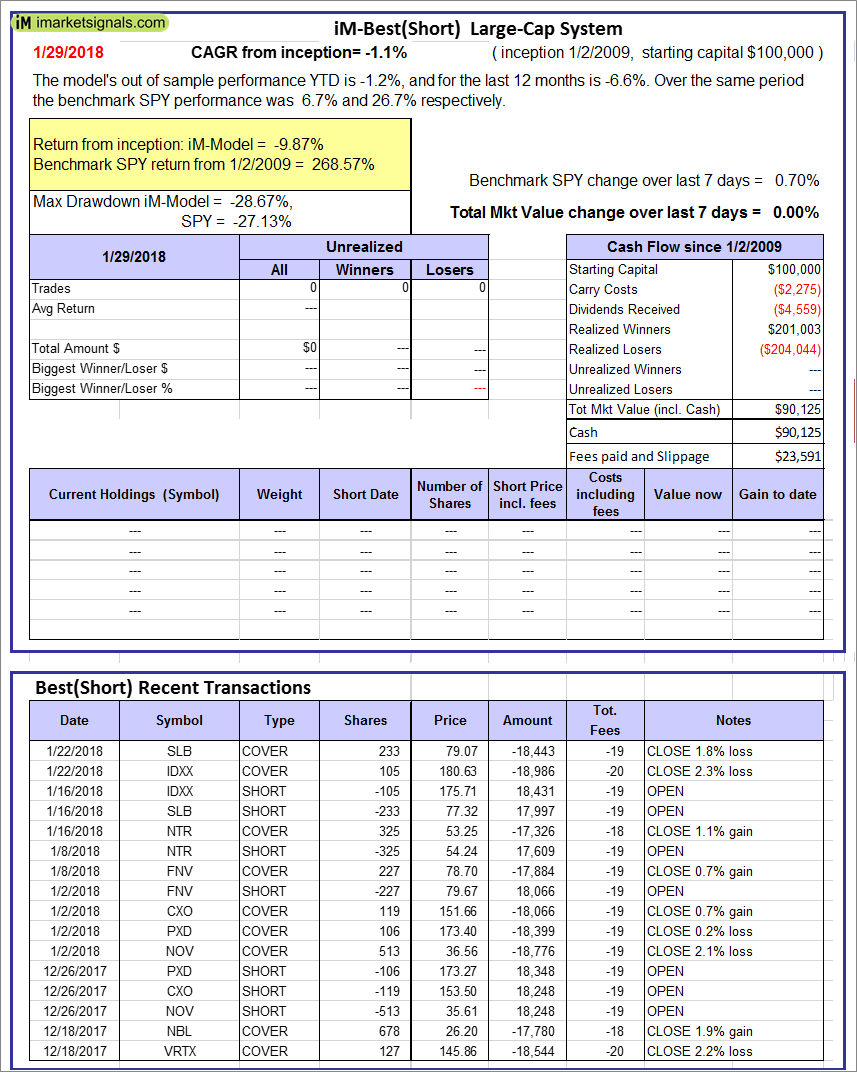
iM-Best(Short): The model’s out of sample performance YTD is -1.2%, and for the last 12 months is -6.6%. Over the same period the benchmark SPY performance was 6.7% and 26.7% respectively. Over the previous week the market value of iM-Best(Short) gained 0.00% at a time when SPY gained 0.70%. Over the period 1/2/2009 to 1/29/2018 the starting capital of $100,000 would have grown to $90,125 which includes $90,125 cash and excludes $23,591 spent on fees and slippage. |
|
|
iM-Best2 MC-Score ETF System: The model’s out of sample performance YTD is 3.4%, and for the last 12 months is 18.3%. Over the same period the benchmark SPY performance was 6.7% and 26.7% respectively. Over the previous week the market value of the iM-Best2 MC-Score ETF System gained 0.39% at a time when SPY gained 0.70%. A starting capital of $100,000 at inception on 6/30/2016 would have grown to $116,151 which includes $743 cash and excludes $115 spent on fees and slippage. |
|
|
iM-Best4 MC-Score Vanguard System: The model’s out of sample performance YTD is -0.3%, and for the last 12 months is 10.3%. Over the same period the benchmark SPY performance was 6.7% and 26.7% respectively. Over the previous week the market value of the iM-Best4 MC-Score Vanguard System gained -0.09% at a time when SPY gained 0.70%. A starting capital of $100,000 at inception on 6/30/2016 would have grown to $110,476 which includes $3,320 cash and excludes $00 spent on fees and slippage. |
|
|
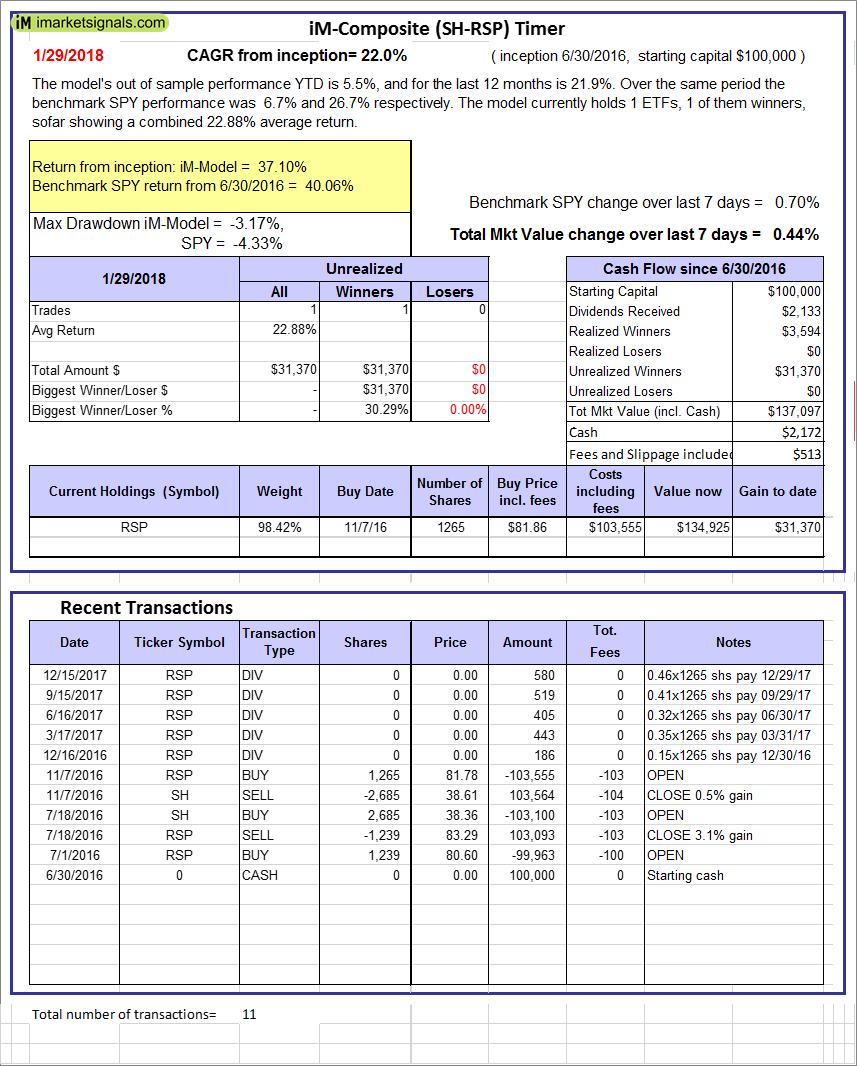
iM-Composite (SH-RSP) Timer: The model’s out of sample performance YTD is 5.5%, and for the last 12 months is 21.9%. Over the same period the benchmark SPY performance was 6.7% and 26.7% respectively. Over the previous week the market value of the iM-Composite (SH-RSP) Timer gained 0.44% at a time when SPY gained 0.70%. A starting capital of $100,000 at inception on 6/30/2016 would have grown to $137,097 which includes $2,172 cash and excludes $513 spent on fees and slippage. |
|
|
iM-Composite (SPY-IEF) Timer: The model’s out of sample performance YTD is 6.6%, and for the last 12 months is 28.9%. Over the same period the benchmark SPY performance was 6.7% and 26.7% respectively. Over the previous week the market value of the iM-Composite (SPY-IEF) Timer gained 0.70% at a time when SPY gained 0.70%. A starting capital of $100,000 at inception on 6/30/2016 would have grown to $141,465 which includes $833 cash and excludes $1,390 spent on fees and slippage. |
|
|
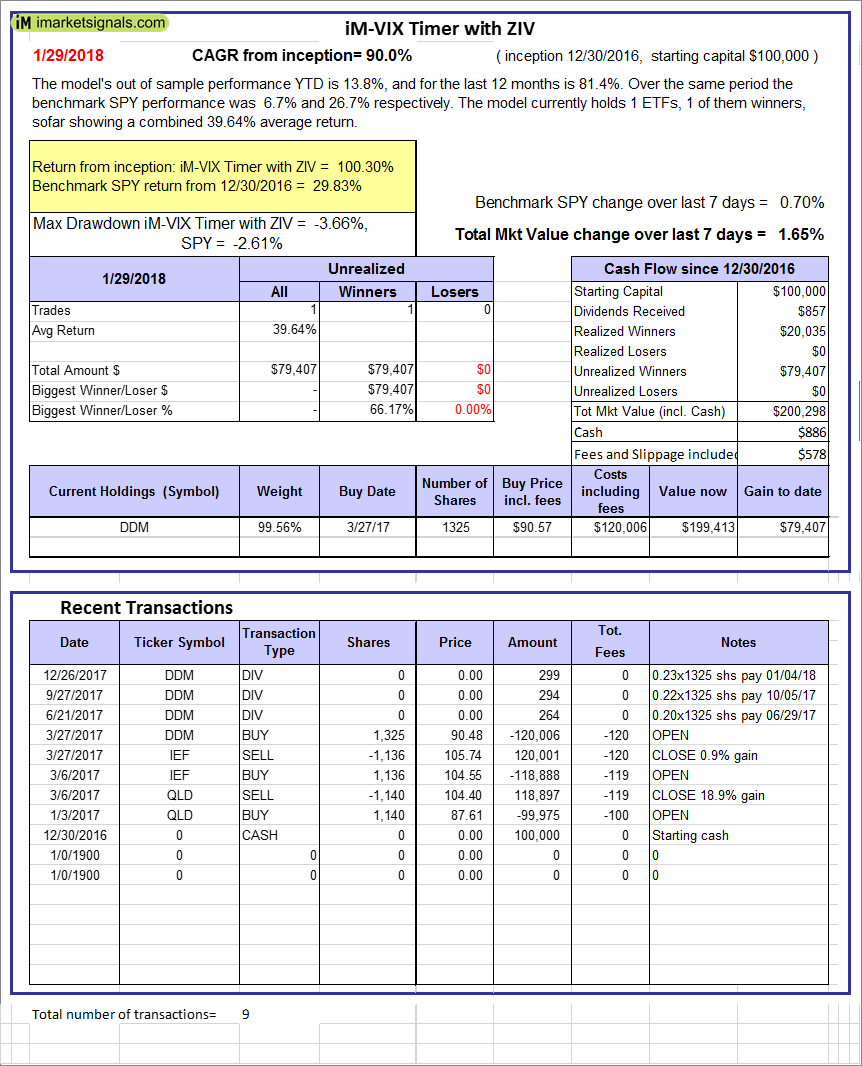
iM-VIX Timer with ZIV: The model’s out of sample performance YTD is 13.8%, and for the last 12 months is 81.4%. Over the same period the benchmark SPY performance was 6.7% and 26.7% respectively. Over the previous week the market value of the iM-VIX Timer with ZIV gained 1.65% at a time when SPY gained 0.70%. A starting capital of $100,000 at inception on 6/30/2016 would have grown to $200,298 which includes $886 cash and excludes $578 spent on fees and slippage. |
|
|
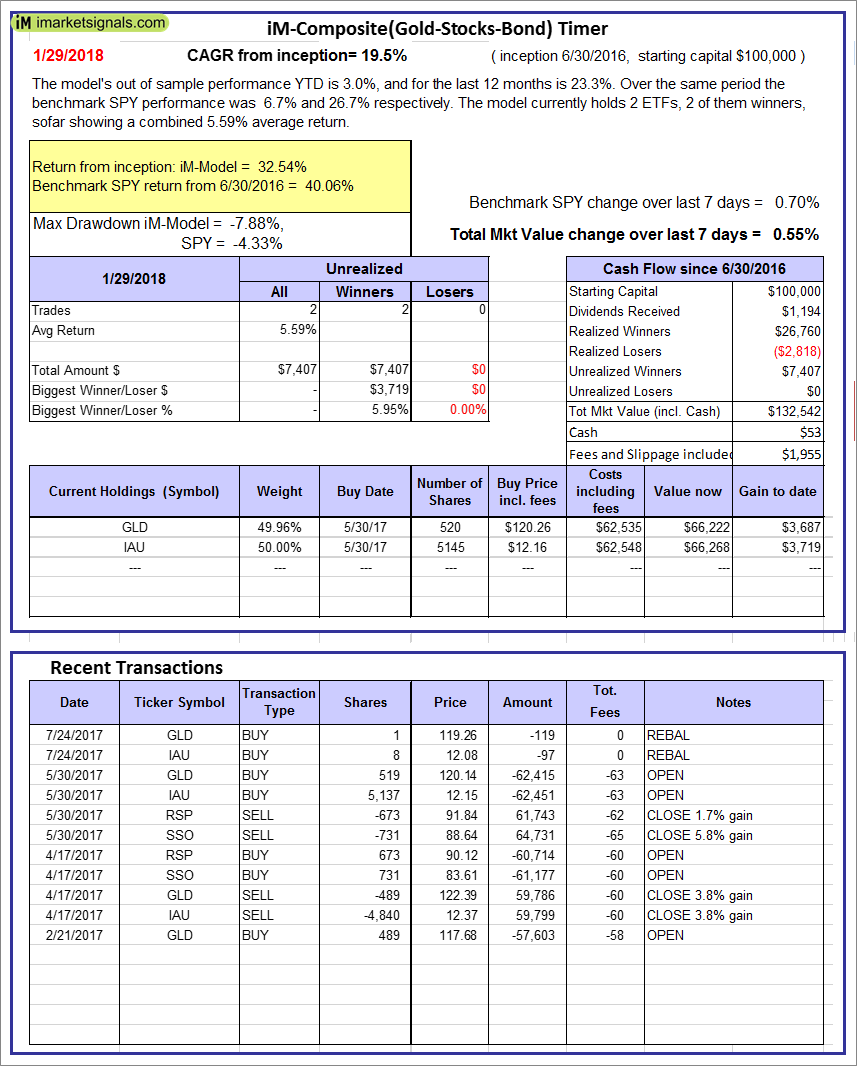
iM-Composite(Gold-Stocks-Bond) Timer: The model’s out of sample performance YTD is 3.0%, and for the last 12 months is 23.3%. Over the same period the benchmark SPY performance was 6.7% and 26.7% respectively. Over the previous week the market value of the iM-Composite(Gold-Stocks-Bond) Timer gained 0.55% at a time when SPY gained 0.70%. A starting capital of $100,000 at inception on 6/30/2016 would have grown to $132,542 which includes $53 cash and excludes $1,955 spent on fees and slippage. |
|
|
iM-Low Turnover Composite Timer Combo: The model’s out of sample performance YTD is 2.3%, and since inception 9.6%. Over the same period the benchmark SPY performance was 6.7% and 23.6% respectively. Over the previous week the market value of the iM-Low Turnover Composite Timer Combo gained 0.20% at a time when SPY gained 0.70%. A starting capital of $100,000 at inception on 3/24/27 would have grown to $109,591 which includes $1,612 cash and excludes $74 spent on fees and slippage. |
|
|
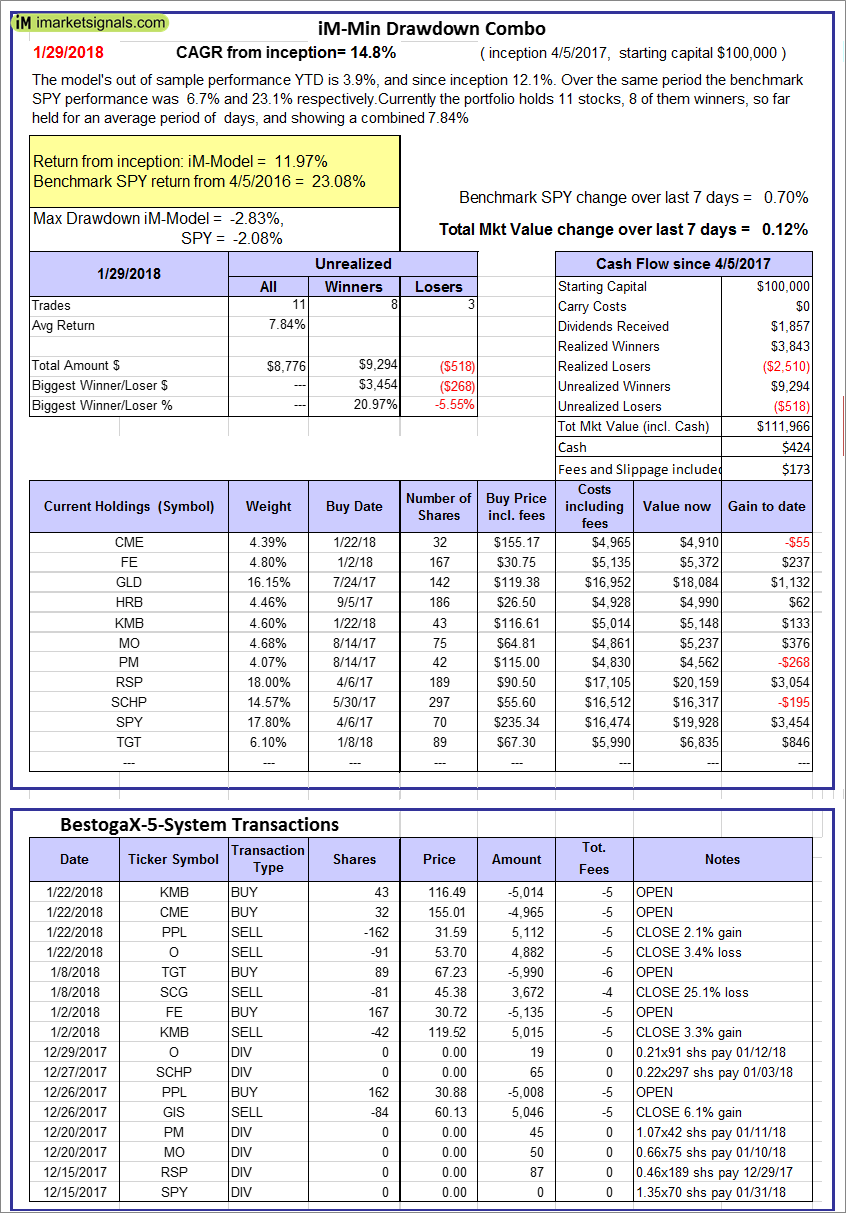
iM-Min Drawdown Combo: The model’s out of sample performance YTD is 3.9%, and since inception 12.1%. Over the same period the benchmark SPY performance was 6.7% and 23.1% respectively. Over the previous week the market value of the iM-Min Drawdown Combo gained 0.12% at a time when SPY gained 0.70%. A starting capital of $100,000 at inception on 4/5/2017 would have grown to $111,966 which includes $424 cash and excludes $173 spent on fees and slippage. |
|
|
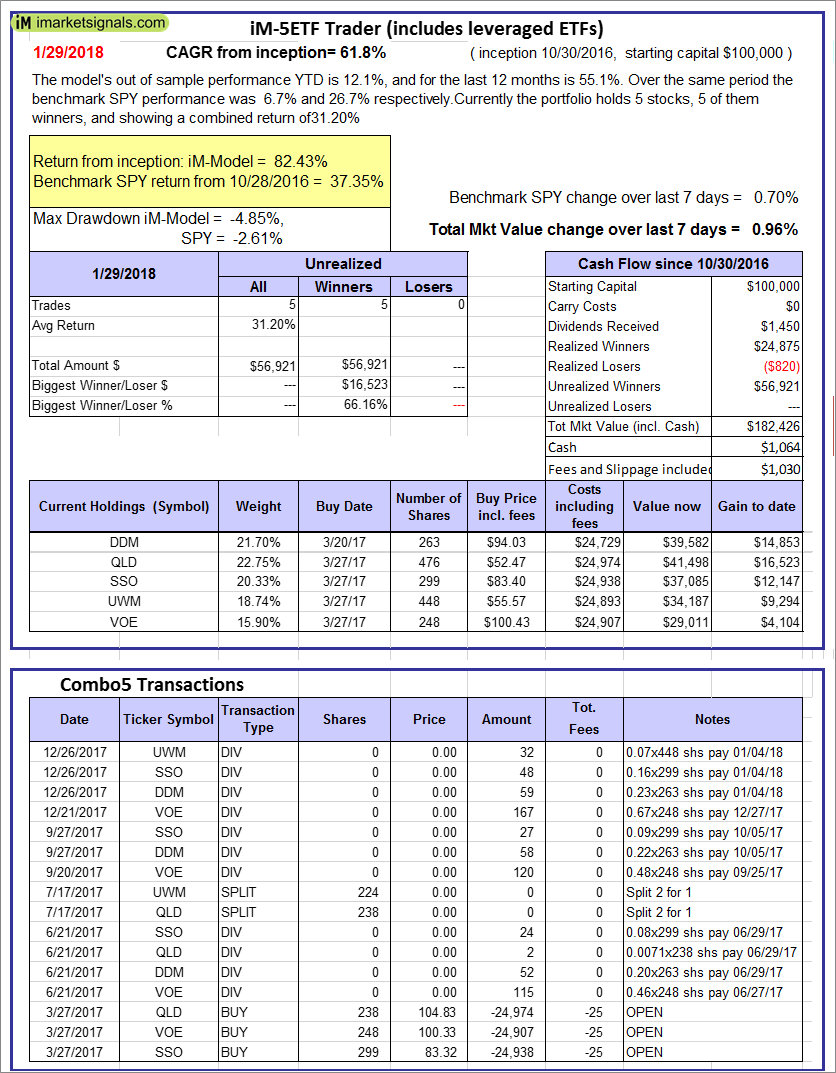
iM-5ETF Trader (includes leveraged ETFs): The model’s out of sample performance YTD is 12.1%, and for the last 12 months is 55.1%. Over the same period the benchmark SPY performance was 6.7% and 26.7% respectively. Over the previous week the market value of the iM-5ETF Trader (includes leveraged ETFs) gained 0.96% at a time when SPY gained 0.70%. A starting capital of $100,000 at inception on 10/30/2016 would have grown to $182,426 which includes $1,064 cash and excludes $1,030 spent on fees and slippage. |
|
|
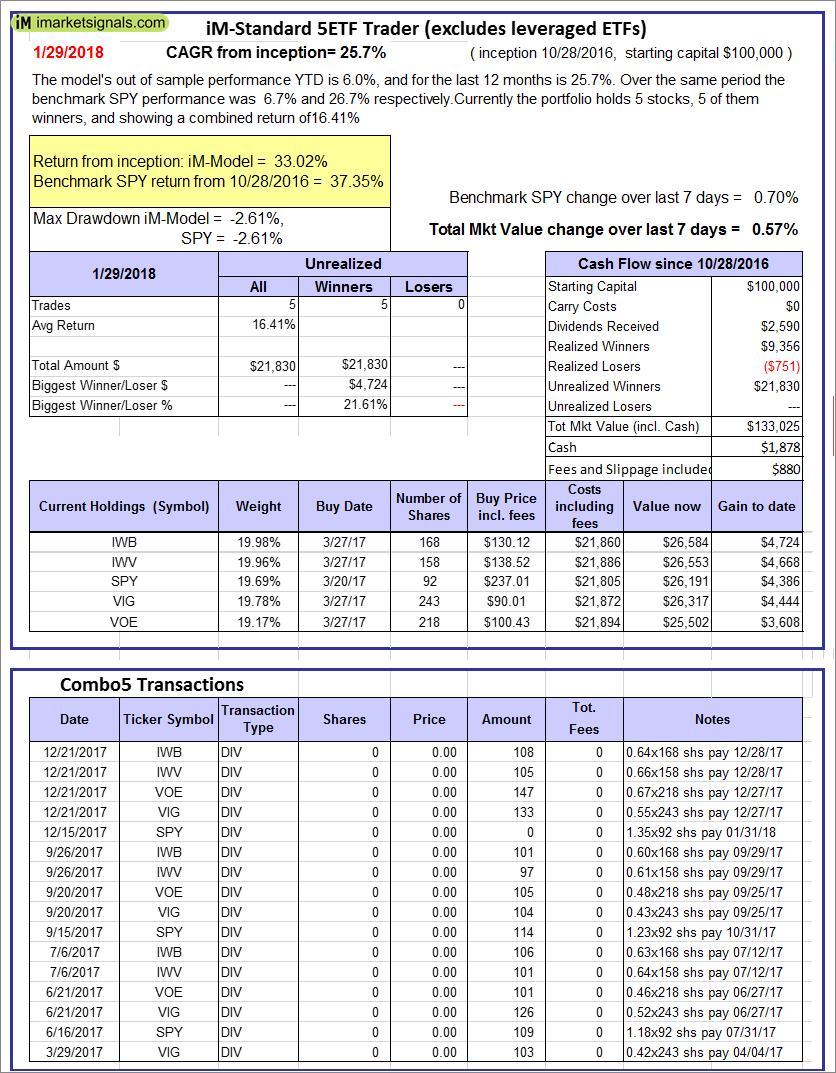
iM-Standard 5ETF Trader (excludes leveraged ETFs): The model’s out of sample performance YTD is 6.0%, and for the last 12 months is 25.7%. Over the same period the benchmark SPY performance was 6.7% and 26.7% respectively. Over the previous week the market value of the iM-Standard 5ETF Trader (excludes leveraged ETFs) gained 0.57% at a time when SPY gained 0.70%. A starting capital of $100,000 at inception on 10/30/2016 would have grown to $133,025 which includes $1,878 cash and excludes $880 spent on fees and slippage. |


Leave a Reply
You must be logged in to post a comment.