
  |
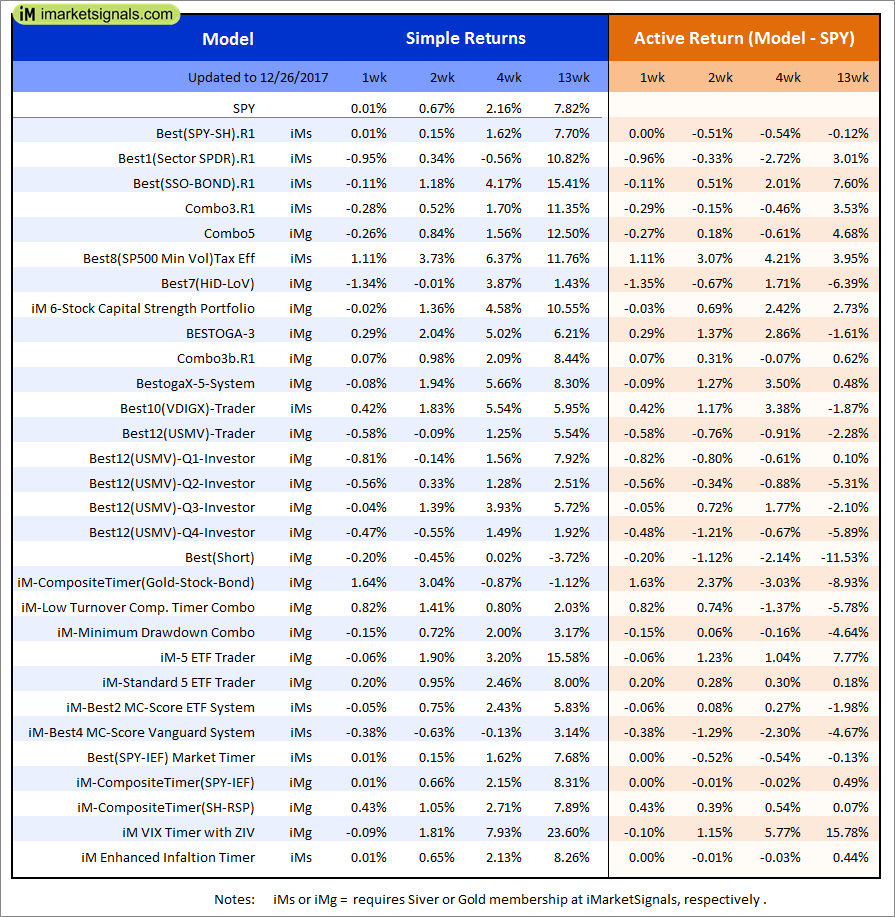
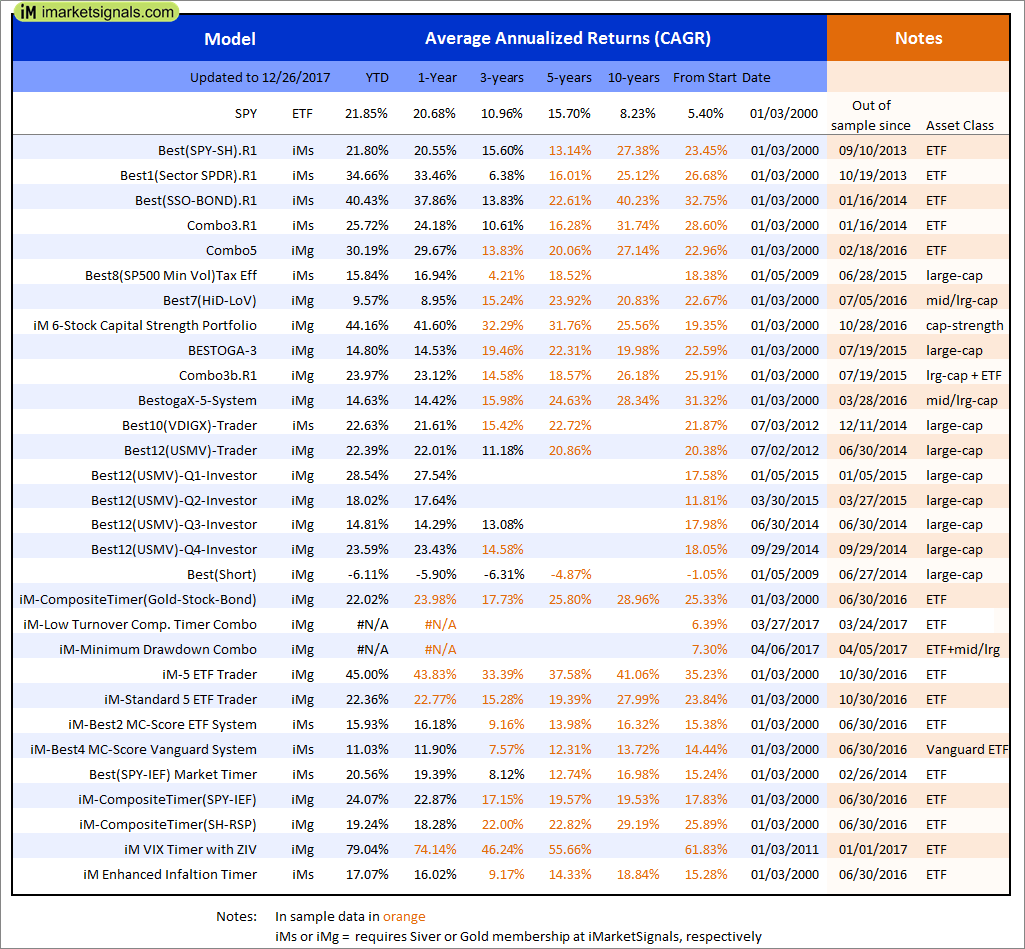
Out of sample performance summary of our models for the past 1, 2, 4 and 13 week periods. The active active return indicates how the models over- or underperformed the benchmark ETF SPY. Also the YTD, and the 1-, 3-, 5- and 10-year annualized returns are shown in the second table |
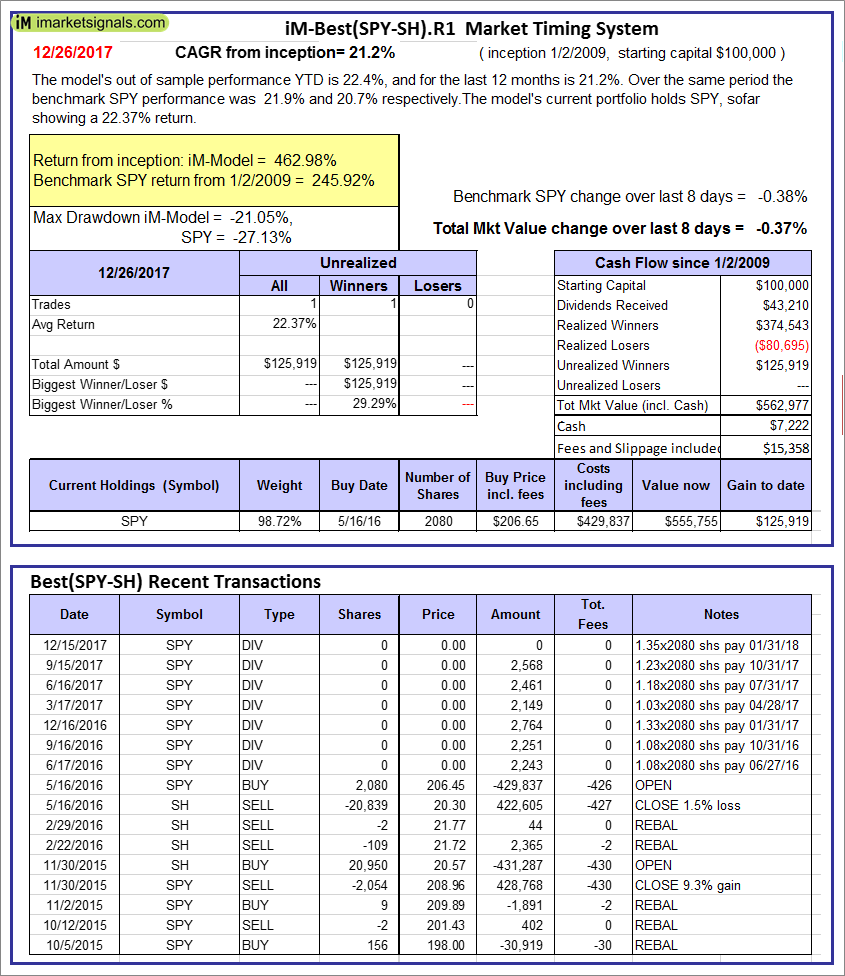 |
iM-Best(SPY-SH).R1: The model’s out of sample performance YTD is 22.4%, and for the last 12 months is 21.2%. Over the same period the benchmark SPY performance was 21.9% and 20.7% respectively. Over the previous week the market value of Best(SPY-SH) gained -0.37% at a time when SPY gained -0.38%. A starting capital of $100,000 at inception on 1/2/2009 would have grown to $562,977 which includes $7,222 cash and excludes $15,358 spent on fees and slippage. |
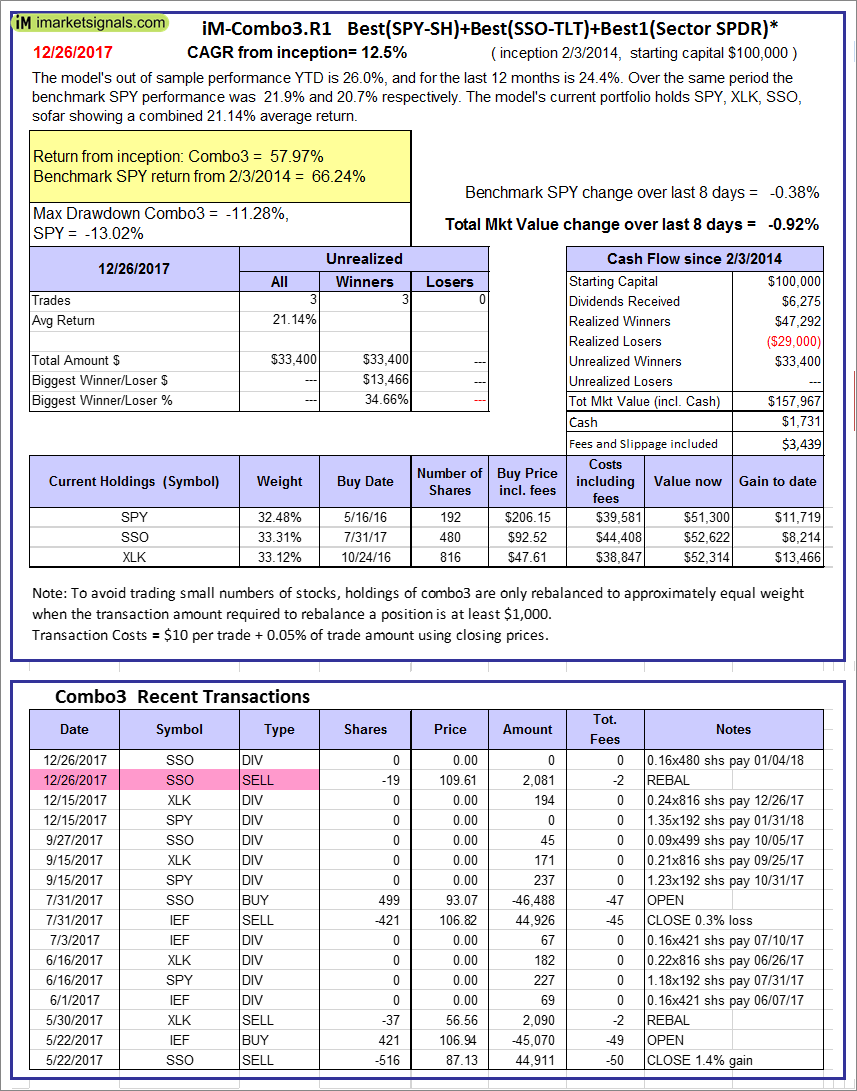 |
iM-Combo3.R1: The model’s out of sample performance YTD is 26.0%, and for the last 12 months is 24.4%. Over the same period the benchmark SPY performance was 21.9% and 20.7% respectively. Over the previous week the market value of iM-Combo3.R1 gained -0.92% at a time when SPY gained -0.38%. A starting capital of $100,000 at inception on 2/3/2014 would have grown to $157,967 which includes $1,731 cash and excludes $3,439 spent on fees and slippage. |
 |
iM-Combo5: The model’s out of sample performance YTD is 30.2%, and for the last 12 months is 29.7%. Over the same period the benchmark SPY performance was 21.9% and 20.7% respectively. Over the previous week the market value of iM-Combo5 gained -1.17% at a time when SPY gained -0.38%. A starting capital of $100,000 at inception on 2/22/2016 would have grown to $128,118 which includes $508 cash and excludes $603 spent on fees and slippage. |
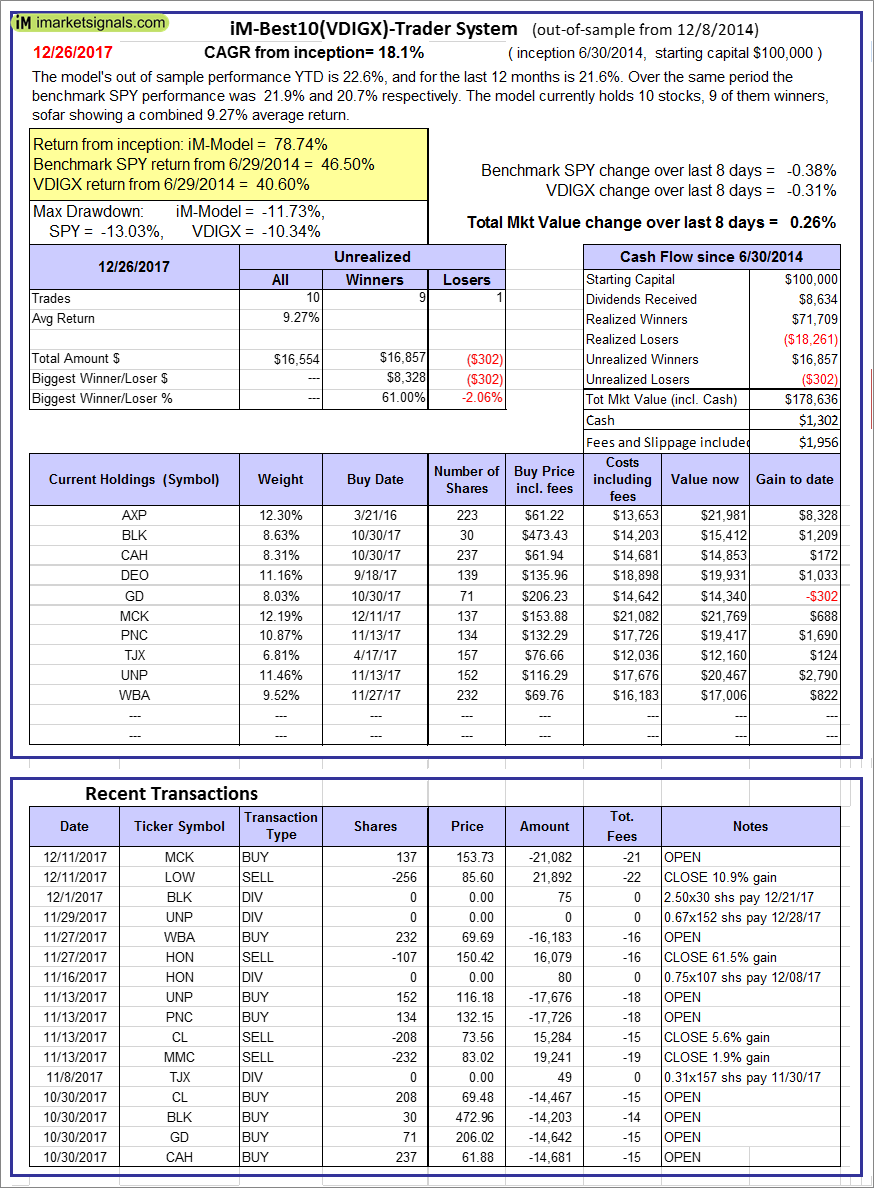 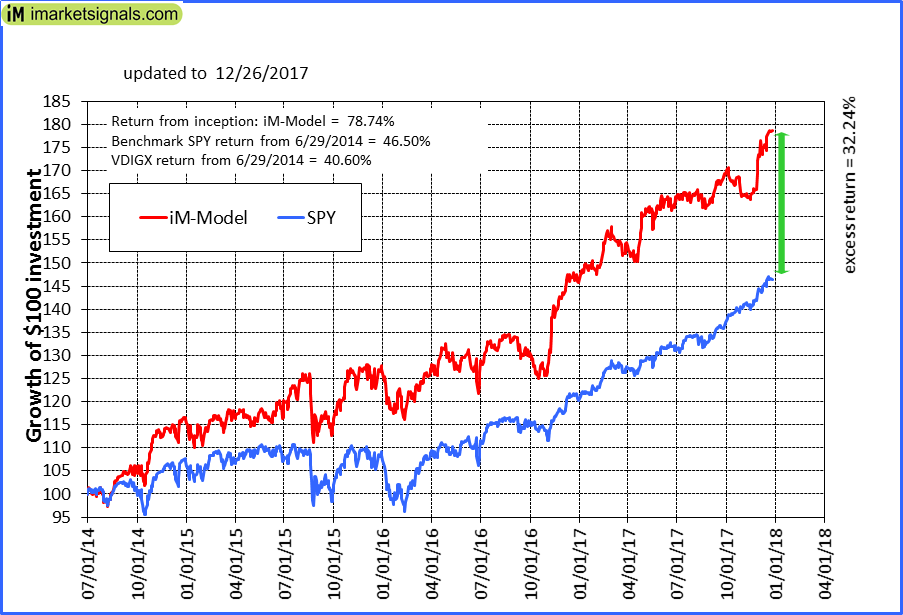 |
iM-Best10(VDIGX)-Trader: The model’s out of sample performance YTD is 22.6%, and for the last 12 months is 21.6%. Over the same period the benchmark SPY performance was 21.9% and 20.7% respectively. Since inception, on 7/1/2014, the model gained 78.74% while the benchmark SPY gained 46.50% and VDIGX gained 40.60% over the same period. Over the previous week the market value of iM-Best10(VDIGX) gained 0.26% at a time when SPY gained -0.38%. A starting capital of $100,000 at inception on 7/1/2014 would have grown to $178,636 which includes $1,302 cash and excludes $1,956 spent on fees and slippage. |
 |
iM-BESTOGA-3: The model’s out of sample performance YTD is 14.8%, and for the last 12 months is 14.5%. Over the same period the benchmark SPY performance was 21.9% and 20.7% respectively. Over the previous week the market value of iM-BESTOGA-3 gained 0.79% at a time when SPY gained -0.38%. A starting capital of $100,000 at inception on 2/3/2014 would have grown to $231,521 which includes $1,589 cash and excludes $1,818 spent on fees and slippage. |
 |
iM-Best7(HiD-LoV): The model’s out of sample performance YTD is 9.6%, and for the last 12 months is 9.0%. Over the same period the benchmark SPY performance was 21.9% and 20.7% respectively. Over the previous week the market value of iM-BESTOGA-3 gained -2.17% at a time when SPY gained -0.38%. A starting capital of $100,000 at inception on 6/30/2016 would have grown to $111,790 which includes $277 cash and excludes $1,343 spent on fees and slippage. |
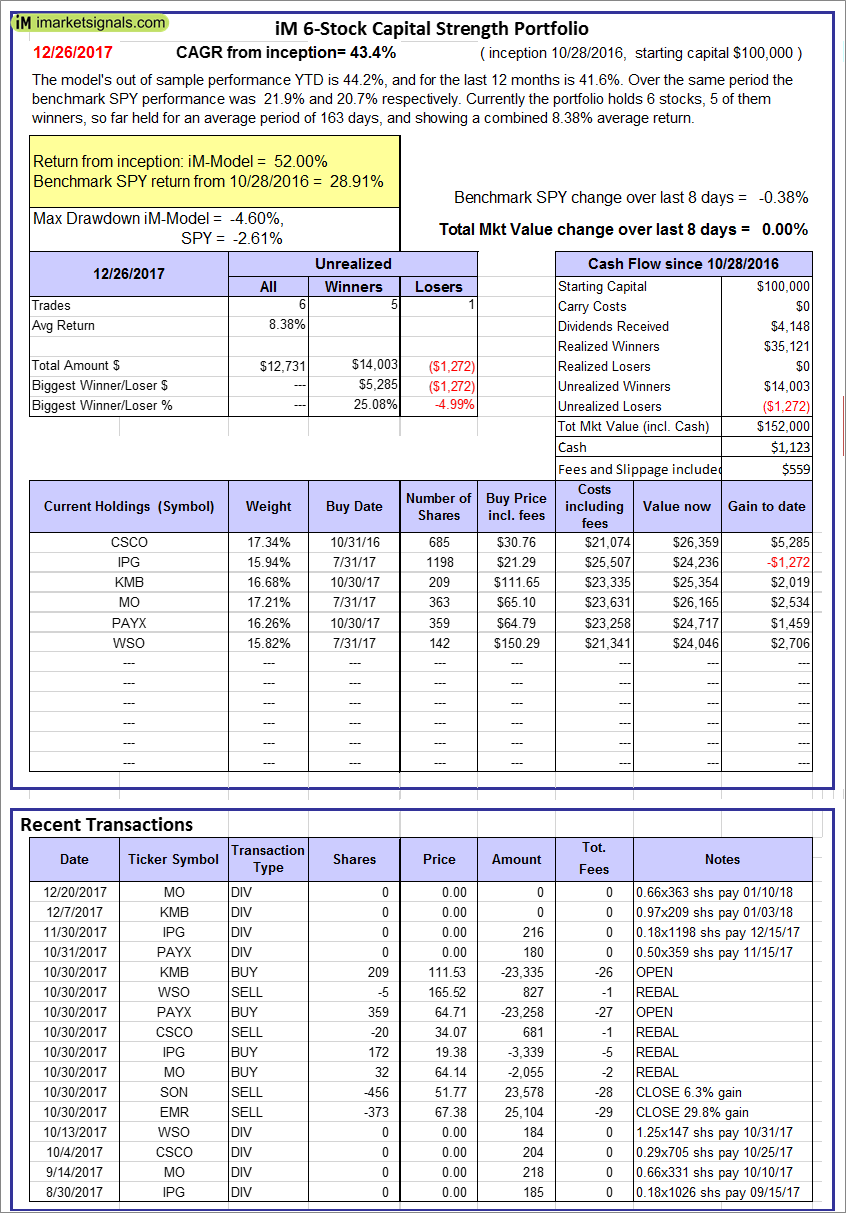 |
iM 6-Stock Capital Strength Portfolio: The model’s out of sample performance YTD is 44.2%, and for the last 12 months is 41.6%. Over the same period the benchmark SPY performance was 21.9% and 20.7% respectively. Over the previous week the market value of the iM 6-Stock Capital Strength Portfolio gained 0.00% at a time when SPY gained -0.38%. A starting capital of $100,000 at inception on 10/28/2016 would have grown to $152,000 which includes $1,123 cash and excludes $559 spent on fees and slippage. |
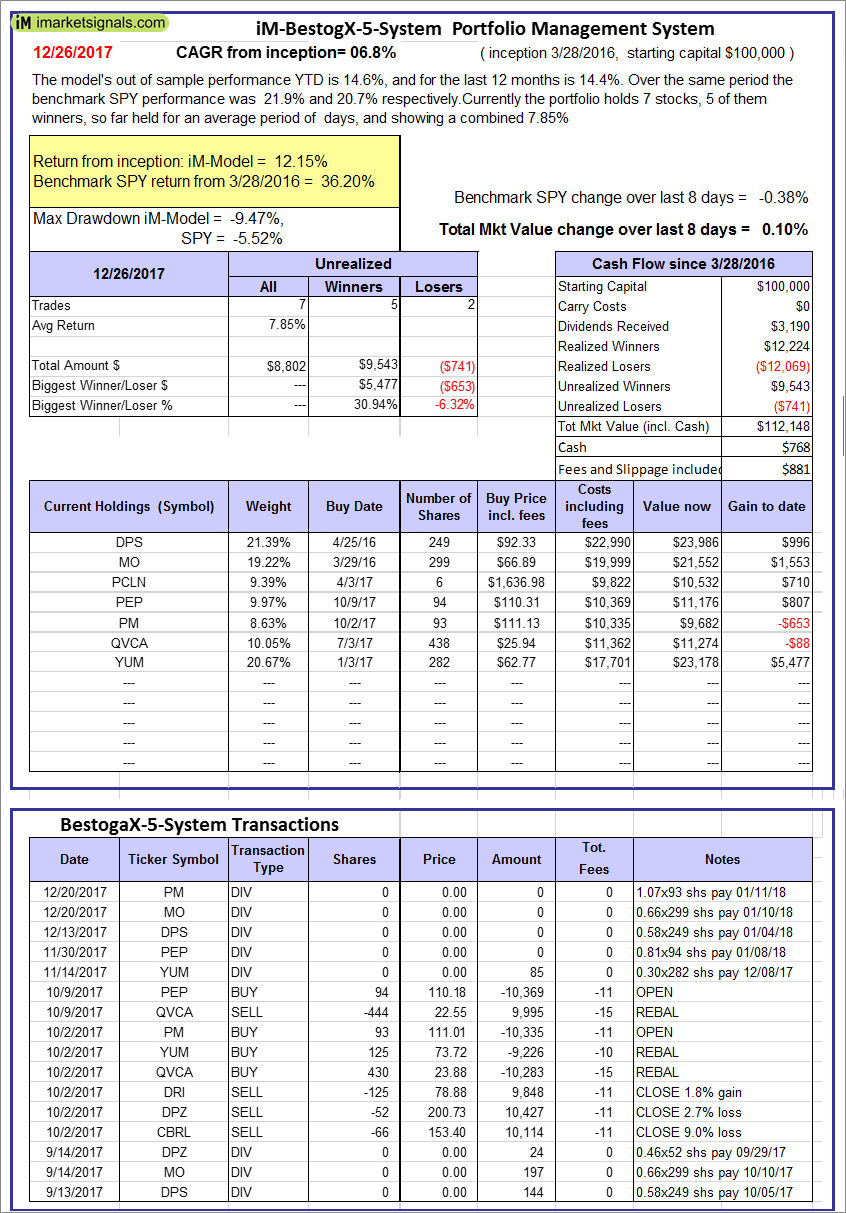 |
iM-BestogaX5-System: The model’s out of sample performance YTD is 14.6%, and for the last 12 months is 14.4%. Over the same period the benchmark SPY performance was 21.9% and 20.7% respectively. Over the previous week the market value of iM-Best8(S&P 500)Tax-Eff. gained 0.10% at a time when SPY gained -0.38%. A starting capital of $100,000 at inception on 3/28/2016 would have grown to $112,148 which includes $768 cash and excludes $881 spent on fees and slippage. |
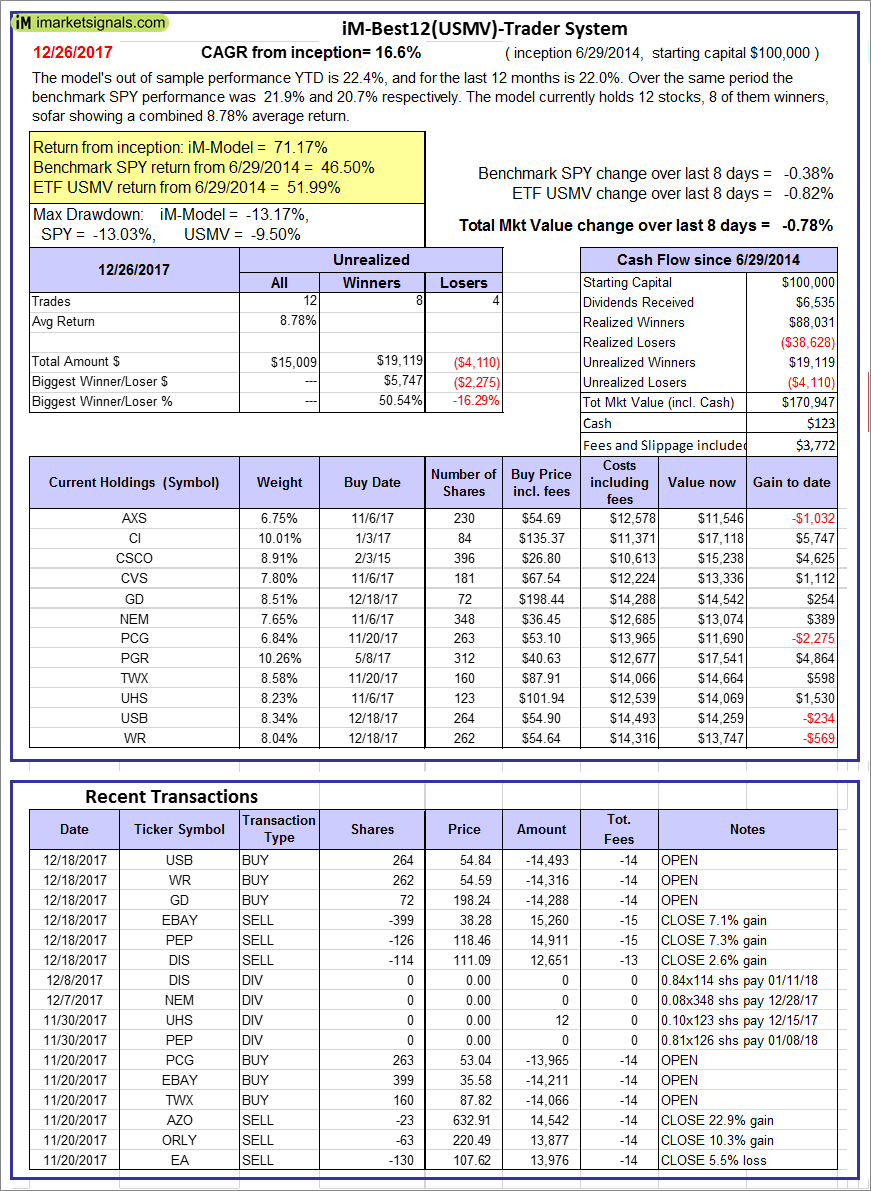  |
iM-Best12(USMV)-Trader: The model’s out of sample performance YTD is 22.4%, and for the last 12 months is 22.0%. Over the same period the benchmark SPY performance was 21.9% and 20.7% respectively. Since inception, on 6/30/2014, the model gained 71.17% while the benchmark SPY gained 46.50% and the ETF USMV gained 51.99% over the same period. Over the previous week the market value of iM-Best12(USMV)-Trader gained -0.78% at a time when SPY gained -0.38%. A starting capital of $100,000 at inception on 6/30/2014 would have grown to $170,947 which includes $123 cash and excludes $3,772 spent on fees and slippage. |
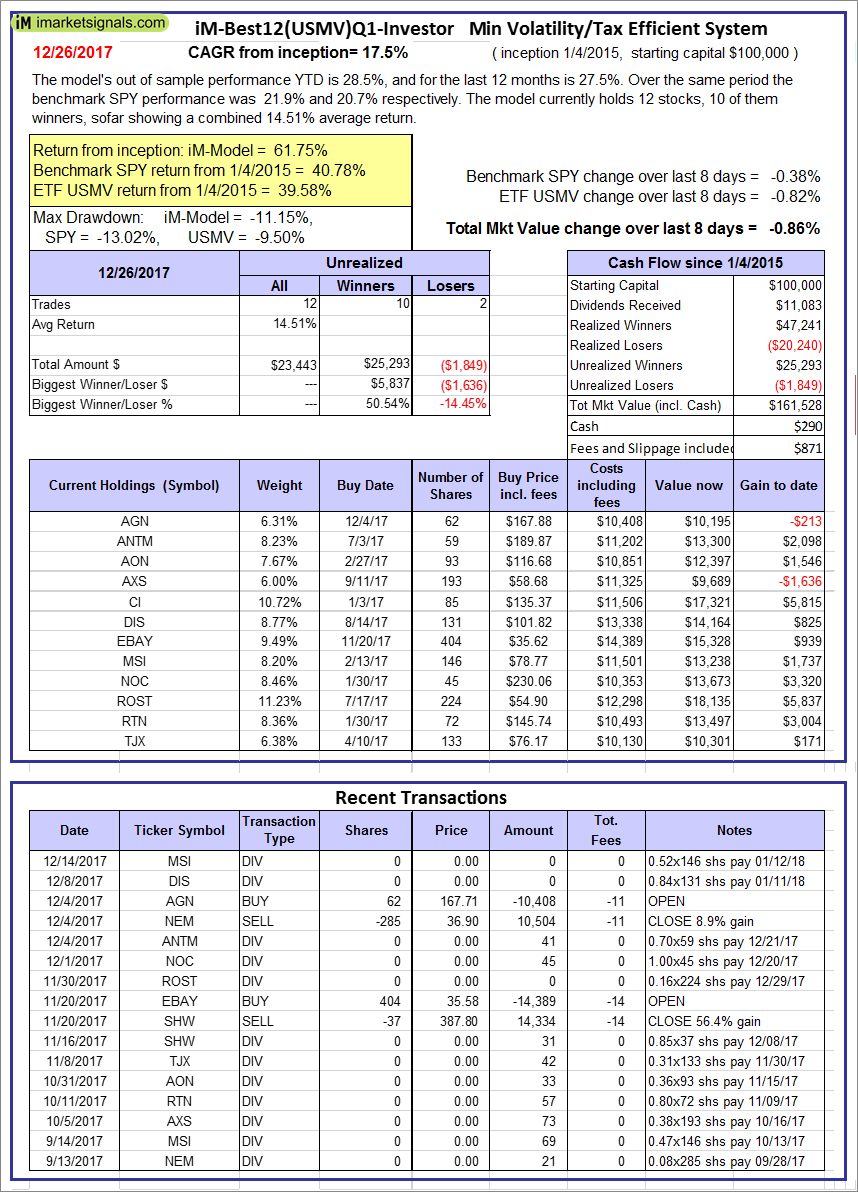 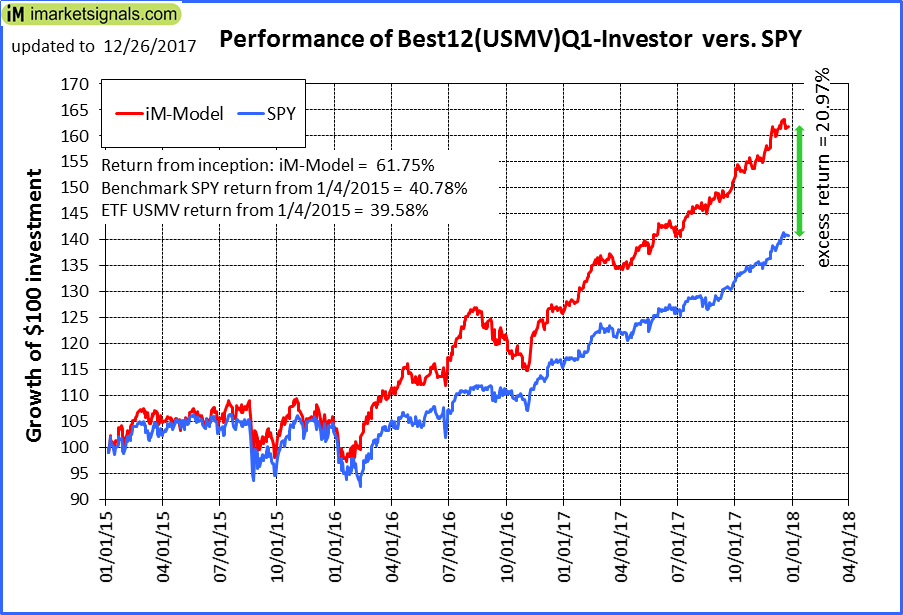 |
iM-Best12(USMV)Q1-Investor: The model’s out of sample performance YTD is 28.5%, and for the last 12 months is 27.5%. Over the same period the benchmark SPY performance was 21.9% and 20.7% respectively. Since inception, on 1/5/2015, the model gained 61.75% while the benchmark SPY gained 40.78% and the ETF USMV gained 39.58% over the same period. Over the previous week the market value of iM-Best12(USMV)Q1 gained -0.86% at a time when SPY gained -0.38%. A starting capital of $100,000 at inception on 1/5/2015 would have grown to $161,528 which includes $290 cash and excludes $871 spent on fees and slippage. |
 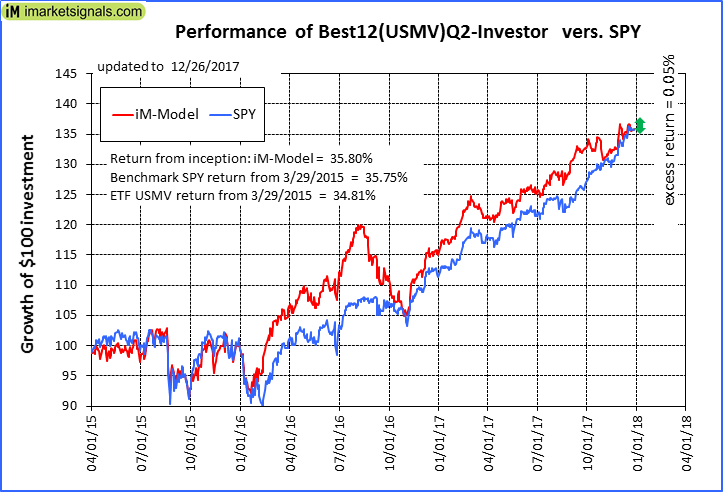 |
iM-Best12(USMV)Q2-Investor: The model’s out of sample performance YTD is 18.0%, and for the last 12 months is 17.6%. Over the same period the benchmark SPY performance was 21.9% and 20.7% respectively. Since inception, on 3/30/2015, the model gained 35.80% while the benchmark SPY gained 35.75% and the ETF USMV gained 34.81% over the same period. Over the previous week the market value of iM-Best12(USMV)Q2 gained -0.67% at a time when SPY gained -0.38%. A starting capital of $100,000 at inception on 3/30/2015 would have grown to $135,615 which includes $12 cash and excludes $784 spent on fees and slippage. |
  |
iM-Best12(USMV)Q3-Investor: The model’s out of sample performance YTD is 14.8%, and for the last 12 months is 14.3%. Over the same period the benchmark SPY performance was 21.9% and 20.7% respectively. Since inception, on 7/1/2014, the model gained 78.00% while the benchmark SPY gained 46.50% and the ETF USMV gained 51.99% over the same period. Over the previous week the market value of iM-Best12(USMV)Q3 gained -0.03% at a time when SPY gained -0.38%. A starting capital of $100,000 at inception on 7/1/2014 would have grown to $177,761 which includes $136 cash and excludes $1,238 spent on fees and slippage. |
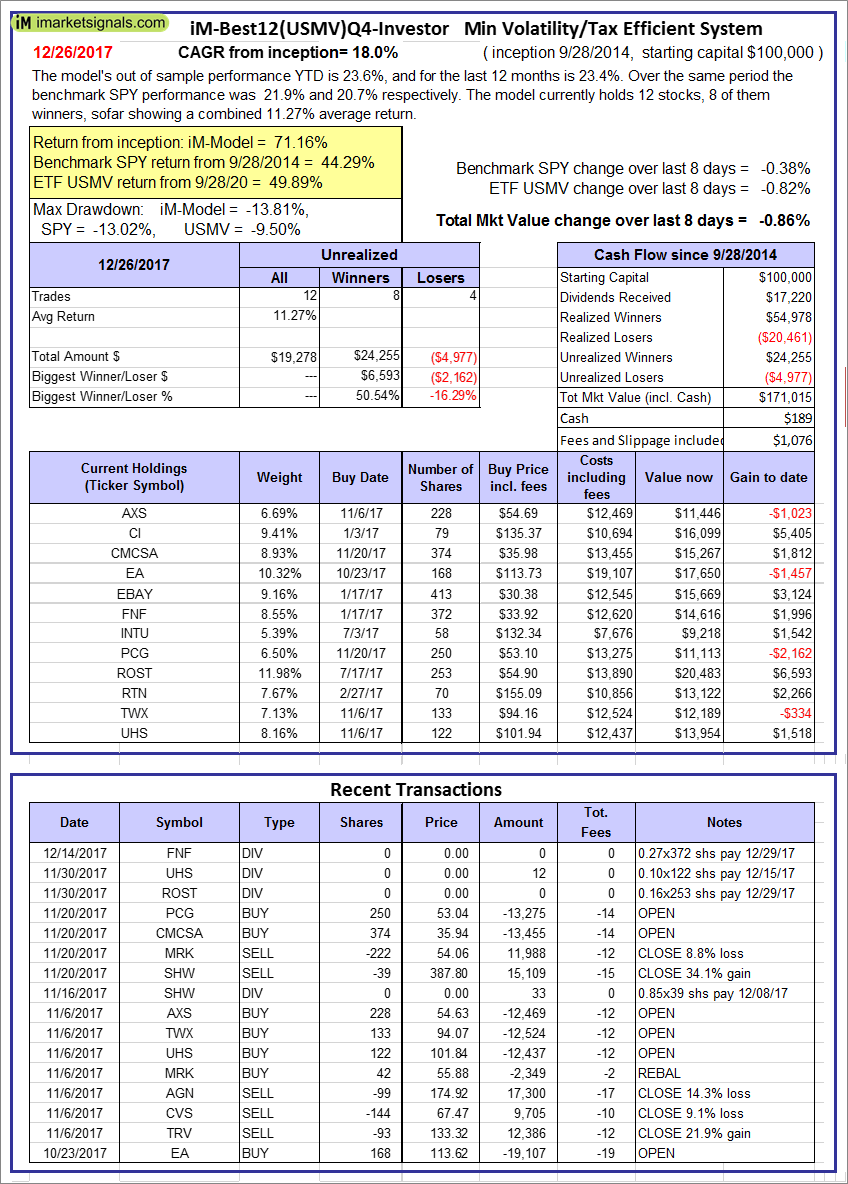 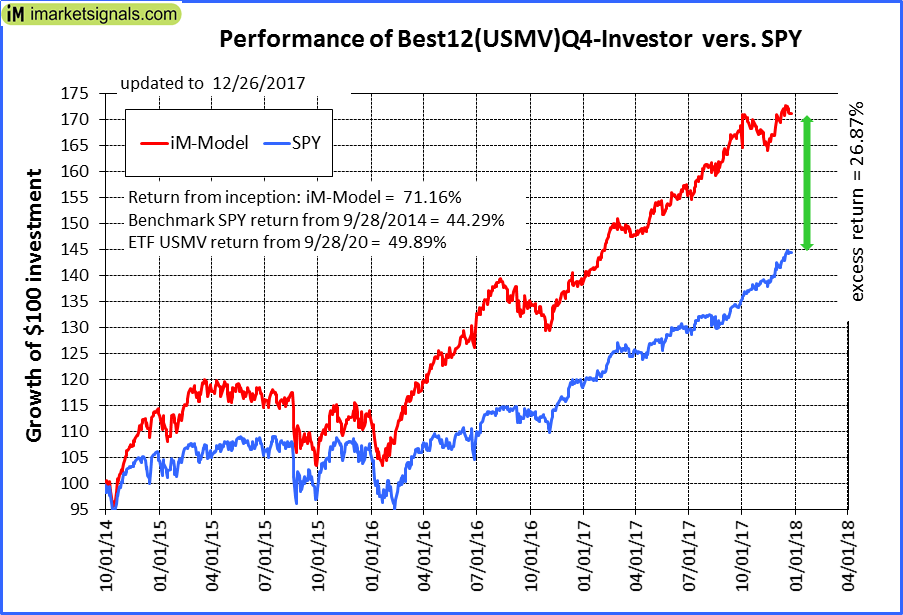 |
iM-Best12(USMV)Q4-Investor: Since inception, on 9/29/2014, the model gained 71.16% while the benchmark SPY gained 44.29% and the ETF USMV gained 49.89% over the same period. Over the previous week the market value of iM-Best12(USMV)Q4 gained -0.86% at a time when SPY gained -0.38%. A starting capital of $100,000 at inception on 9/29/2014 would have grown to $171,015 which includes $189 cash and excludes $1,076 spent on fees and slippage. |
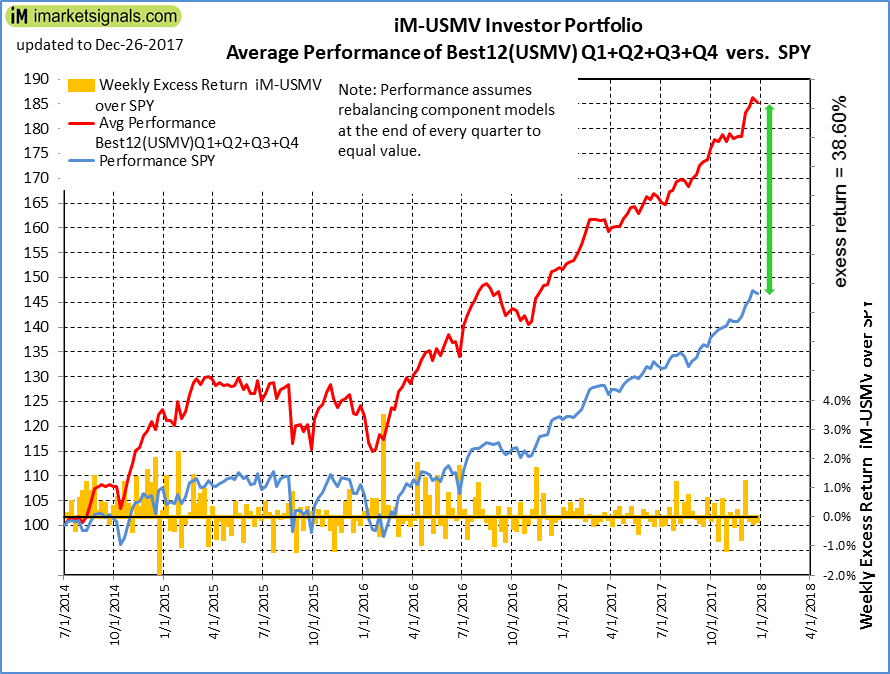 |
Average Performance of iM-Best12(USMV)Q1+Q2+Q3+Q4-Investor resulted in an excess return of 38.60% over SPY. (see iM-USMV Investor Portfolio) |
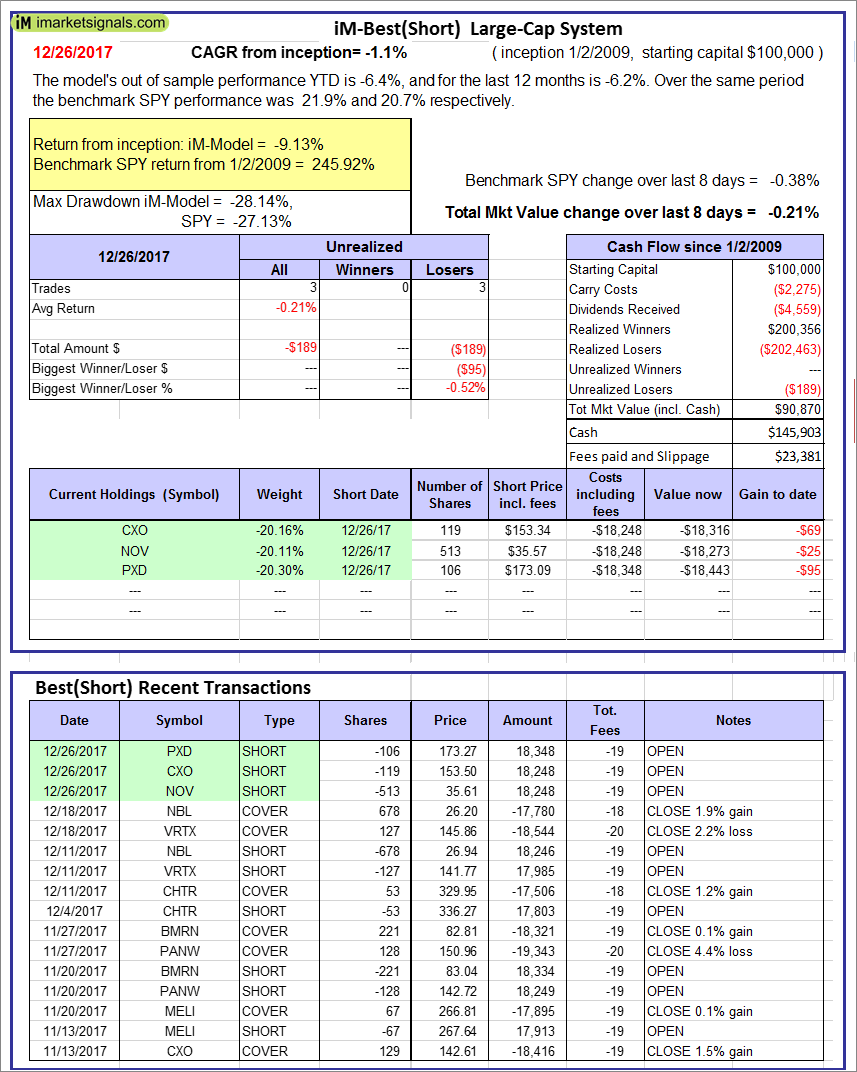 |
iM-Best(Short): The model’s out of sample performance YTD is -6.4%, and for the last 12 months is -6.2%. Over the same period the benchmark SPY performance was 21.9% and 20.7% respectively. Over the previous week the market value of iM-Best(Short) gained -0.21% at a time when SPY gained -0.38%. Over the period 1/2/2009 to 12/26/2017 the starting capital of $100,000 would have grown to $90,870 which includes $145,903 cash and excludes $23,381 spent on fees and slippage. |
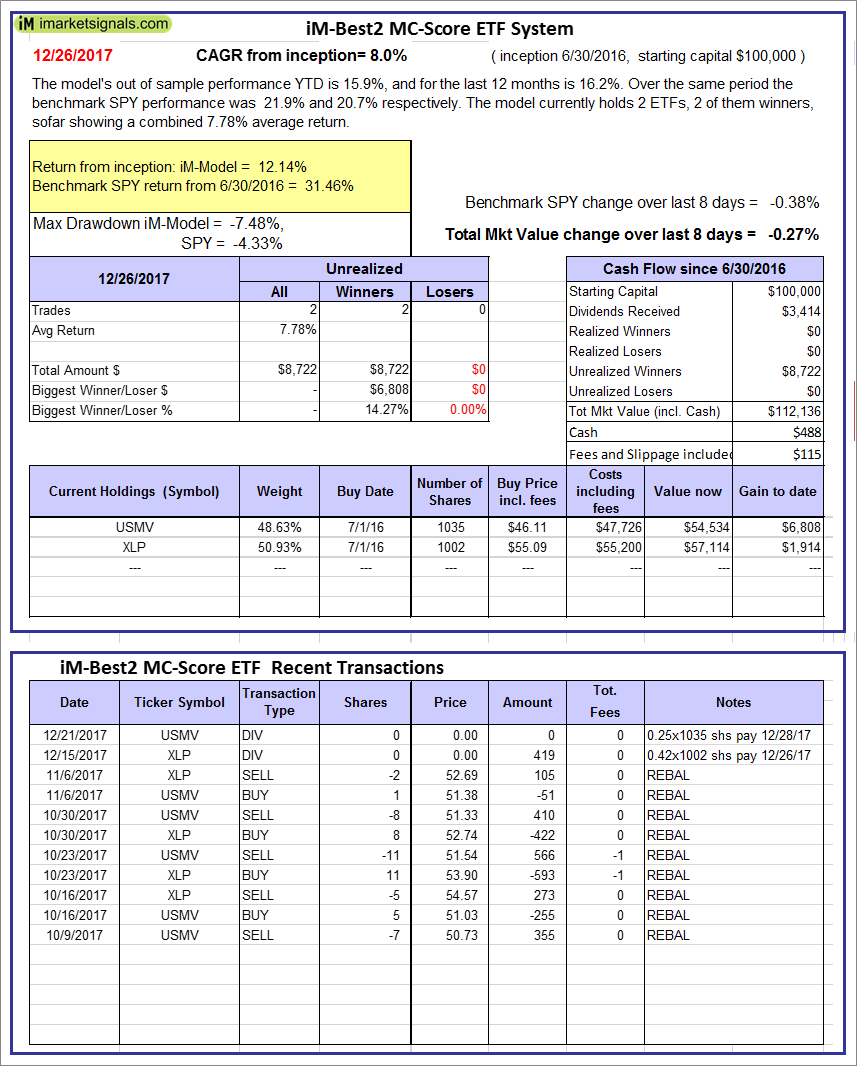 |
iM-Best2 MC-Score ETF System: The model’s out of sample performance YTD is 15.9%, and for the last 12 months is 16.2%. Over the same period the benchmark SPY performance was 21.9% and 20.7% respectively. Over the previous week the market value of the iM-Best2 MC-Score ETF System gained -0.27% at a time when SPY gained -0.38%. A starting capital of $100,000 at inception on 6/30/2016 would have grown to $112,136 which includes $488 cash and excludes $115 spent on fees and slippage. |
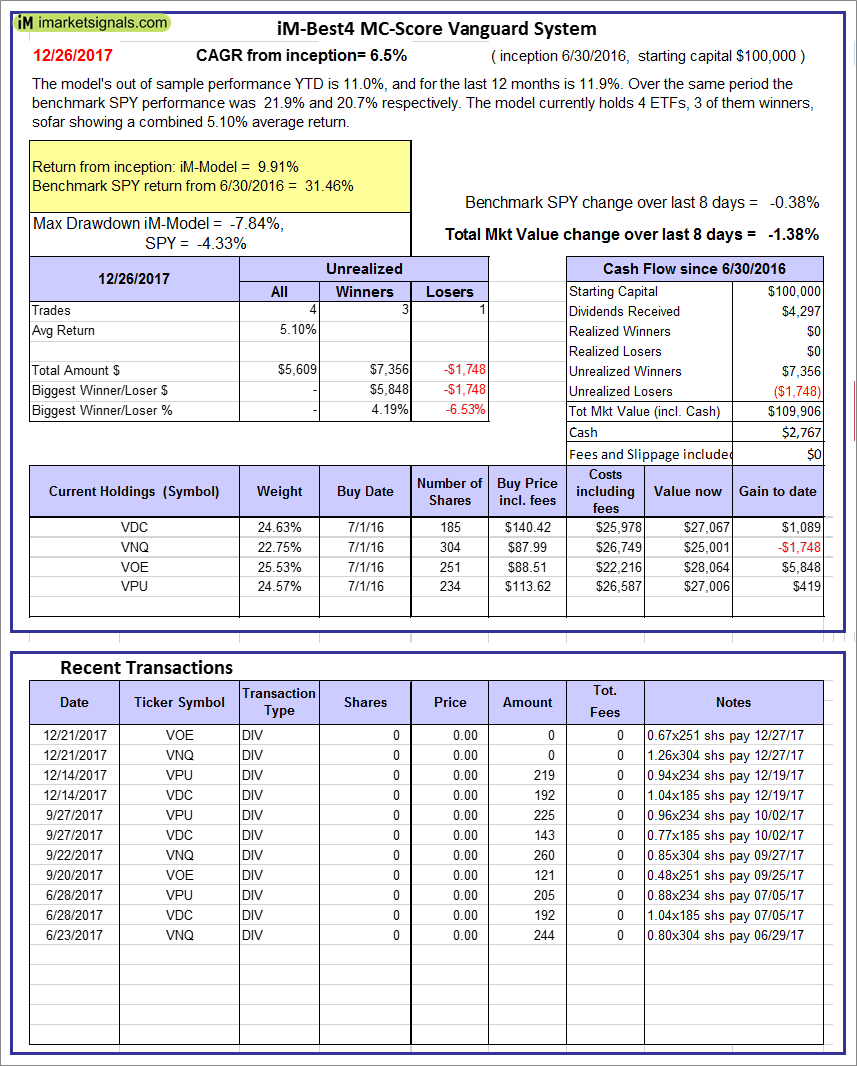 |
iM-Best4 MC-Score Vanguard System: The model’s out of sample performance YTD is 11.0%, and for the last 12 months is 11.9%. Over the same period the benchmark SPY performance was 21.9% and 20.7% respectively. Over the previous week the market value of the iM-Best4 MC-Score Vanguard System gained -1.38% at a time when SPY gained -0.38%. A starting capital of $100,000 at inception on 6/30/2016 would have grown to $109,906 which includes $2,767 cash and excludes $00 spent on fees and slippage. |
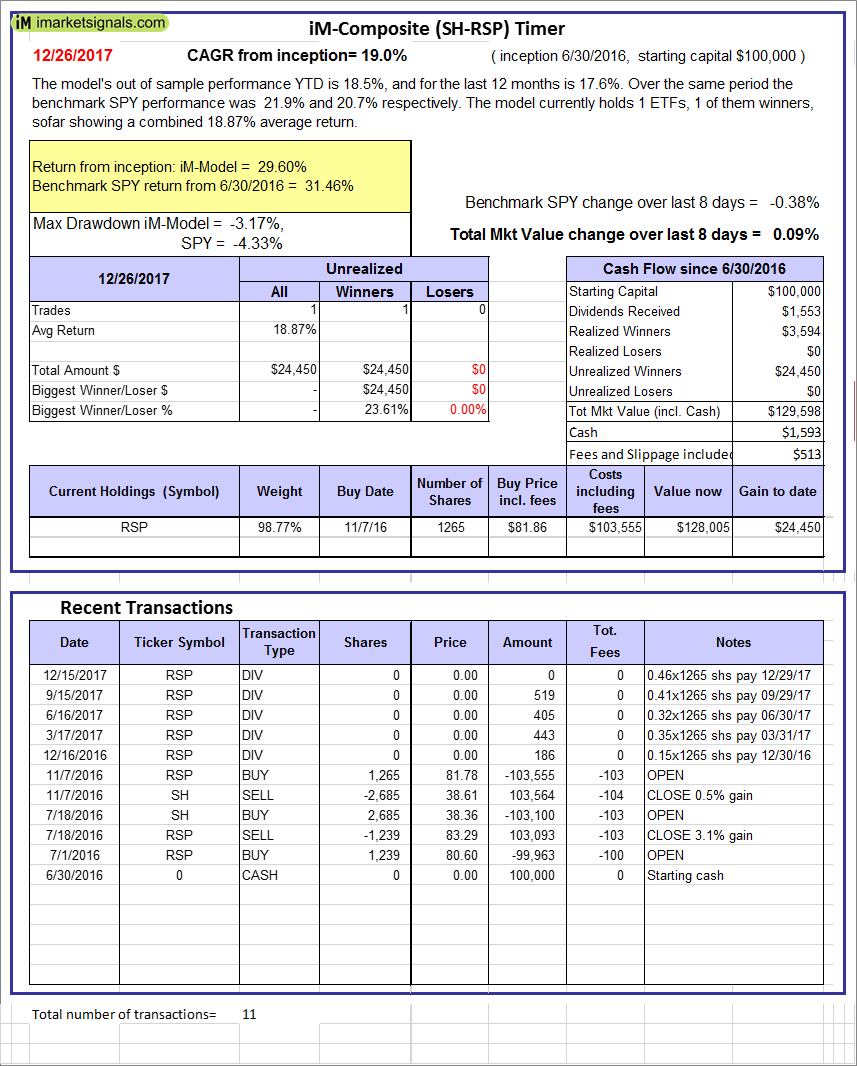 |
iM-Composite (SH-RSP) Timer: The model’s out of sample performance YTD is 18.5%, and for the last 12 months is 17.6%. Over the same period the benchmark SPY performance was 21.9% and 20.7% respectively. Over the previous week the market value of the iM-Composite (SH-RSP) Timer gained 0.09% at a time when SPY gained -0.38%. A starting capital of $100,000 at inception on 6/30/2016 would have grown to $129,598 which includes $1,593 cash and excludes $513 spent on fees and slippage. |
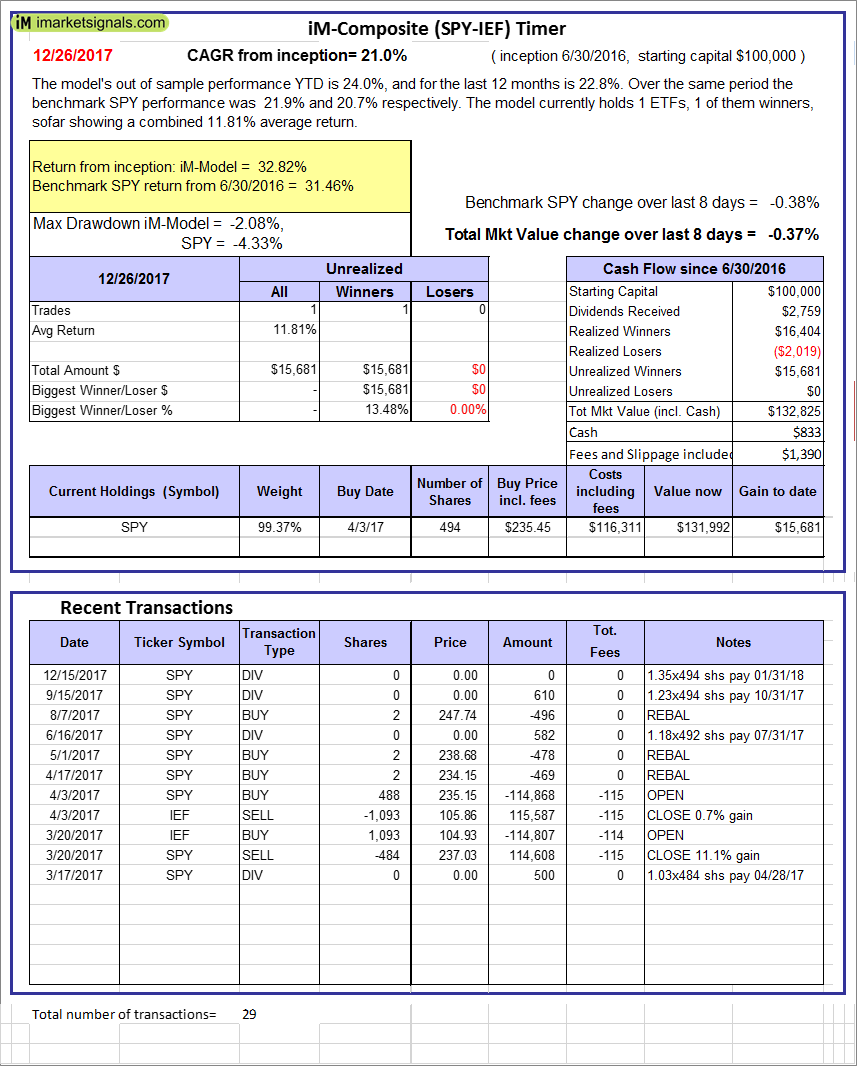 |
iM-Composite (SPY-IEF) Timer: The model’s out of sample performance YTD is 24.0%, and for the last 12 months is 22.8%. Over the same period the benchmark SPY performance was 21.9% and 20.7% respectively. Over the previous week the market value of the iM-Composite (SPY-IEF) Timer gained -0.37% at a time when SPY gained -0.38%. A starting capital of $100,000 at inception on 6/30/2016 would have grown to $132,825 which includes $833 cash and excludes $1,390 spent on fees and slippage. |
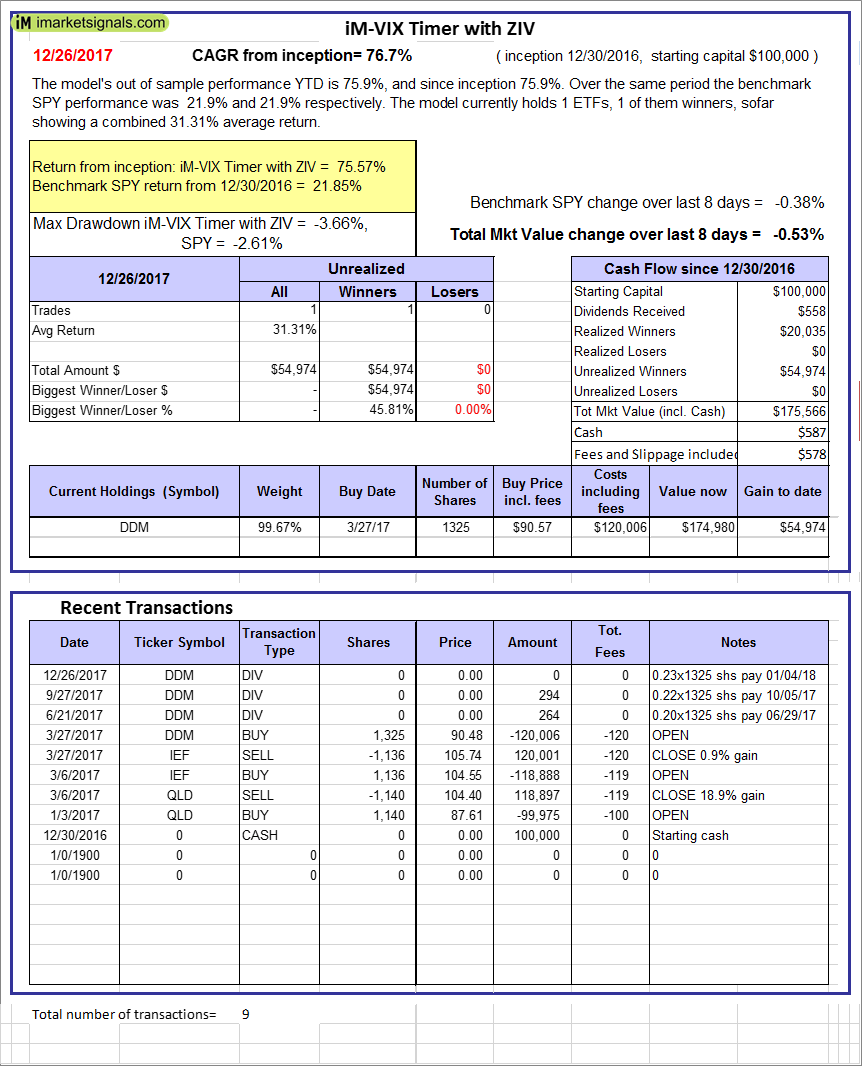 |
iM-VIX Timer with ZIV: The model’s out of sample performance YTD is 75.9%, and since inception 75.9%. Over the same period the benchmark SPY performance was 21.9% and 21.9% respectively. Over the previous week the market value of the iM-VIX Timer with ZIV gained -0.53% at a time when SPY gained -0.38%. A starting capital of $100,000 at inception on 6/30/2016 would have grown to $175,566 which includes $587 cash and excludes $578 spent on fees and slippage. |
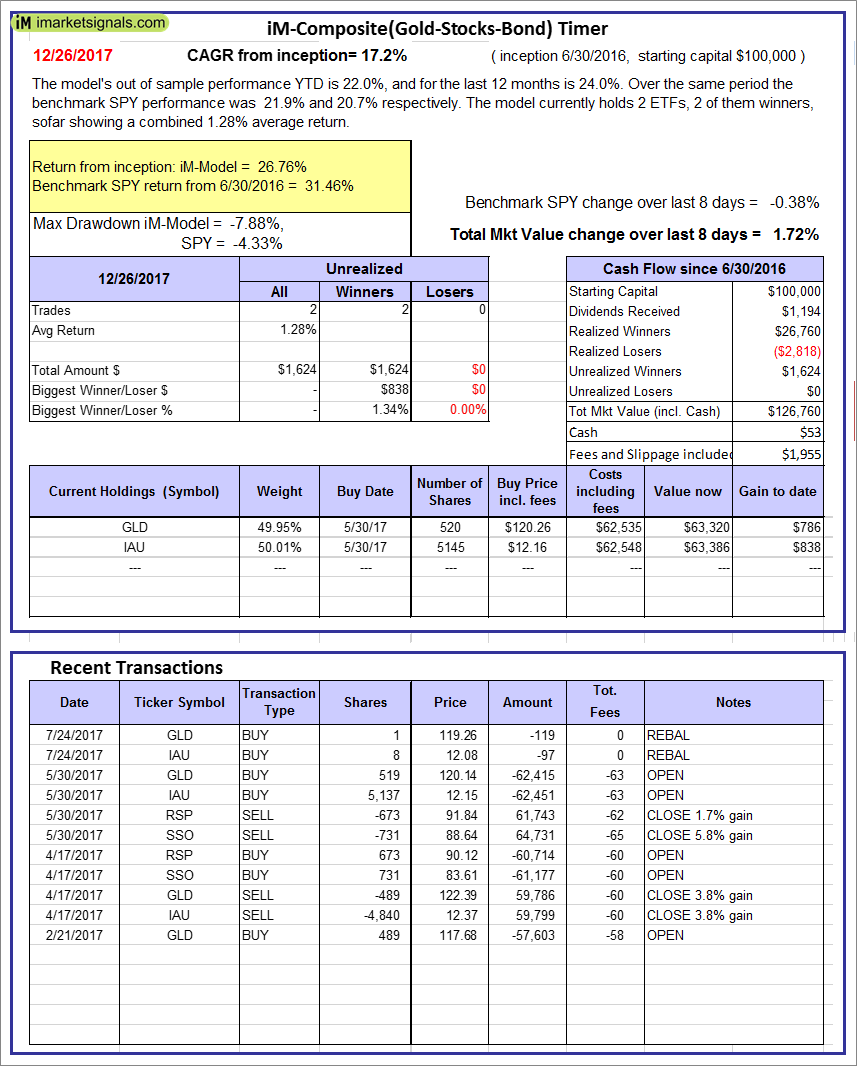 |
iM-Composite(Gold-Stocks-Bond) Timer: The model’s out of sample performance YTD is 22.0%, and for the last 12 months is 24.0%. Over the same period the benchmark SPY performance was 21.9% and 20.7% respectively. Over the previous week the market value of the iM-Composite(Gold-Stocks-Bond) Timer gained 1.72% at a time when SPY gained -0.38%. A starting capital of $100,000 at inception on 6/30/2016 would have grown to $126,760 which includes $53 cash and excludes $1,955 spent on fees and slippage. |
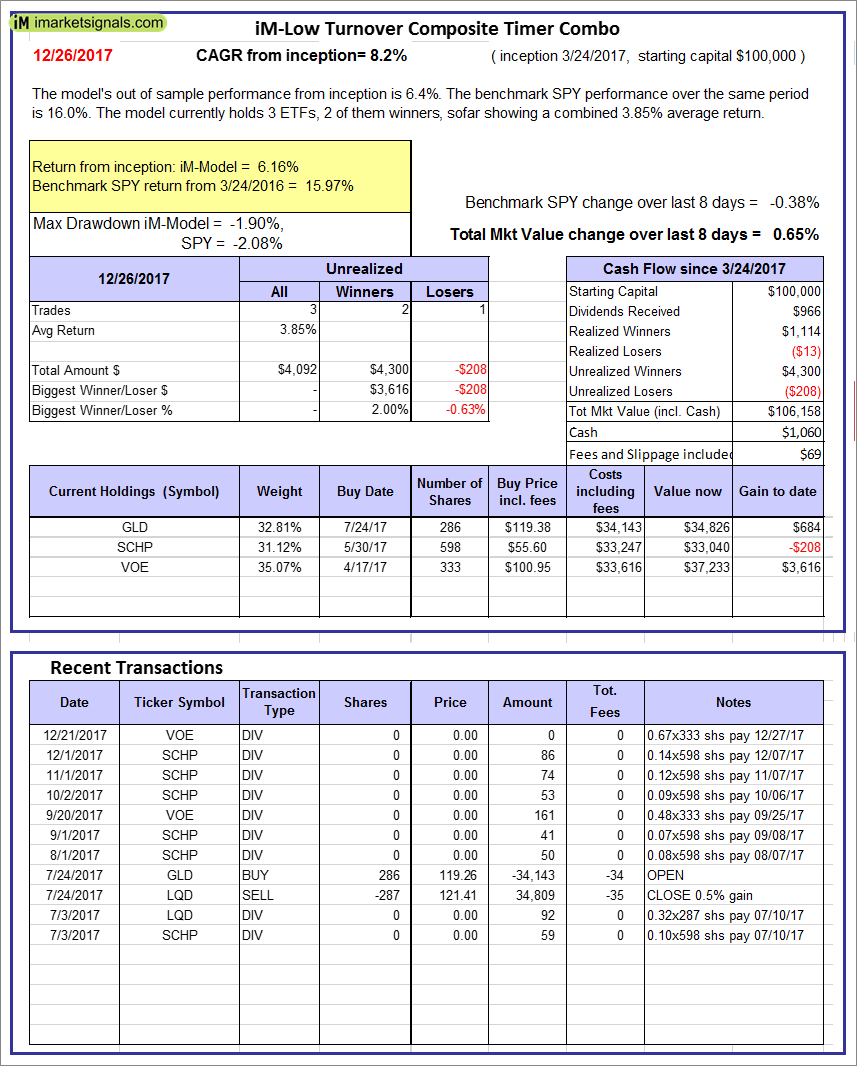 |
iM-Low Turnover Composite Timer Combo: The model’s out of sample performance from inception is 6.4%. The benchmark SPY performance over the same period is 16.0%. Over the previous week the market value of the iM-Low Turnover Composite Timer Combo gained 0.65% at a time when SPY gained -0.38%. A starting capital of $100,000 at inception on 3/24/27 would have grown to $106,158 which includes $1,060 cash and excludes $69 spent on fees and slippage. |
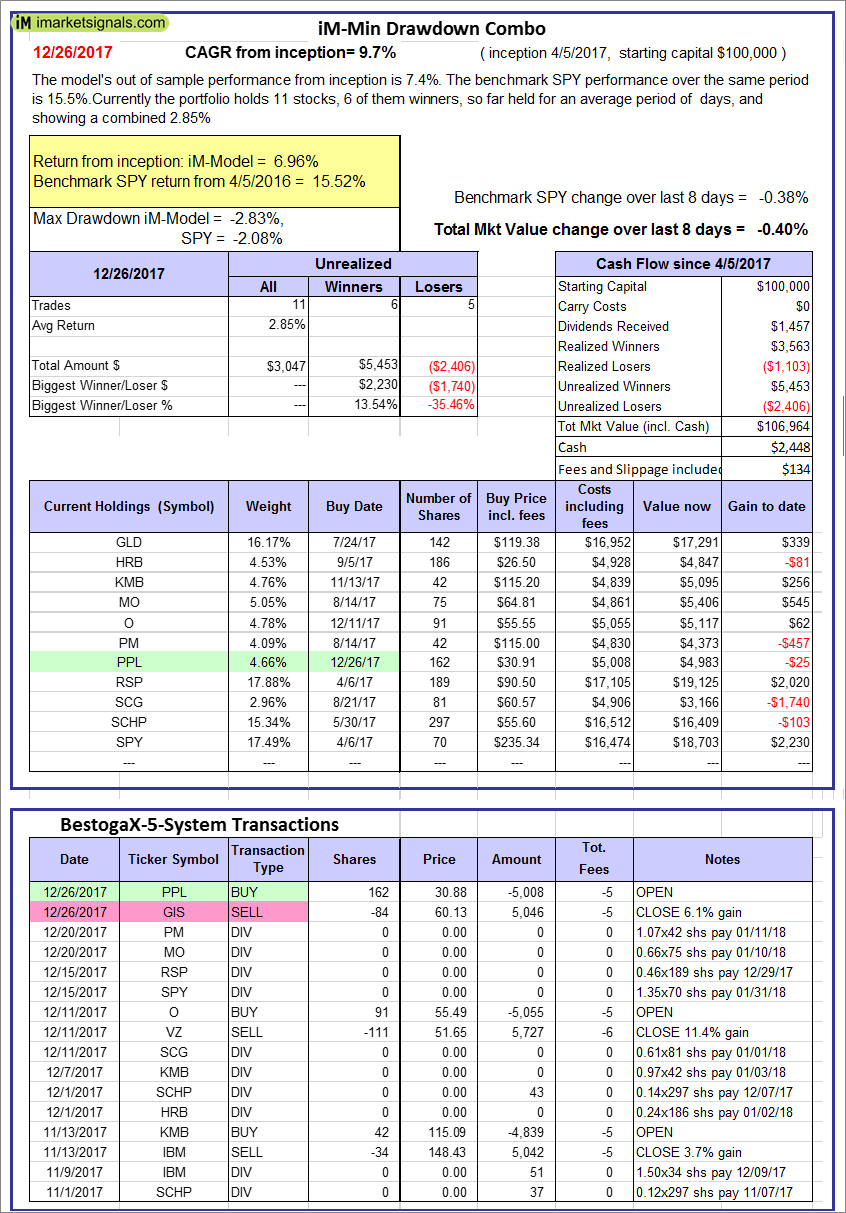 |
iM-Min Drawdown Combo: The model’s out of sample performance from inception is 7.4%. The benchmark SPY performance over the same period is 15.5%. Over the previous week the market value of the iM-Min Drawdown Combo gained -0.40% at a time when SPY gained -0.38%. A starting capital of $100,000 at inception on 4/5/2017 would have grown to $106,964 which includes $2,448 cash and excludes $134 spent on fees and slippage. |
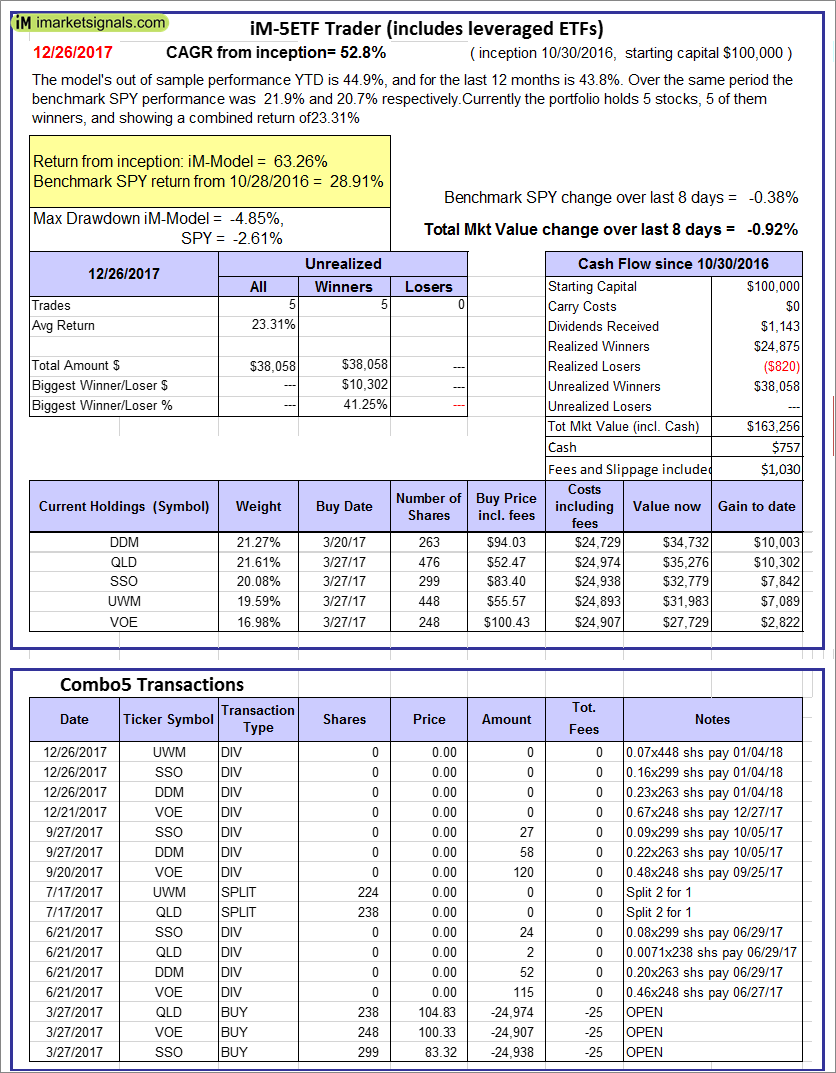 |
iM-5ETF Trader (includes leveraged ETFs): The model’s out of sample performance YTD is 44.9%, and for the last 12 months is 43.8%. Over the same period the benchmark SPY performance was 21.9% and 20.7% respectively. Over the previous week the market value of the iM-5ETF Trader (includes leveraged ETFs) gained -0.92% at a time when SPY gained -0.38%. A starting capital of $100,000 at inception on 10/30/2016 would have grown to $163,256 which includes $757 cash and excludes $1,030 spent on fees and slippage. |
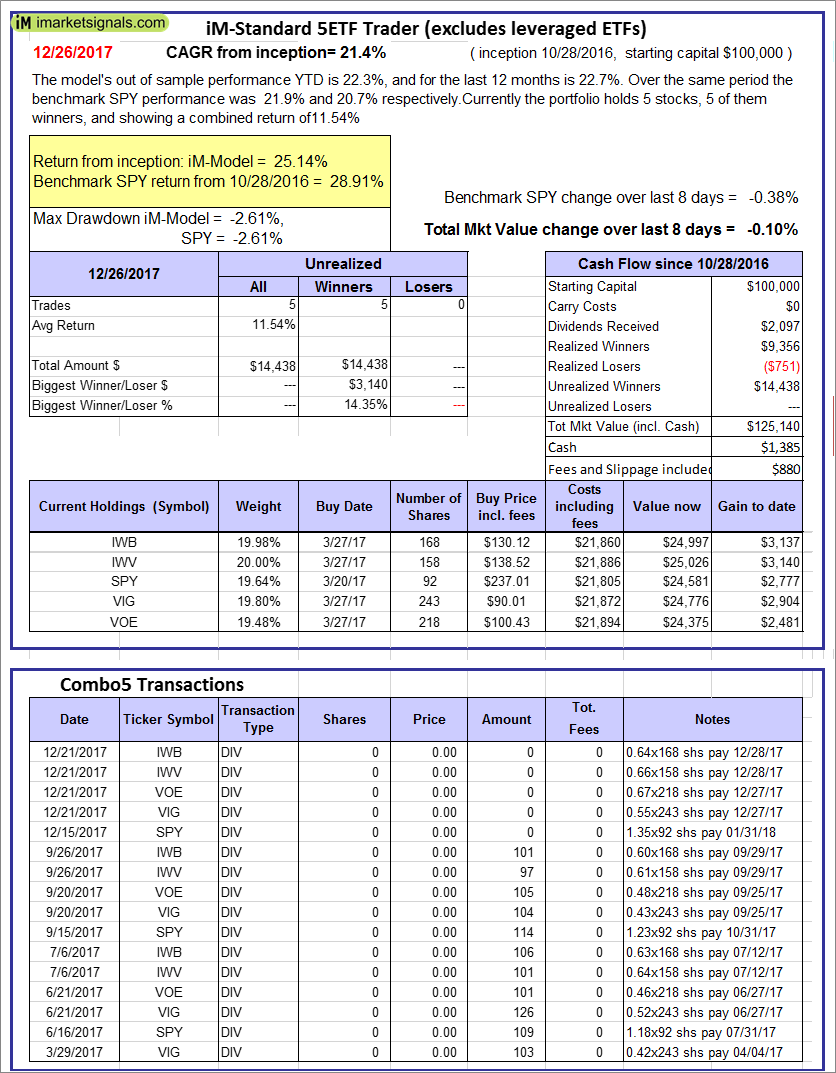 |
iM-Standard 5ETF Trader (excludes leveraged ETFs): The model’s out of sample performance YTD is 22.3%, and for the last 12 months is 22.7%. Over the same period the benchmark SPY performance was 21.9% and 20.7% respectively. Over the previous week the market value of the iM-Standard 5ETF Trader (excludes leveraged ETFs) gained -0.10% at a time when SPY gained -0.38%. A starting capital of $100,000 at inception on 10/30/2016 would have grown to $125,140 which includes $1,385 cash and excludes $880 spent on fees and slippage. |
iM-Best Reports – 12/27/2017
Posted in pmp SPY-SH
Leave a Reply
You must be logged in to post a comment.