  |
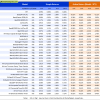
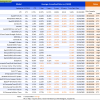
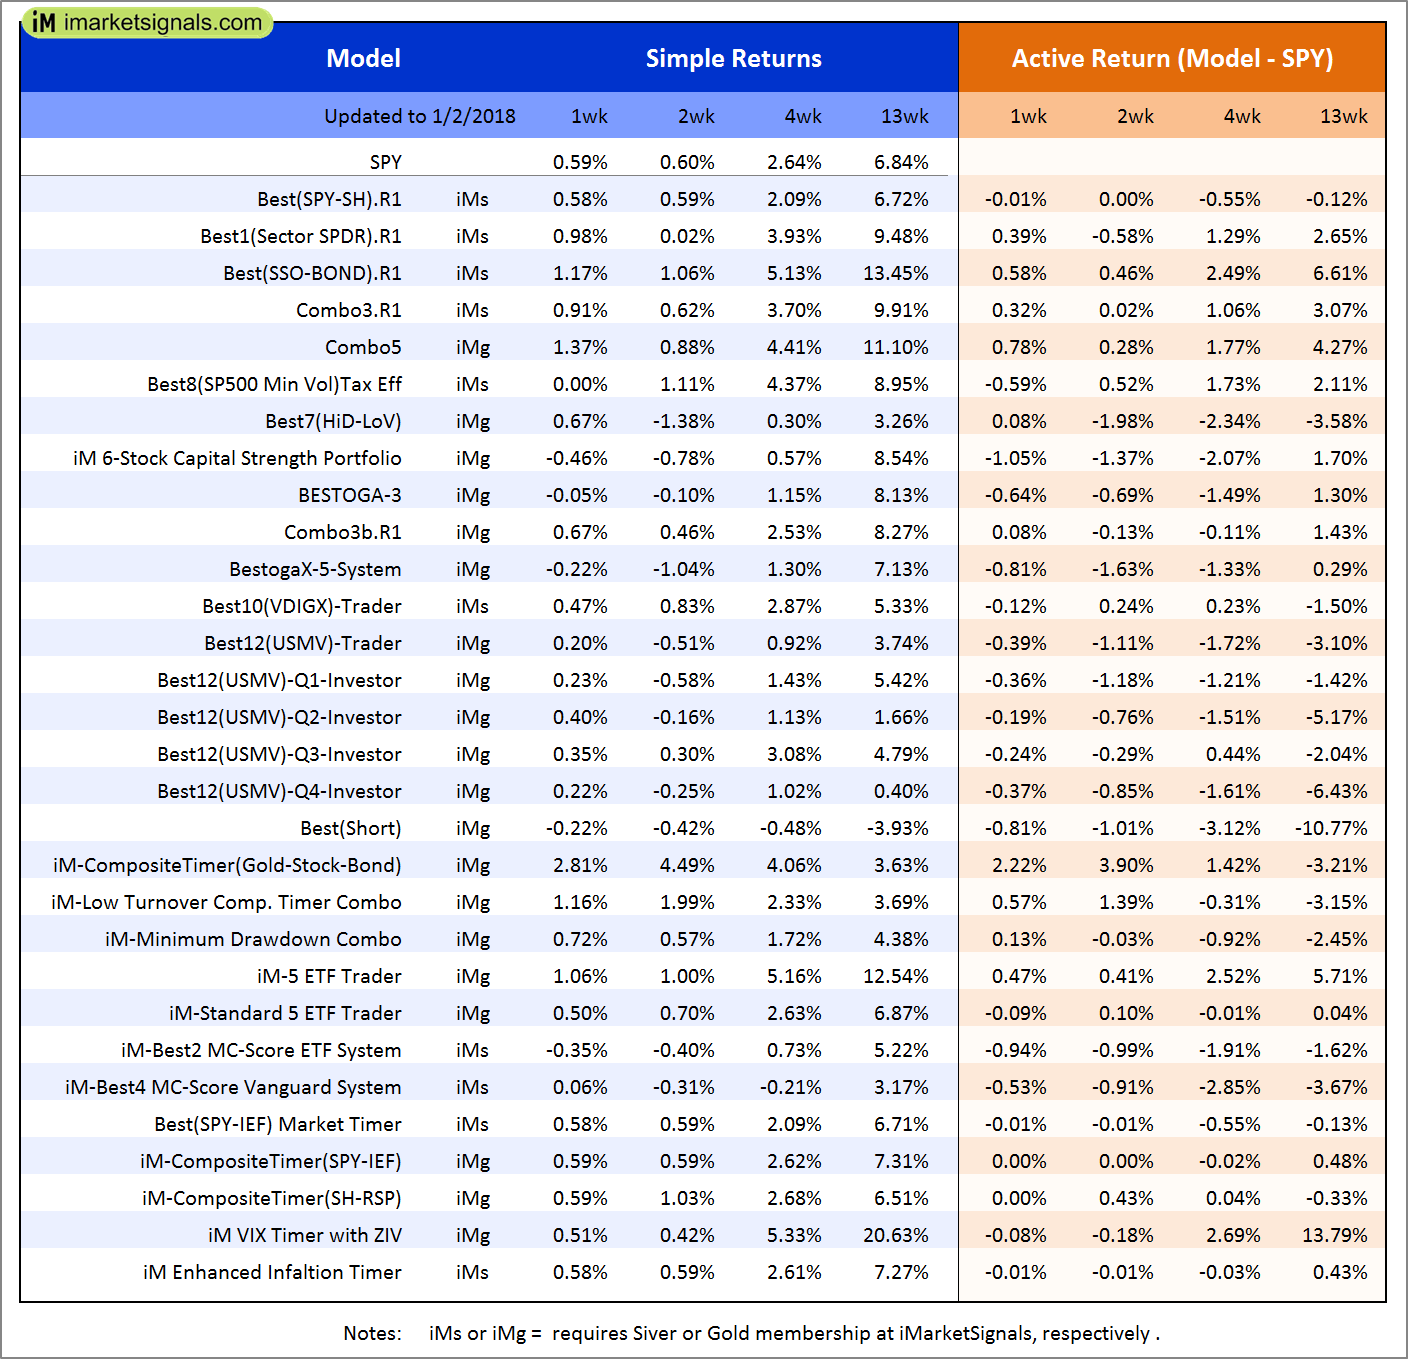
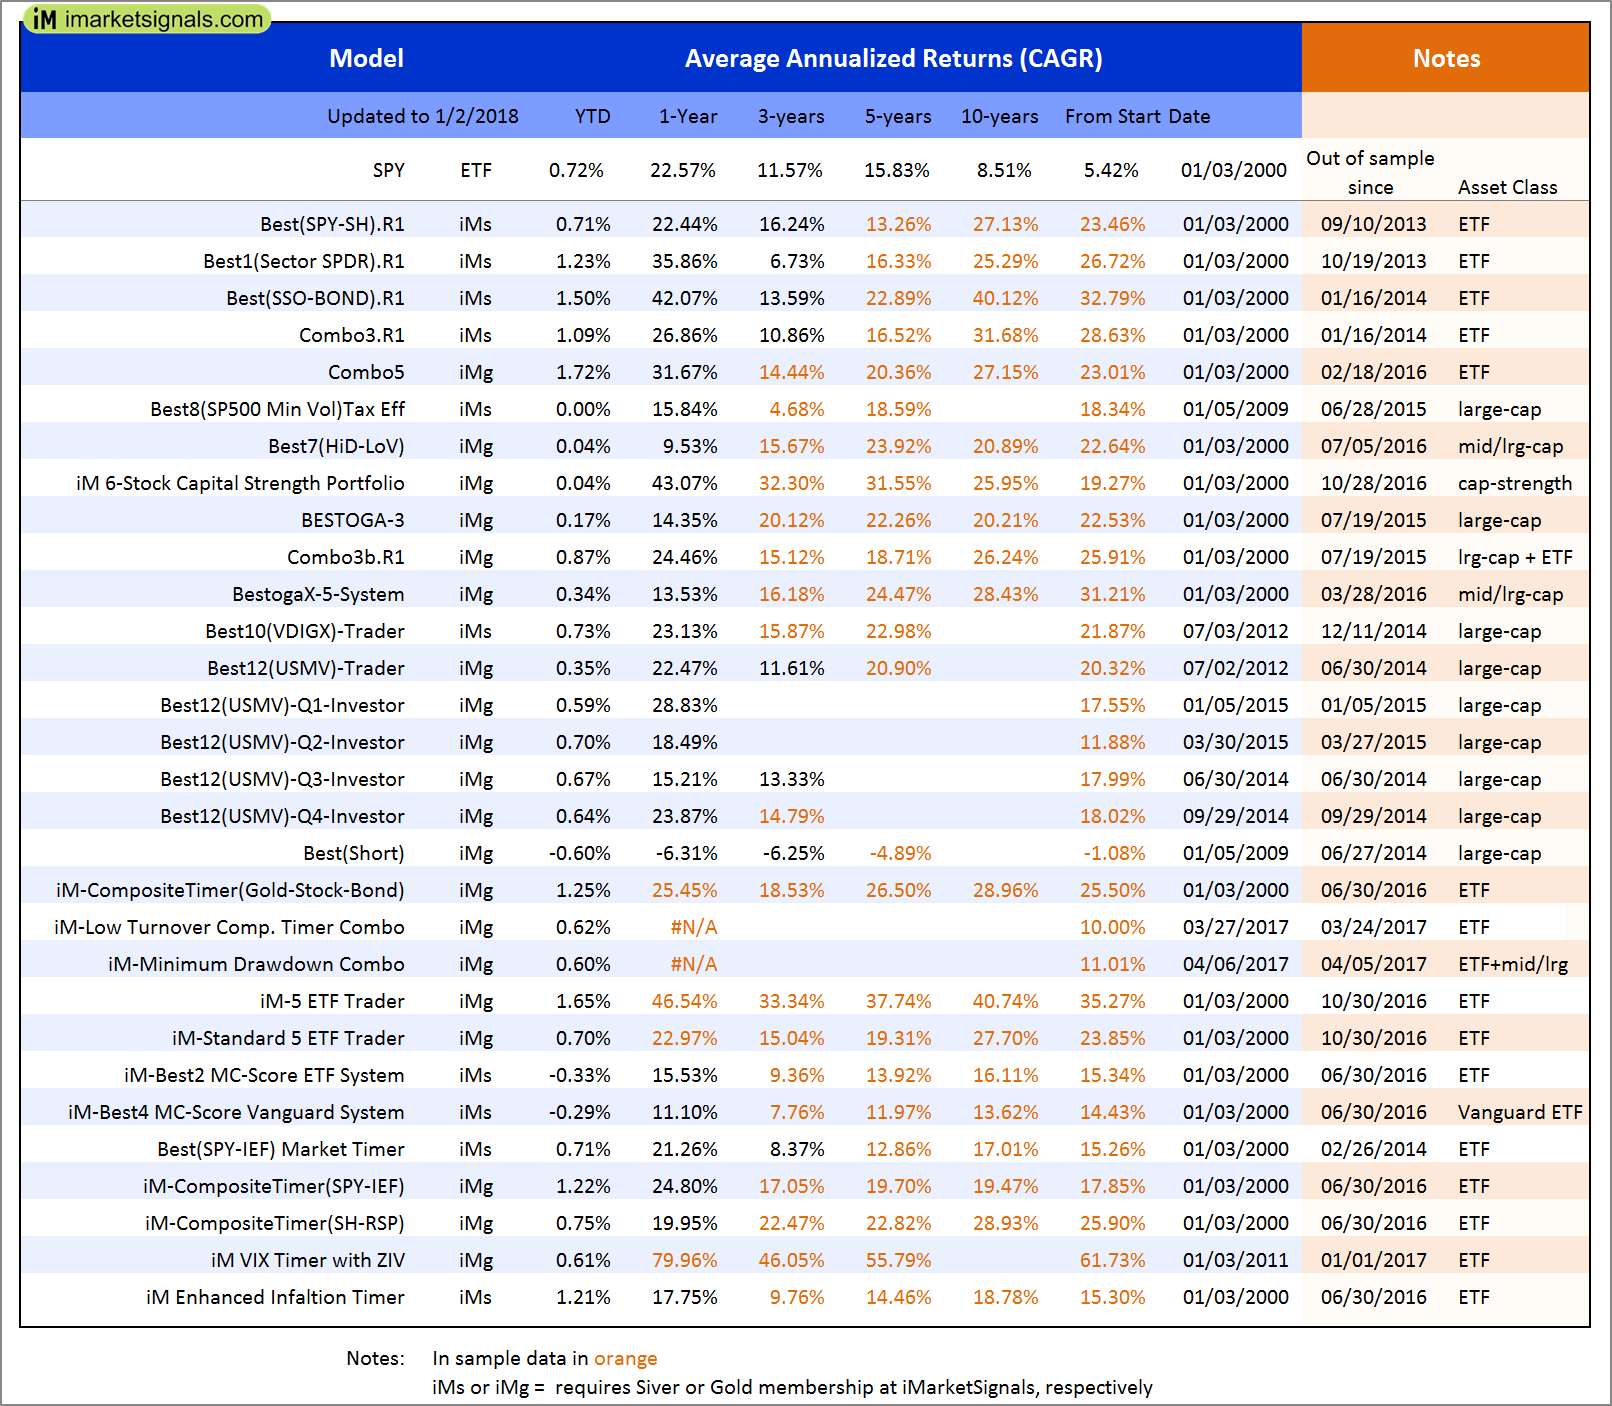
Out of sample performance summary of our models for the past 1, 2, 4 and 13 week periods. The active active return indicates how the models over- or underperformed the benchmark ETF SPY. Also the YTD, and the 1-, 3-, 5- and 10-year annualized returns are shown in the second table |
|
|
iM-Best(SPY-SH).R1: The model’s out of sample performance YTD is 0.7%, and for the last 12 months is 23.1%. Over the same period the benchmark SPY performance was 0.7% and 22.6% respectively. Over the previous week the market value of Best(SPY-SH) gained 0.58% at a time when SPY gained 0.59%. A starting capital of $100,000 at inception on 1/2/2009 would have grown to $566,263 which includes $7,222 cash and excludes $15,358 spent on fees and slippage. |
|
|
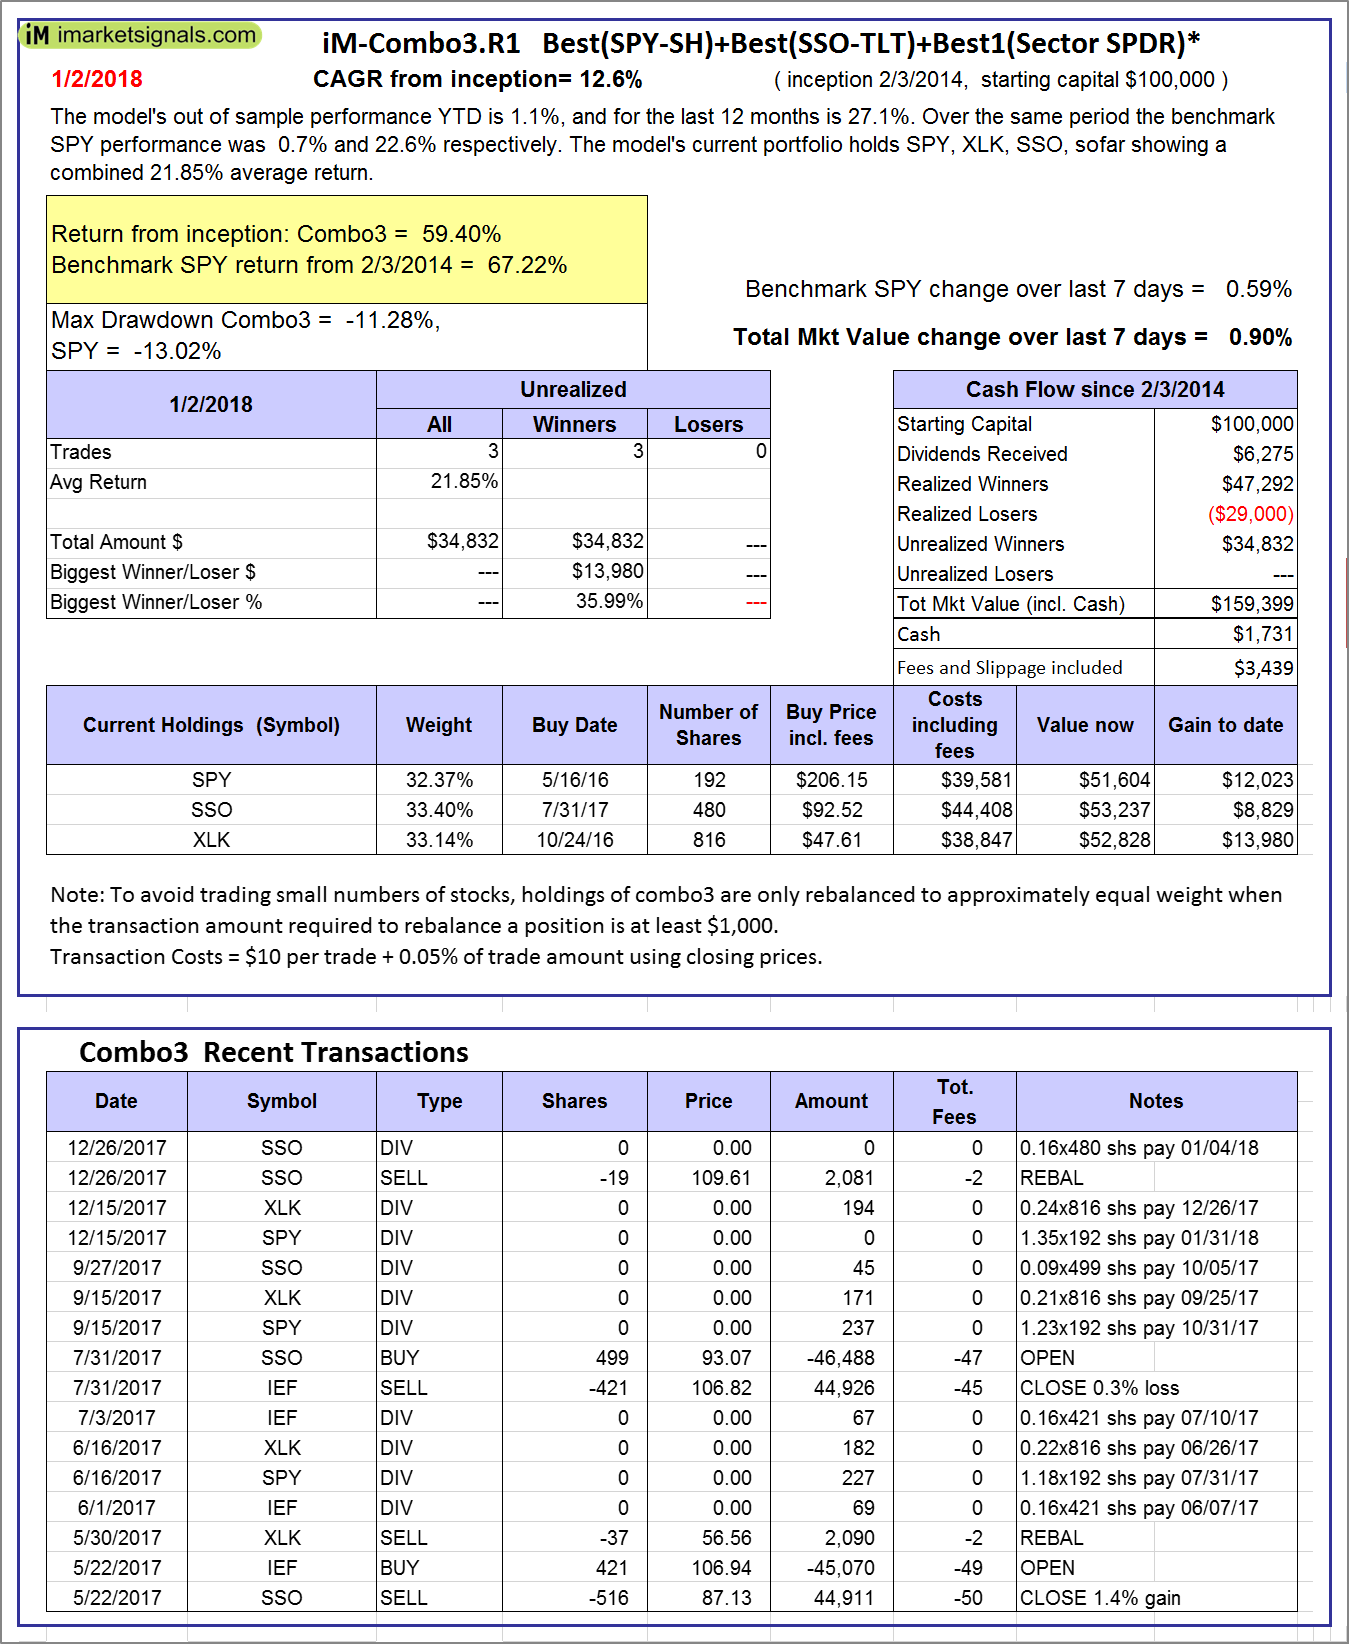
iM-Combo3.R1: The model’s out of sample performance YTD is 1.1%, and for the last 12 months is 27.1%. Over the same period the benchmark SPY performance was 0.7% and 22.6% respectively. Over the previous week the market value of iM-Combo3.R1 gained 0.90% at a time when SPY gained 0.59%. A starting capital of $100,000 at inception on 2/3/2014 would have grown to $159,399 which includes $1,731 cash and excludes $3,439 spent on fees and slippage. |
|
|
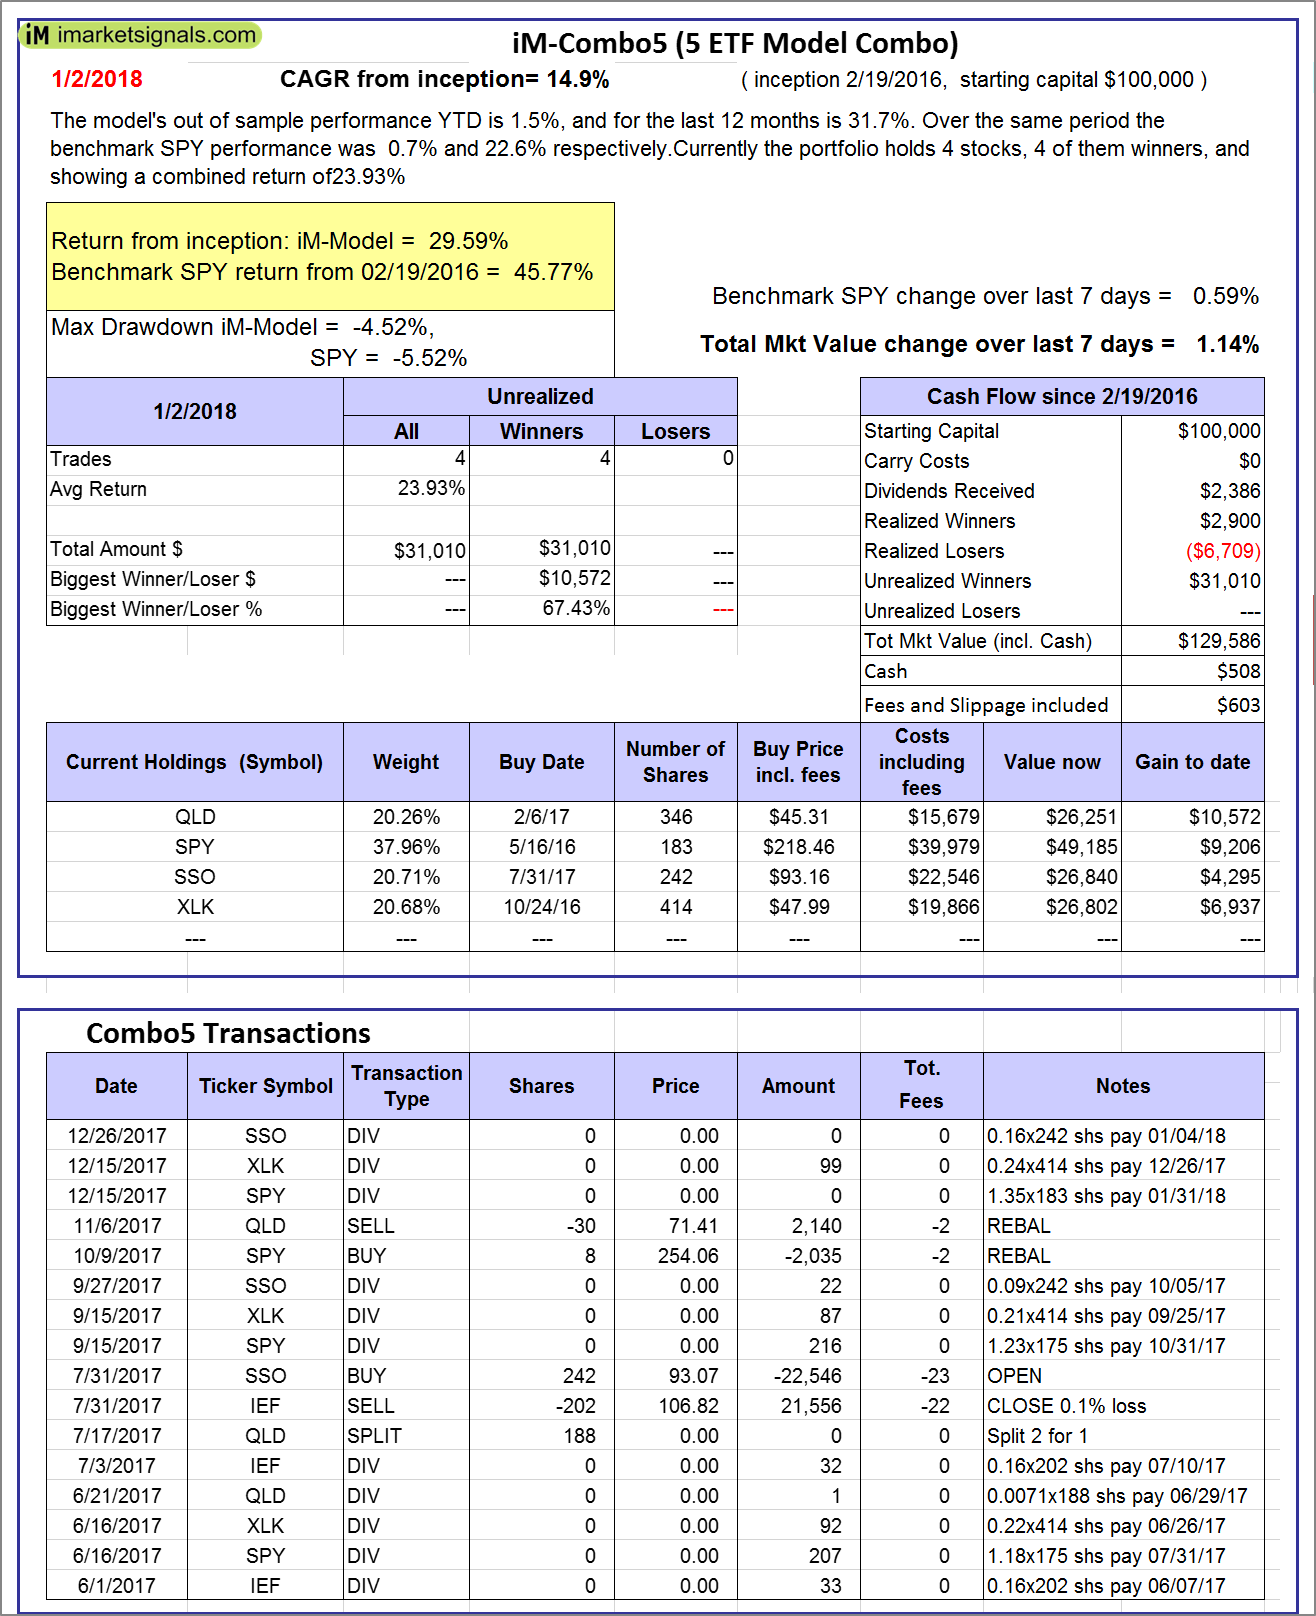
iM-Combo5: The model’s out of sample performance YTD is 1.5%, and for the last 12 months is 31.7%. Over the same period the benchmark SPY performance was 0.7% and 22.6% respectively. Over the previous week the market value of iM-Combo5 gained 1.14% at a time when SPY gained 0.59%. A starting capital of $100,000 at inception on 2/22/2016 would have grown to $129,586 which includes $508 cash and excludes $603 spent on fees and slippage. |
|
|
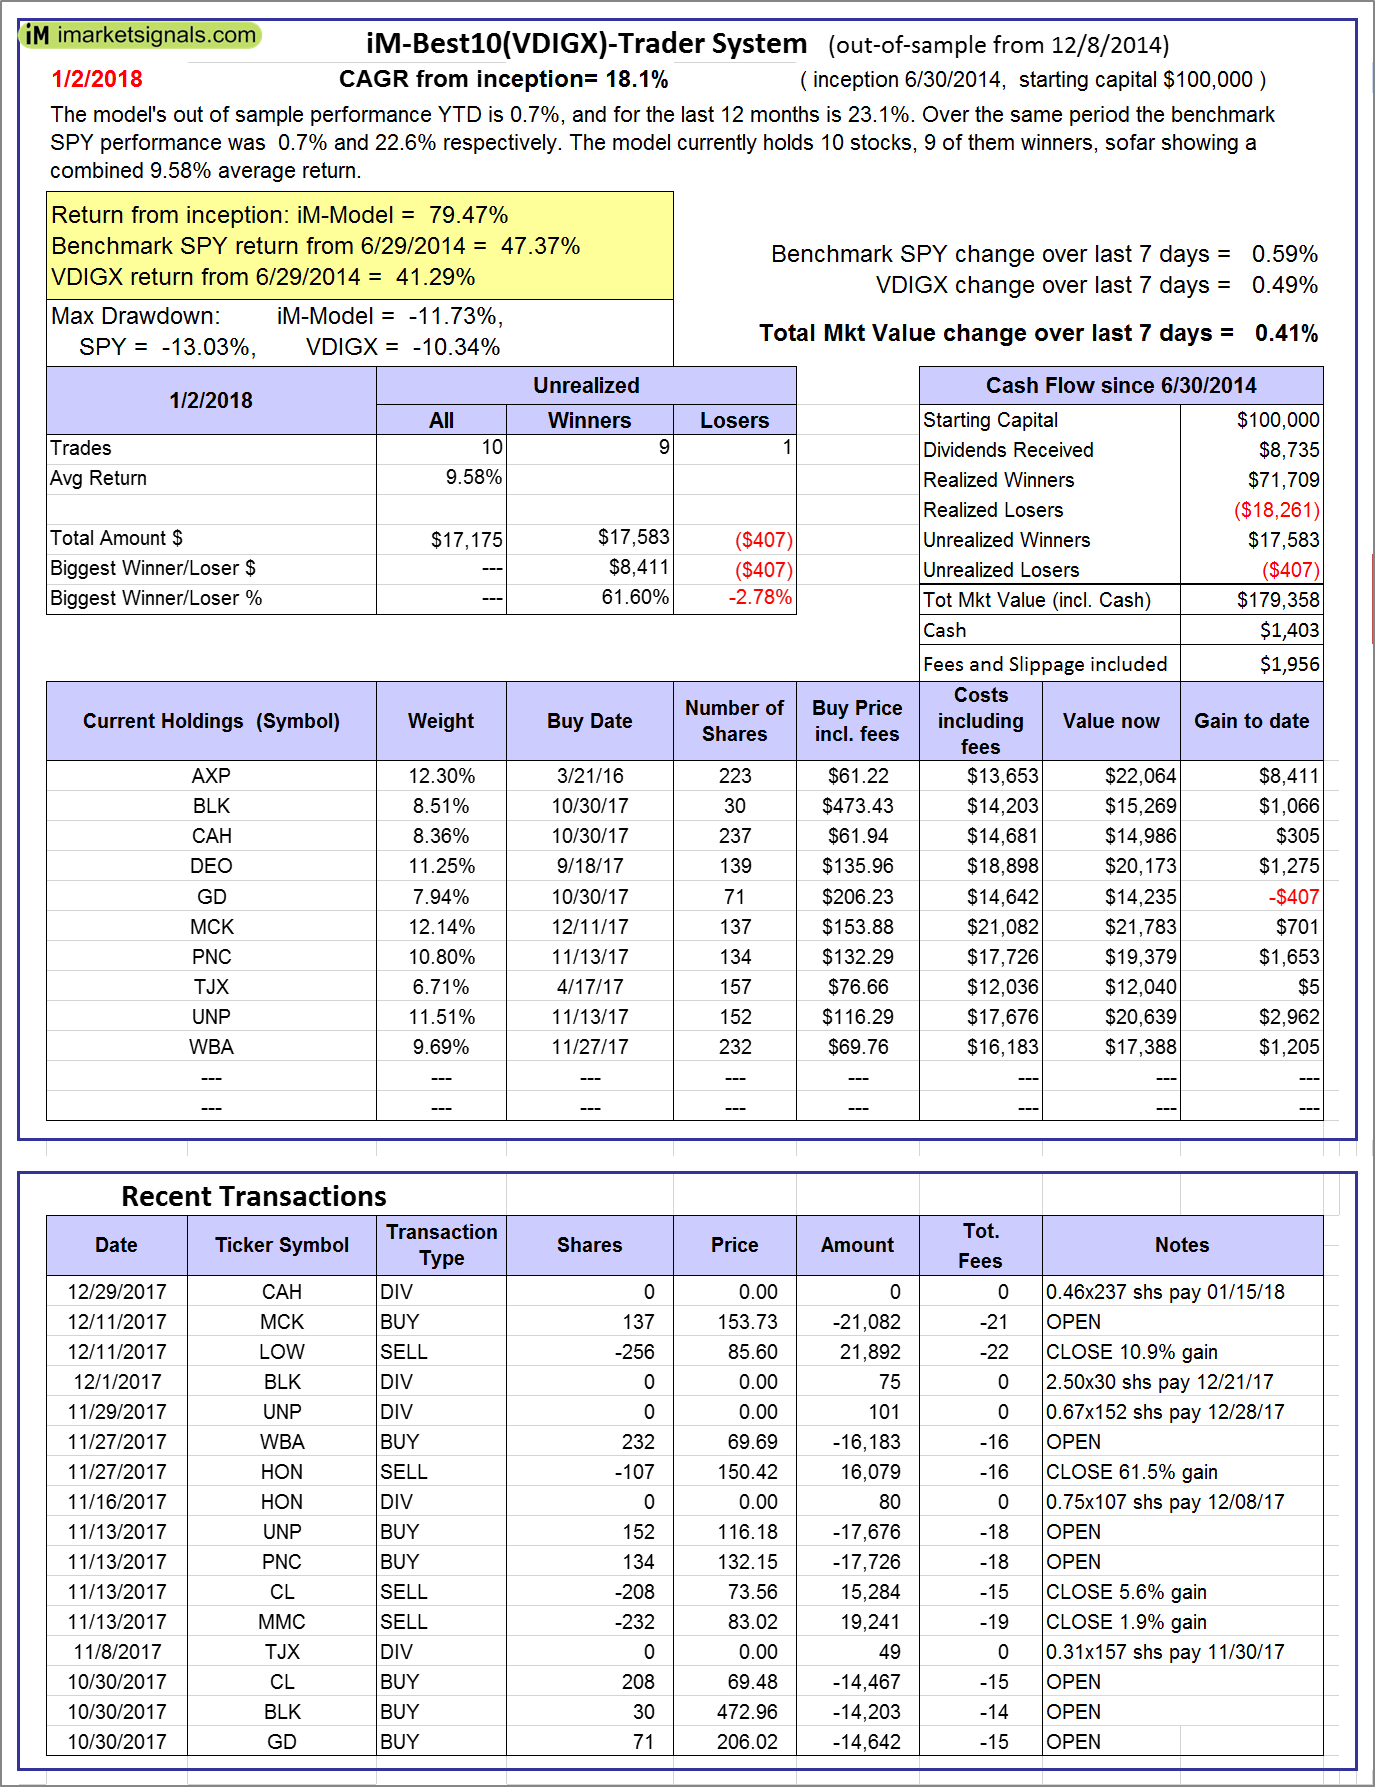
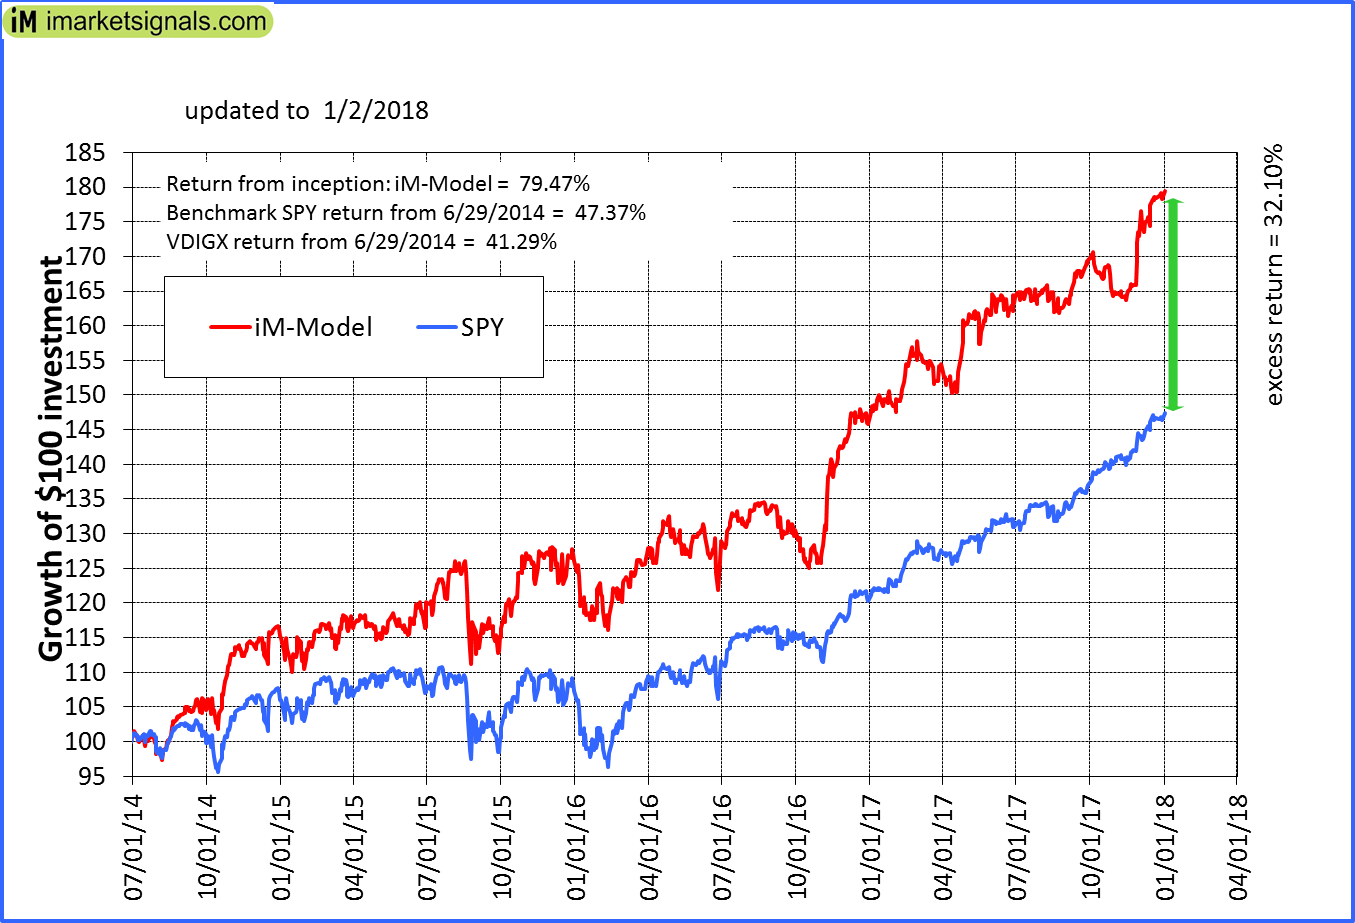
iM-Best10(VDIGX)-Trader: The model’s out of sample performance YTD is 0.7%, and for the last 12 months is 23.1%. Over the same period the benchmark SPY performance was 0.7% and 22.6% respectively. Since inception, on 7/1/2014, the model gained 79.47% while the benchmark SPY gained 47.37% and VDIGX gained 41.29% over the same period. Over the previous week the market value of iM-Best10(VDIGX) gained 0.41% at a time when SPY gained 0.59%. A starting capital of $100,000 at inception on 7/1/2014 would have grown to $179,358 which includes $1,403 cash and excludes $1,956 spent on fees and slippage. |
|
|
iM-BESTOGA-3: The model’s out of sample performance YTD is -0.2%, and for the last 12 months is 14.3%. Over the same period the benchmark SPY performance was 0.7% and 22.6% respectively. Over the previous week the market value of iM-BESTOGA-3 gained -0.39% at a time when SPY gained 0.59%. A starting capital of $100,000 at inception on 2/3/2014 would have grown to $230,614 which includes $1,589 cash and excludes $1,818 spent on fees and slippage. |
|
|
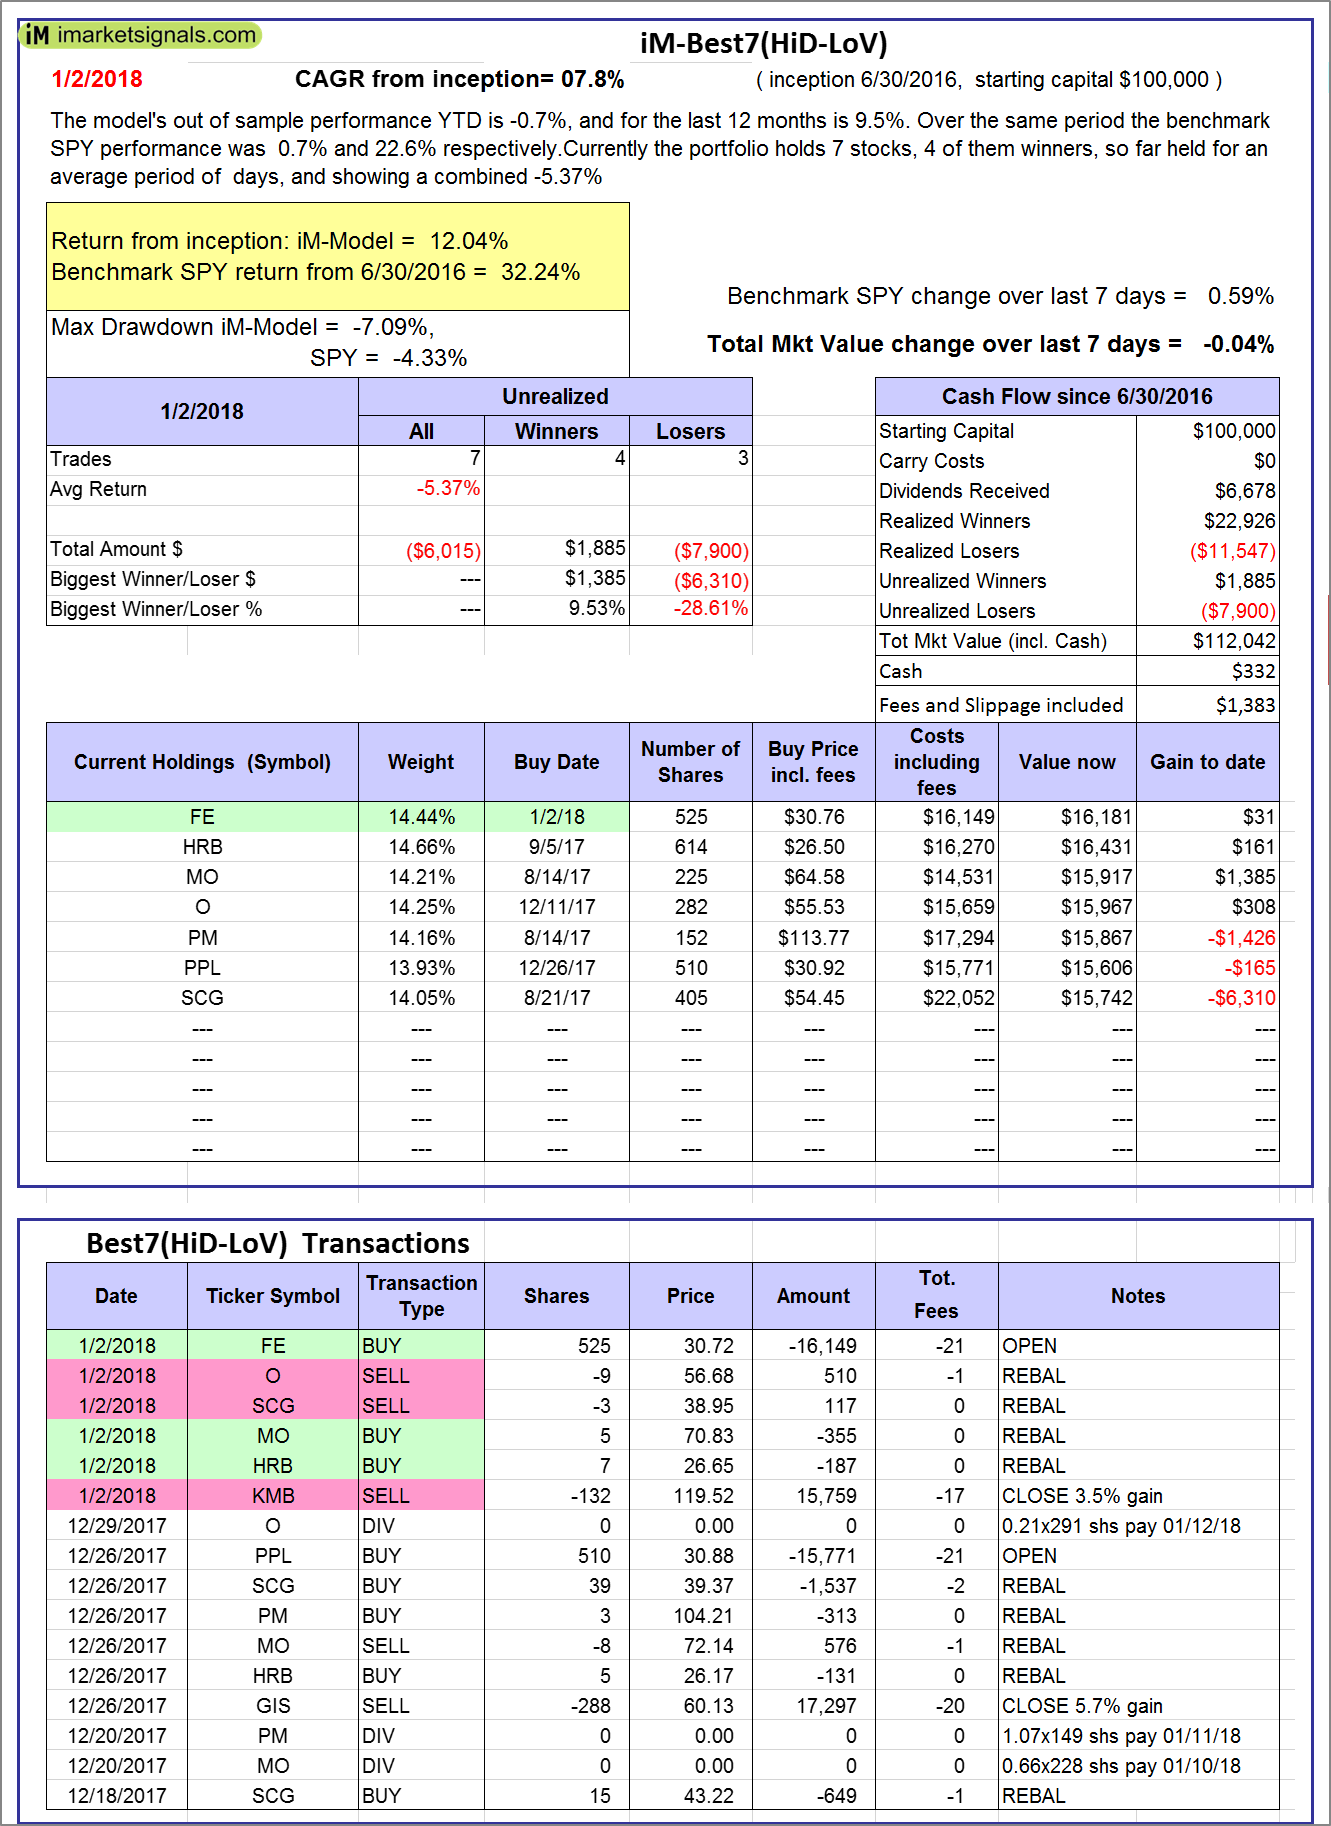
iM-Best7(HiD-LoV): The model’s out of sample performance YTD is -0.7%, and for the last 12 months is 9.5%. Over the same period the benchmark SPY performance was 0.7% and 22.6% respectively. Over the previous week the market value of iM-BESTOGA-3 gained -0.04% at a time when SPY gained 0.59%. A starting capital of $100,000 at inception on 6/30/2016 would have grown to $112,042 which includes $332 cash and excludes $1,383 spent on fees and slippage. |
|
|
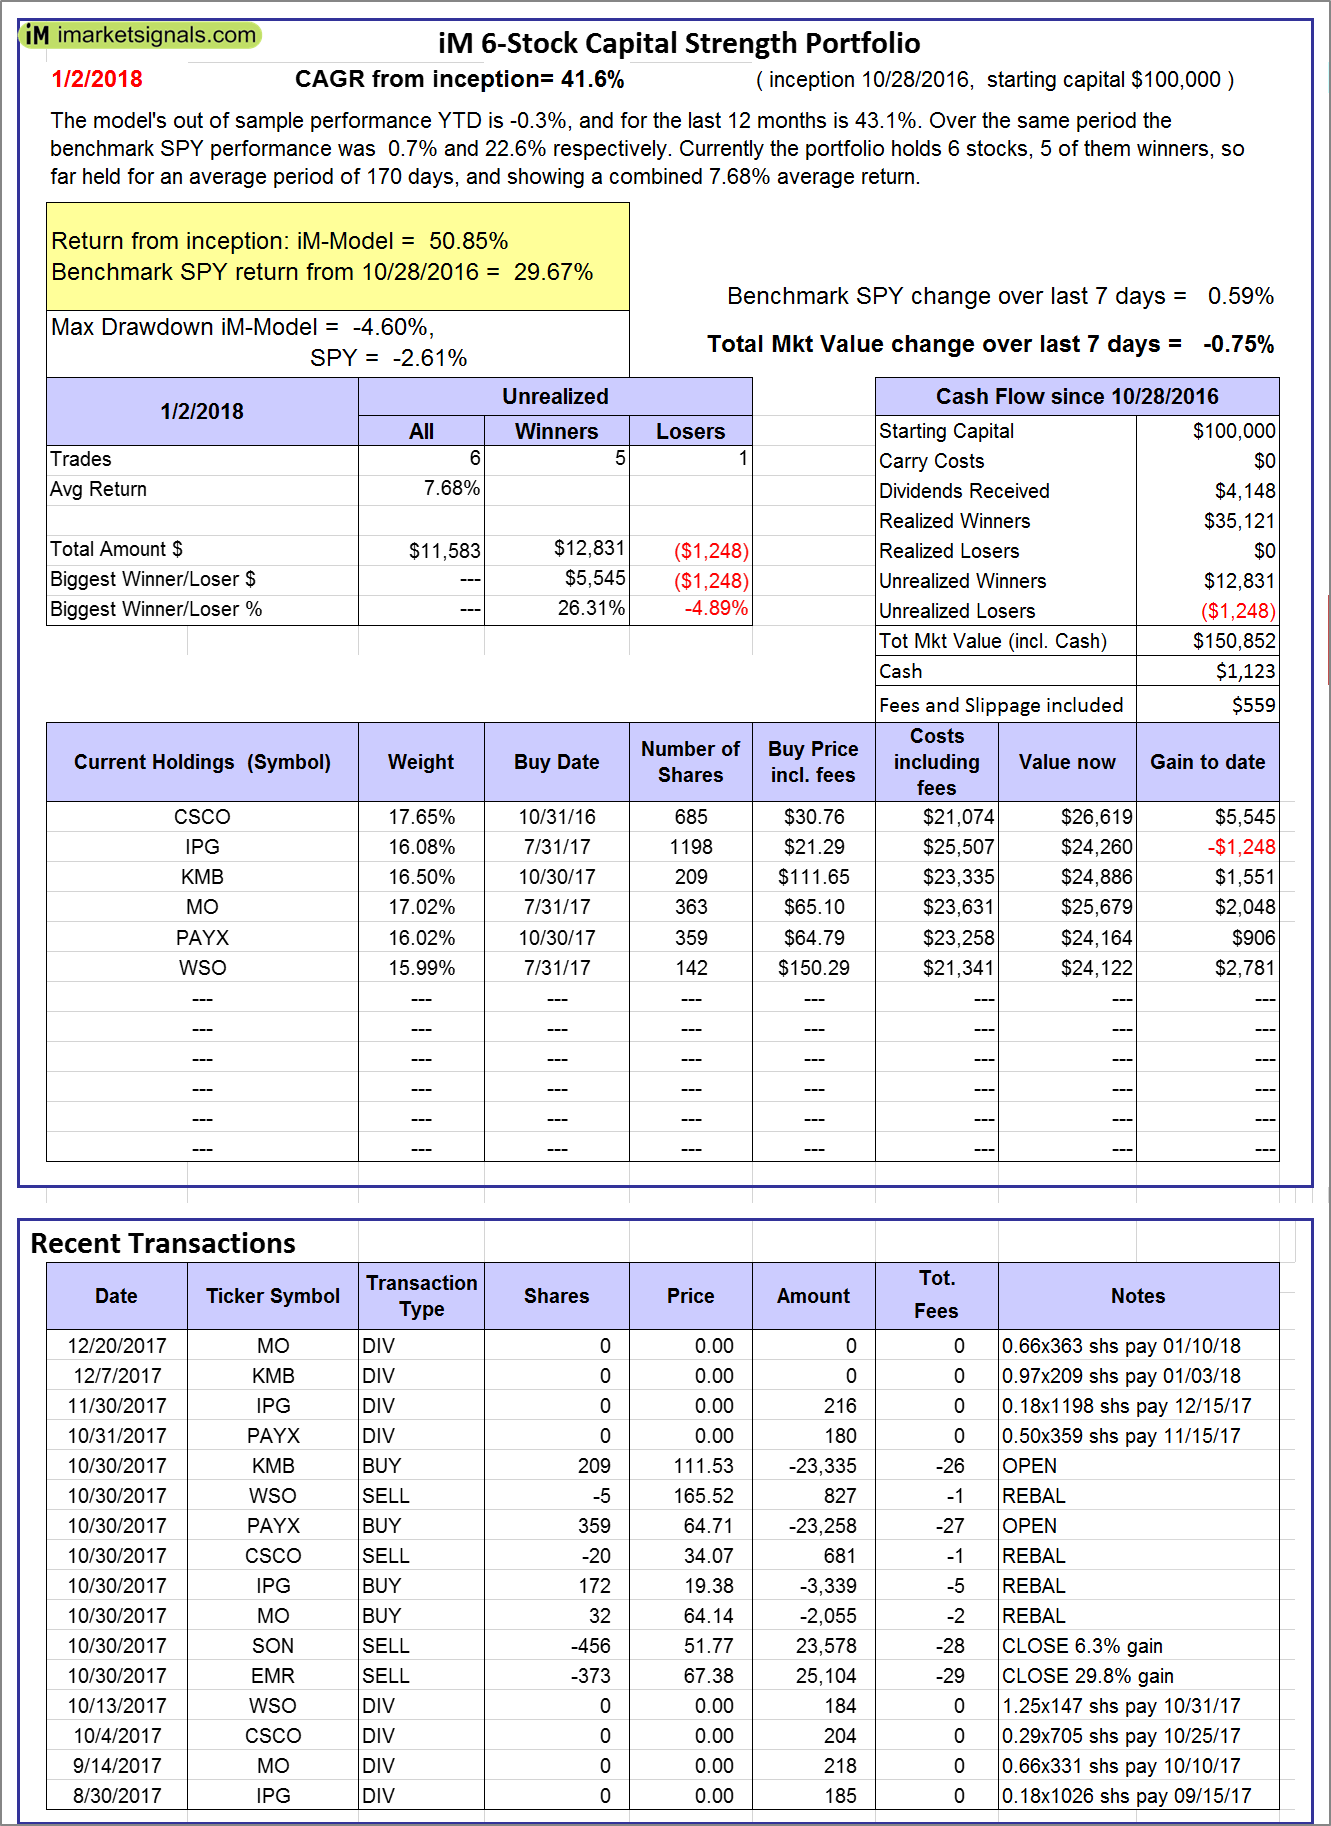
iM 6-Stock Capital Strength Portfolio: The model’s out of sample performance YTD is -0.3%, and for the last 12 months is 43.1%. Over the same period the benchmark SPY performance was 0.7% and 22.6% respectively. Over the previous week the market value of the iM 6-Stock Capital Strength Portfolio gained -0.75% at a time when SPY gained 0.59%. A starting capital of $100,000 at inception on 10/28/2016 would have grown to $150,852 which includes $1,123 cash and excludes $559 spent on fees and slippage. |
|
|
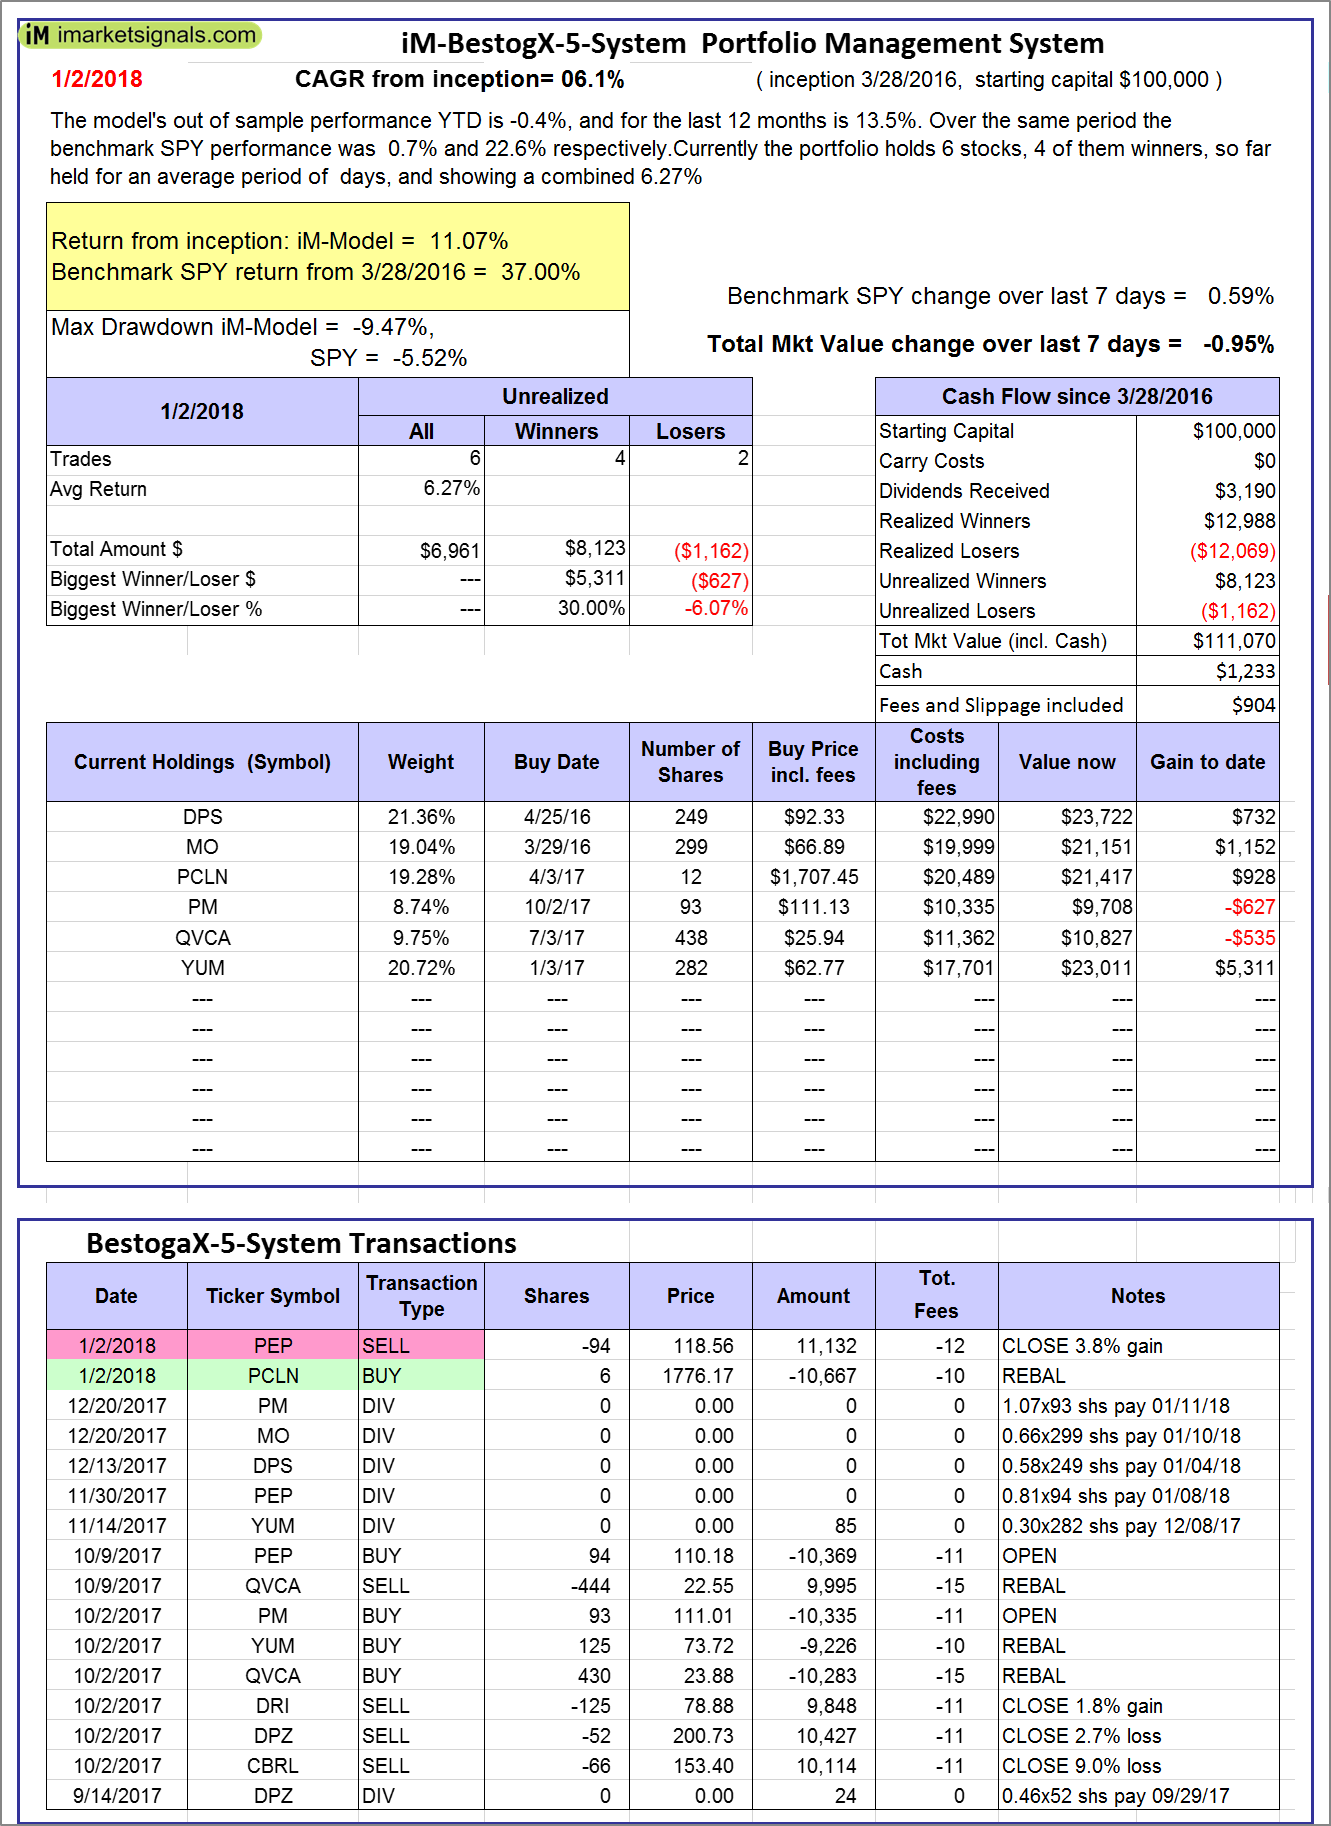
iM-BestogaX5-System: The model’s out of sample performance YTD is -0.4%, and for the last 12 months is 13.5%. Over the same period the benchmark SPY performance was 0.7% and 22.6% respectively. Over the previous week the market value of iM-Best8(S&P 500)Tax-Eff. gained -0.95% at a time when SPY gained 0.59%. A starting capital of $100,000 at inception on 3/28/2016 would have grown to $111,070 which includes $1,233 cash and excludes $904 spent on fees and slippage. |
|
|
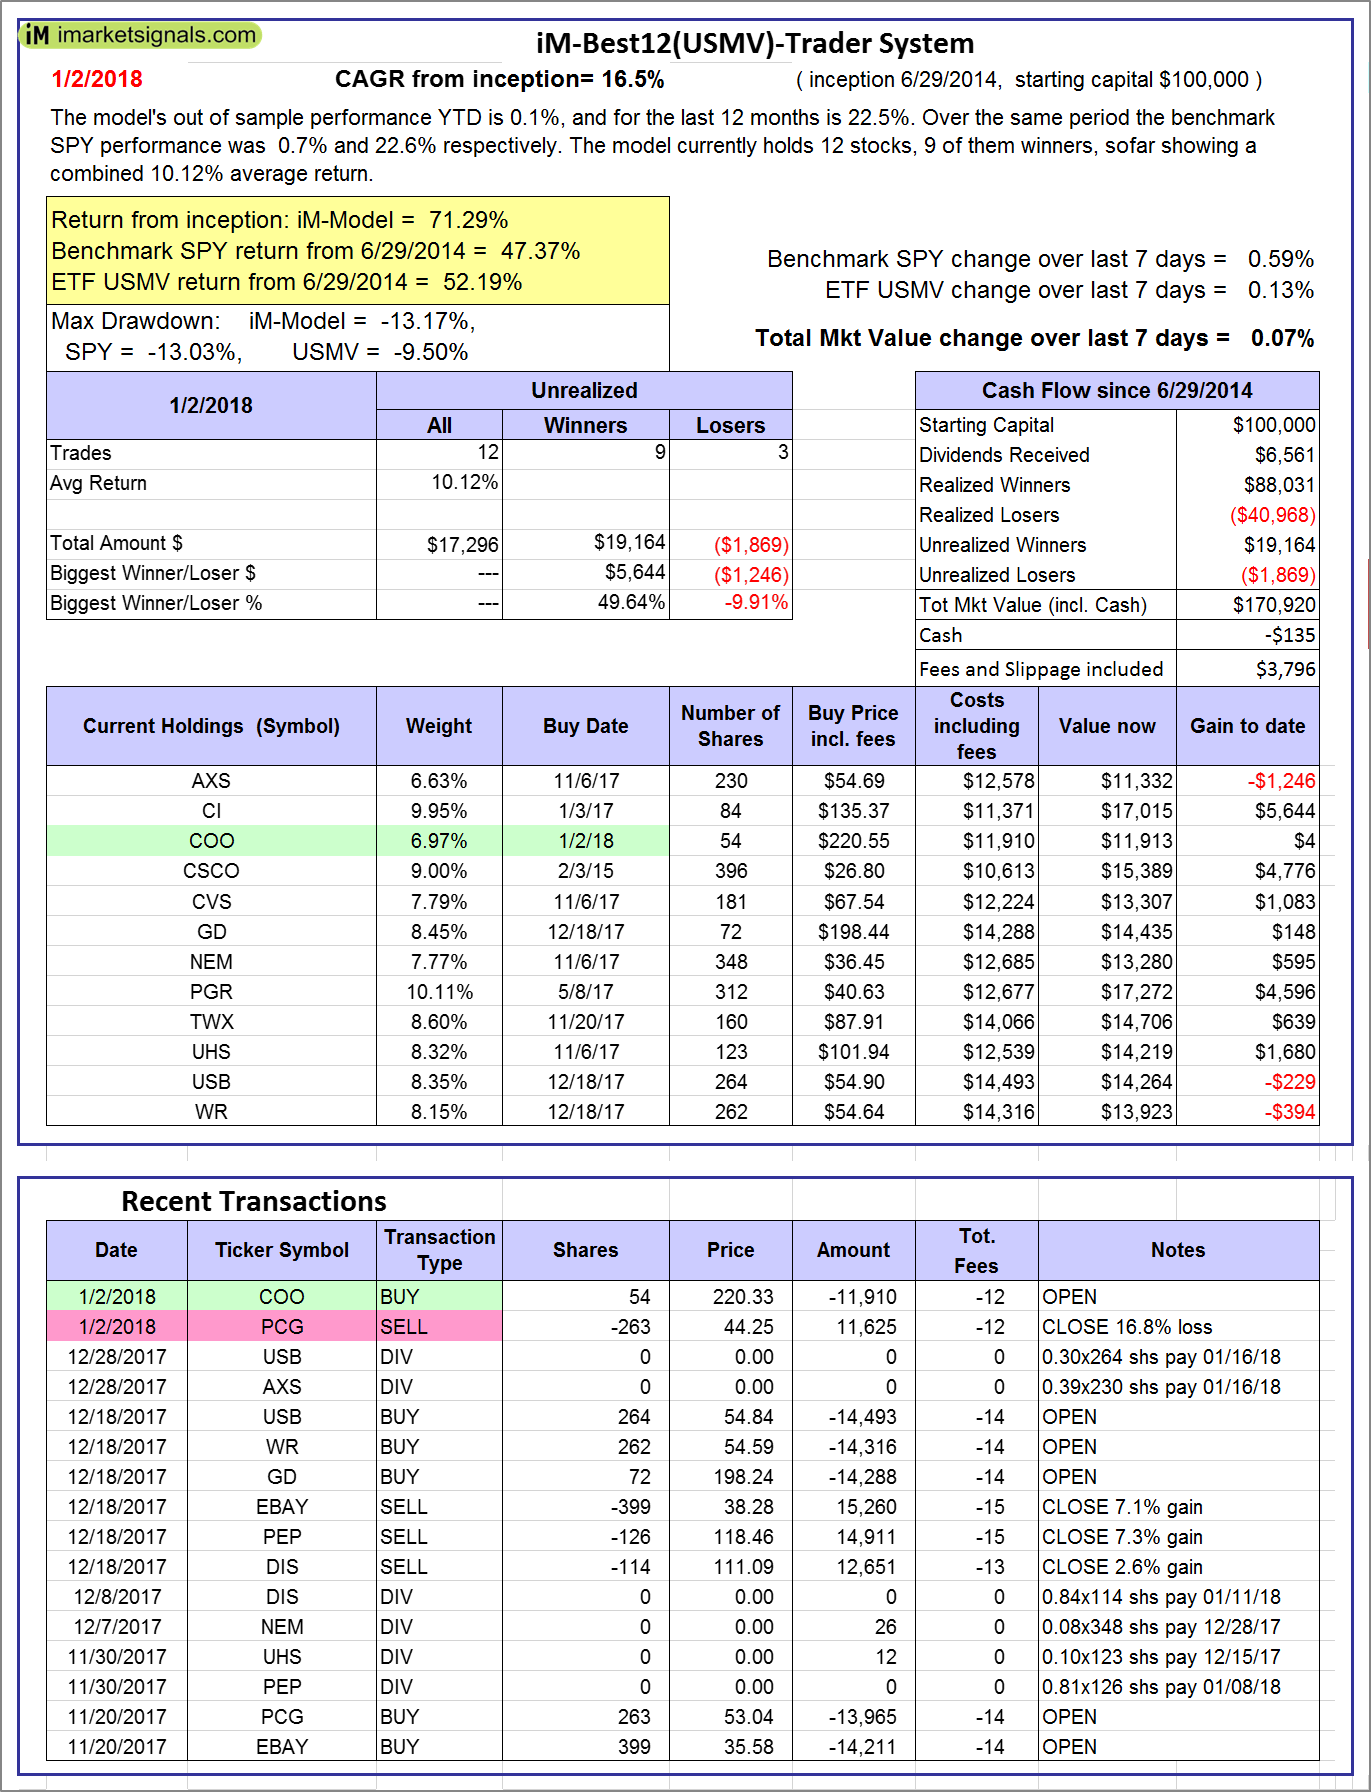
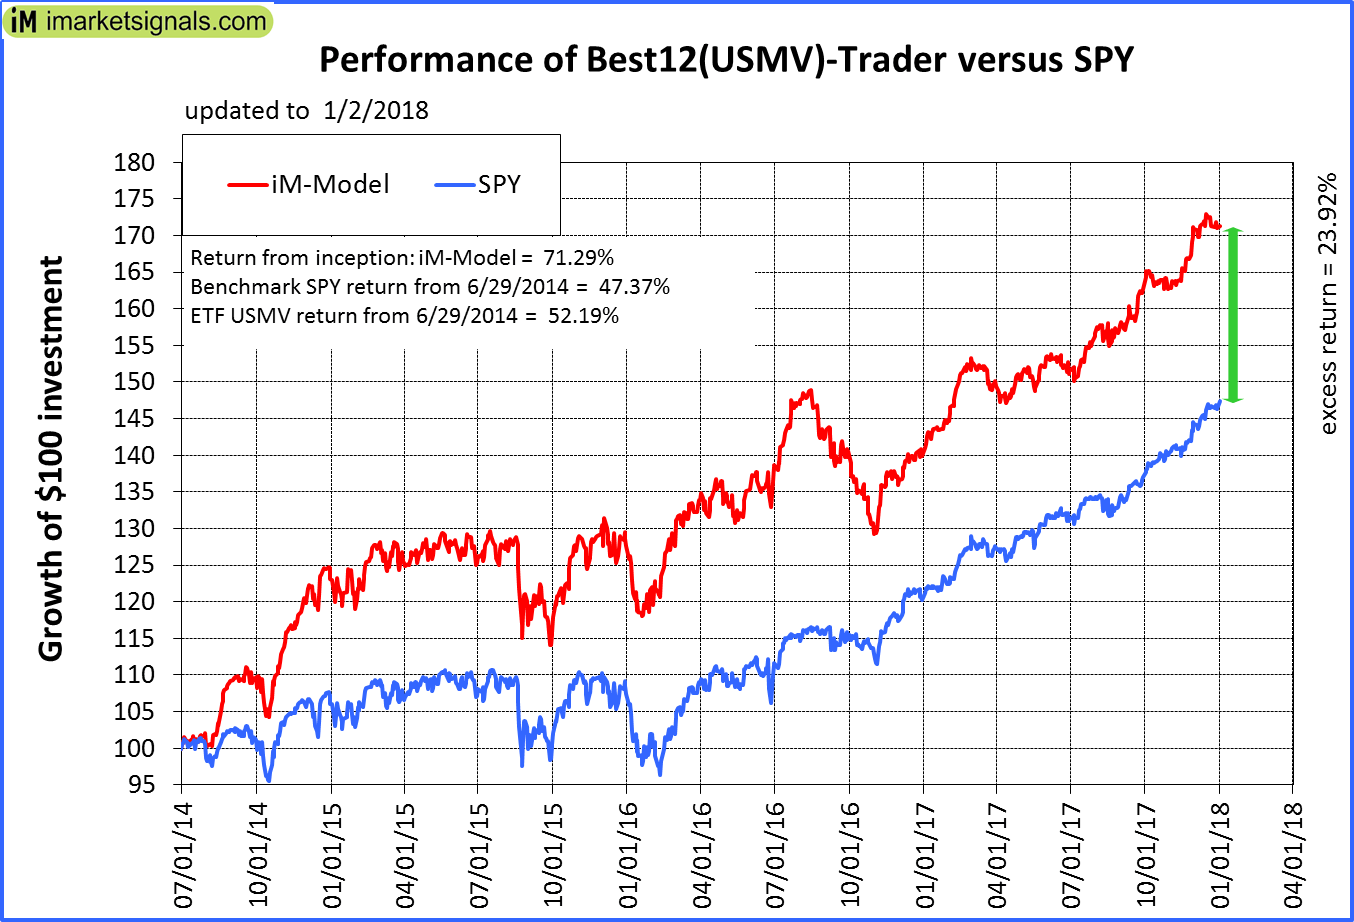
iM-Best12(USMV)-Trader: The model’s out of sample performance YTD is 0.1%, and for the last 12 months is 22.5%. Over the same period the benchmark SPY performance was 0.7% and 22.6% respectively. Since inception, on 6/30/2014, the model gained 71.29% while the benchmark SPY gained 47.37% and the ETF USMV gained 52.19% over the same period. Over the previous week the market value of iM-Best12(USMV)-Trader gained 0.07% at a time when SPY gained 0.59%. A starting capital of $100,000 at inception on 6/30/2014 would have grown to $170,920 which includes -$135 cash and excludes $3,796 spent on fees and slippage. |
|
|
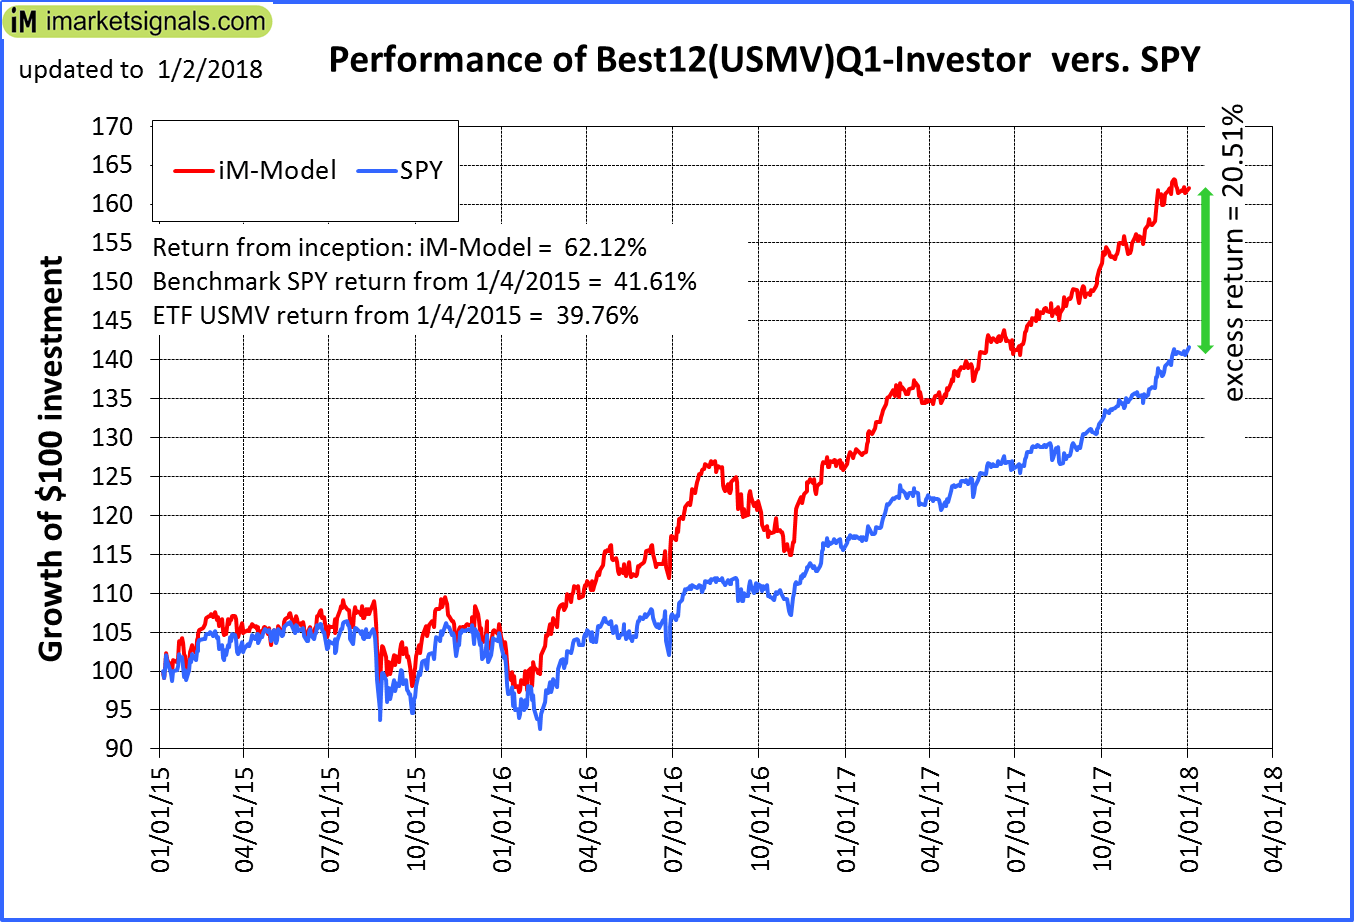
iM-Best12(USMV)Q1-Investor: The model’s out of sample performance YTD is 0.4%, and for the last 12 months is 28.8%. Over the same period the benchmark SPY performance was 0.7% and 22.6% respectively. Since inception, on 1/5/2015, the model gained 62.12% while the benchmark SPY gained 41.61% and the ETF USMV gained 39.76% over the same period. Over the previous week the market value of iM-Best12(USMV)Q1 gained 0.23% at a time when SPY gained 0.59%. A starting capital of $100,000 at inception on 1/5/2015 would have grown to $161,797 which includes $326 cash and excludes $871 spent on fees and slippage. |
|
|
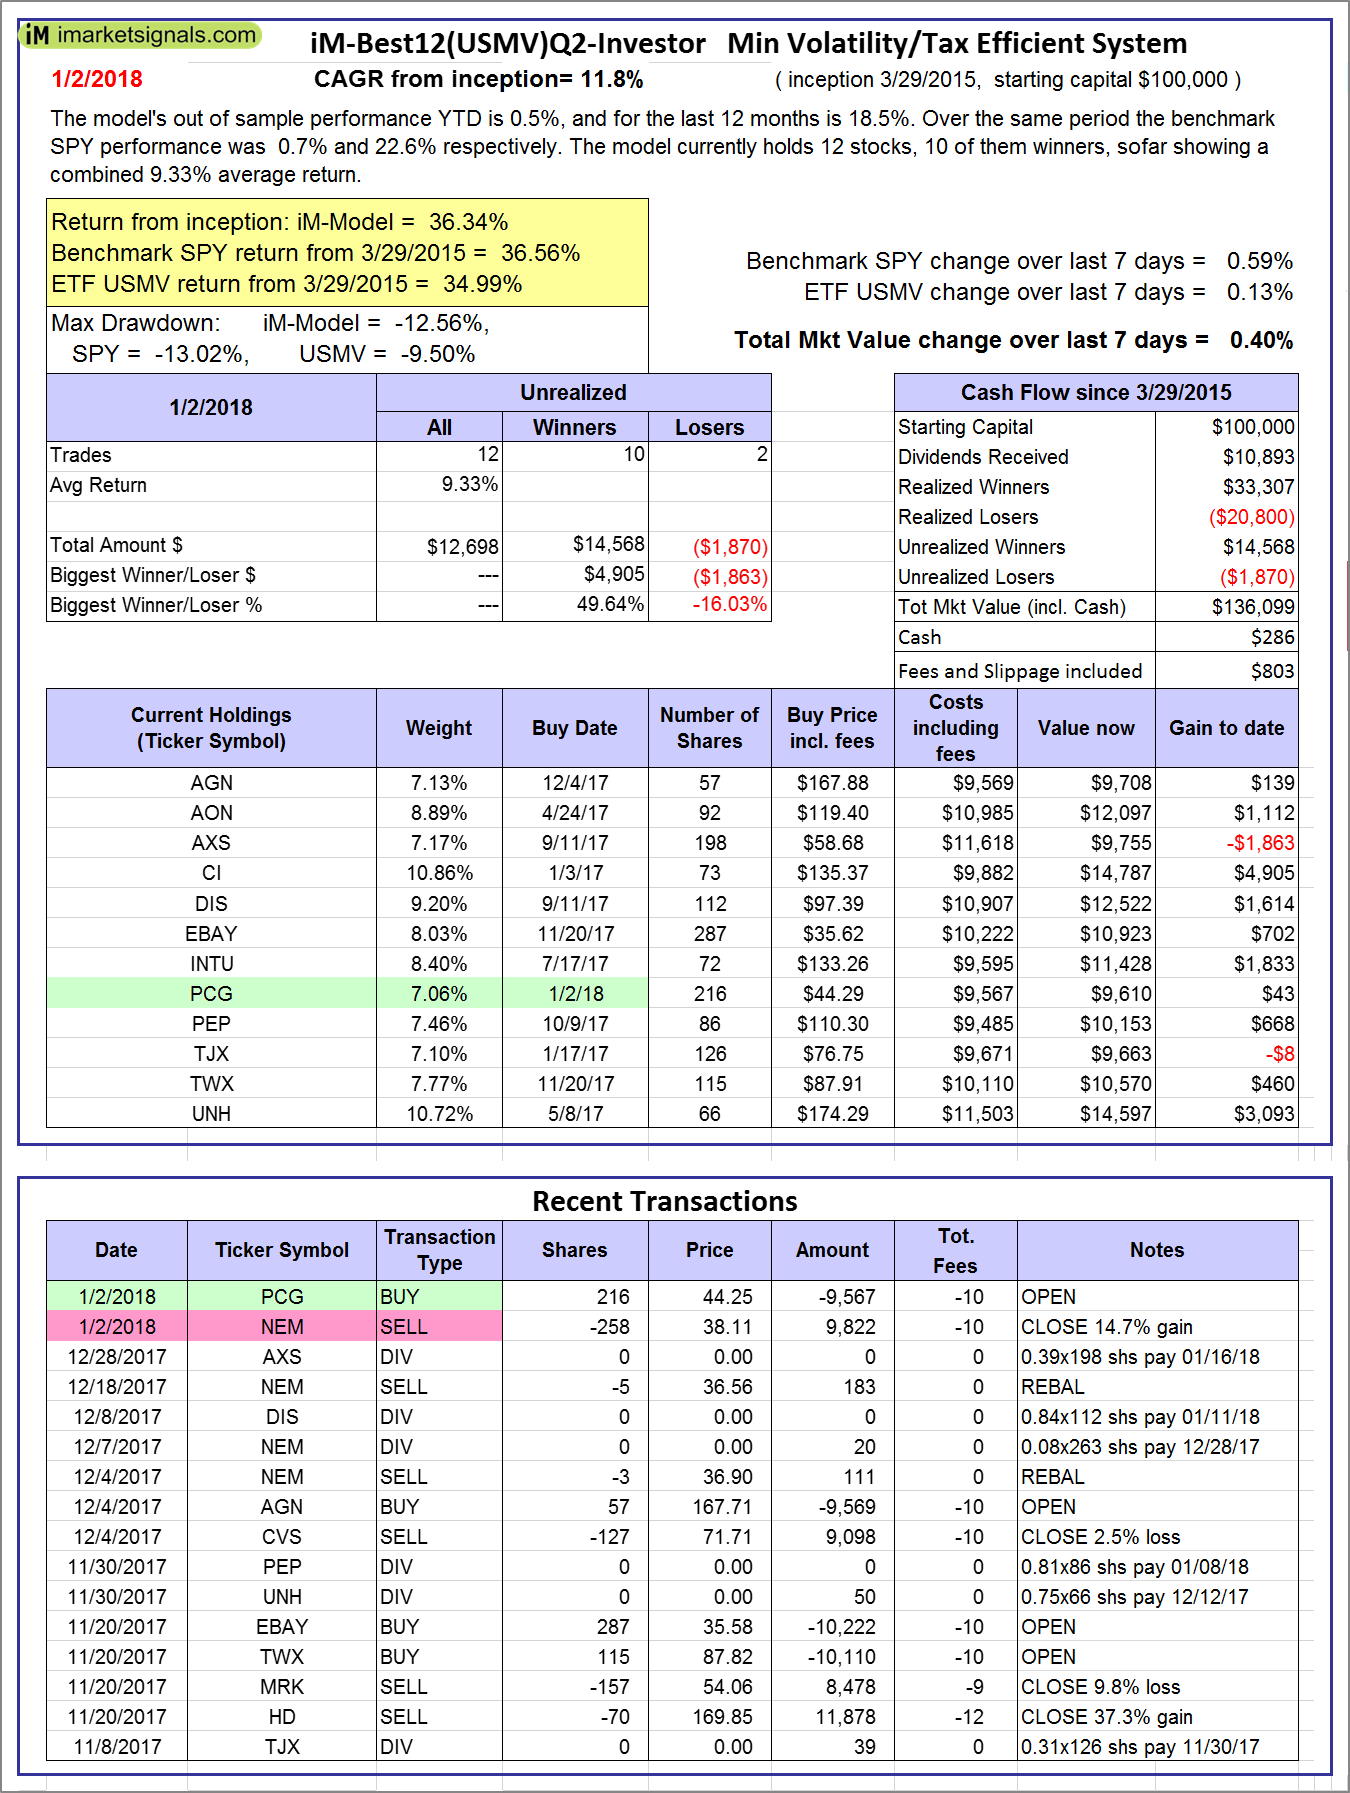
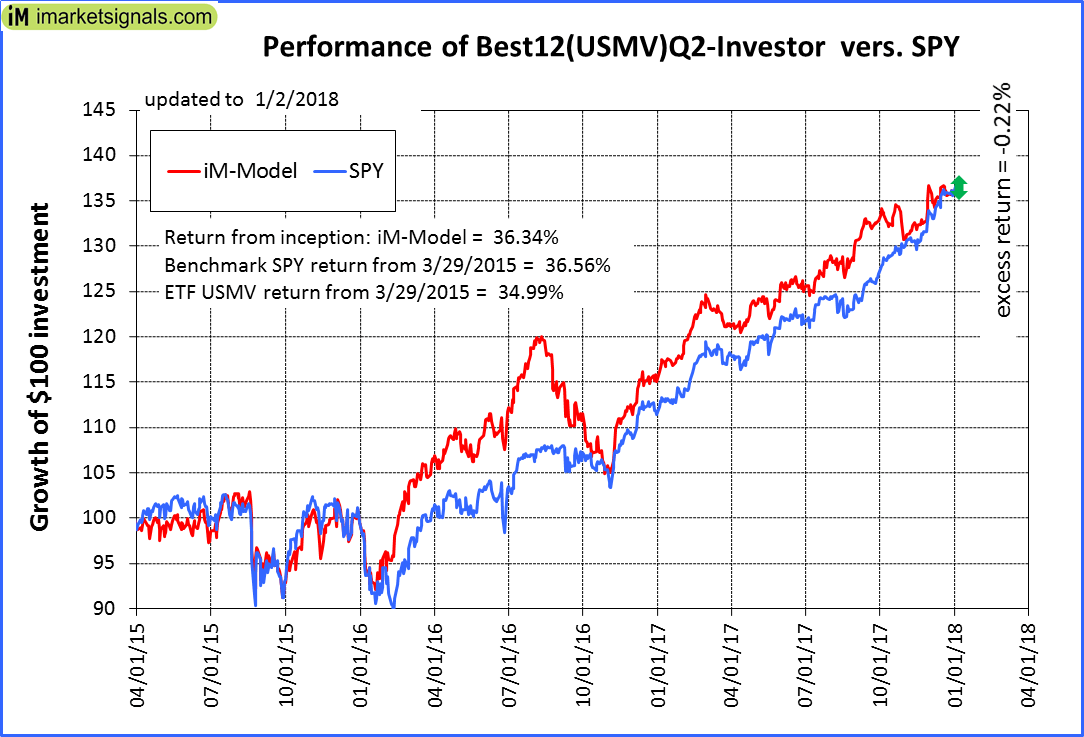
iM-Best12(USMV)Q2-Investor: The model’s out of sample performance YTD is 0.5%, and for the last 12 months is 18.5%. Over the same period the benchmark SPY performance was 0.7% and 22.6% respectively. Since inception, on 3/30/2015, the model gained 36.34% while the benchmark SPY gained 36.56% and the ETF USMV gained 34.99% over the same period. Over the previous week the market value of iM-Best12(USMV)Q2 gained 0.40% at a time when SPY gained 0.59%. A starting capital of $100,000 at inception on 3/30/2015 would have grown to $136,099 which includes $286 cash and excludes $803 spent on fees and slippage. |
|
|
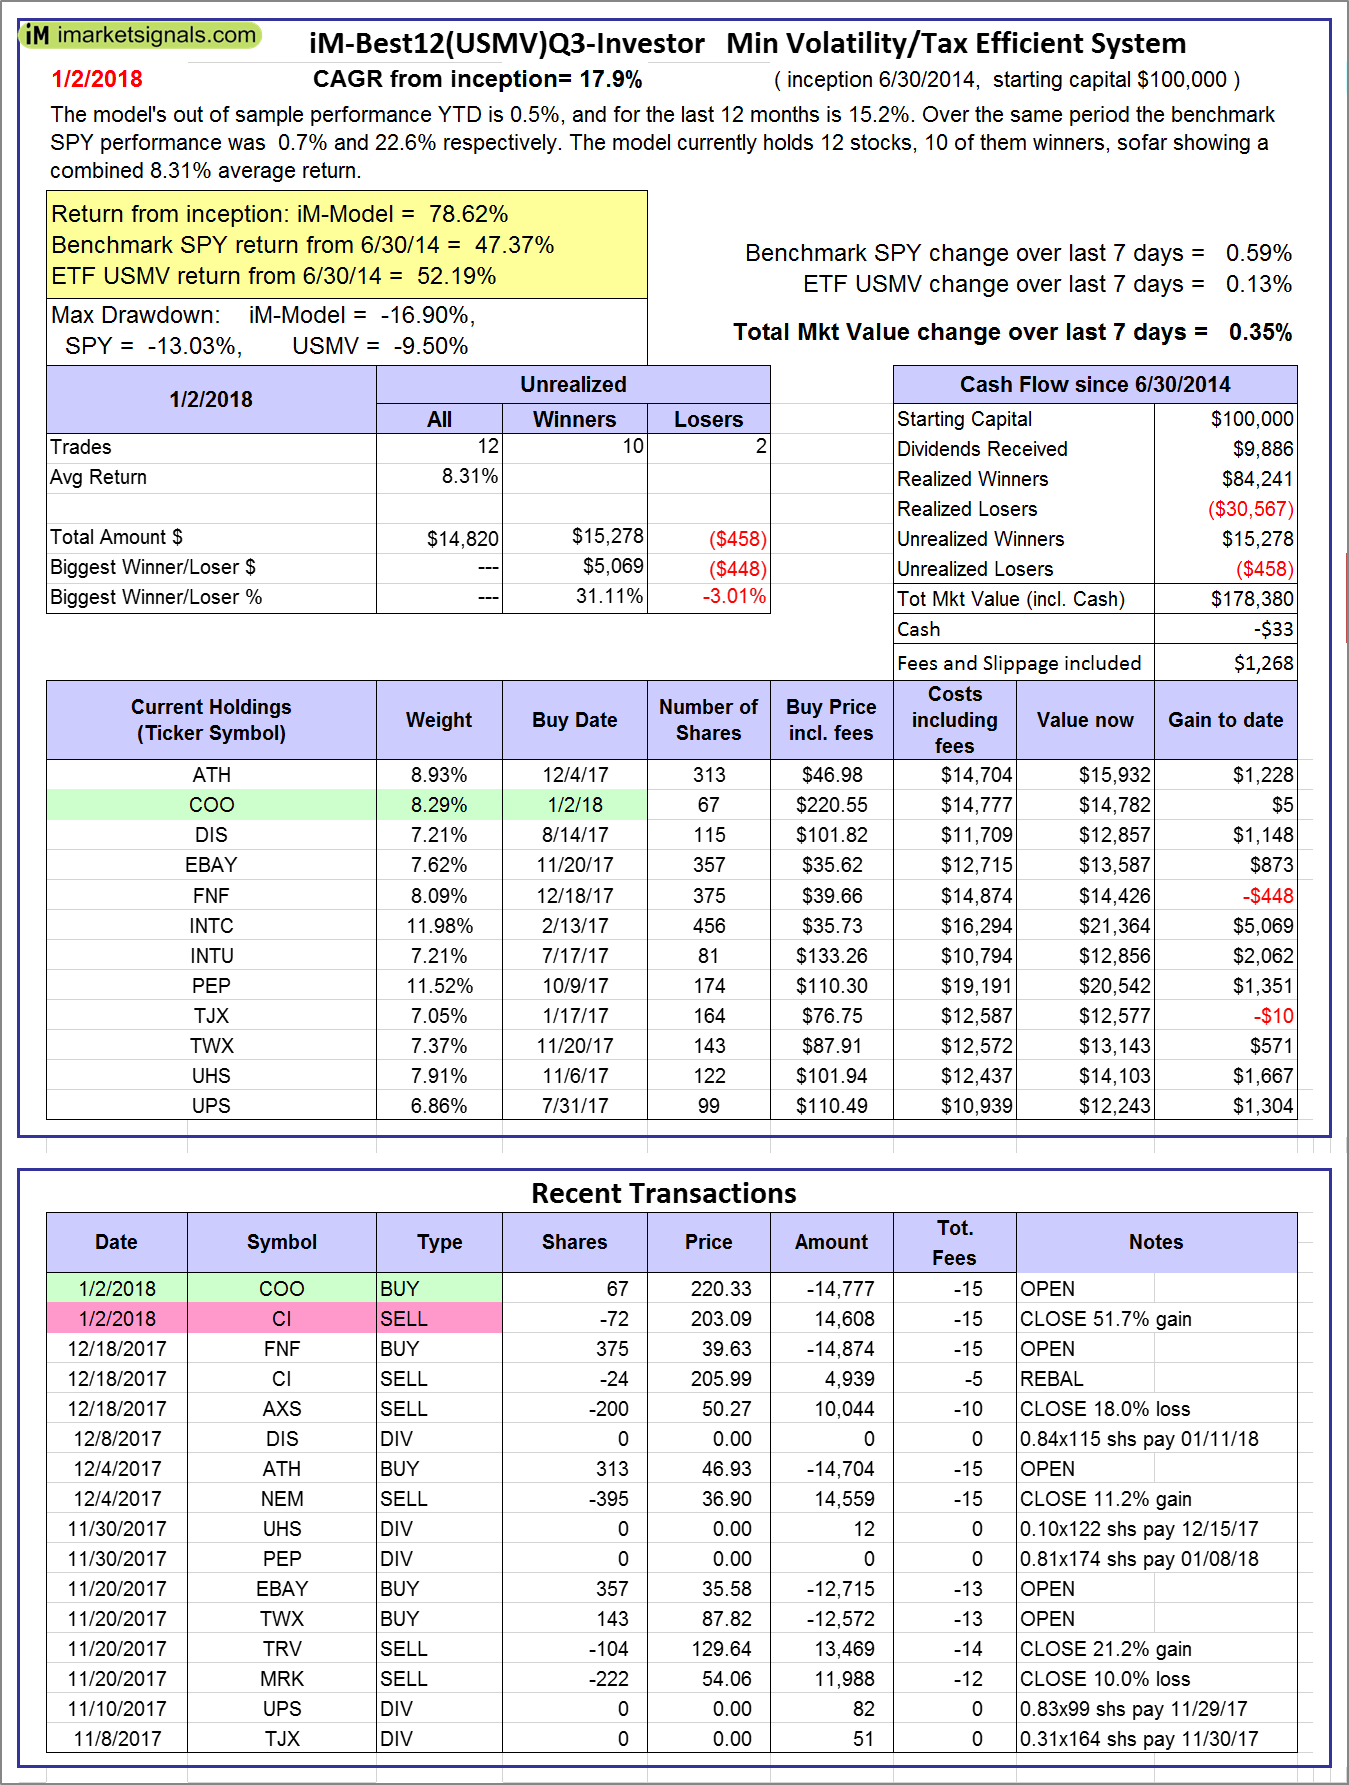
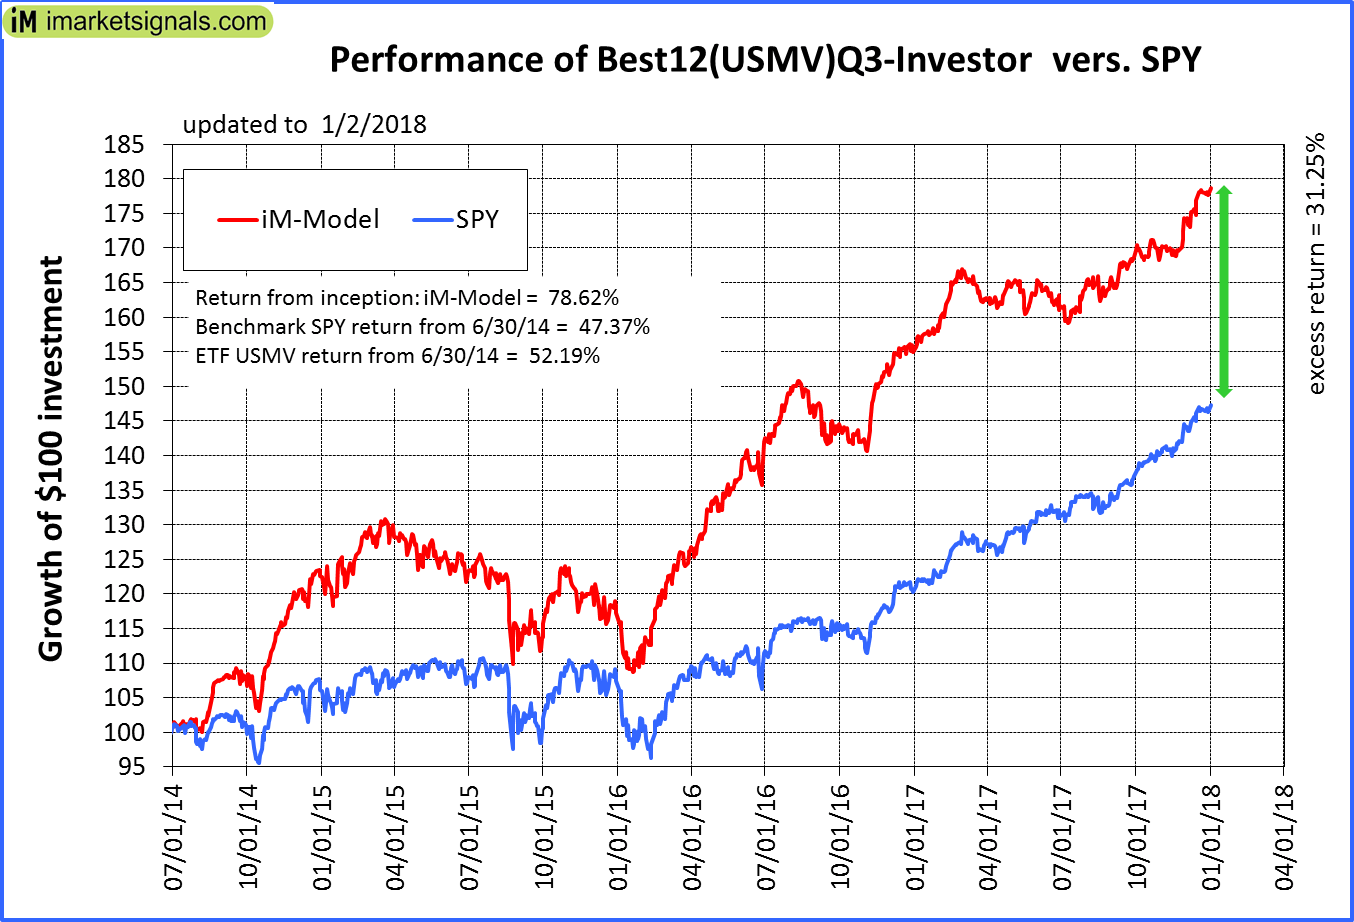
iM-Best12(USMV)Q3-Investor: The model’s out of sample performance YTD is 0.5%, and for the last 12 months is 15.2%. Over the same period the benchmark SPY performance was 0.7% and 22.6% respectively. Since inception, on 7/1/2014, the model gained 78.62% while the benchmark SPY gained 47.37% and the ETF USMV gained 52.19% over the same period. Over the previous week the market value of iM-Best12(USMV)Q3 gained 0.35% at a time when SPY gained 0.59%. A starting capital of $100,000 at inception on 7/1/2014 would have grown to $178,380 which includes -$33 cash and excludes $1,268 spent on fees and slippage. |
|
|
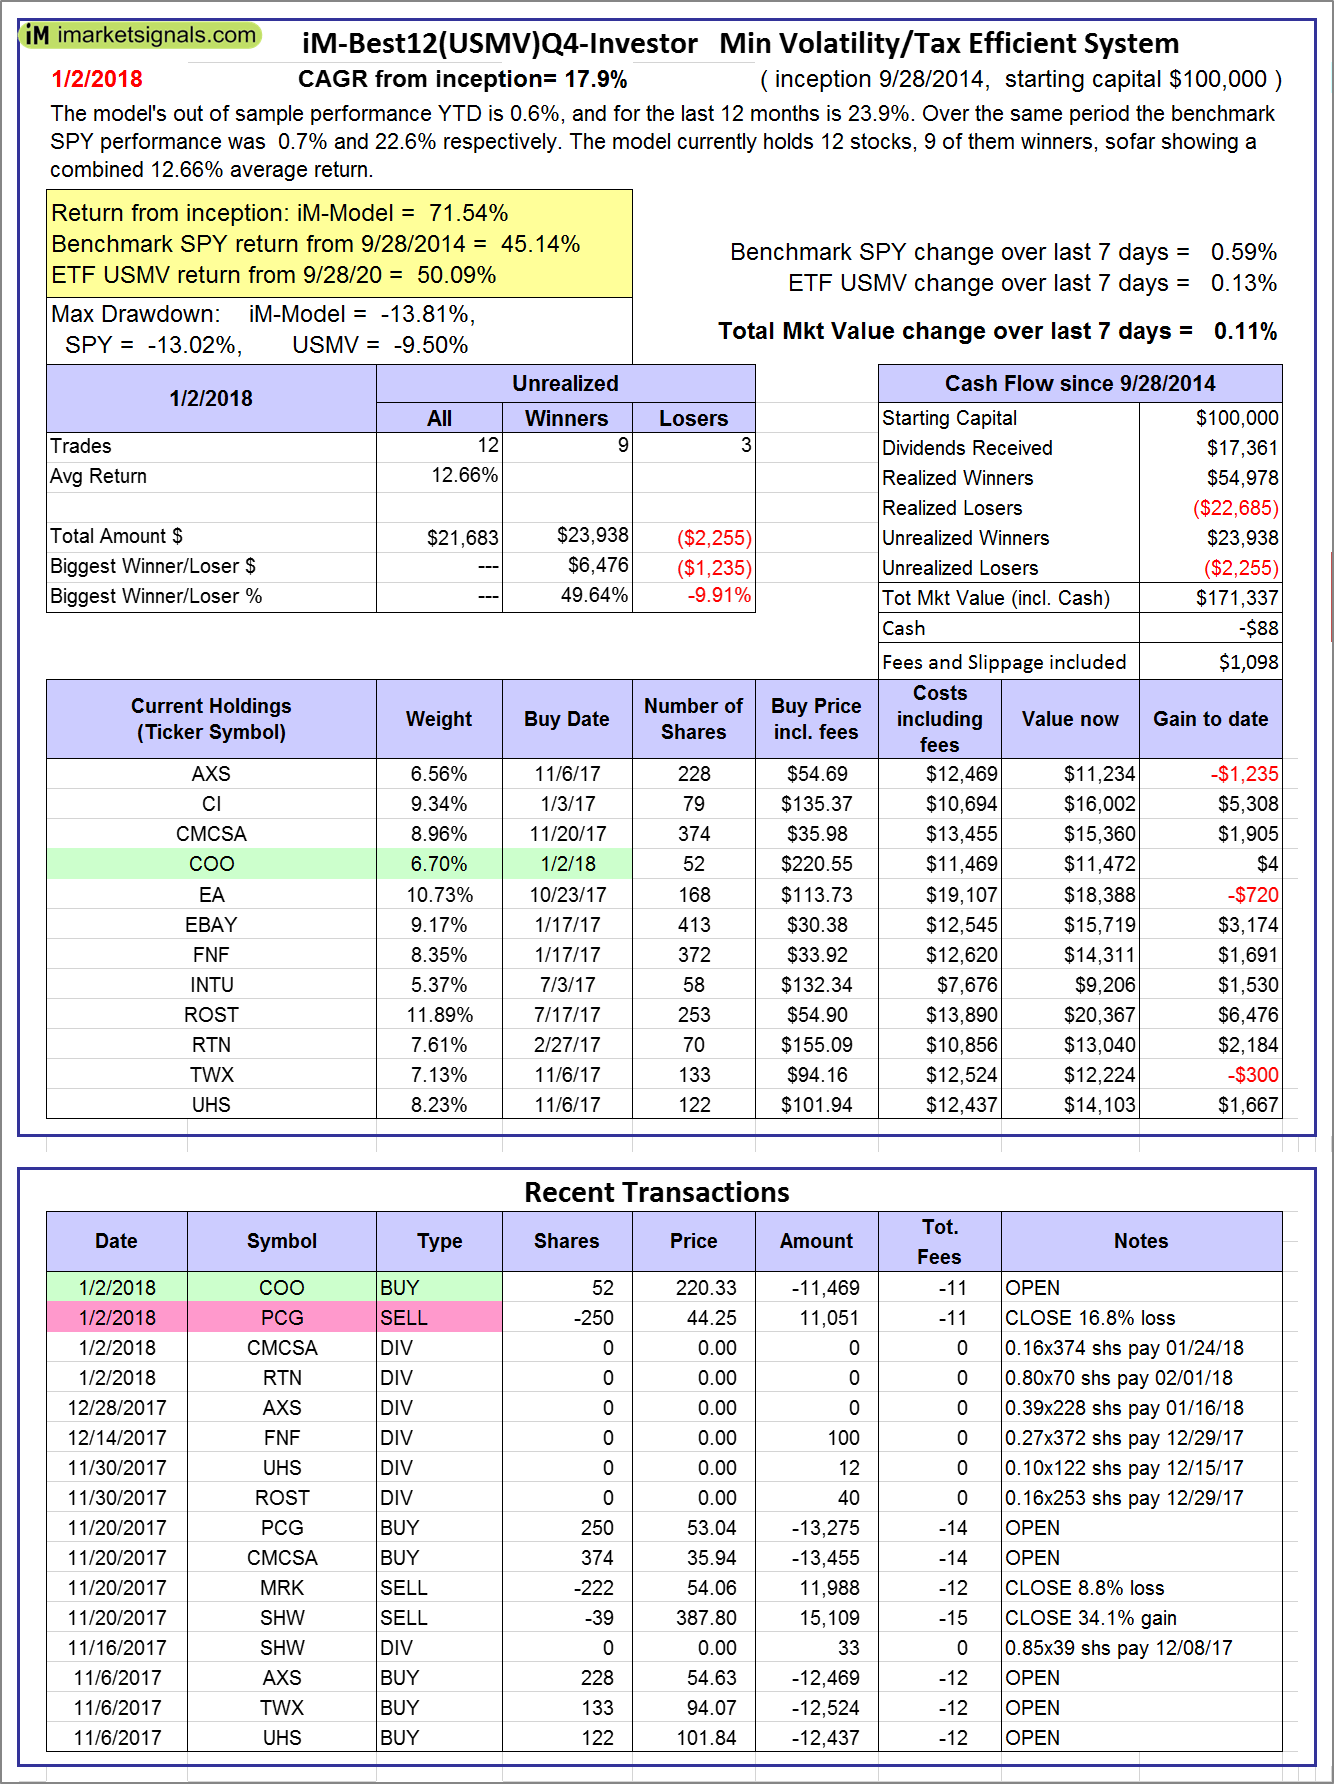
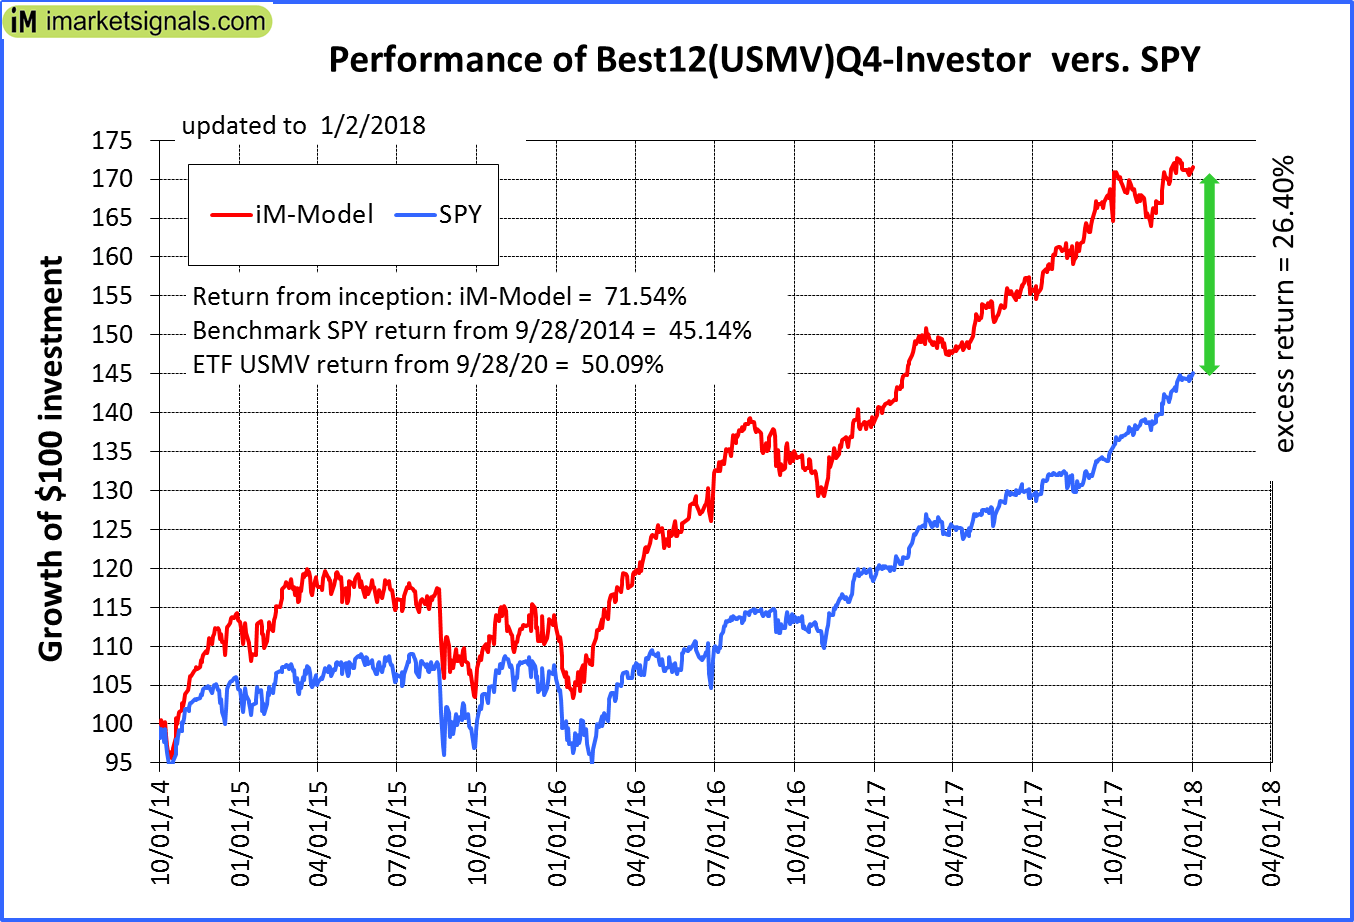
iM-Best12(USMV)Q4-Investor: Since inception, on 9/29/2014, the model gained 71.54% while the benchmark SPY gained 45.14% and the ETF USMV gained 50.09% over the same period. Over the previous week the market value of iM-Best12(USMV)Q4 gained 0.11% at a time when SPY gained 0.59%. A starting capital of $100,000 at inception on 9/29/2014 would have grown to $171,337 which includes -$88 cash and excludes $1,098 spent on fees and slippage. |
|
|
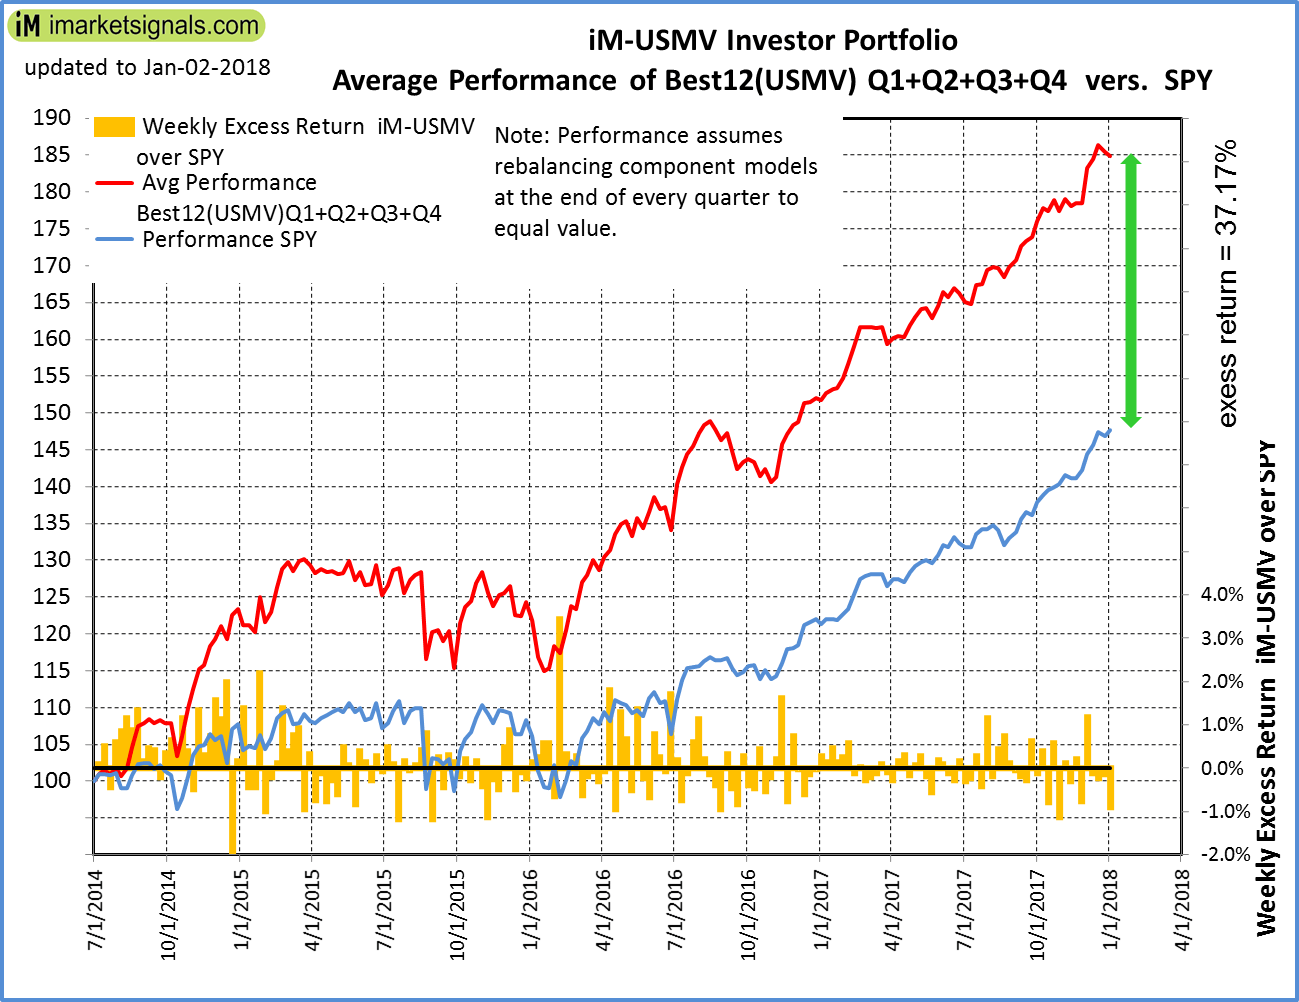
Average Performance of iM-Best12(USMV)Q1+Q2+Q3+Q4-Investor resulted in an excess return of 37.17% over SPY. (see iM-USMV Investor Portfolio) |
|
|
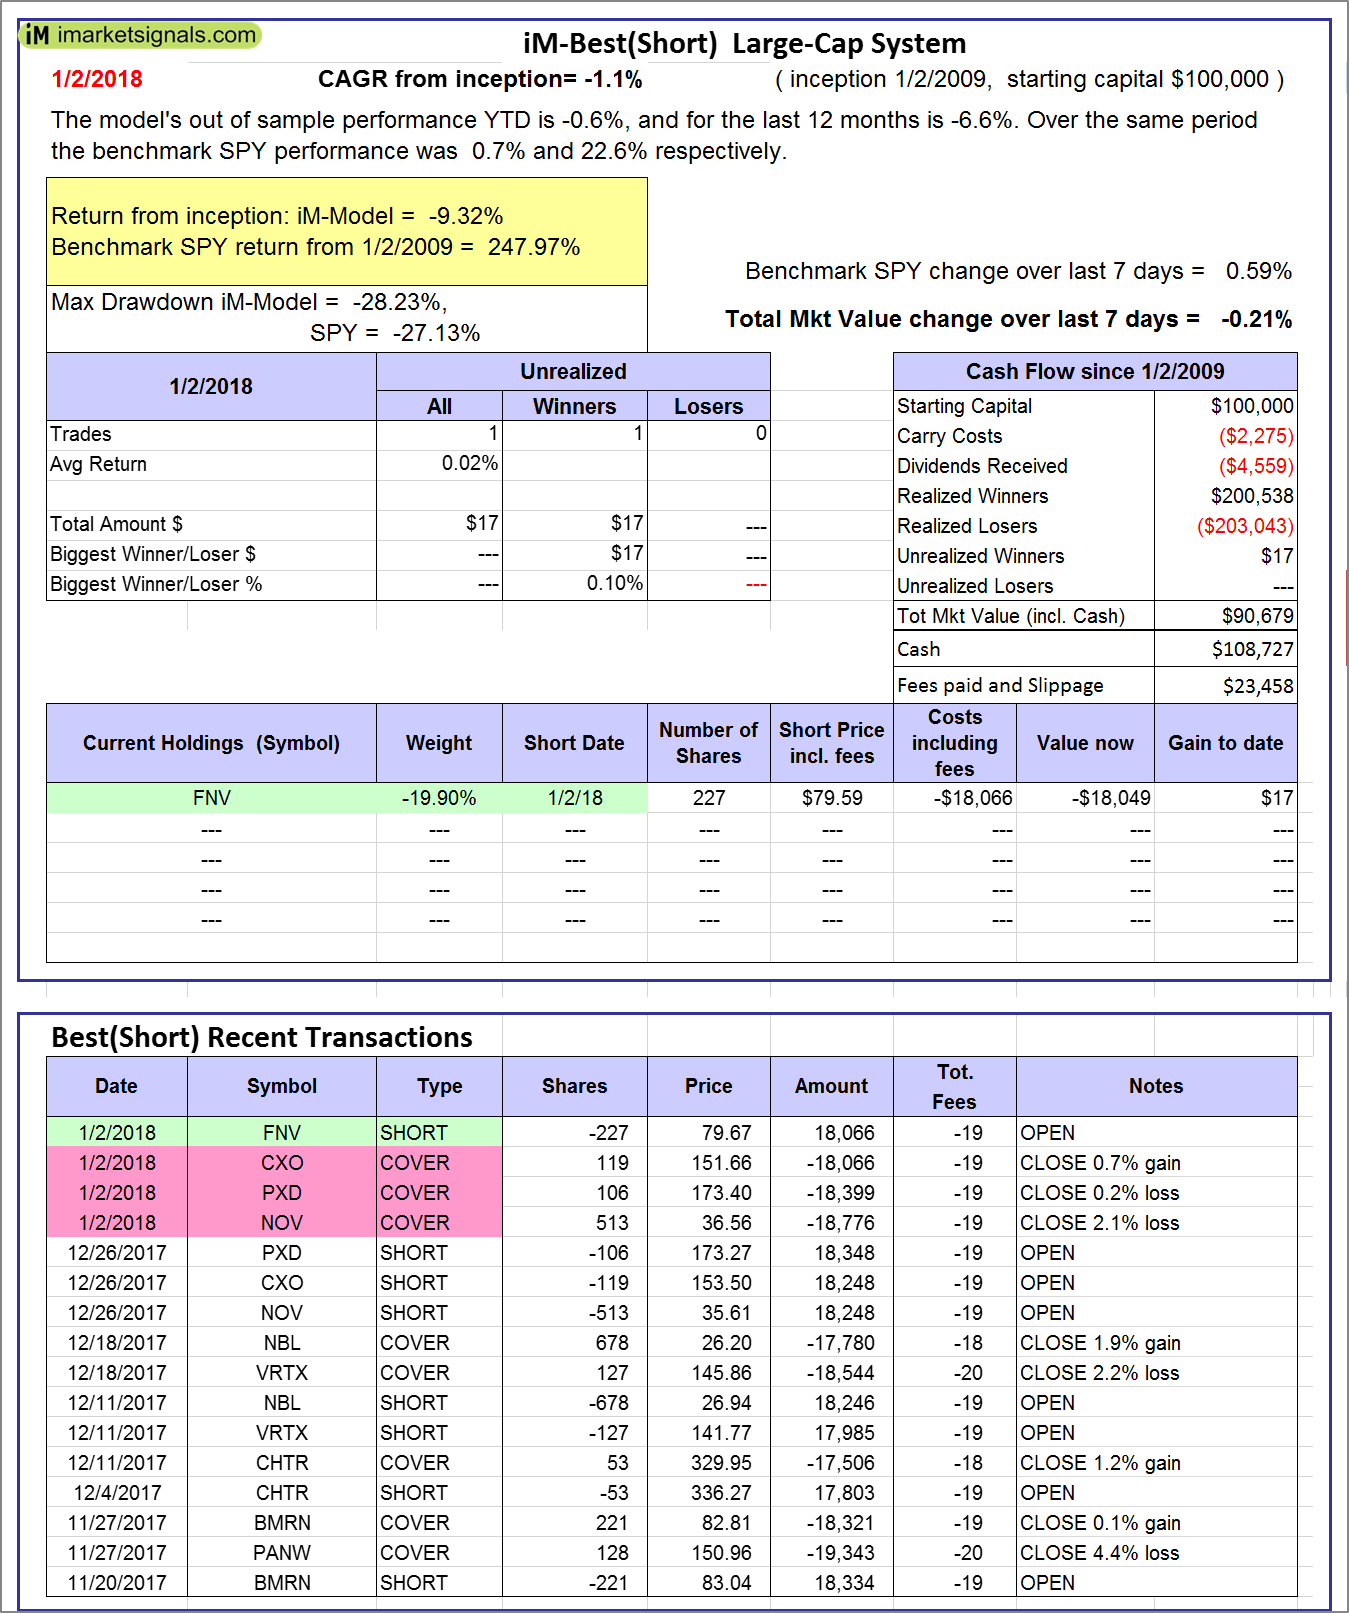
iM-Best(Short): The model’s out of sample performance YTD is -0.6%, and for the last 12 months is -6.6%. Over the same period the benchmark SPY performance was 0.7% and 22.6% respectively. Over the previous week the market value of iM-Best(Short) gained -0.21% at a time when SPY gained 0.59%. Over the period 1/2/2009 to 1/2/2018 the starting capital of $100,000 would have grown to $90,679 which includes $108,727 cash and excludes $23,458 spent on fees and slippage. |
|
|
iM-Best2 MC-Score ETF System: The model’s out of sample performance YTD is -0.3%, and for the last 12 months is 15.5%. Over the same period the benchmark SPY performance was 0.7% and 22.6% respectively. Over the previous week the market value of the iM-Best2 MC-Score ETF System gained -0.35% at a time when SPY gained 0.59%. A starting capital of $100,000 at inception on 6/30/2016 would have grown to $112,002 which includes $743 cash and excludes $115 spent on fees and slippage. |
|
|
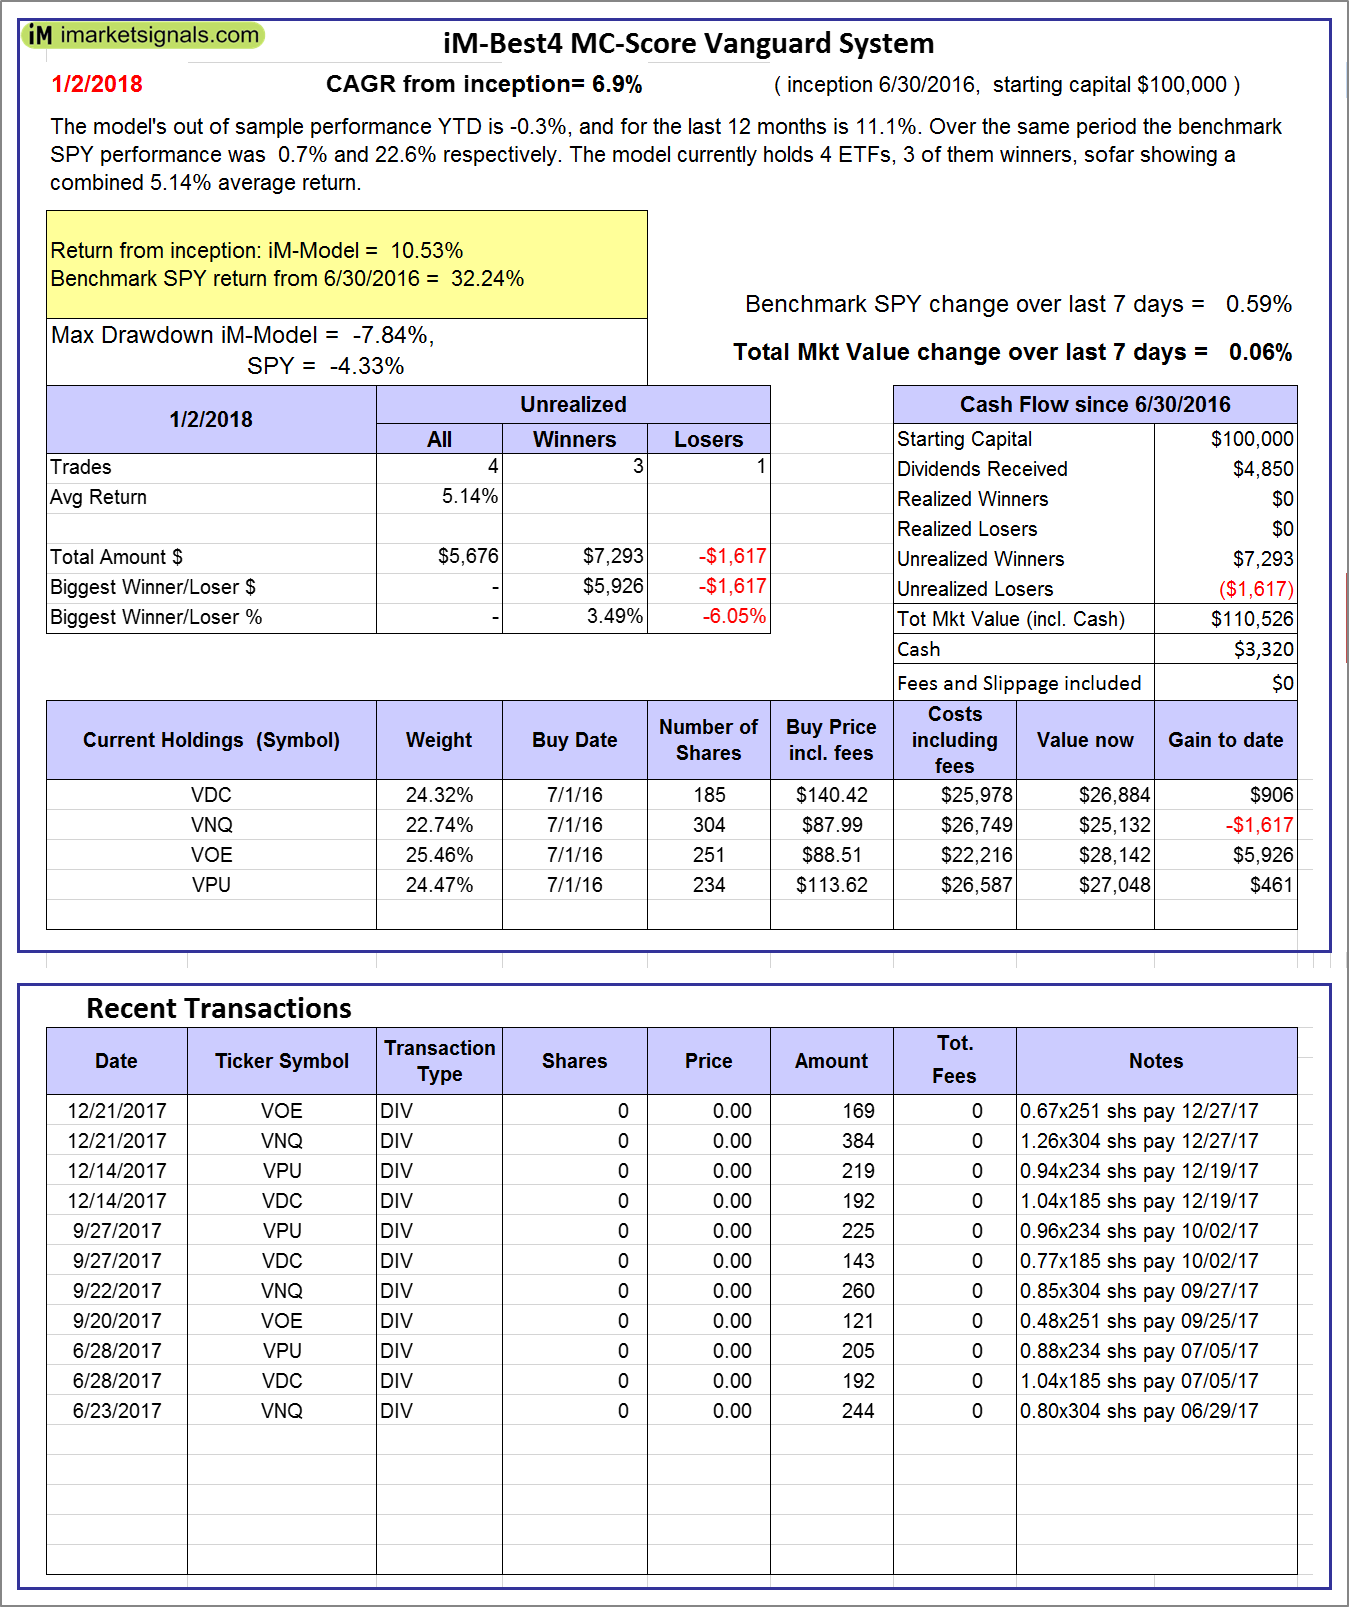
iM-Best4 MC-Score Vanguard System: The model’s out of sample performance YTD is -0.3%, and for the last 12 months is 11.1%. Over the same period the benchmark SPY performance was 0.7% and 22.6% respectively. Over the previous week the market value of the iM-Best4 MC-Score Vanguard System gained 0.06% at a time when SPY gained 0.59%. A starting capital of $100,000 at inception on 6/30/2016 would have grown to $110,526 which includes $3,320 cash and excludes $00 spent on fees and slippage. |
|
|
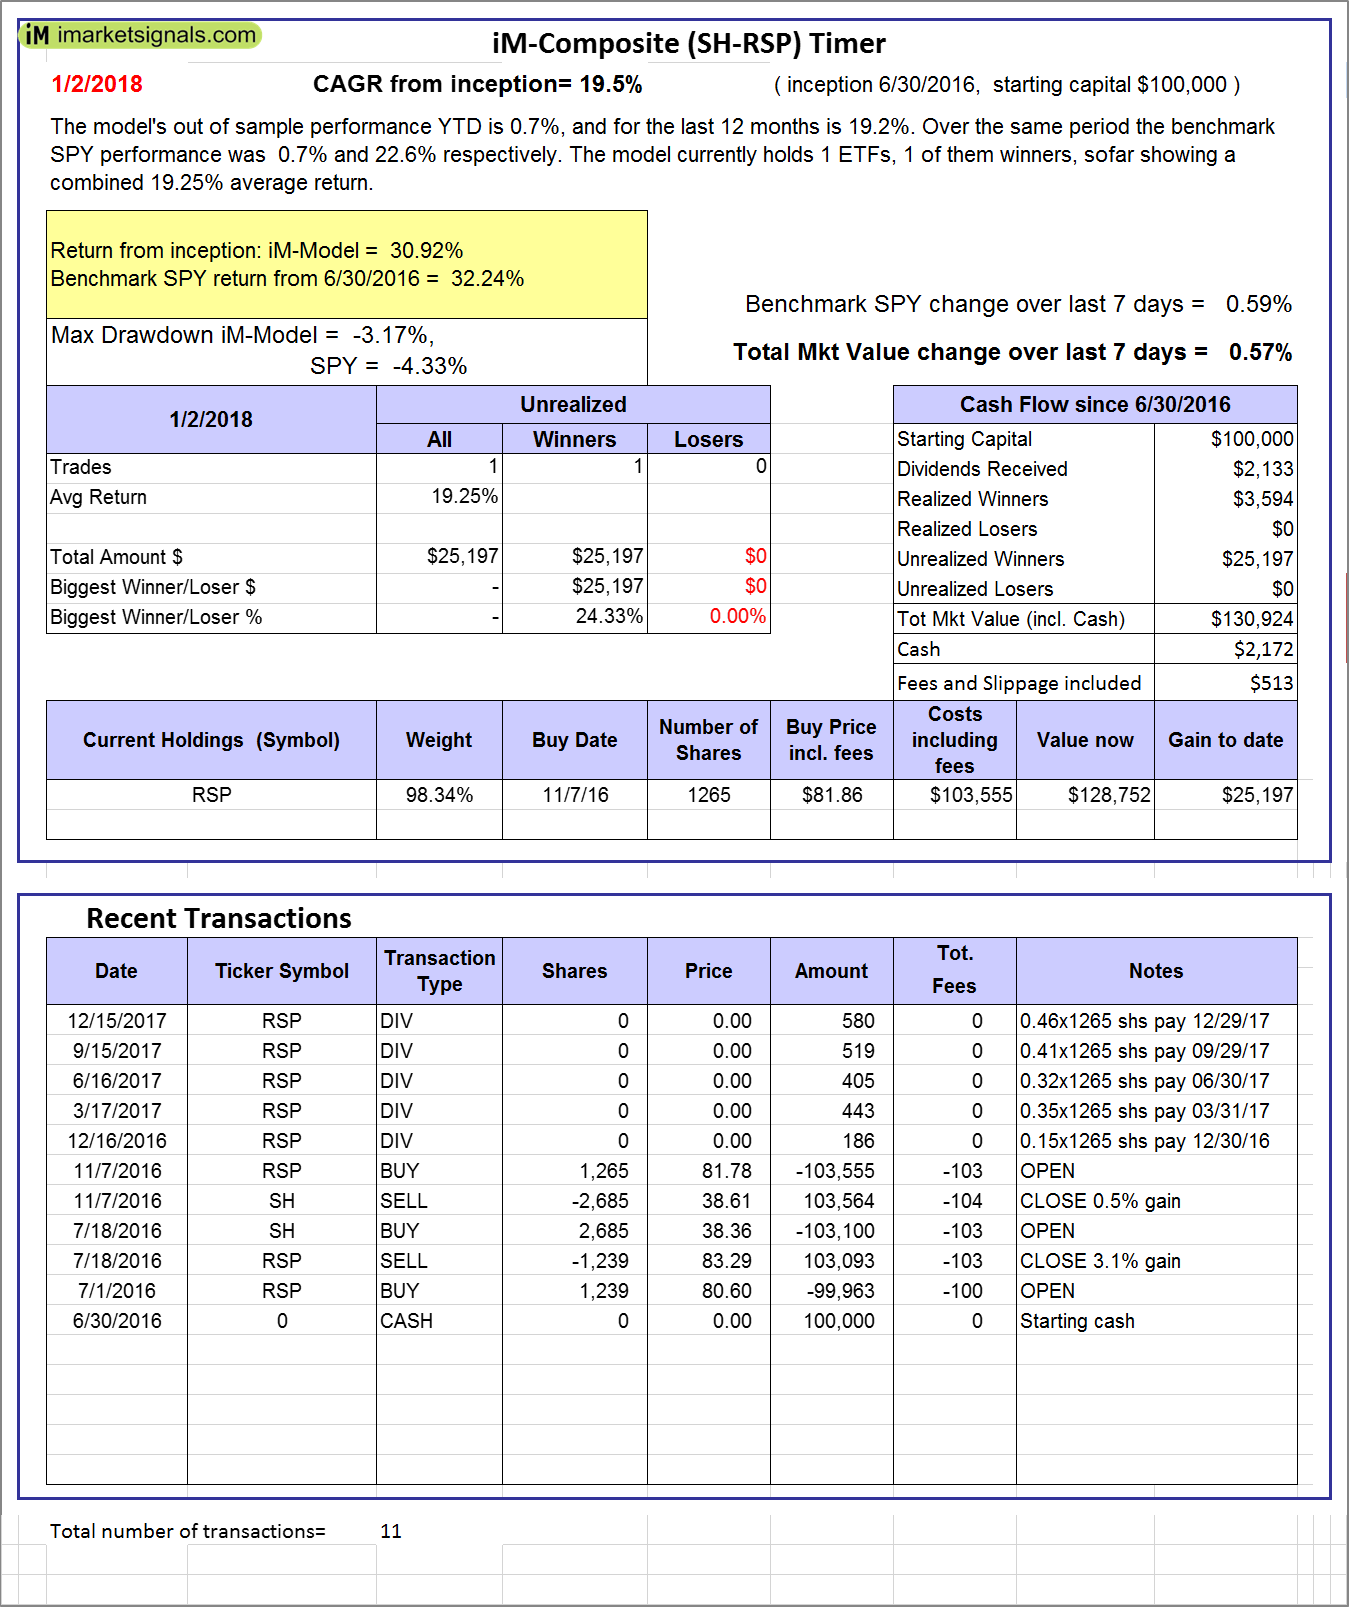
iM-Composite (SH-RSP) Timer: The model’s out of sample performance YTD is 0.7%, and for the last 12 months is 19.2%. Over the same period the benchmark SPY performance was 0.7% and 22.6% respectively. Over the previous week the market value of the iM-Composite (SH-RSP) Timer gained 0.57% at a time when SPY gained 0.59%. A starting capital of $100,000 at inception on 6/30/2016 would have grown to $130,924 which includes $2,172 cash and excludes $513 spent on fees and slippage. |
|
|
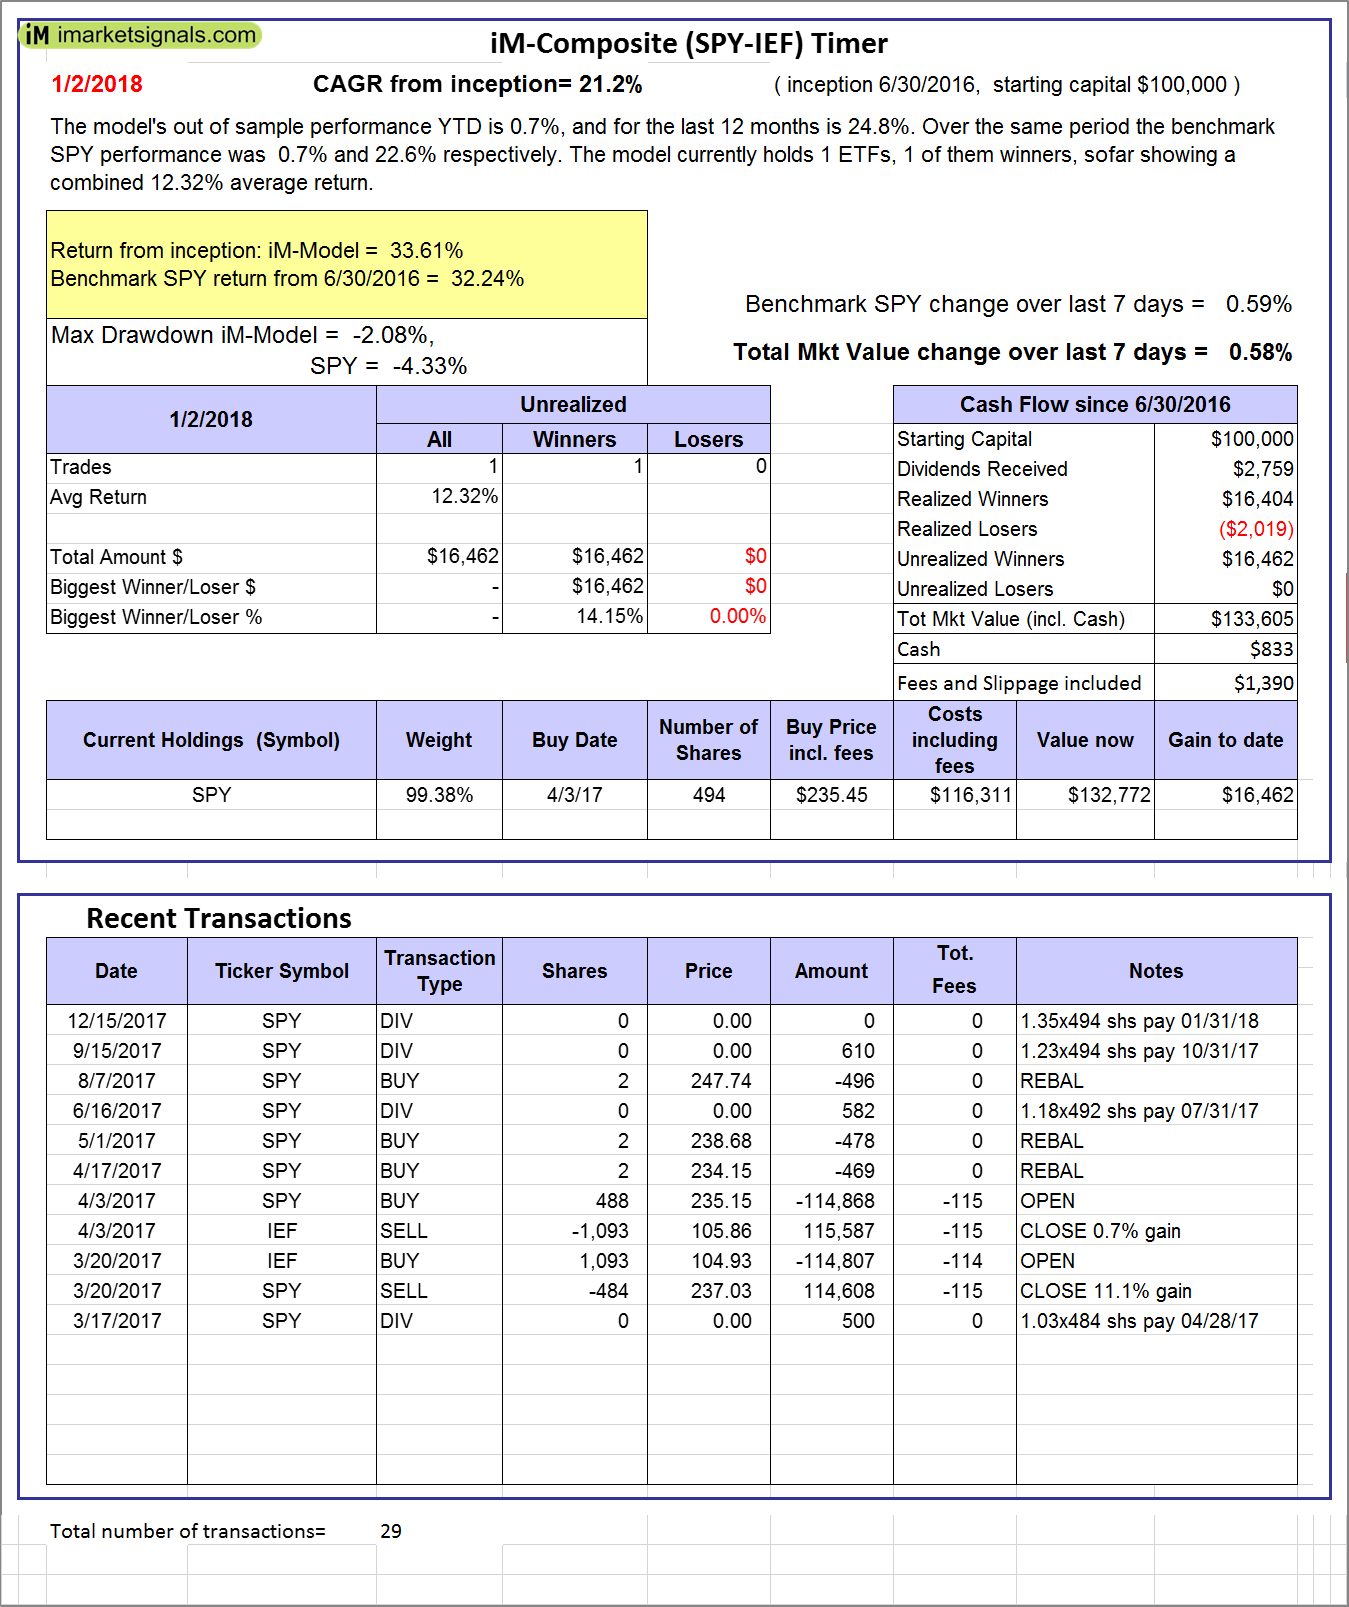
iM-Composite (SPY-IEF) Timer: The model’s out of sample performance YTD is 0.7%, and for the last 12 months is 24.8%. Over the same period the benchmark SPY performance was 0.7% and 22.6% respectively. Over the previous week the market value of the iM-Composite (SPY-IEF) Timer gained 0.58% at a time when SPY gained 0.59%. A starting capital of $100,000 at inception on 6/30/2016 would have grown to $133,605 which includes $833 cash and excludes $1,390 spent on fees and slippage. |
|
|
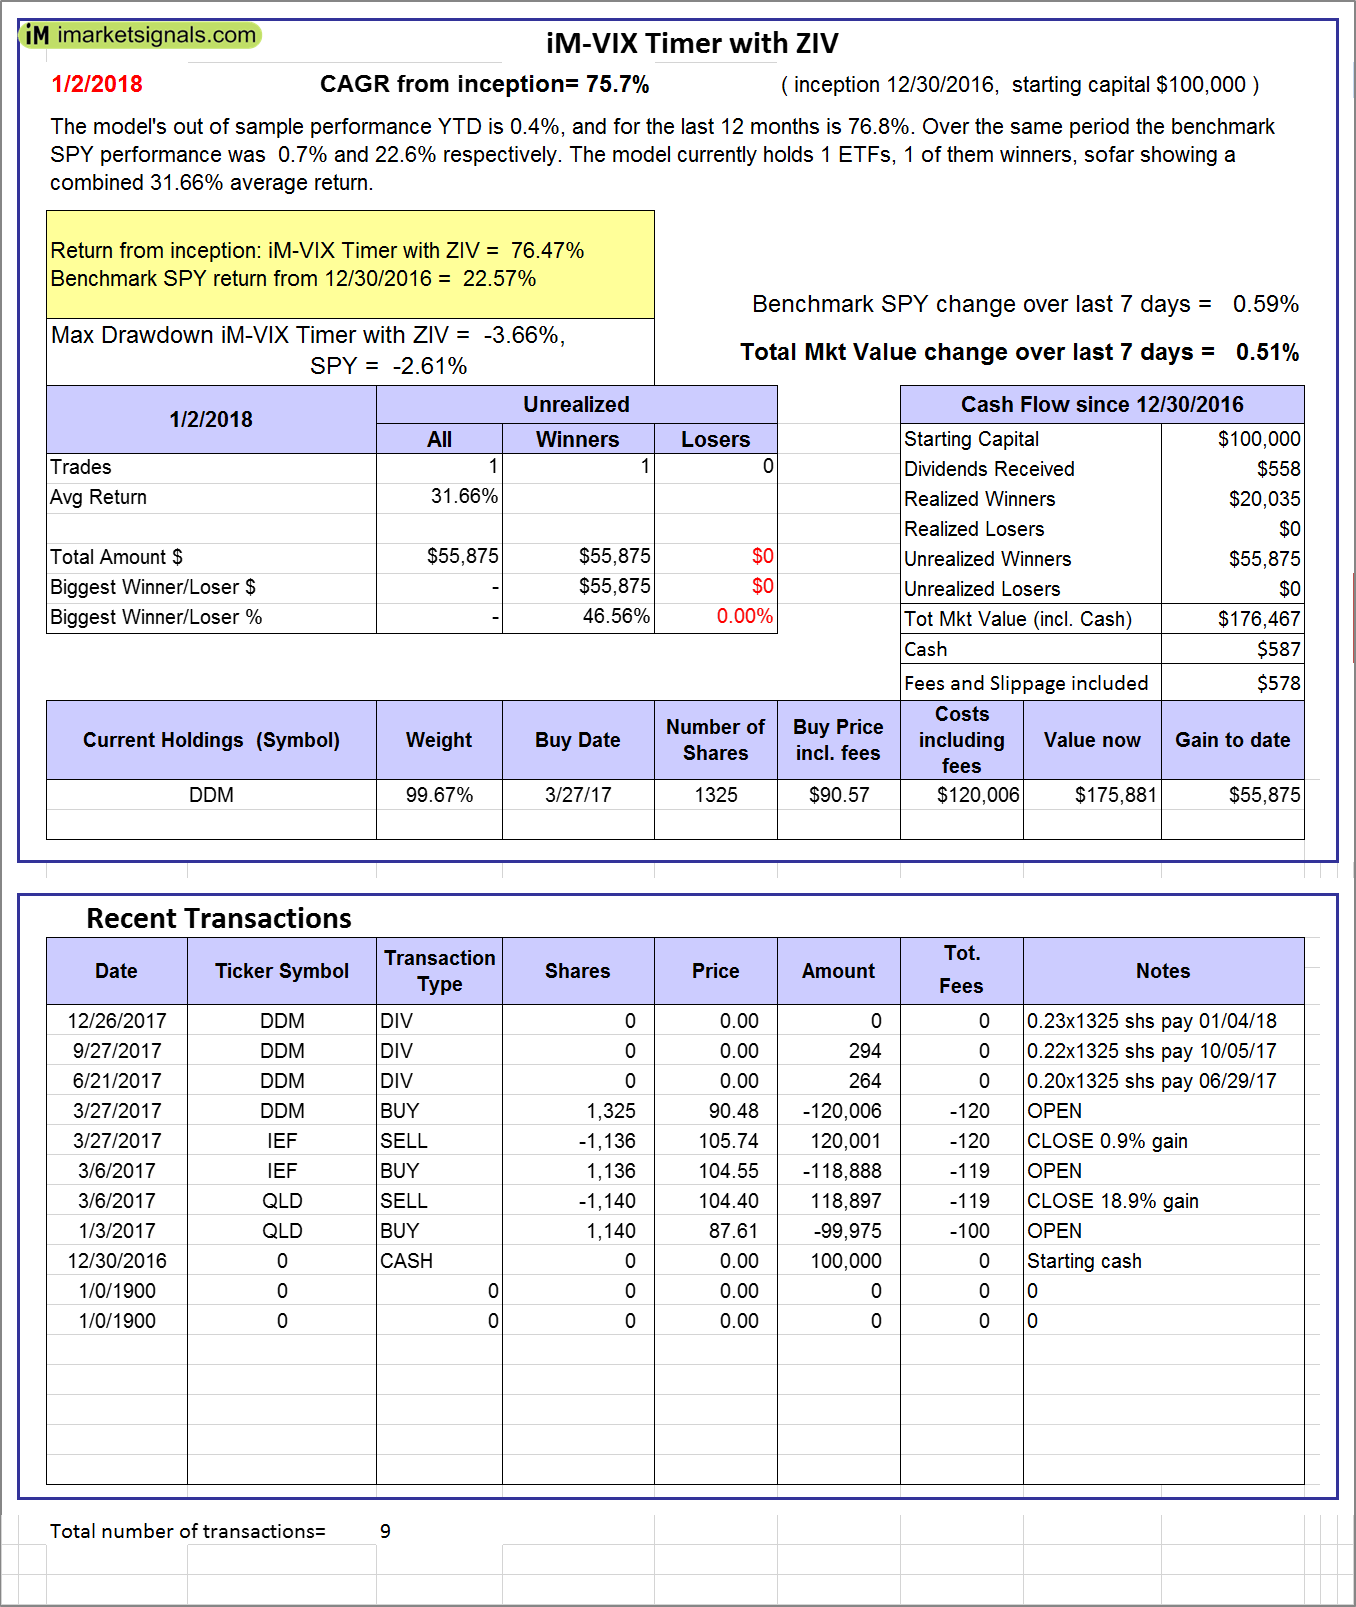
iM-VIX Timer with ZIV: The model’s out of sample performance YTD is 0.4%, and for the last 12 months is 76.8%. Over the same period the benchmark SPY performance was 0.7% and 22.6% respectively. Over the previous week the market value of the iM-VIX Timer with ZIV gained 0.51% at a time when SPY gained 0.59%. A starting capital of $100,000 at inception on 6/30/2016 would have grown to $176,467 which includes $587 cash and excludes $578 spent on fees and slippage. |
|
|
iM-Composite(Gold-Stocks-Bond) Timer: The model’s out of sample performance YTD is 1.3%, and for the last 12 months is 25.4%. Over the same period the benchmark SPY performance was 0.7% and 22.6% respectively. Over the previous week the market value of the iM-Composite(Gold-Stocks-Bond) Timer gained 2.81% at a time when SPY gained 0.59%. A starting capital of $100,000 at inception on 6/30/2016 would have grown to $130,318 which includes $53 cash and excludes $1,955 spent on fees and slippage. |
|
|
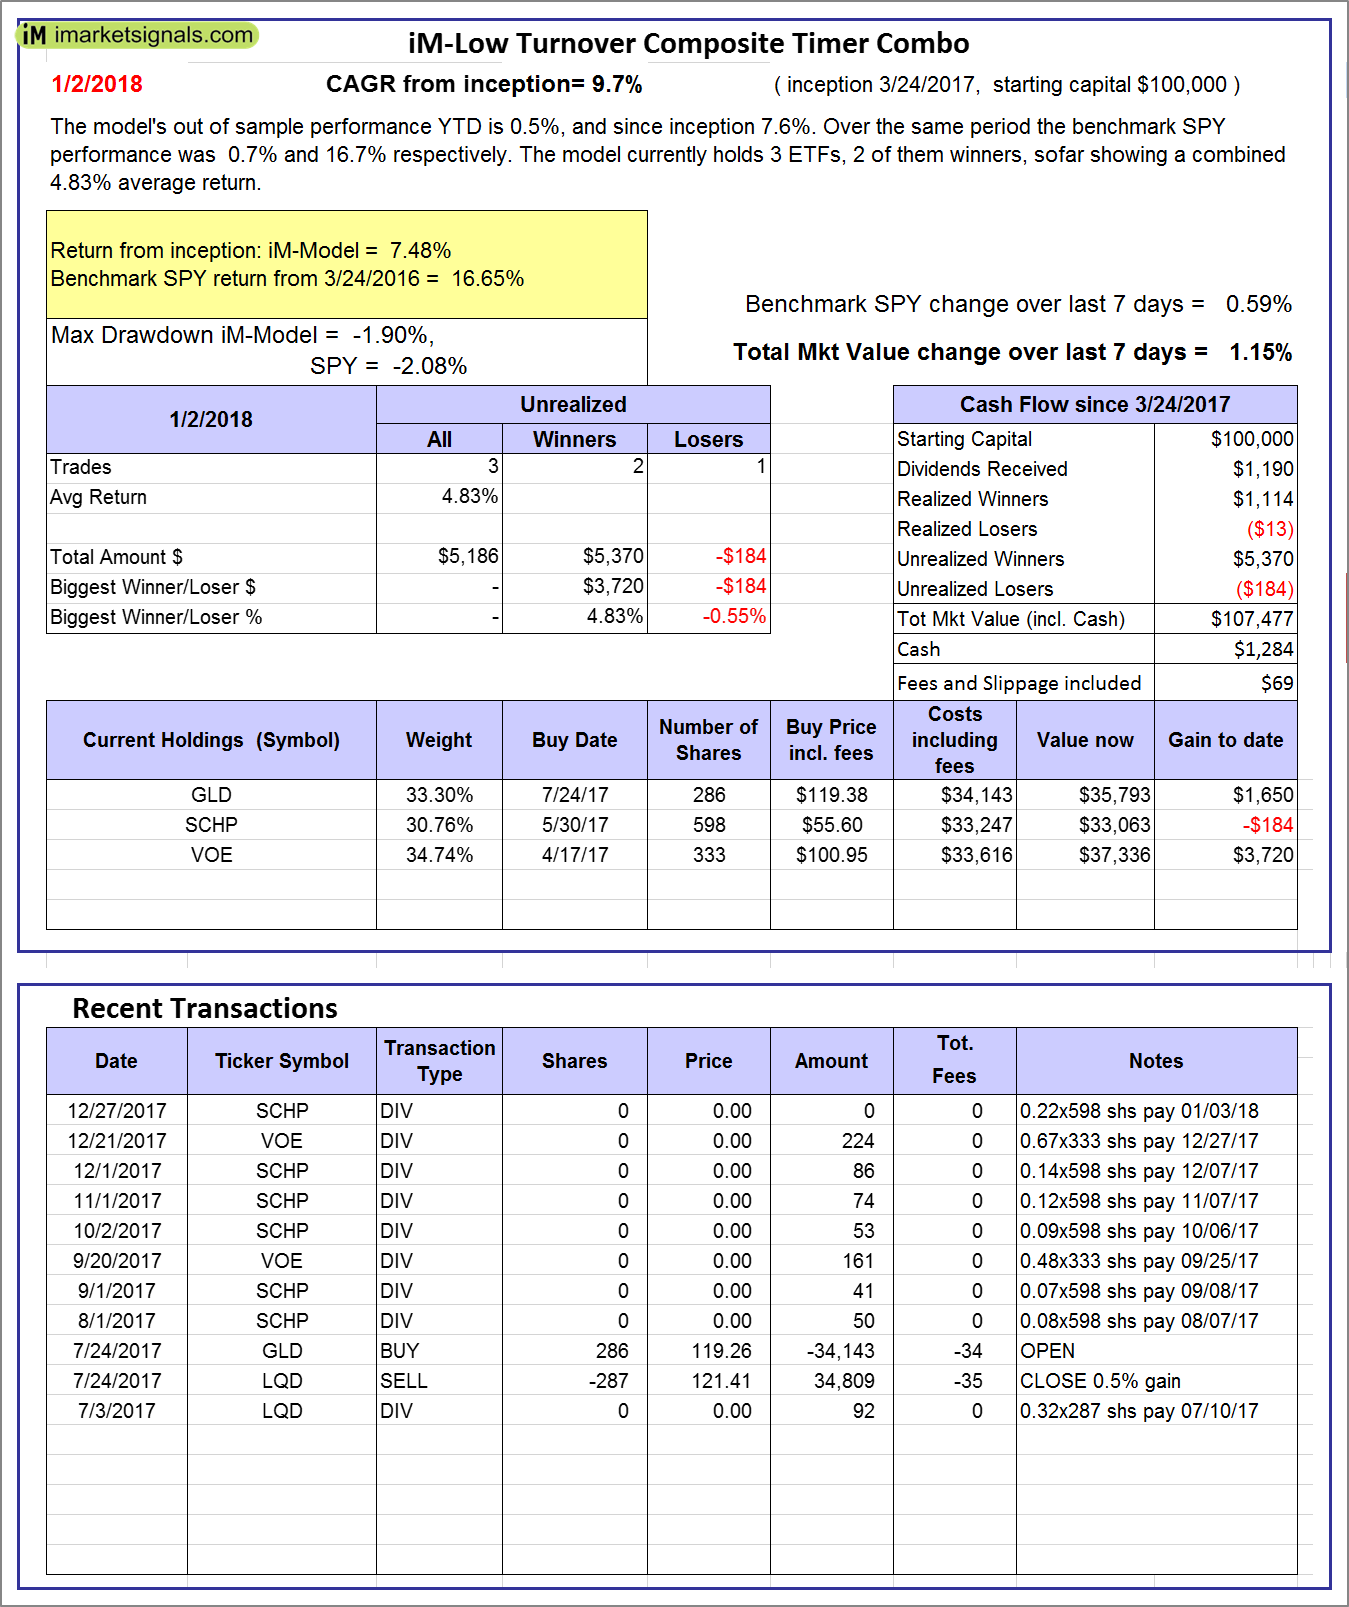
iM-Low Turnover Composite Timer Combo: The model’s out of sample performance YTD is 0.5%, and since inception 7.6%. Over the same period the benchmark SPY performance was 0.7% and 16.7% respectively. Over the previous week the market value of the iM-Low Turnover Composite Timer Combo gained 1.15% at a time when SPY gained 0.59%. A starting capital of $100,000 at inception on 3/24/27 would have grown to $107,477 which includes $1,284 cash and excludes $69 spent on fees and slippage. |
|
|
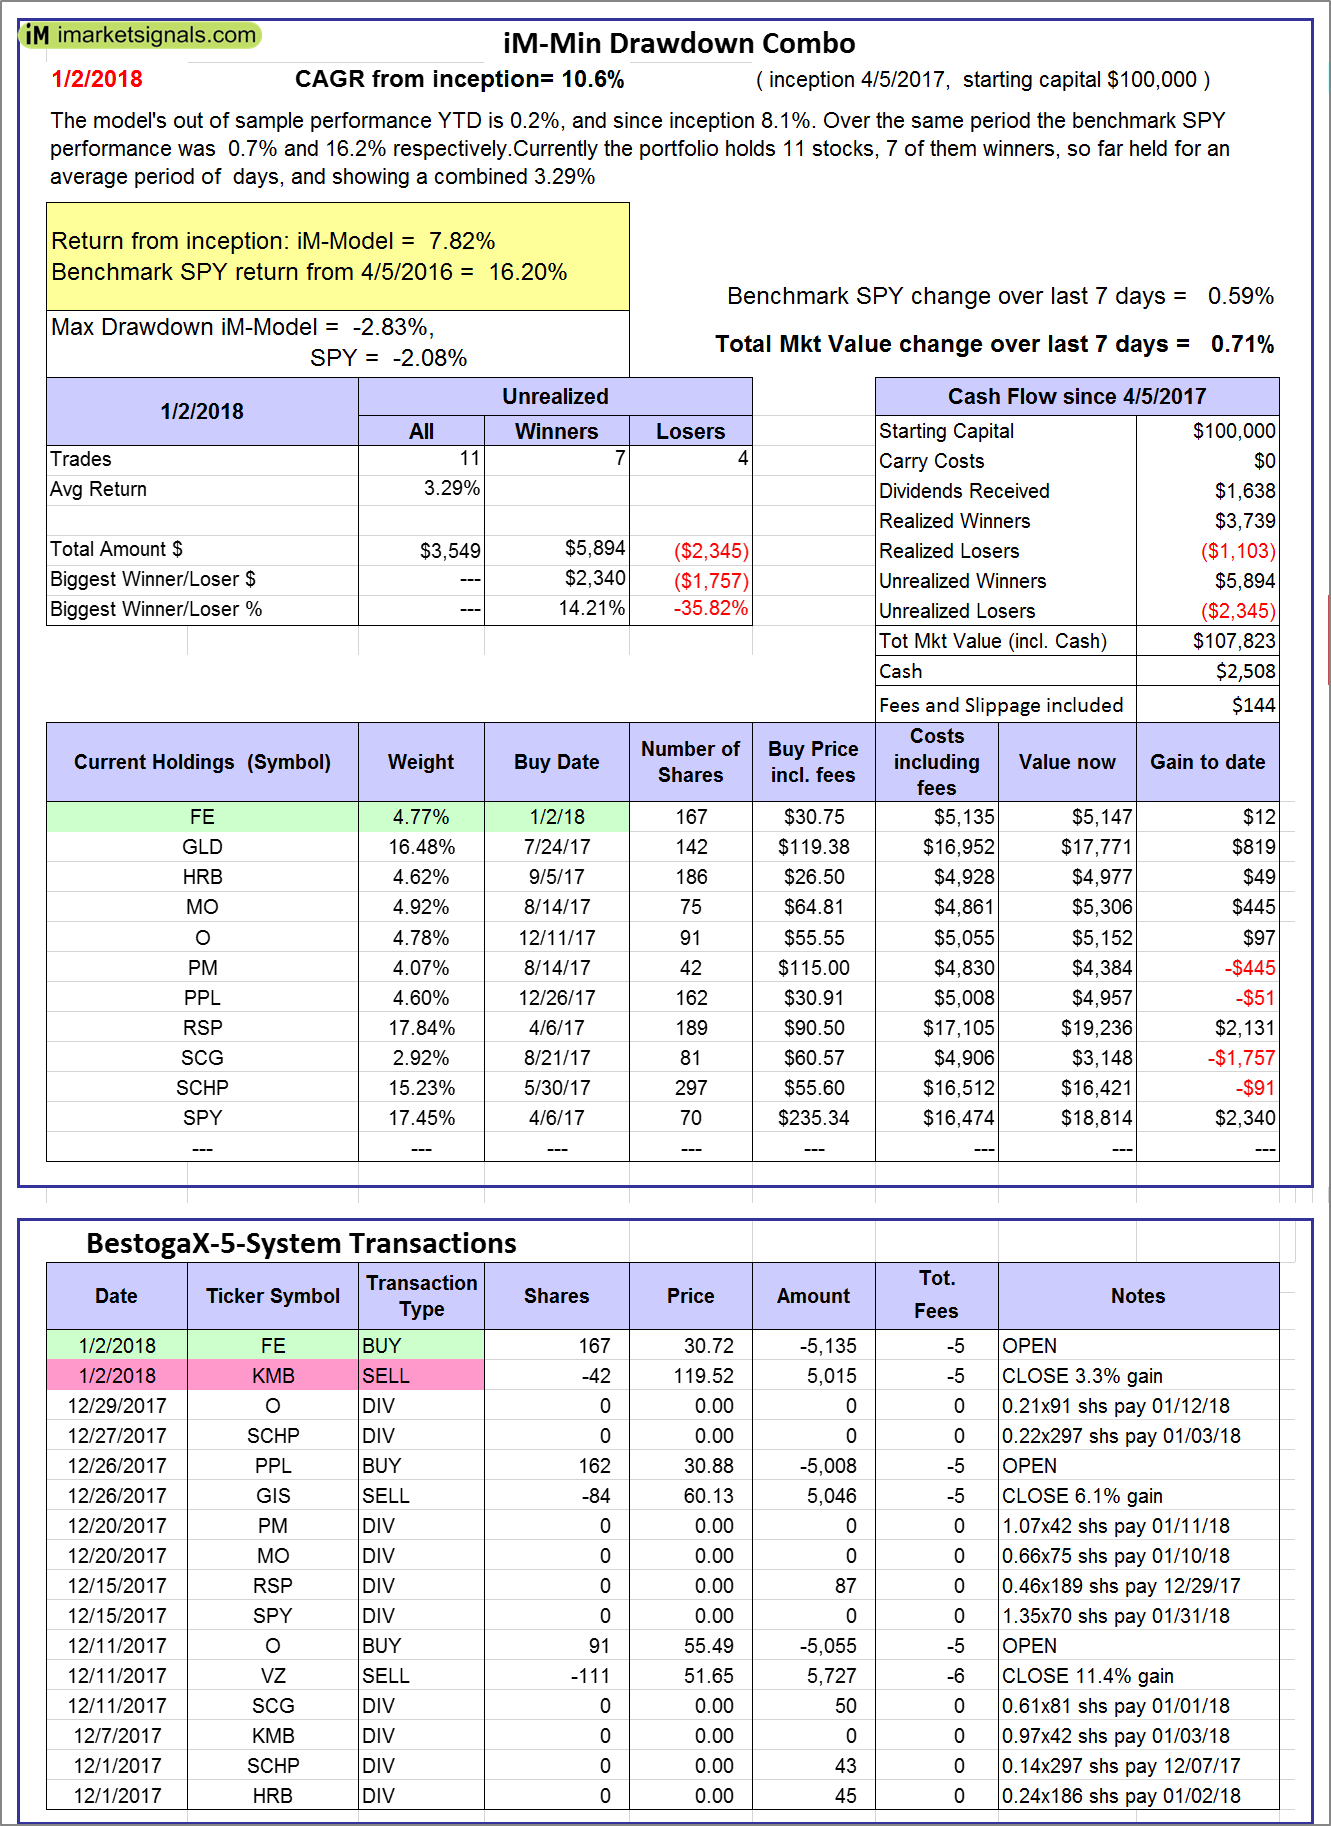
iM-Min Drawdown Combo: The model’s out of sample performance YTD is 0.2%, and since inception 8.1%. Over the same period the benchmark SPY performance was 0.7% and 16.2% respectively. Over the previous week the market value of the iM-Min Drawdown Combo gained 0.71% at a time when SPY gained 0.59%. A starting capital of $100,000 at inception on 4/5/2017 would have grown to $107,823 which includes $2,508 cash and excludes $144 spent on fees and slippage. |
|
|
iM-5ETF Trader (includes leveraged ETFs): The model’s out of sample performance YTD is 1.6%, and for the last 12 months is 46.5%. Over the same period the benchmark SPY performance was 0.7% and 22.6% respectively. Over the previous week the market value of the iM-5ETF Trader (includes leveraged ETFs) gained 1.06% at a time when SPY gained 0.59%. A starting capital of $100,000 at inception on 10/30/2016 would have grown to $165,159 which includes $924 cash and excludes $1,030 spent on fees and slippage. |
|
|
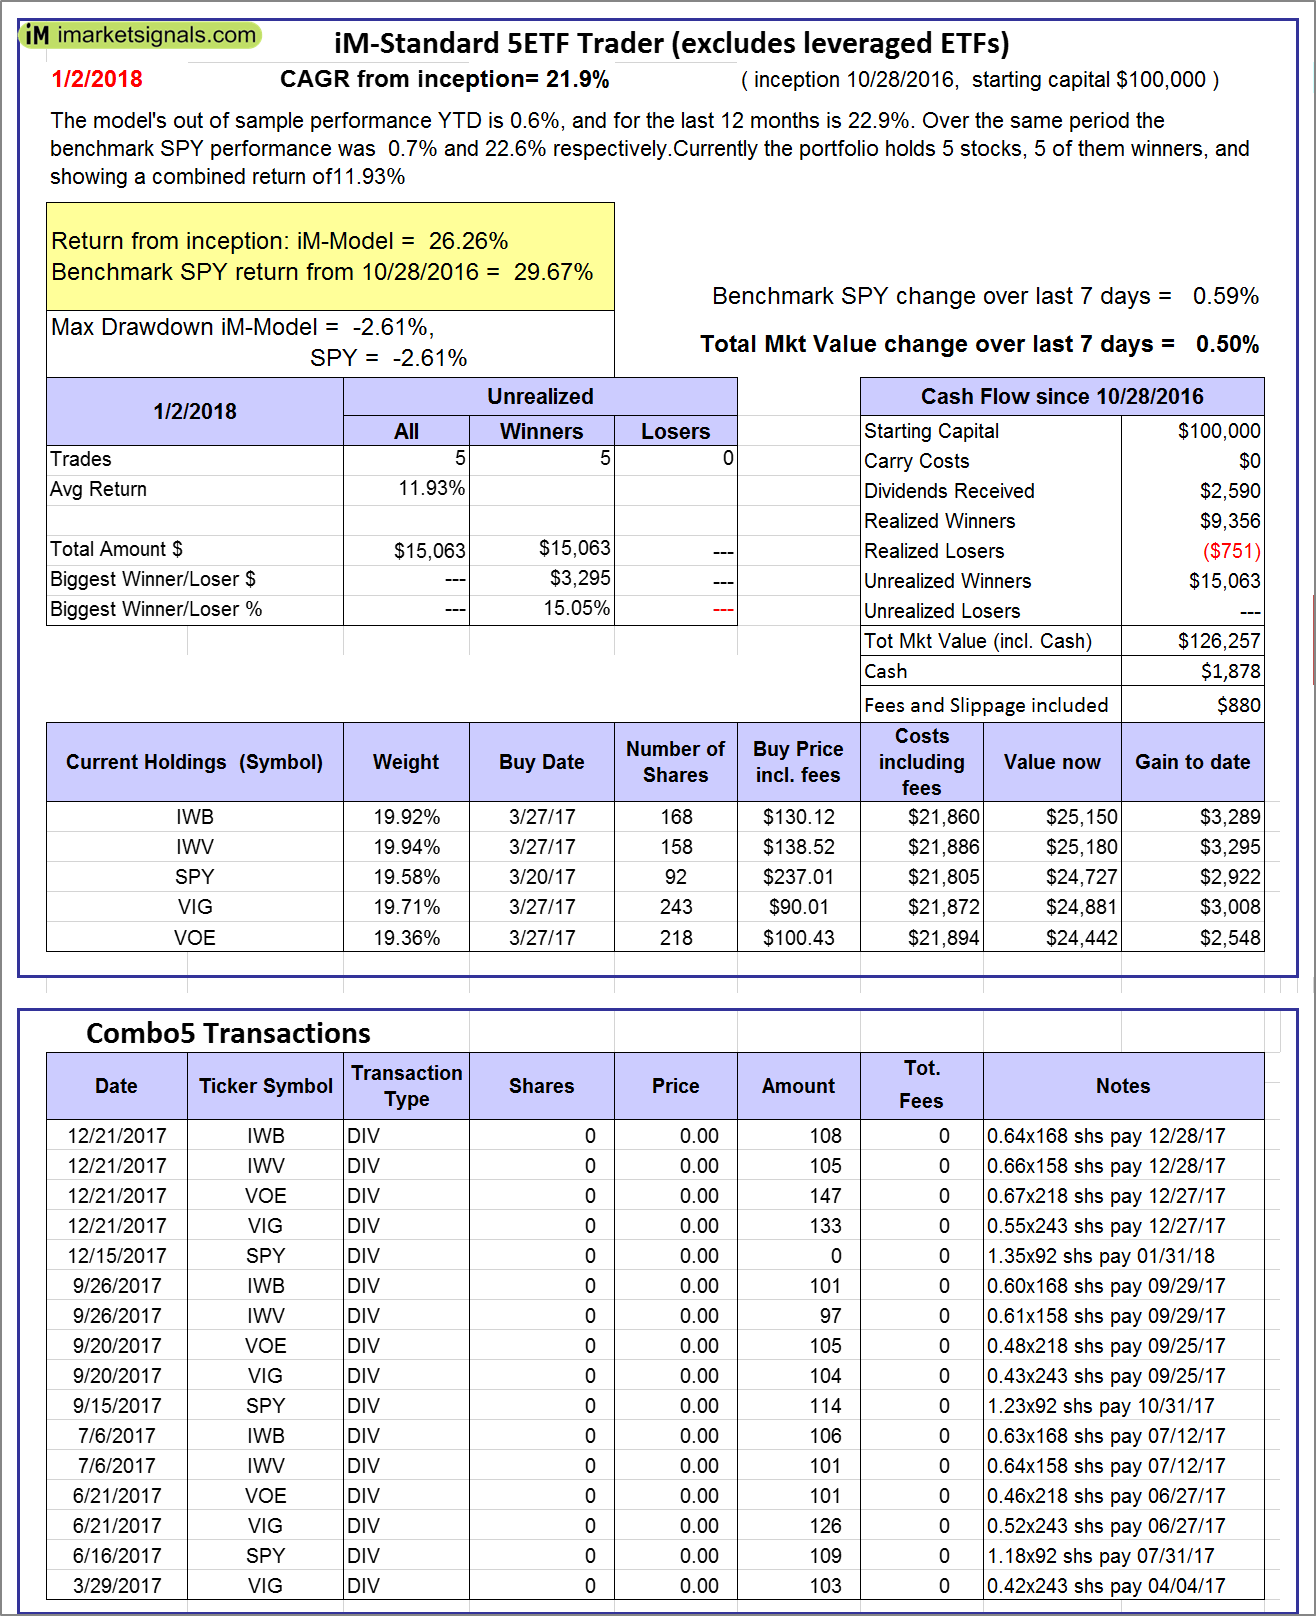
iM-Standard 5ETF Trader (excludes leveraged ETFs): The model’s out of sample performance YTD is 0.6%, and for the last 12 months is 22.9%. Over the same period the benchmark SPY performance was 0.7% and 22.6% respectively. Over the previous week the market value of the iM-Standard 5ETF Trader (excludes leveraged ETFs) gained 0.50% at a time when SPY gained 0.59%. A starting capital of $100,000 at inception on 10/30/2016 would have grown to $126,257 which includes $1,878 cash and excludes $880 spent on fees and slippage. |


Leave a Reply
You must be logged in to post a comment.