  |
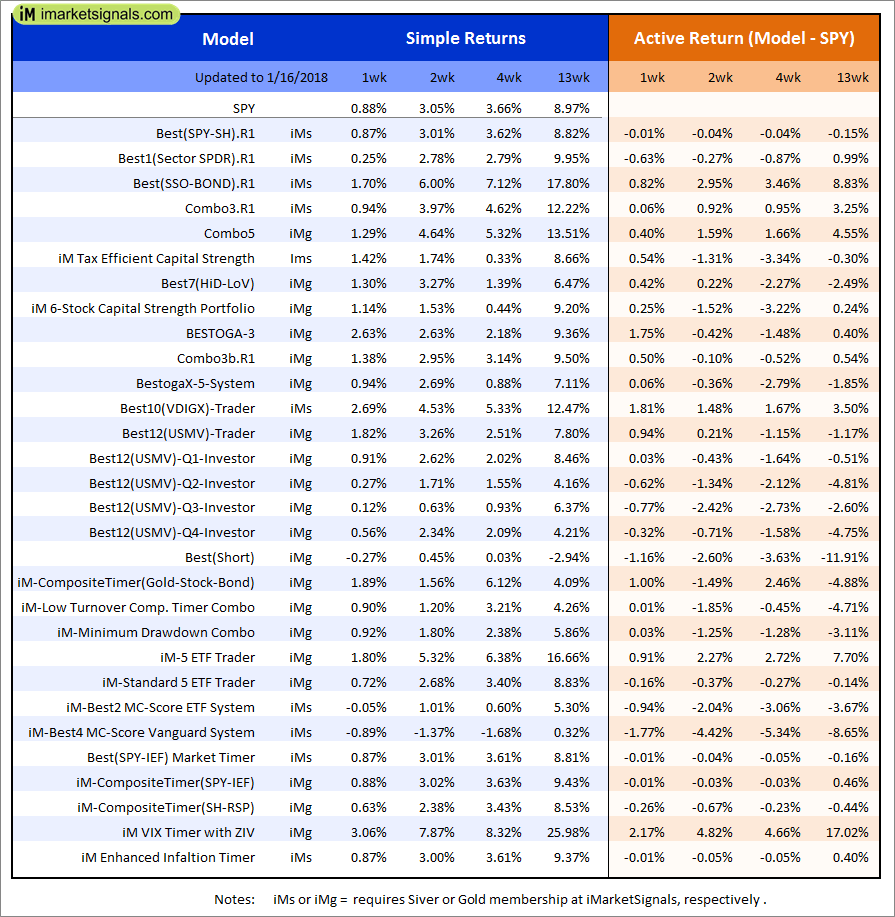
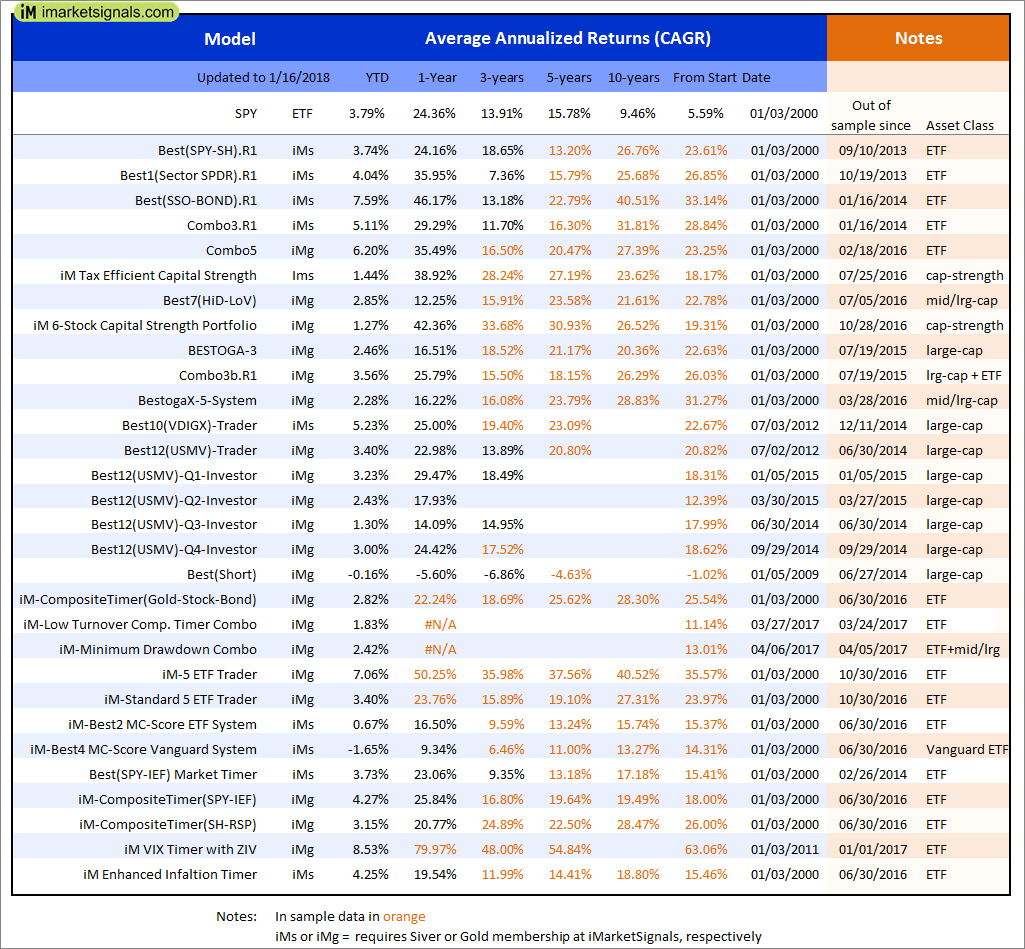
Out of sample performance summary of our models for the past 1, 2, 4 and 13 week periods. The active active return indicates how the models over- or underperformed the benchmark ETF SPY. Also the YTD, and the 1-, 3-, 5- and 10-year annualized returns are shown in the second table |
|
|
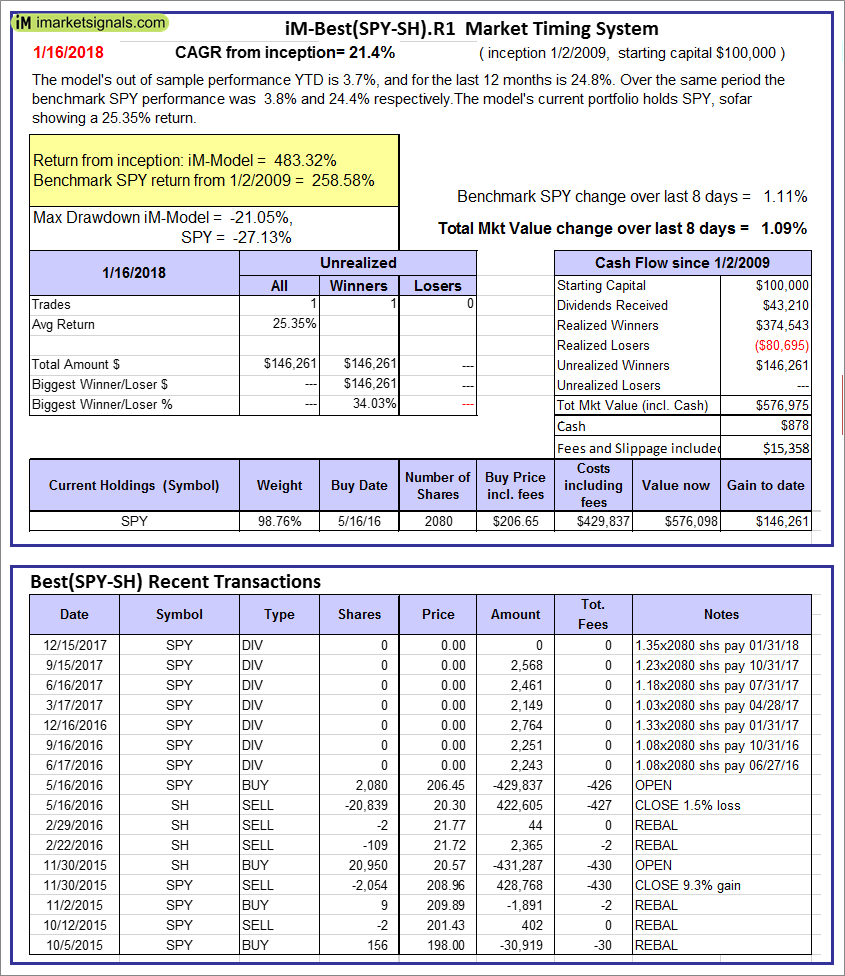
iM-Best(SPY-SH).R1: The model’s out of sample performance YTD is 3.7%, and for the last 12 months is 24.8%. Over the same period the benchmark SPY performance was 3.8% and 24.4% respectively. Over the previous week the market value of Best(SPY-SH) gained 1.09% at a time when SPY gained 1.11%. A starting capital of $100,000 at inception on 1/2/2009 would have grown to $576,975 which includes $878 cash and excludes $15,358 spent on fees and slippage. |
|
|
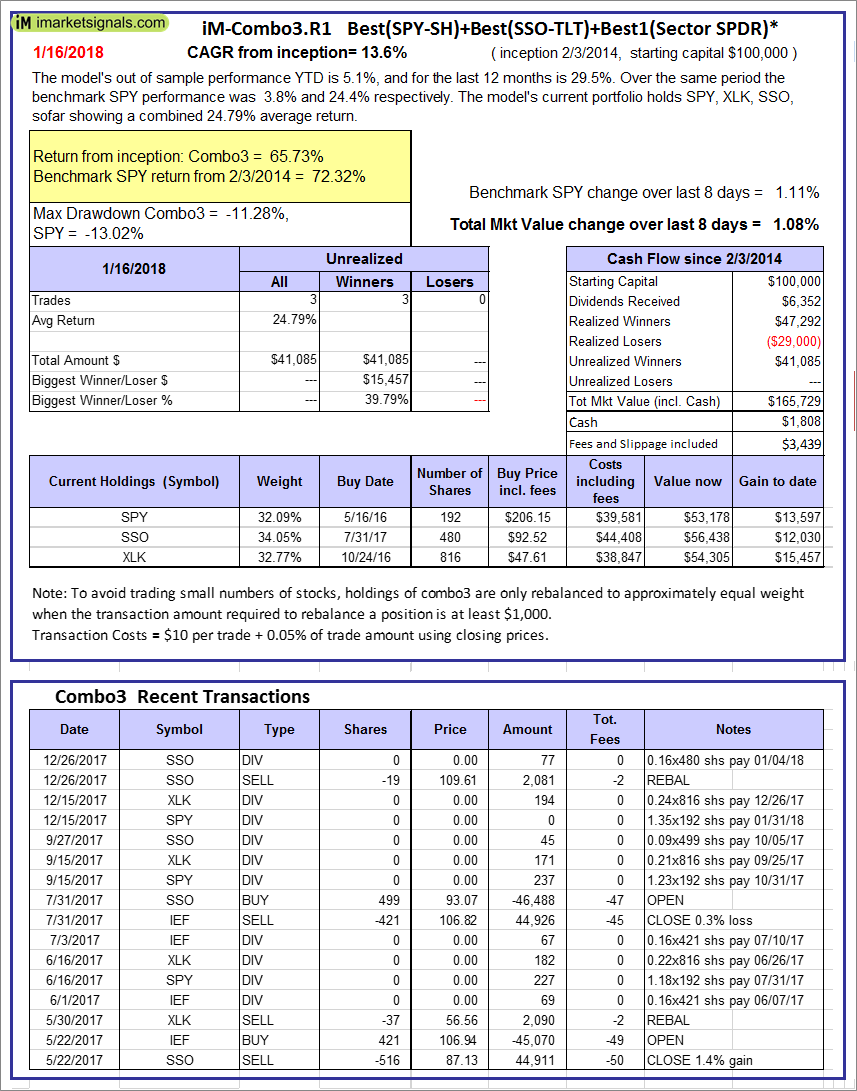
iM-Combo3.R1: The model’s out of sample performance YTD is 5.1%, and for the last 12 months is 29.5%. Over the same period the benchmark SPY performance was 3.8% and 24.4% respectively. Over the previous week the market value of iM-Combo3.R1 gained 1.08% at a time when SPY gained 1.11%. A starting capital of $100,000 at inception on 2/3/2014 would have grown to $165,729 which includes $1,808 cash and excludes $3,439 spent on fees and slippage. |
|
|
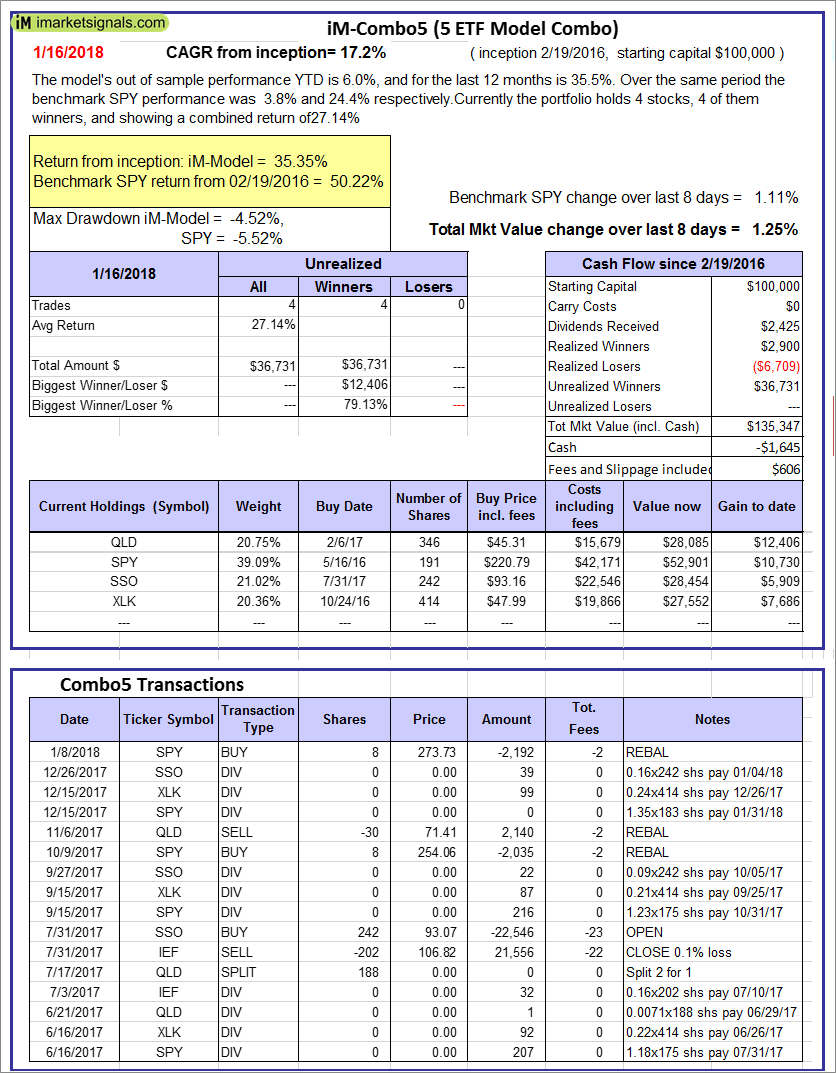
iM-Combo5: The model’s out of sample performance YTD is 6.0%, and for the last 12 months is 35.5%. Over the same period the benchmark SPY performance was 3.8% and 24.4% respectively. Over the previous week the market value of iM-Combo5 gained 1.25% at a time when SPY gained 1.11%. A starting capital of $100,000 at inception on 2/22/2016 would have grown to $135,347 which includes -$1,645 cash and excludes $606 spent on fees and slippage. |
|
|
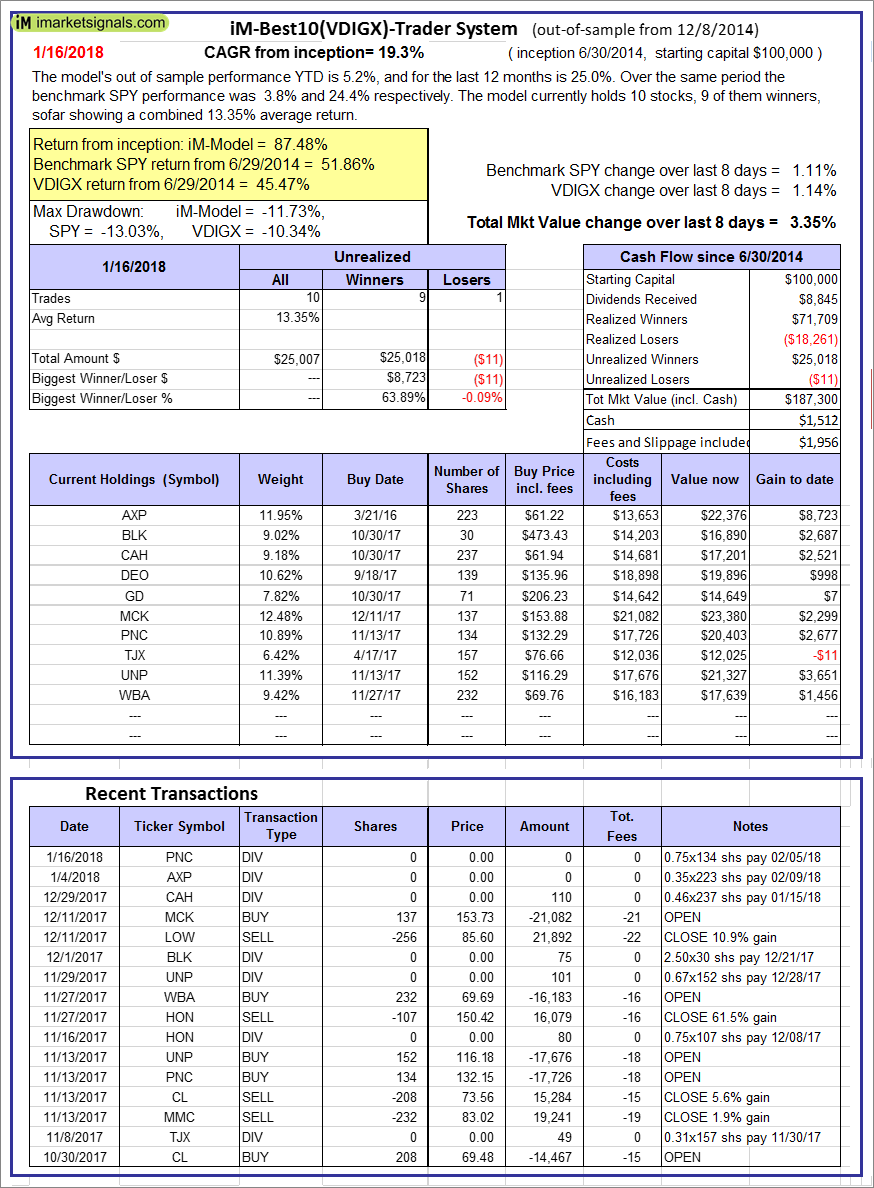
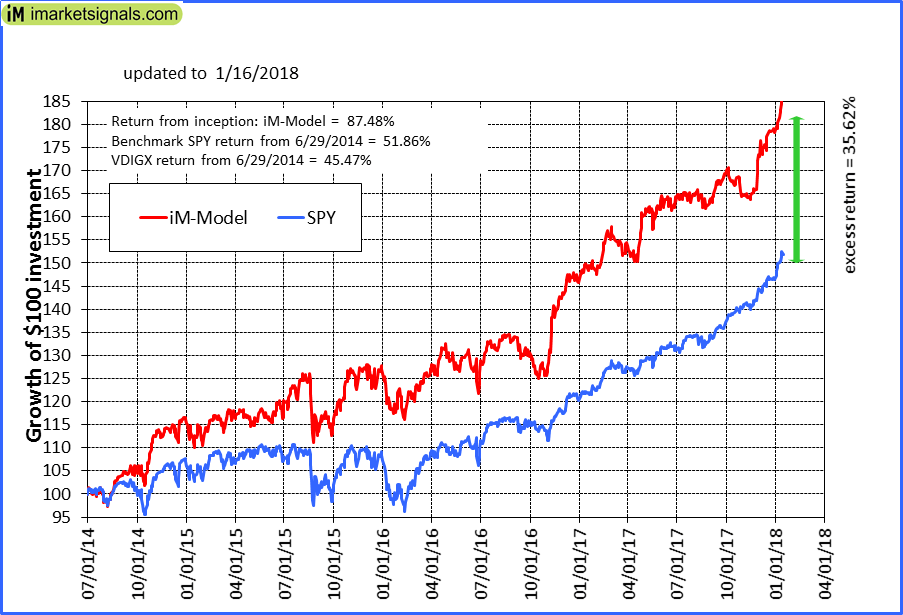
iM-Best10(VDIGX)-Trader: The model’s out of sample performance YTD is 5.2%, and for the last 12 months is 25.0%. Over the same period the benchmark SPY performance was 3.8% and 24.4% respectively. Since inception, on 7/1/2014, the model gained 87.48% while the benchmark SPY gained 51.86% and VDIGX gained 45.47% over the same period. Over the previous week the market value of iM-Best10(VDIGX) gained 3.35% at a time when SPY gained 1.11%. A starting capital of $100,000 at inception on 7/1/2014 would have grown to $187,300 which includes $1,512 cash and excludes $1,956 spent on fees and slippage. |
|
|
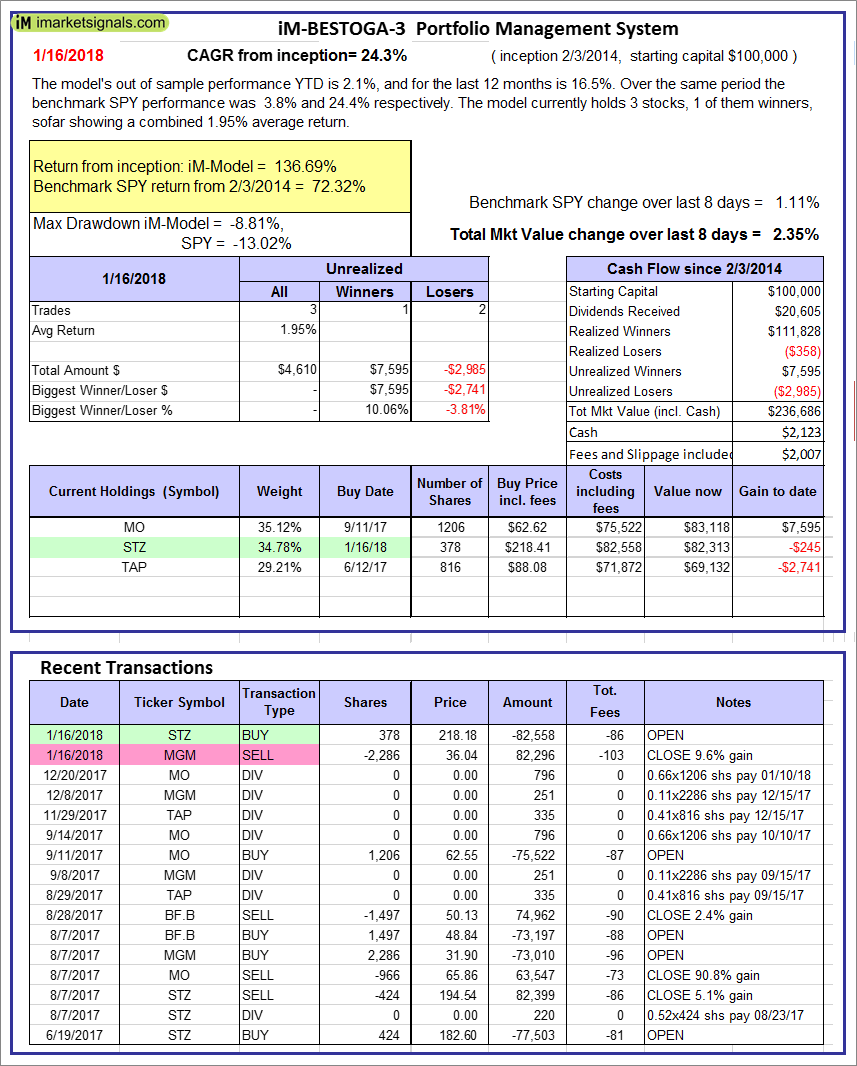
iM-BESTOGA-3: The model’s out of sample performance YTD is 2.1%, and for the last 12 months is 16.5%. Over the same period the benchmark SPY performance was 3.8% and 24.4% respectively. Over the previous week the market value of iM-BESTOGA-3 gained 2.35% at a time when SPY gained 1.11%. A starting capital of $100,000 at inception on 2/3/2014 would have grown to $236,686 which includes $2,123 cash and excludes $2,007 spent on fees and slippage. |
|
|
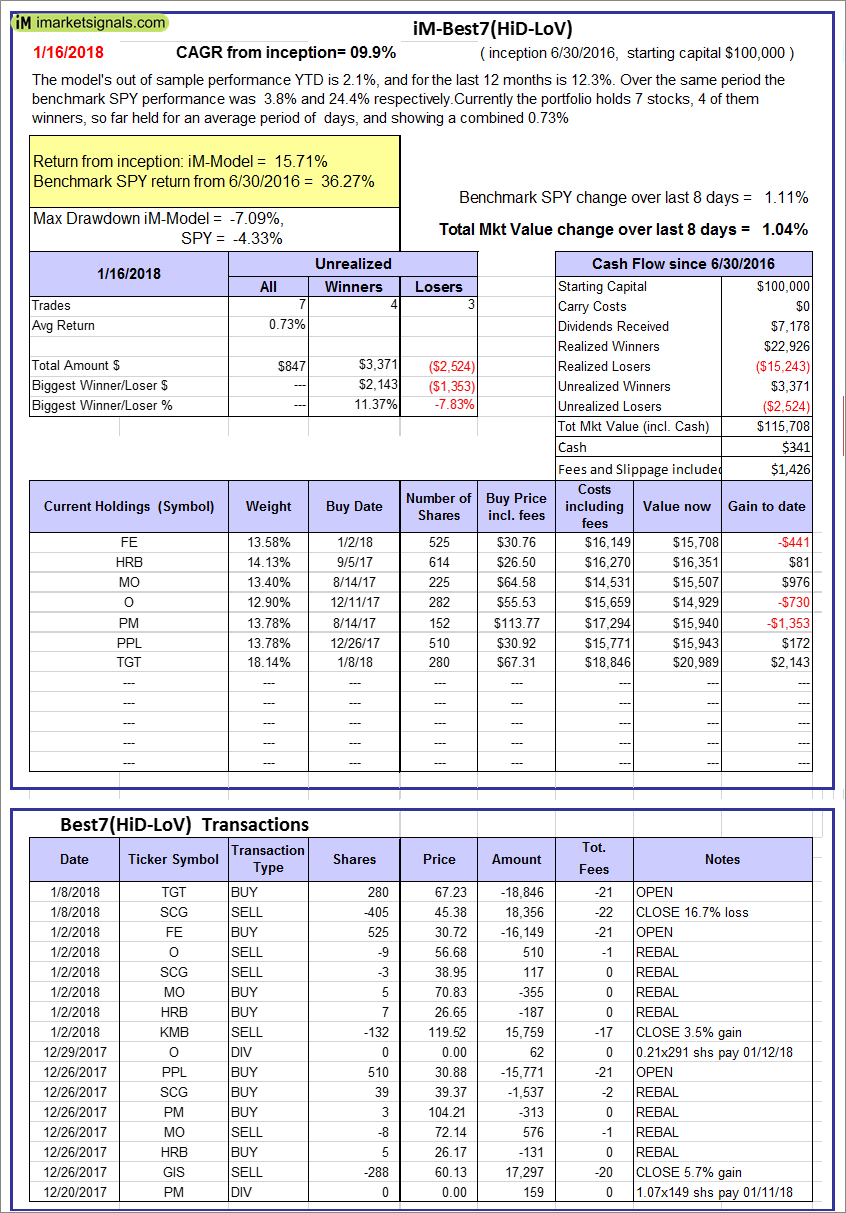
iM-Best7(HiD-LoV): The model’s out of sample performance YTD is 2.1%, and for the last 12 months is 12.3%. Over the same period the benchmark SPY performance was 3.8% and 24.4% respectively. Over the previous week the market value of iM-BESTOGA-3 gained 1.04% at a time when SPY gained 1.11%. A starting capital of $100,000 at inception on 6/30/2016 would have grown to $115,708 which includes $341 cash and excludes $1,426 spent on fees and slippage. |
|
|
iM 6-Stock Capital Strength Portfolio: The model’s out of sample performance YTD is 1.0%, and for the last 12 months is 42.4%. Over the same period the benchmark SPY performance was 3.8% and 24.4% respectively. Over the previous week the market value of the iM 6-Stock Capital Strength Portfolio gained 0.02% at a time when SPY gained 1.11%. A starting capital of $100,000 at inception on 10/28/2016 would have grown to $152,776 which includes $1,565 cash and excludes $559 spent on fees and slippage. |
|
|
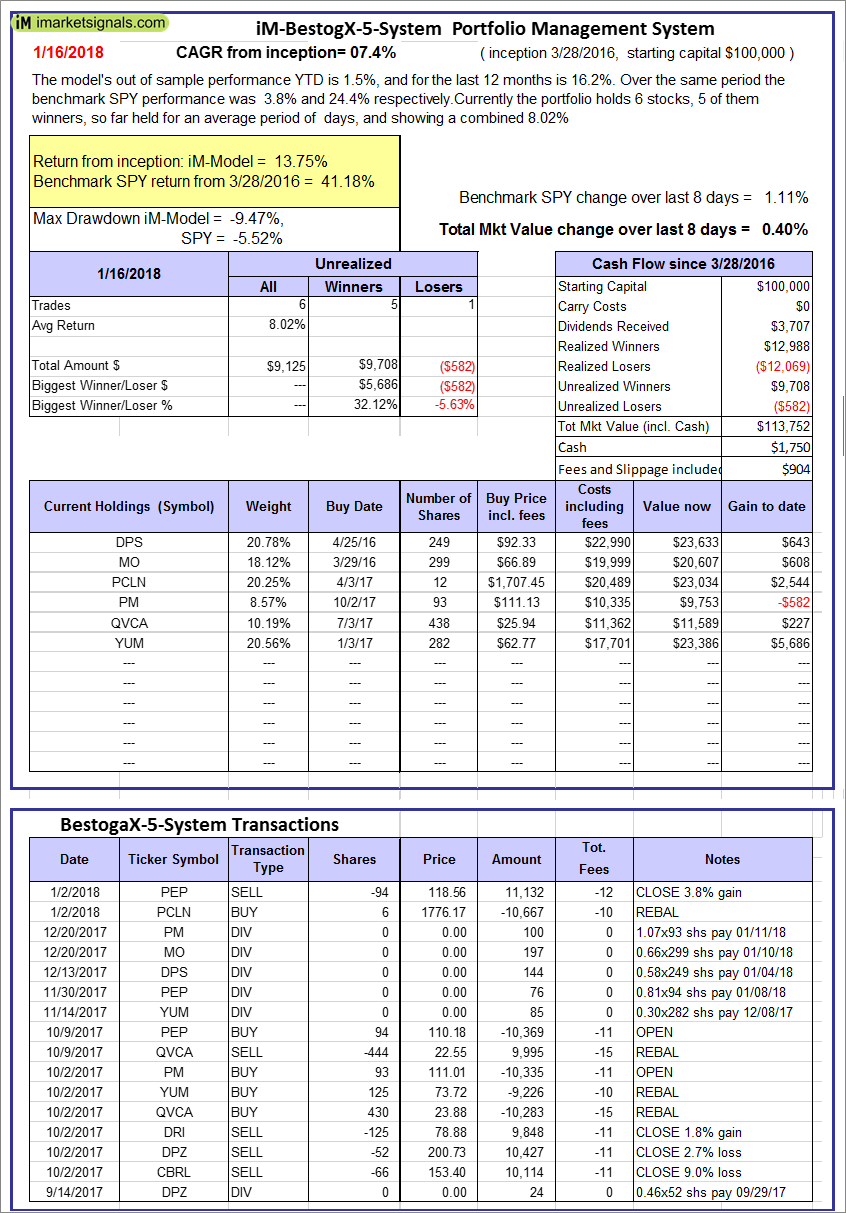
iM-BestogaX5-System: The model’s out of sample performance YTD is 1.5%, and for the last 12 months is 16.2%. Over the same period the benchmark SPY performance was 3.8% and 24.4% respectively. Over the previous week the market value of iM-Best8(S&P 500)Tax-Eff. gained 0.40% at a time when SPY gained 1.11%. A starting capital of $100,000 at inception on 3/28/2016 would have grown to $113,752 which includes $1,750 cash and excludes $904 spent on fees and slippage. |
|
|
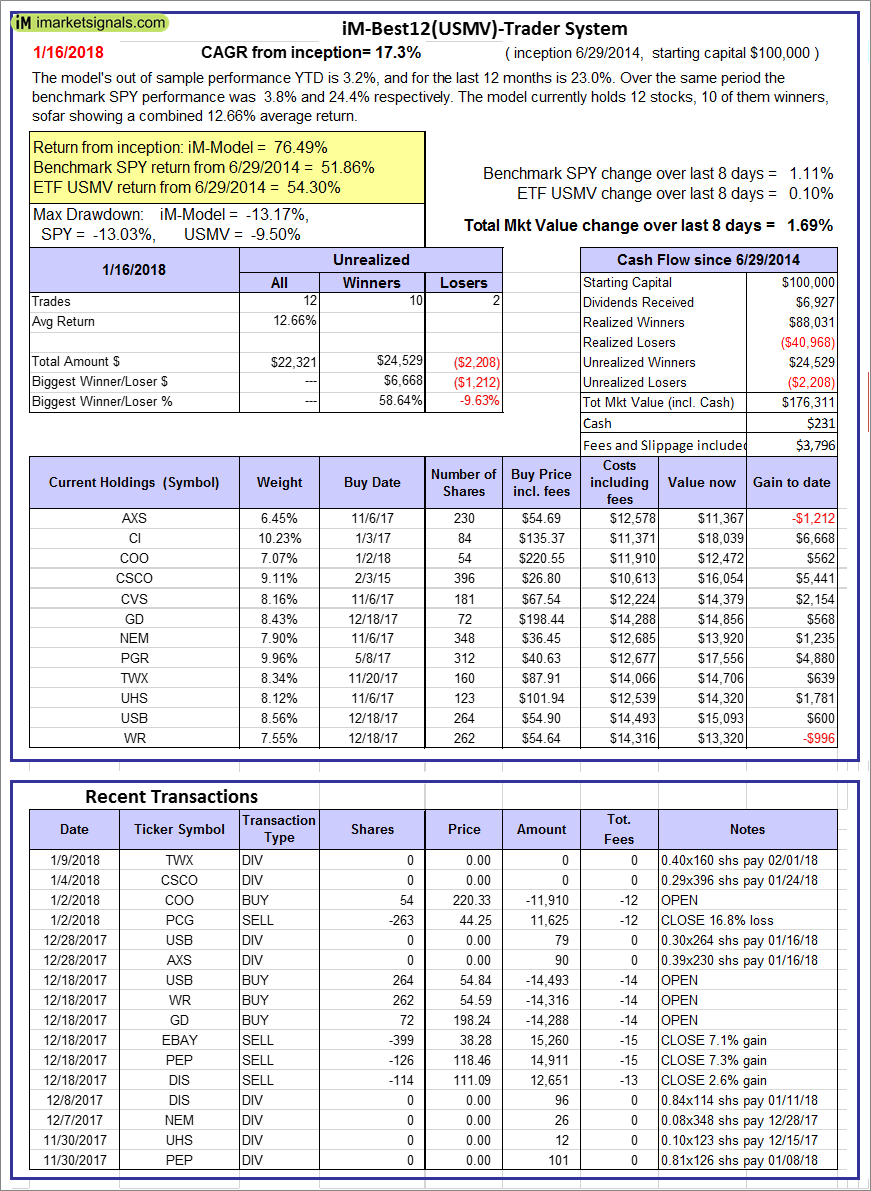
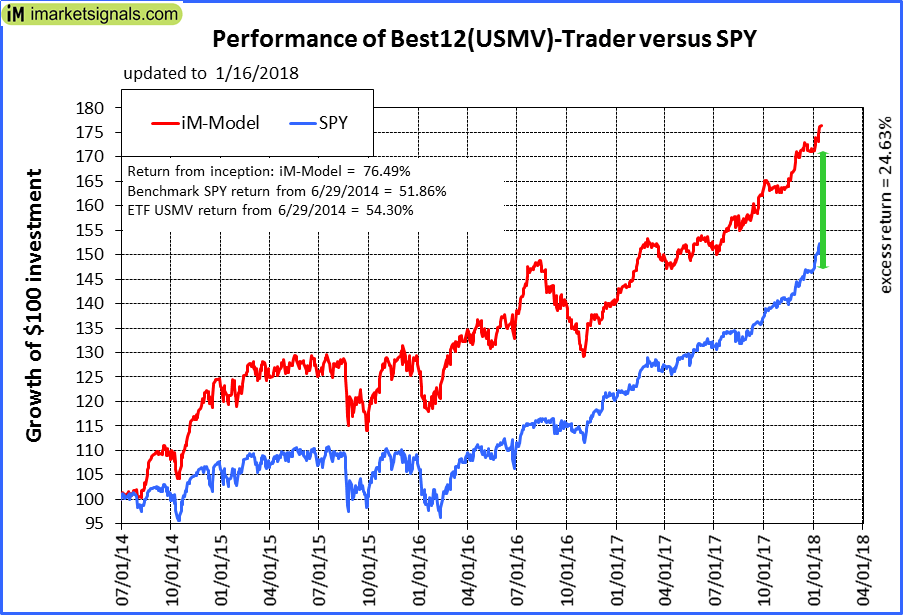
iM-Best12(USMV)-Trader: The model’s out of sample performance YTD is 3.2%, and for the last 12 months is 23.0%. Over the same period the benchmark SPY performance was 3.8% and 24.4% respectively. Since inception, on 6/30/2014, the model gained 76.49% while the benchmark SPY gained 51.86% and the ETF USMV gained 54.30% over the same period. Over the previous week the market value of iM-Best12(USMV)-Trader gained 1.69% at a time when SPY gained 1.11%. A starting capital of $100,000 at inception on 6/30/2014 would have grown to $176,311 which includes $231 cash and excludes $3,796 spent on fees and slippage. |
|
|
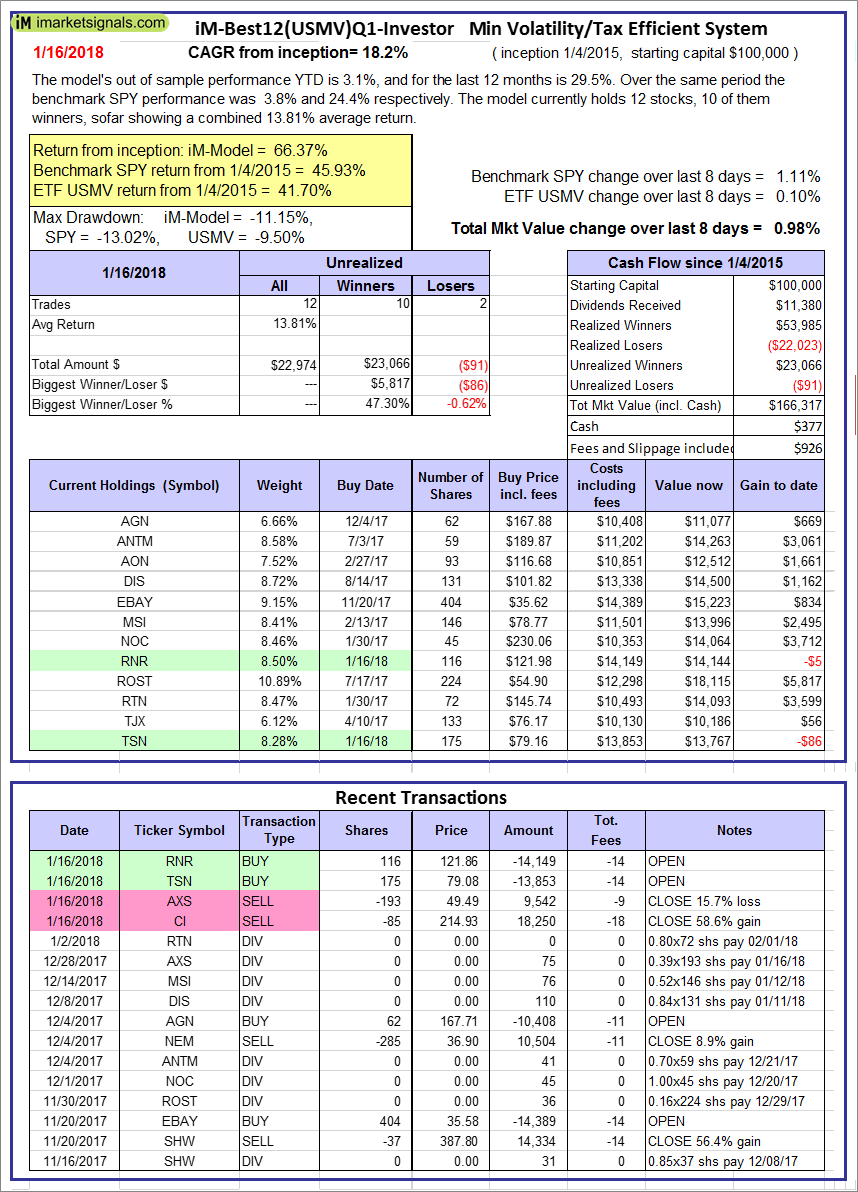
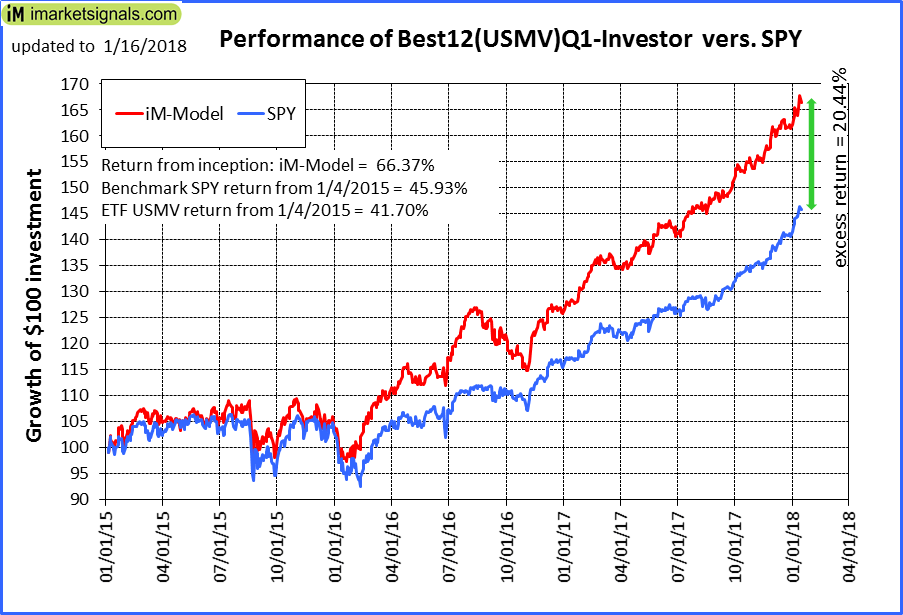
iM-Best12(USMV)Q1-Investor: The model’s out of sample performance YTD is 3.1%, and for the last 12 months is 29.5%. Over the same period the benchmark SPY performance was 3.8% and 24.4% respectively. Since inception, on 1/5/2015, the model gained 66.37% while the benchmark SPY gained 45.93% and the ETF USMV gained 41.70% over the same period. Over the previous week the market value of iM-Best12(USMV)Q1 gained 0.98% at a time when SPY gained 1.11%. A starting capital of $100,000 at inception on 1/5/2015 would have grown to $166,317 which includes $377 cash and excludes $926 spent on fees and slippage. |
|
|
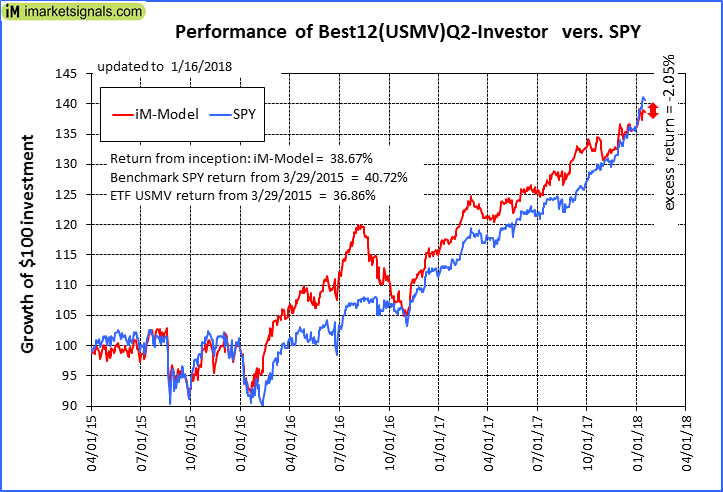
iM-Best12(USMV)Q2-Investor: The model’s out of sample performance YTD is 2.2%, and for the last 12 months is 17.9%. Over the same period the benchmark SPY performance was 3.8% and 24.4% respectively. Since inception, on 3/30/2015, the model gained 38.67% while the benchmark SPY gained 40.72% and the ETF USMV gained 36.86% over the same period. Over the previous week the market value of iM-Best12(USMV)Q2 gained 0.31% at a time when SPY gained 1.11%. A starting capital of $100,000 at inception on 3/30/2015 would have grown to $138,599 which includes $394 cash and excludes $854 spent on fees and slippage. |
|
|
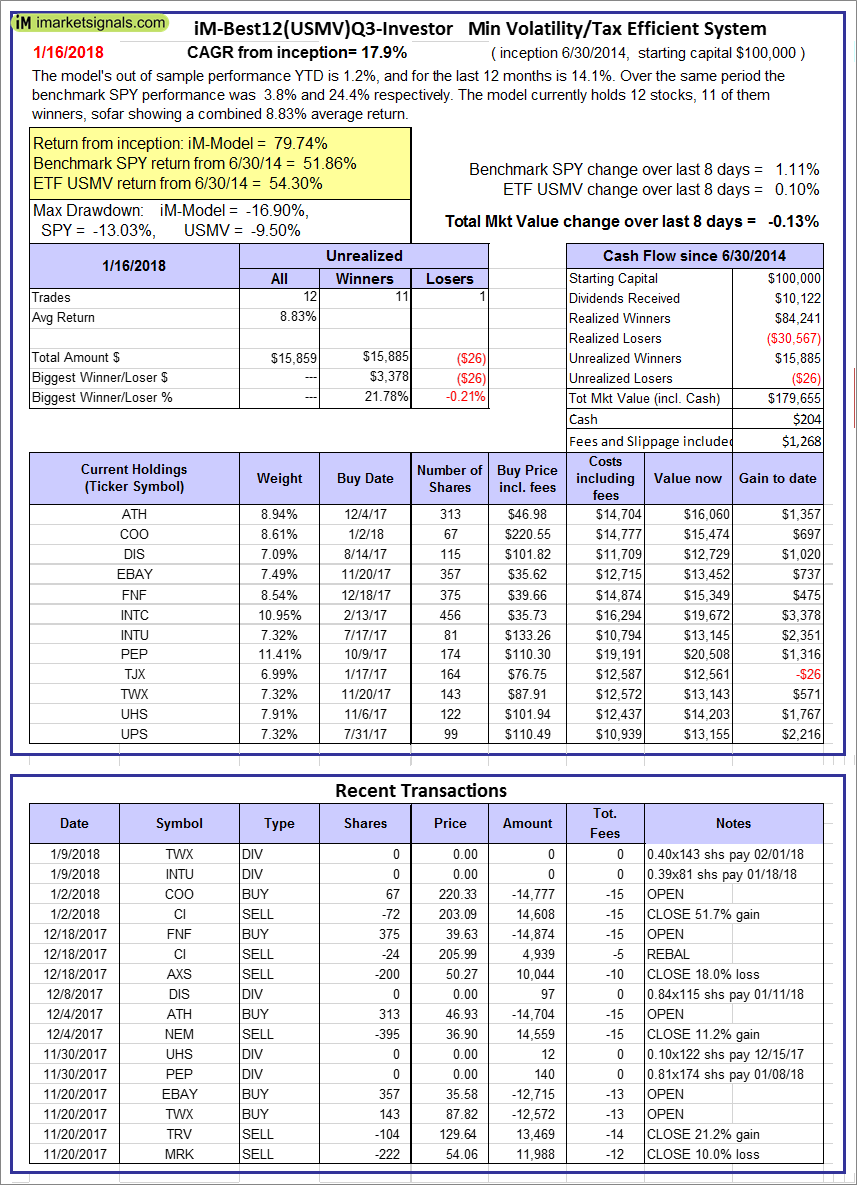
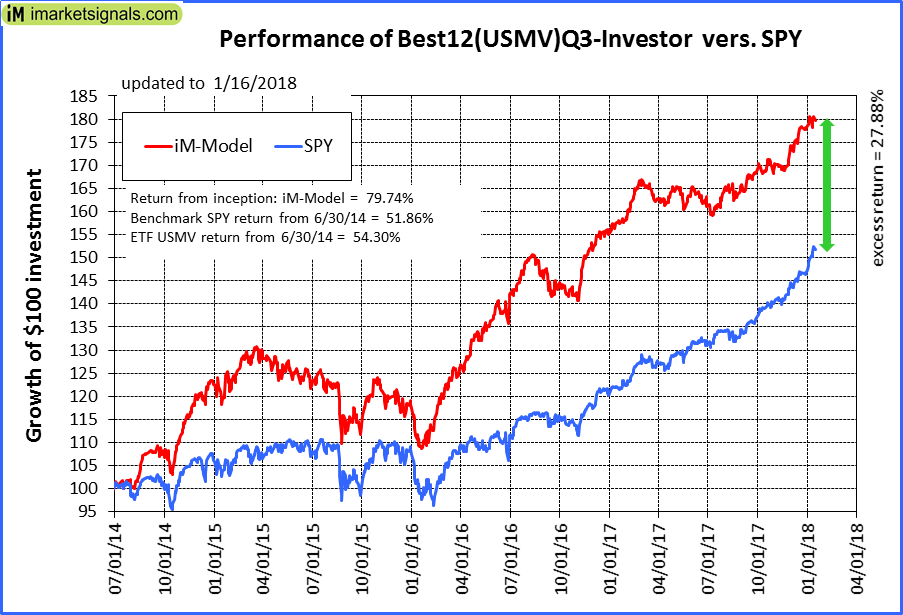
iM-Best12(USMV)Q3-Investor: The model’s out of sample performance YTD is 1.2%, and for the last 12 months is 14.1%. Over the same period the benchmark SPY performance was 3.8% and 24.4% respectively. Since inception, on 7/1/2014, the model gained 79.74% while the benchmark SPY gained 51.86% and the ETF USMV gained 54.30% over the same period. Over the previous week the market value of iM-Best12(USMV)Q3 gained -0.13% at a time when SPY gained 1.11%. A starting capital of $100,000 at inception on 7/1/2014 would have grown to $179,655 which includes $204 cash and excludes $1,268 spent on fees and slippage. |
|
|
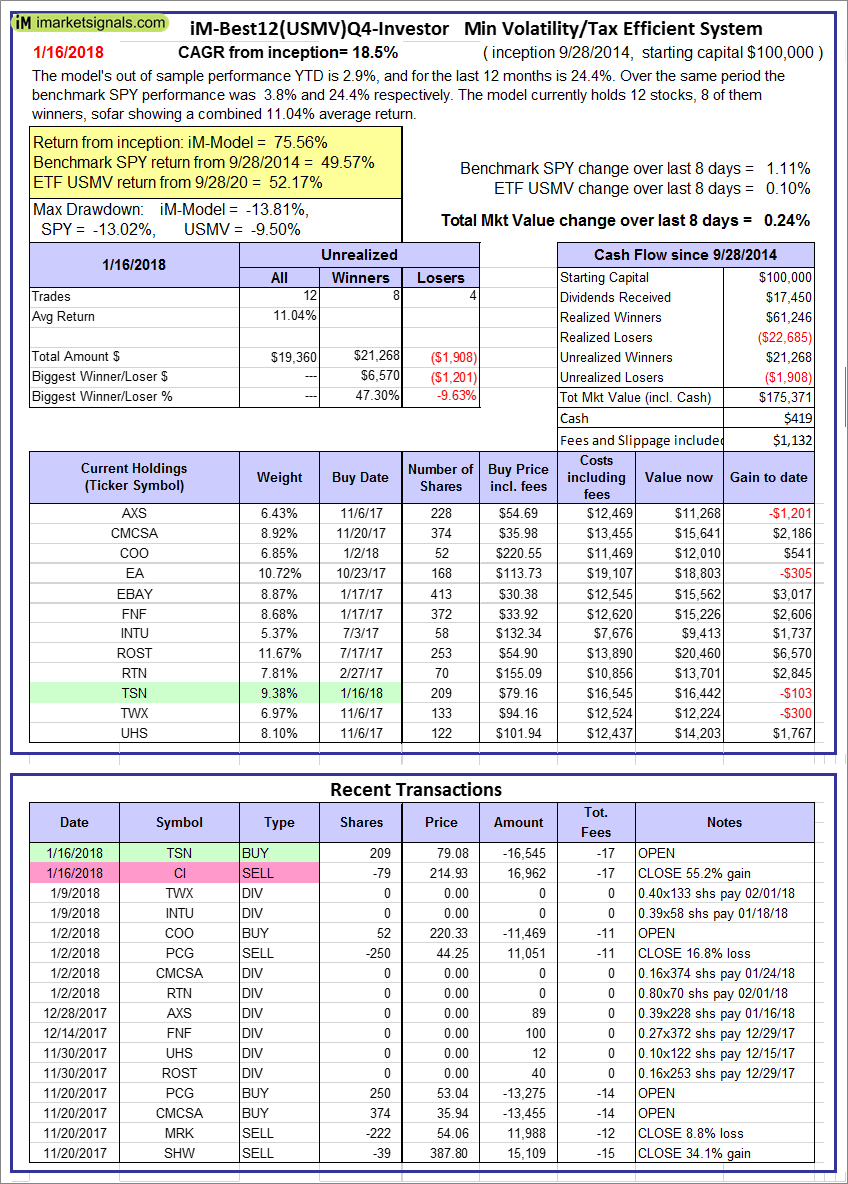
iM-Best12(USMV)Q4-Investor: Since inception, on 9/29/2014, the model gained 75.56% while the benchmark SPY gained 49.57% and the ETF USMV gained 52.17% over the same period. Over the previous week the market value of iM-Best12(USMV)Q4 gained 0.24% at a time when SPY gained 1.11%. A starting capital of $100,000 at inception on 9/29/2014 would have grown to $175,371 which includes $419 cash and excludes $1,132 spent on fees and slippage. |
|
|
Average Performance of iM-Best12(USMV)Q1+Q2+Q3+Q4-Investor resulted in an excess return of 37.88% over SPY. (see iM-USMV Investor Portfolio) |
|
|
iM-Best(Short): The model’s out of sample performance YTD is -0.2%, and for the last 12 months is -5.9%. Over the same period the benchmark SPY performance was 3.8% and 24.4% respectively. Over the previous week the market value of iM-Best(Short) gained 0.14% at a time when SPY gained 1.11%. Over the period 1/2/2009 to 1/16/2018 the starting capital of $100,000 would have grown to $91,083 which includes $127,554 cash and excludes $23,552 spent on fees and slippage. |
|
|
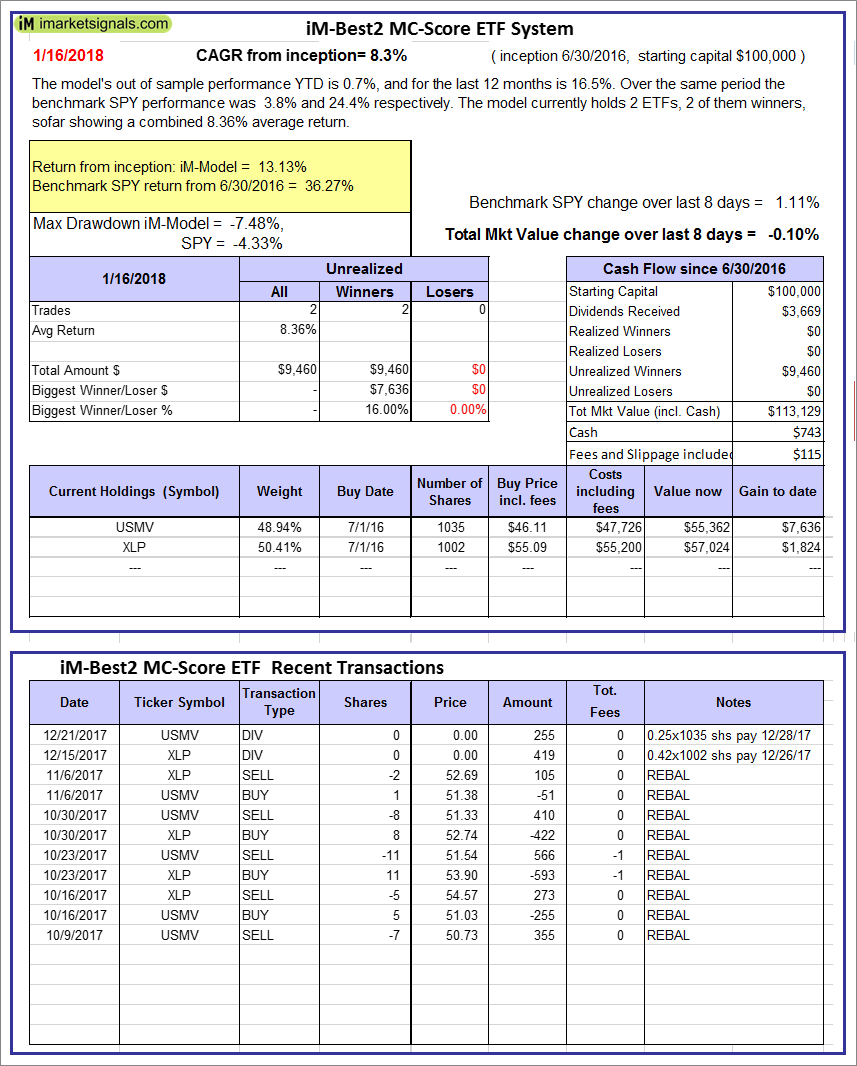
iM-Best2 MC-Score ETF System: The model’s out of sample performance YTD is 0.7%, and for the last 12 months is 16.5%. Over the same period the benchmark SPY performance was 3.8% and 24.4% respectively. Over the previous week the market value of the iM-Best2 MC-Score ETF System gained -0.10% at a time when SPY gained 1.11%. A starting capital of $100,000 at inception on 6/30/2016 would have grown to $113,129 which includes $743 cash and excludes $115 spent on fees and slippage. |
|
|
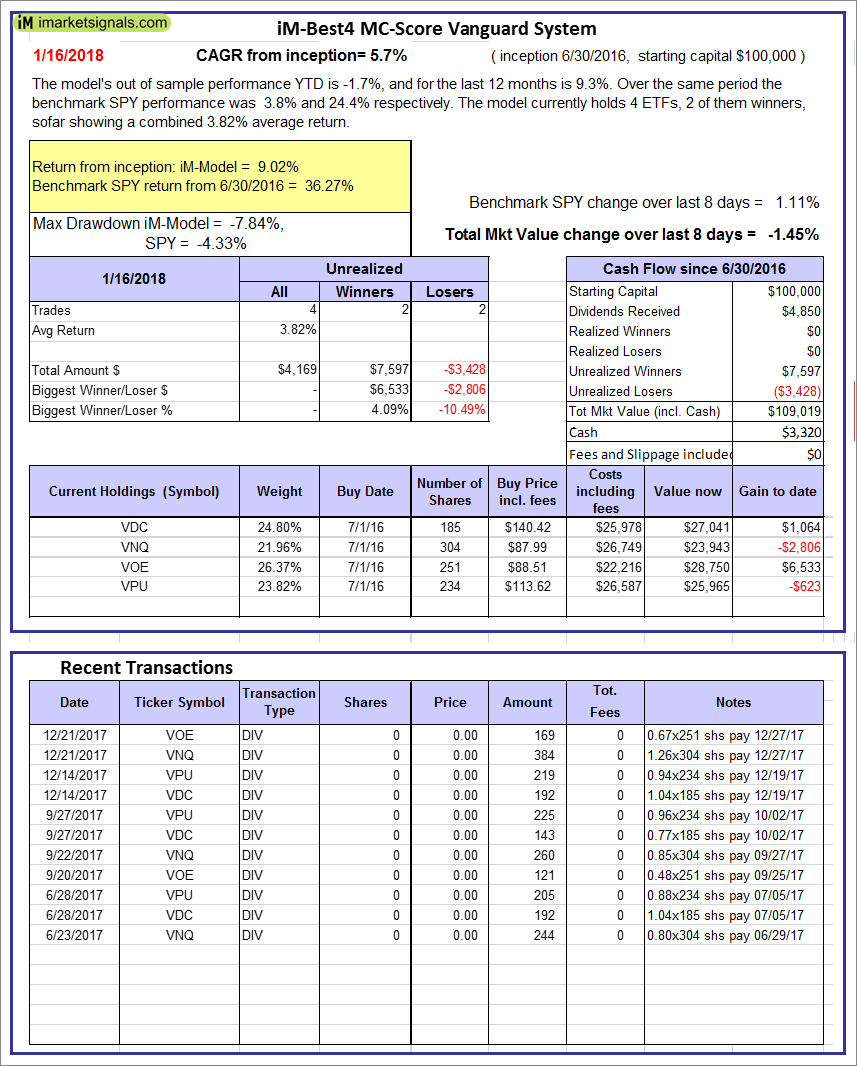
iM-Best4 MC-Score Vanguard System: The model’s out of sample performance YTD is -1.7%, and for the last 12 months is 9.3%. Over the same period the benchmark SPY performance was 3.8% and 24.4% respectively. Over the previous week the market value of the iM-Best4 MC-Score Vanguard System gained -1.45% at a time when SPY gained 1.11%. A starting capital of $100,000 at inception on 6/30/2016 would have grown to $109,019 which includes $3,320 cash and excludes $00 spent on fees and slippage. |
|
|
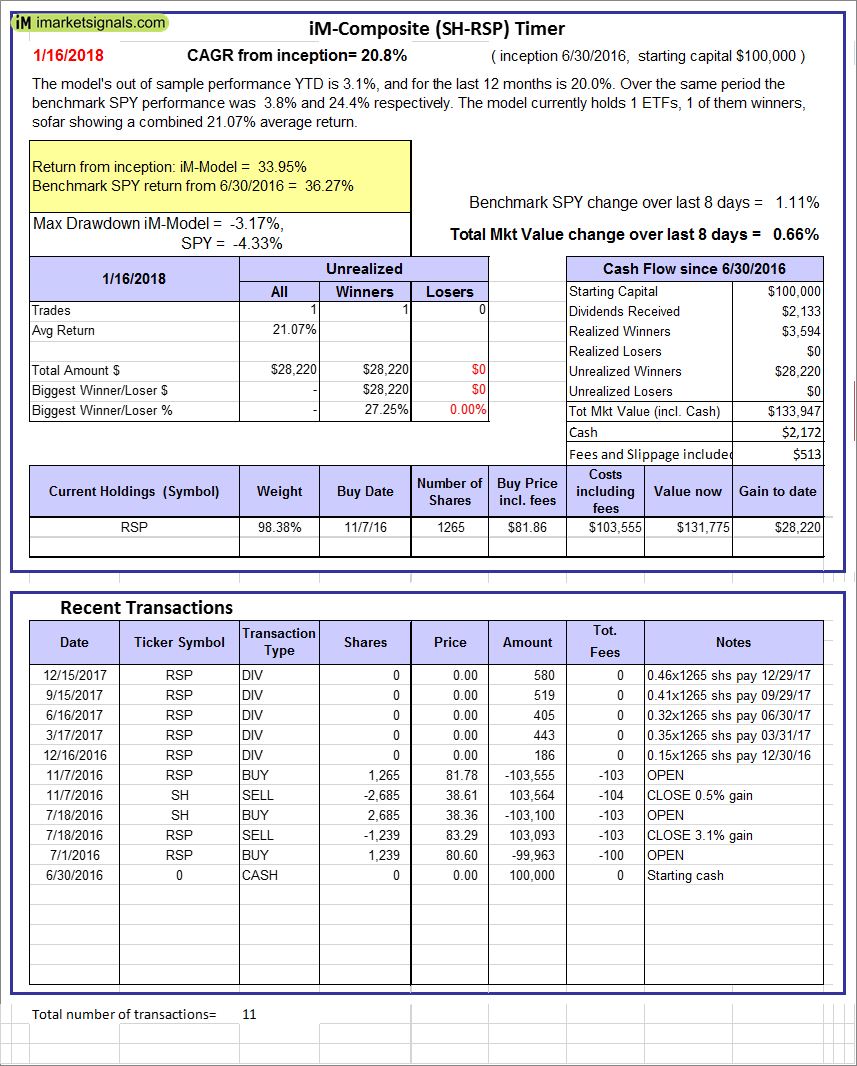
iM-Composite (SH-RSP) Timer: The model’s out of sample performance YTD is 3.1%, and for the last 12 months is 20.0%. Over the same period the benchmark SPY performance was 3.8% and 24.4% respectively. Over the previous week the market value of the iM-Composite (SH-RSP) Timer gained 0.66% at a time when SPY gained 1.11%. A starting capital of $100,000 at inception on 6/30/2016 would have grown to $133,947 which includes $2,172 cash and excludes $513 spent on fees and slippage. |
|
|
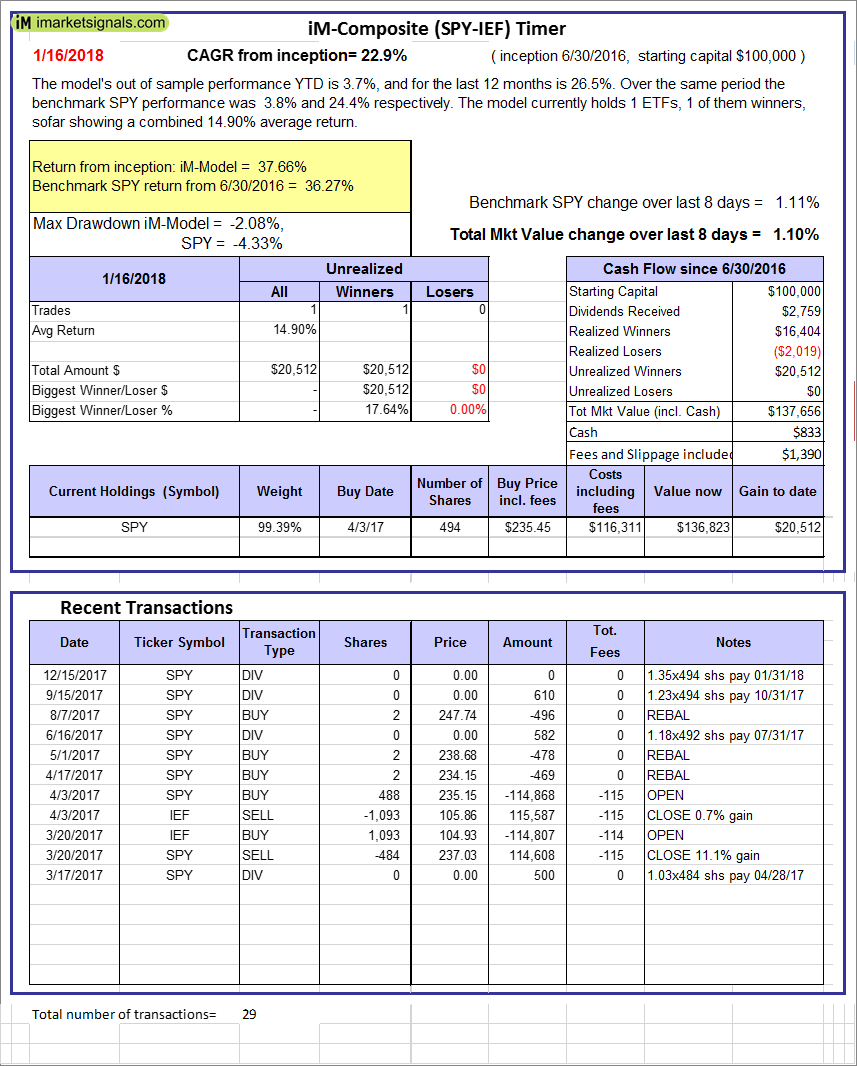
iM-Composite (SPY-IEF) Timer: The model’s out of sample performance YTD is 3.7%, and for the last 12 months is 26.5%. Over the same period the benchmark SPY performance was 3.8% and 24.4% respectively. Over the previous week the market value of the iM-Composite (SPY-IEF) Timer gained 1.10% at a time when SPY gained 1.11%. A starting capital of $100,000 at inception on 6/30/2016 would have grown to $137,656 which includes $833 cash and excludes $1,390 spent on fees and slippage. |
|
|
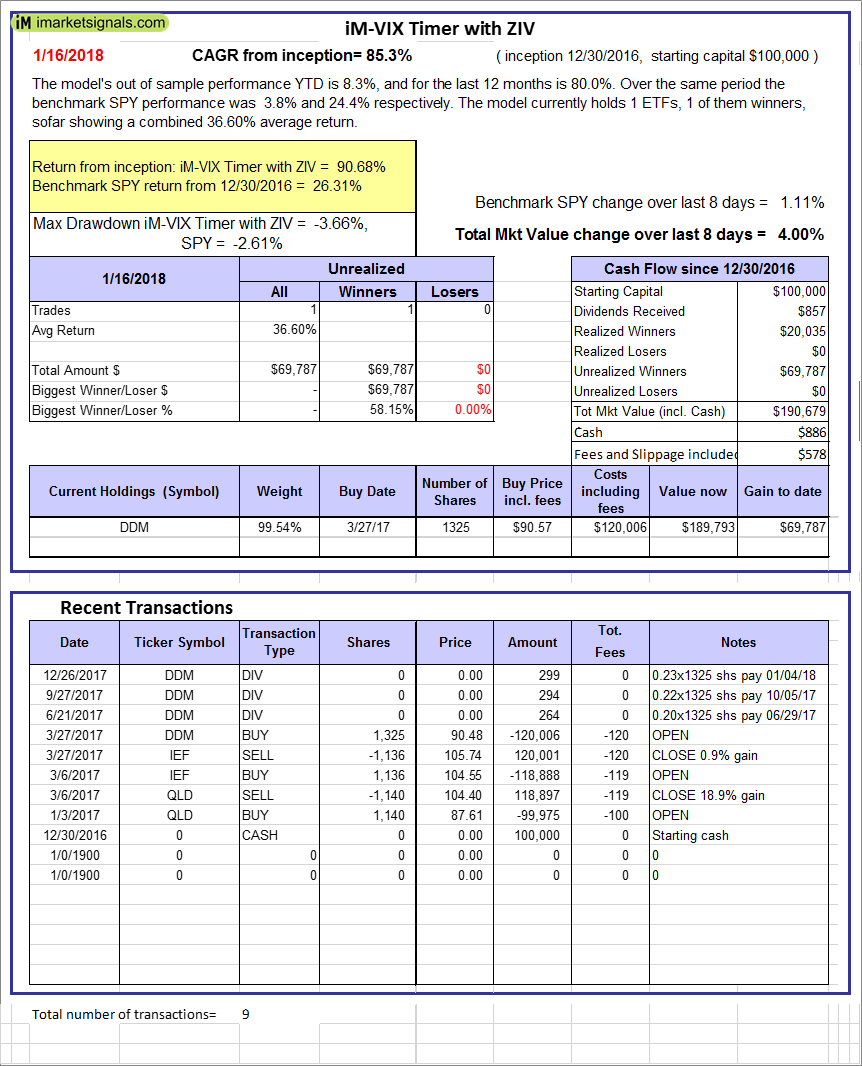
iM-VIX Timer with ZIV: The model’s out of sample performance YTD is 8.3%, and for the last 12 months is 80.0%. Over the same period the benchmark SPY performance was 3.8% and 24.4% respectively. Over the previous week the market value of the iM-VIX Timer with ZIV gained 4.00% at a time when SPY gained 1.11%. A starting capital of $100,000 at inception on 6/30/2016 would have grown to $190,679 which includes $886 cash and excludes $578 spent on fees and slippage. |
|
|
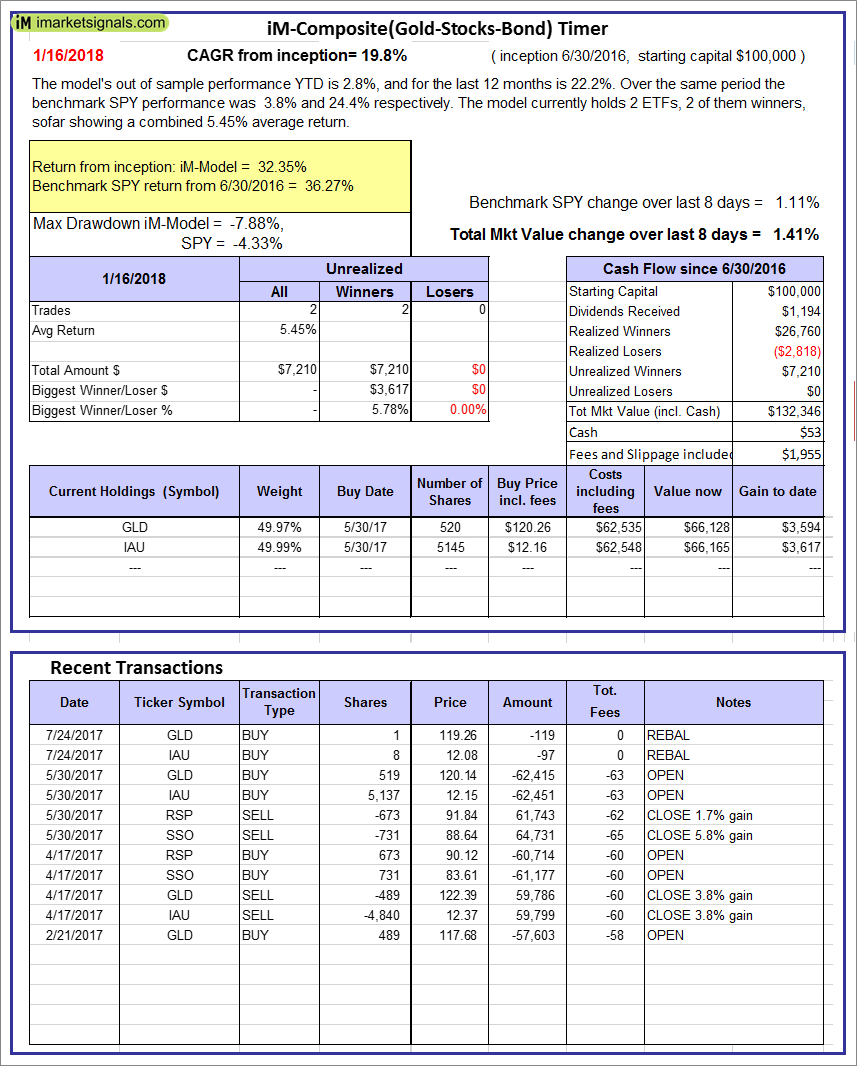
iM-Composite(Gold-Stocks-Bond) Timer: The model’s out of sample performance YTD is 2.8%, and for the last 12 months is 22.2%. Over the same period the benchmark SPY performance was 3.8% and 24.4% respectively. Over the previous week the market value of the iM-Composite(Gold-Stocks-Bond) Timer gained 1.41% at a time when SPY gained 1.11%. A starting capital of $100,000 at inception on 6/30/2016 would have grown to $132,346 which includes $53 cash and excludes $1,955 spent on fees and slippage. |
|
|
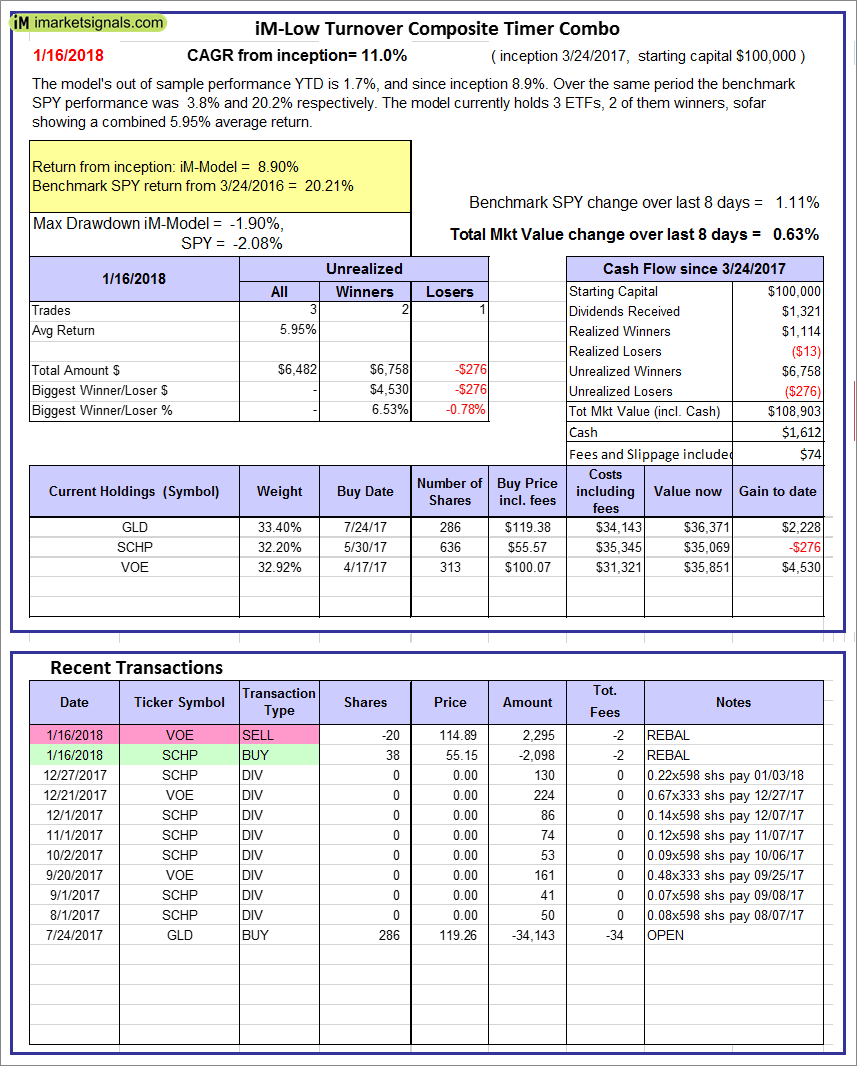
iM-Low Turnover Composite Timer Combo: The model’s out of sample performance YTD is 1.7%, and since inception 8.9%. Over the same period the benchmark SPY performance was 3.8% and 20.2% respectively. Over the previous week the market value of the iM-Low Turnover Composite Timer Combo gained 0.63% at a time when SPY gained 1.11%. A starting capital of $100,000 at inception on 3/24/27 would have grown to $108,903 which includes $1,612 cash and excludes $74 spent on fees and slippage. |
|
|
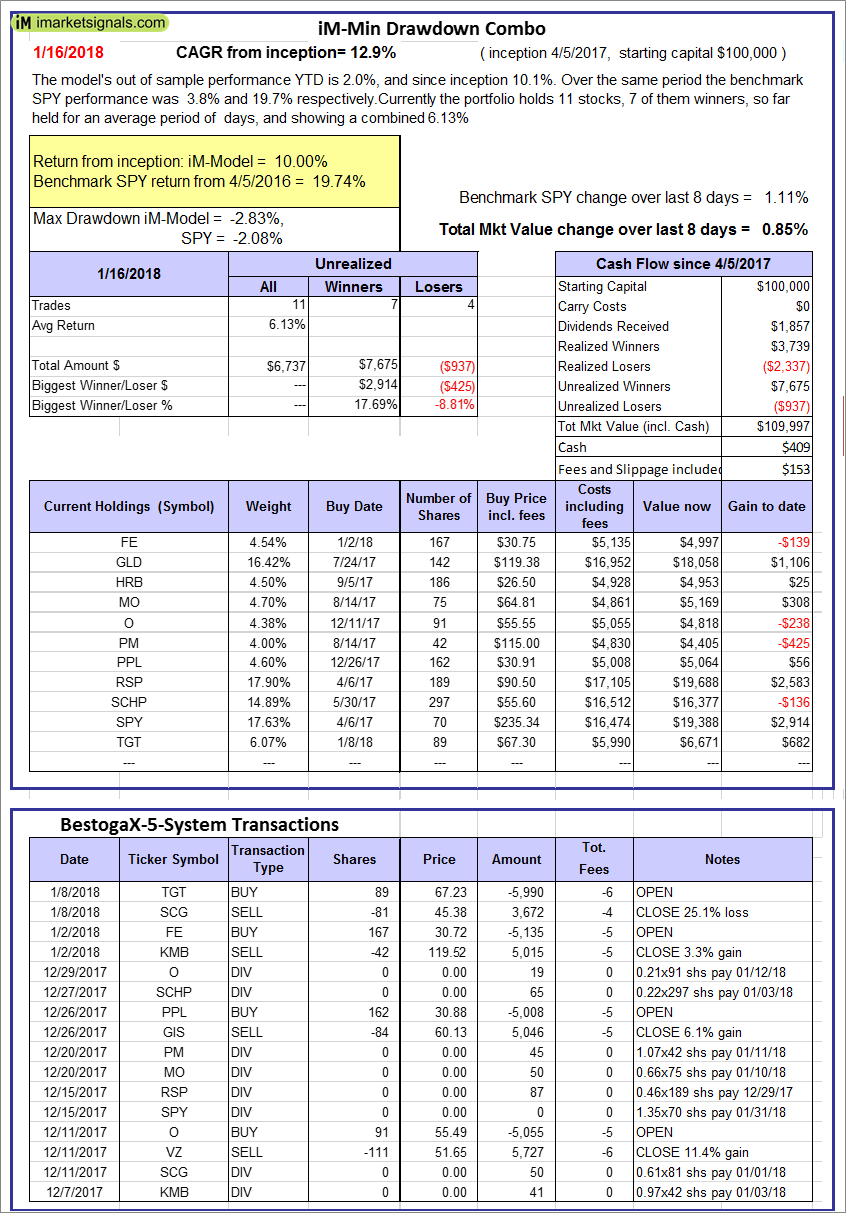
iM-Min Drawdown Combo: The model’s out of sample performance YTD is 2.0%, and since inception 10.1%. Over the same period the benchmark SPY performance was 3.8% and 19.7% respectively. Over the previous week the market value of the iM-Min Drawdown Combo gained 0.85% at a time when SPY gained 1.11%. A starting capital of $100,000 at inception on 4/5/2017 would have grown to $109,997 which includes $409 cash and excludes $153 spent on fees and slippage. |
|
|
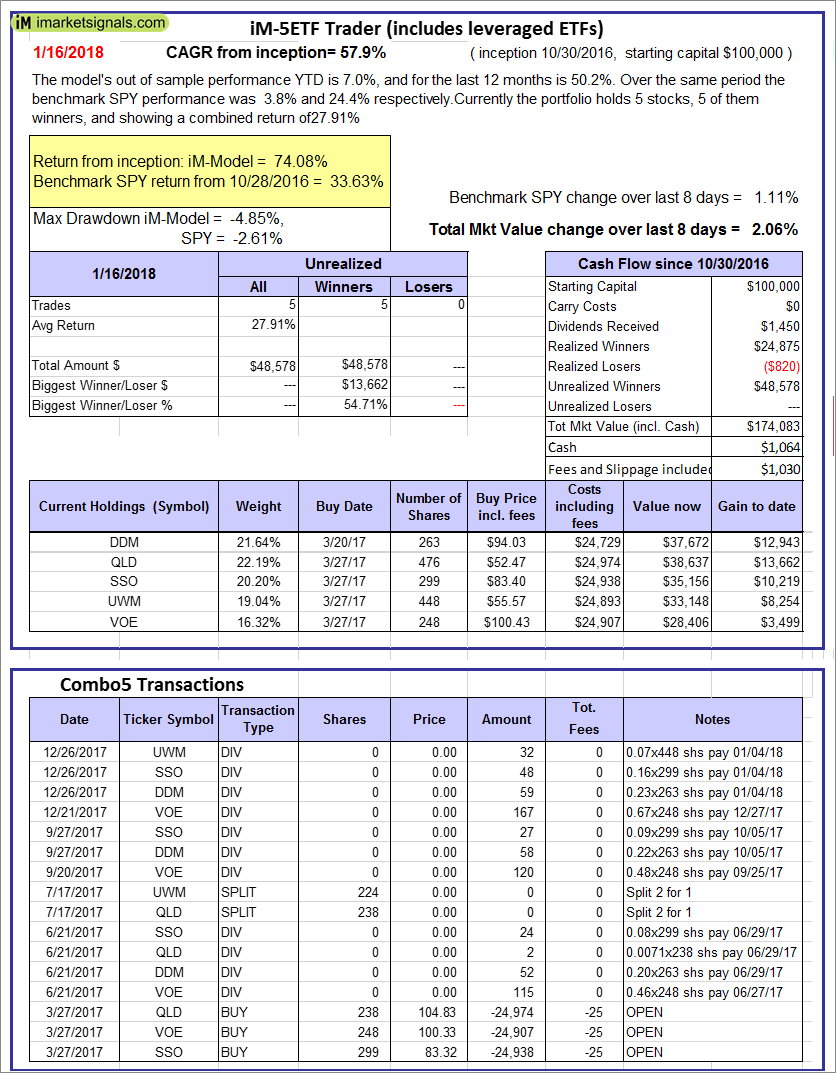
iM-5ETF Trader (includes leveraged ETFs): The model’s out of sample performance YTD is 7.0%, and for the last 12 months is 50.2%. Over the same period the benchmark SPY performance was 3.8% and 24.4% respectively. Over the previous week the market value of the iM-5ETF Trader (includes leveraged ETFs) gained 2.06% at a time when SPY gained 1.11%. A starting capital of $100,000 at inception on 10/30/2016 would have grown to $174,083 which includes $1,064 cash and excludes $1,030 spent on fees and slippage. |
|
|
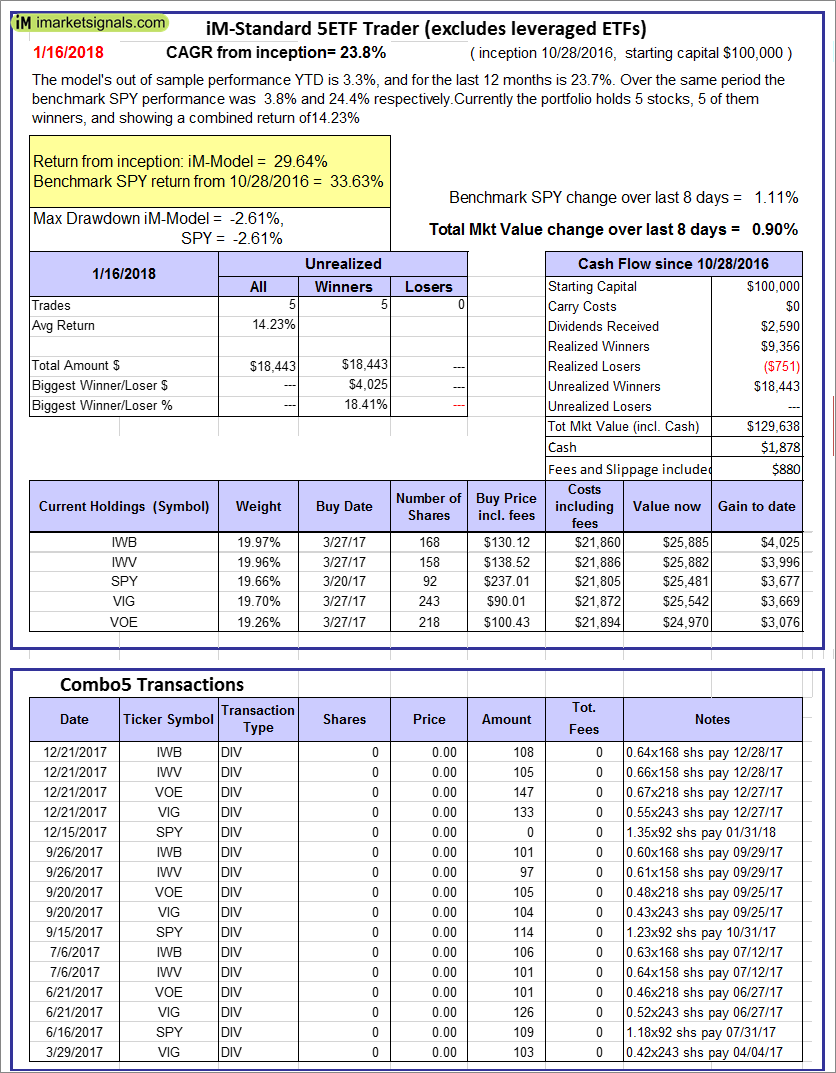
iM-Standard 5ETF Trader (excludes leveraged ETFs): The model’s out of sample performance YTD is 3.3%, and for the last 12 months is 23.7%. Over the same period the benchmark SPY performance was 3.8% and 24.4% respectively. Over the previous week the market value of the iM-Standard 5ETF Trader (excludes leveraged ETFs) gained 0.90% at a time when SPY gained 1.11%. A starting capital of $100,000 at inception on 10/30/2016 would have grown to $129,638 which includes $1,878 cash and excludes $880 spent on fees and slippage. |


Leave a Reply
You must be logged in to post a comment.