  |
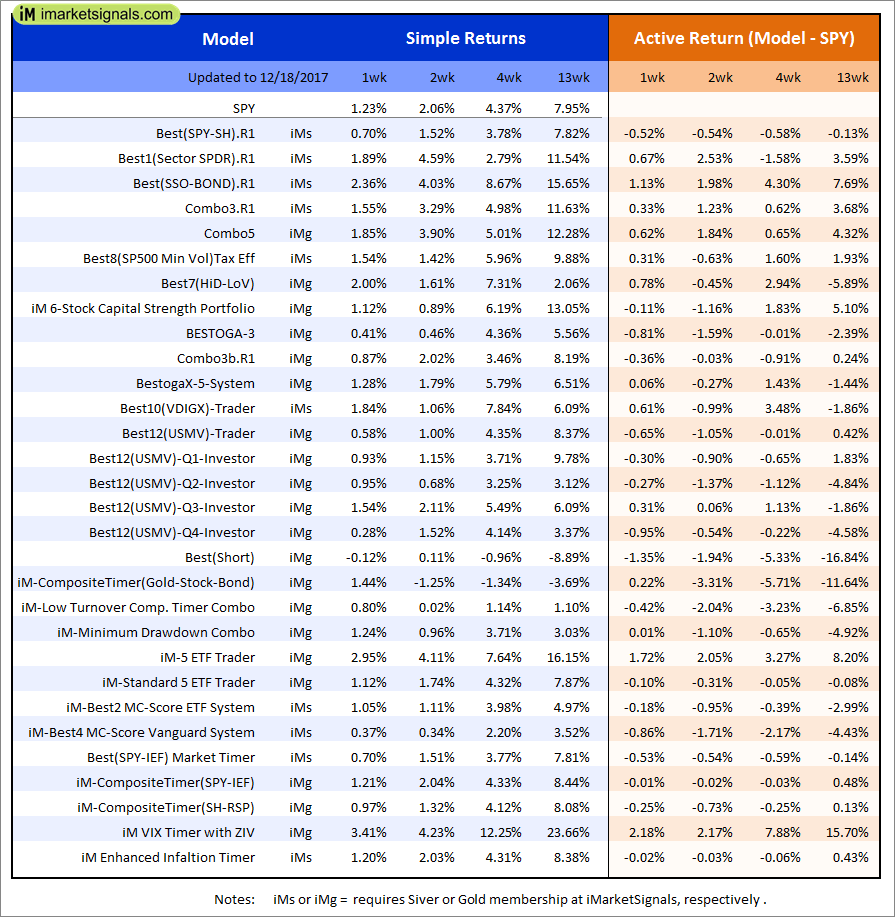
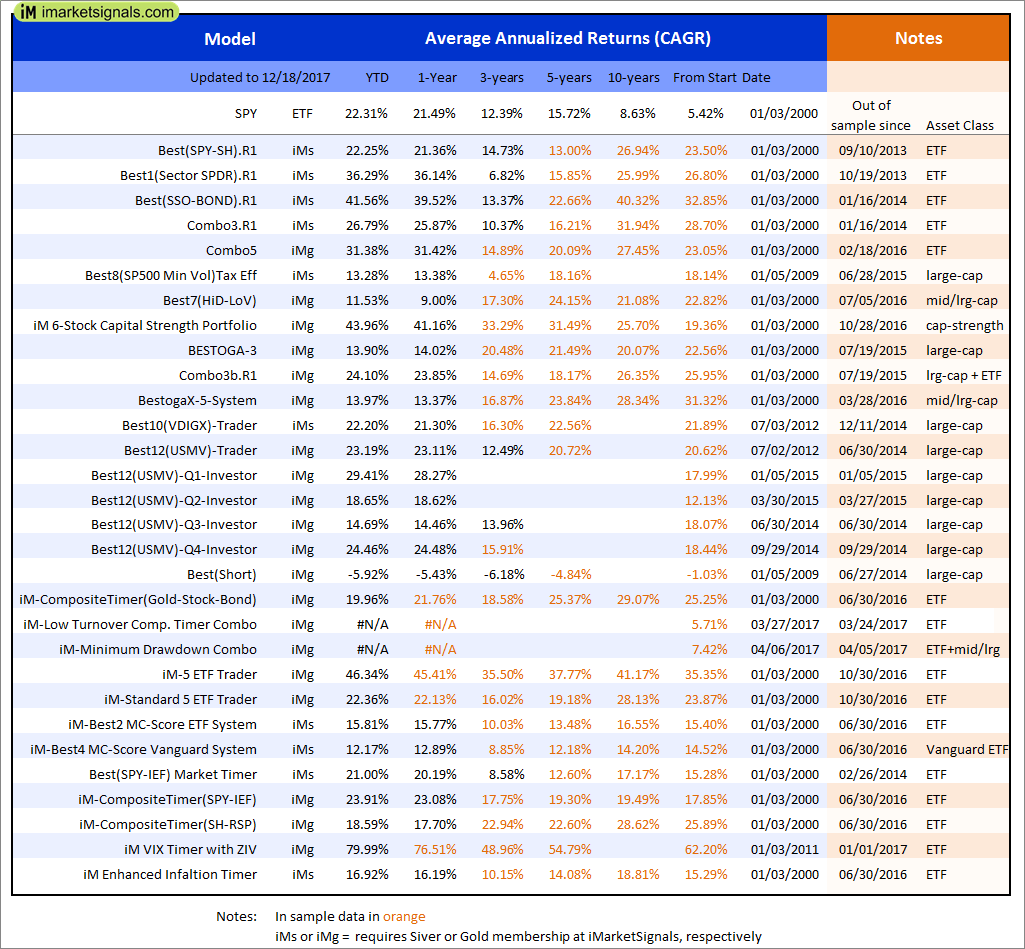
Out of sample performance summary of our models for the past 1, 2, 4 and 13 week periods. The active active return indicates how the models over- or underperformed the benchmark ETF SPY. Also the YTD, and the 1-, 3-, 5- and 10-year annualized returns are shown in the second table |
|
|
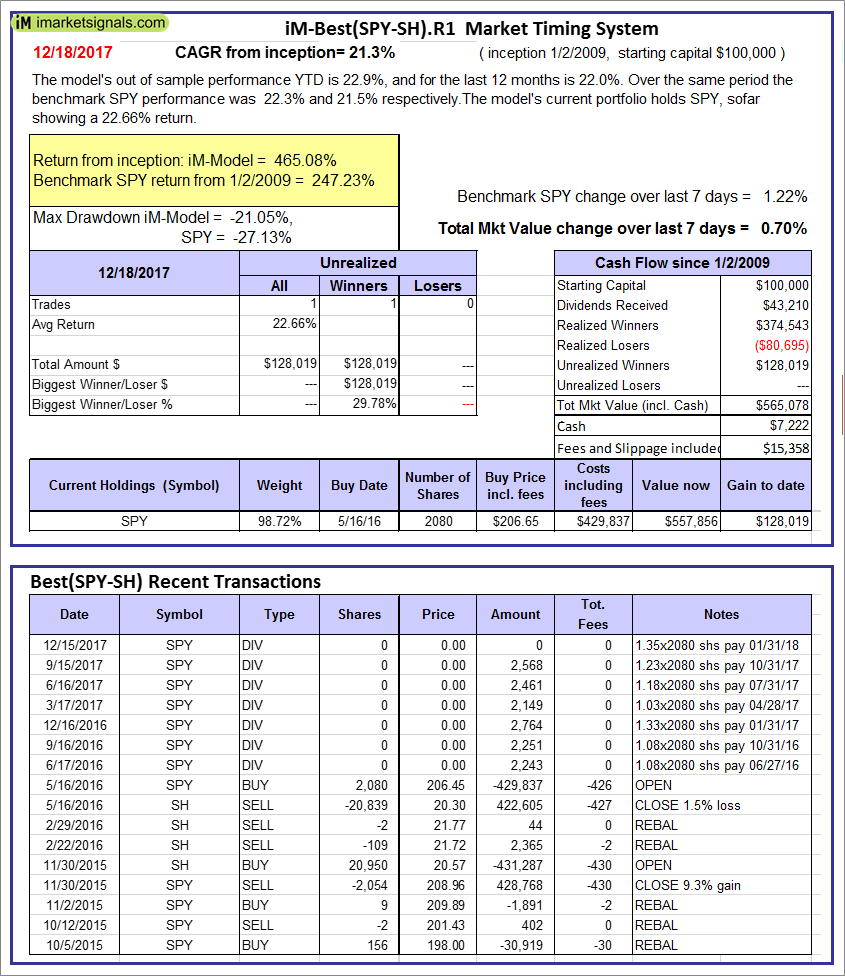
iM-Best(SPY-SH).R1: The model’s out of sample performance YTD is 22.9%, and for the last 12 months is 22.0%. Over the same period the benchmark SPY performance was 22.3% and 21.5% respectively. Over the previous week the market value of Best(SPY-SH) gained 0.70% at a time when SPY gained 1.22%. A starting capital of $100,000 at inception on 1/2/2009 would have grown to $565,078 which includes $7,222 cash and excludes $15,358 spent on fees and slippage. |
|
|
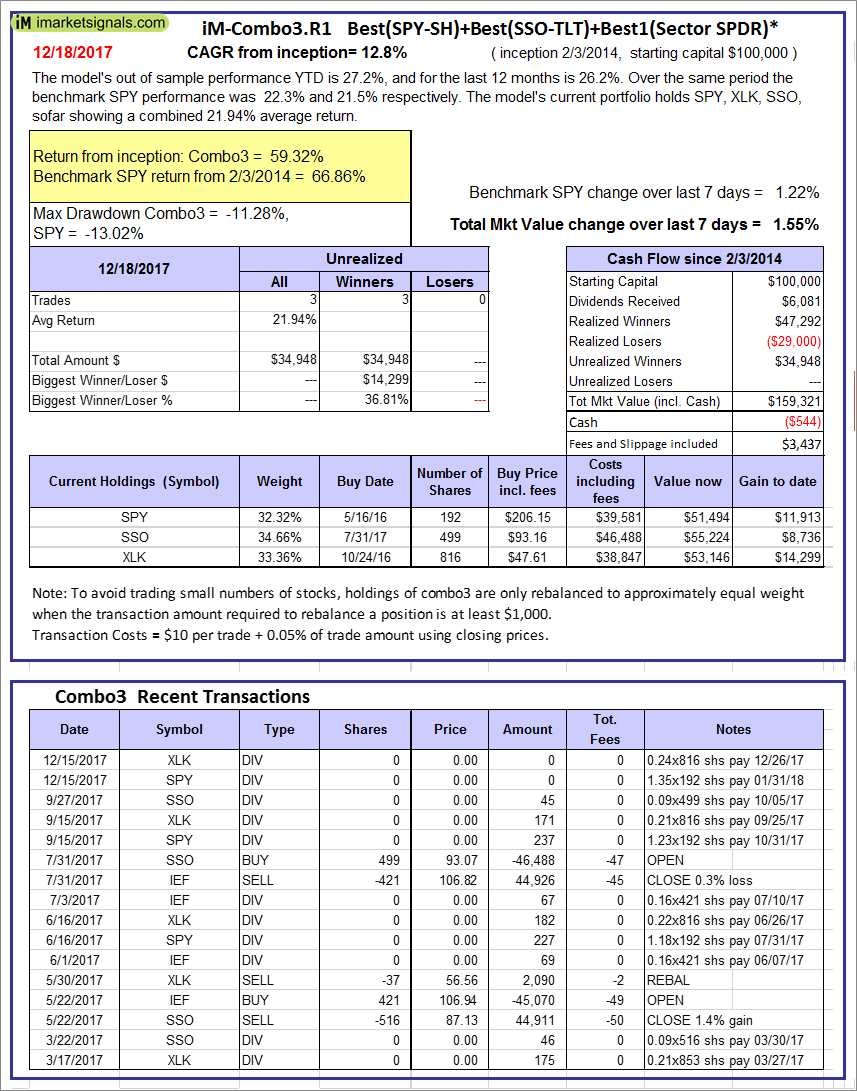
iM-Combo3.R1: The model’s out of sample performance YTD is 27.2%, and for the last 12 months is 26.2%. Over the same period the benchmark SPY performance was 22.3% and 21.5% respectively. Over the previous week the market value of iM-Combo3.R1 gained 1.55% at a time when SPY gained 1.22%. A starting capital of $100,000 at inception on 2/3/2014 would have grown to $159,321 which includes -$544 cash and excludes $3,437 spent on fees and slippage. |
|
|
iM-Combo5: The model’s out of sample performance YTD is 31.7%, and for the last 12 months is 31.8%. Over the same period the benchmark SPY performance was 22.3% and 21.5% respectively. Over the previous week the market value of iM-Combo5 gained 1.85% at a time when SPY gained 1.22%. A starting capital of $100,000 at inception on 2/22/2016 would have grown to $129,580 which includes $409 cash and excludes $603 spent on fees and slippage. |
|
|
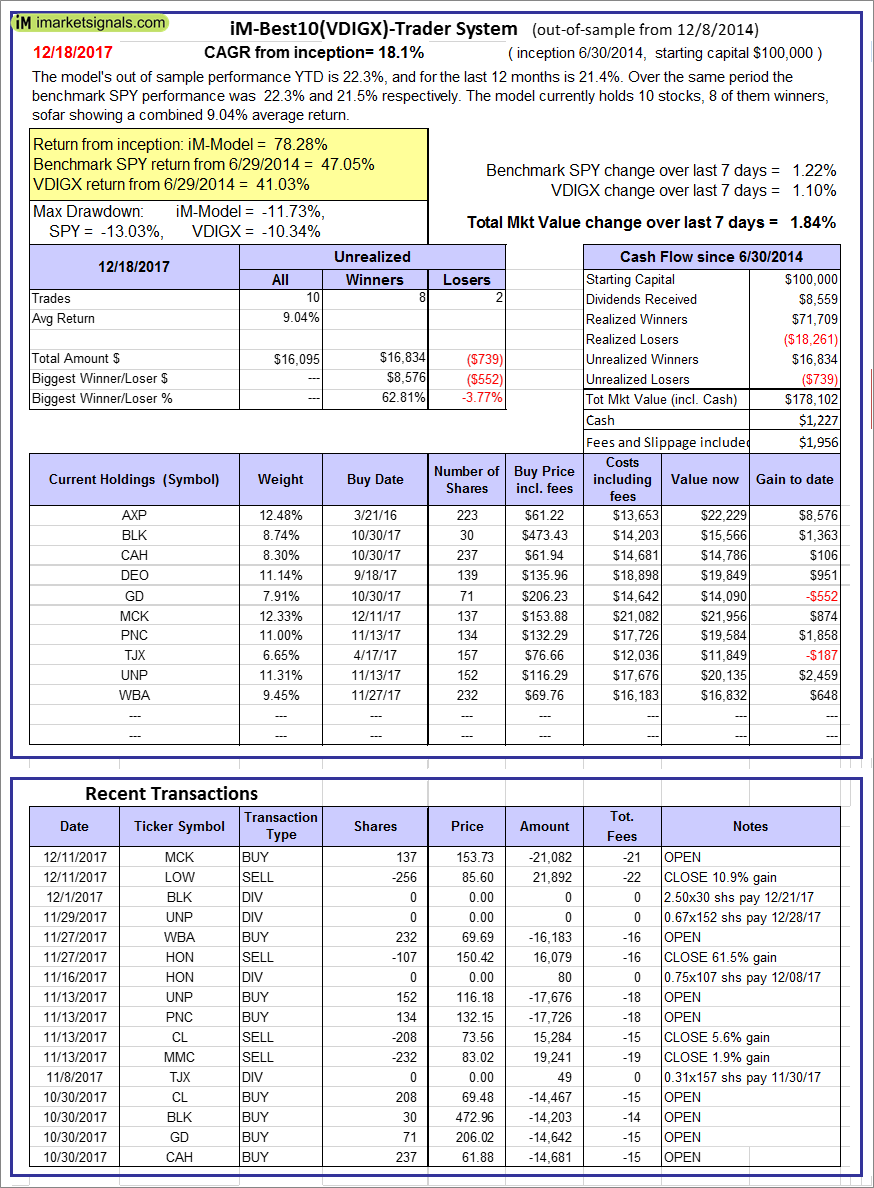
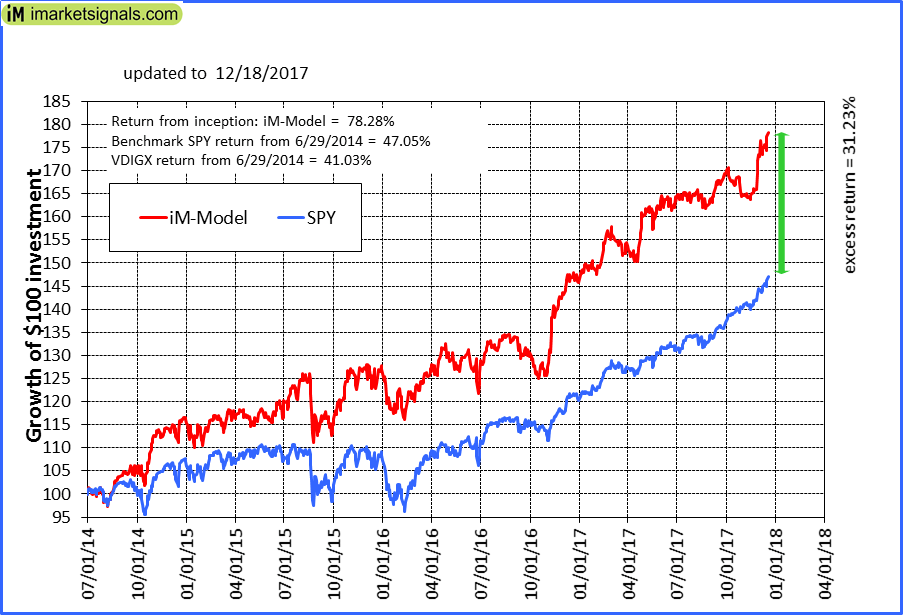
iM-Best10(VDIGX)-Trader: The model’s out of sample performance YTD is 22.3%, and for the last 12 months is 21.4%. Over the same period the benchmark SPY performance was 22.3% and 21.5% respectively. Since inception, on 7/1/2014, the model gained 78.28% while the benchmark SPY gained 47.05% and VDIGX gained 41.03% over the same period. Over the previous week the market value of iM-Best10(VDIGX) gained 1.84% at a time when SPY gained 1.22%. A starting capital of $100,000 at inception on 7/1/2014 would have grown to $178,102 which includes $1,227 cash and excludes $1,956 spent on fees and slippage. |
|
|
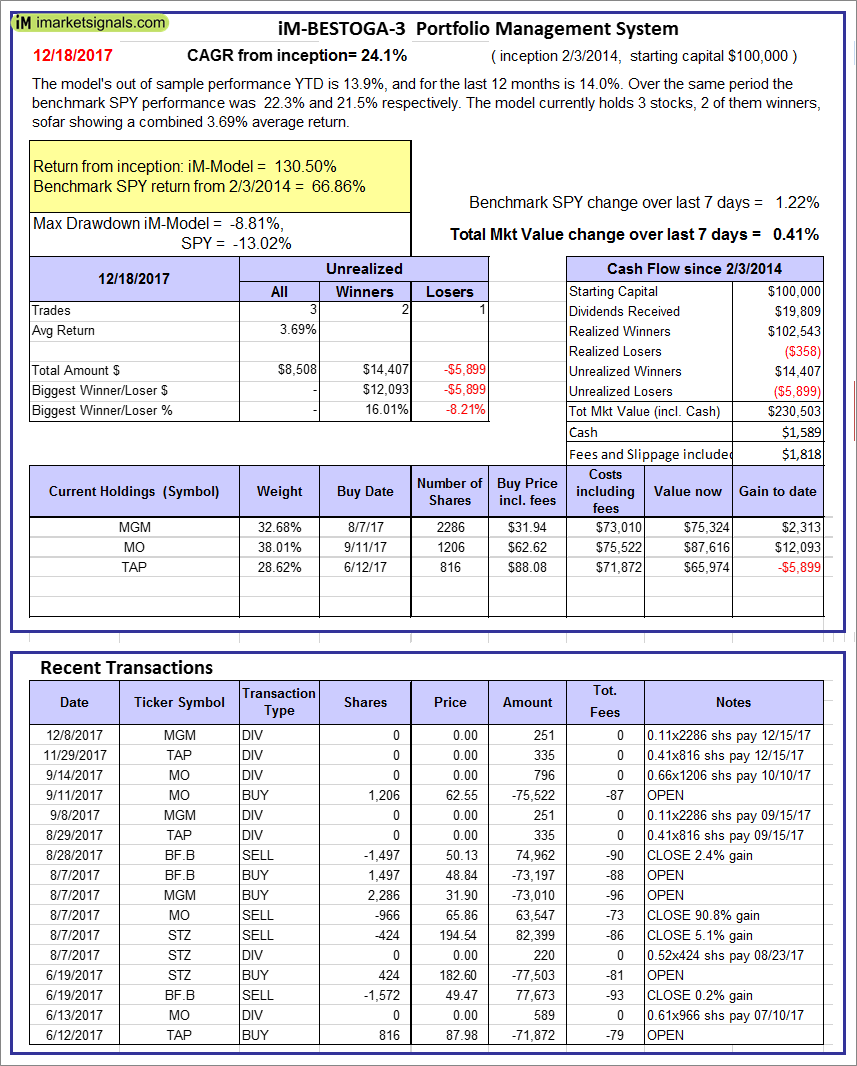
iM-BESTOGA-3: The model’s out of sample performance YTD is 13.9%, and for the last 12 months is 14.0%. Over the same period the benchmark SPY performance was 22.3% and 21.5% respectively. Over the previous week the market value of iM-BESTOGA-3 gained 0.41% at a time when SPY gained 1.22%. A starting capital of $100,000 at inception on 2/3/2014 would have grown to $230,503 which includes $1,589 cash and excludes $1,818 spent on fees and slippage. |
|
|
iM-Best7(HiD-LoV): The model’s out of sample performance YTD is 12.0%, and for the last 12 months is 9.5%. Over the same period the benchmark SPY performance was 22.3% and 21.5% respectively. Over the previous week the market value of iM-BESTOGA-3 gained 2.00% at a time when SPY gained 1.22%. A starting capital of $100,000 at inception on 6/30/2016 would have grown to $114,602 which includes $155 cash and excludes $1,298 spent on fees and slippage. |
|
|
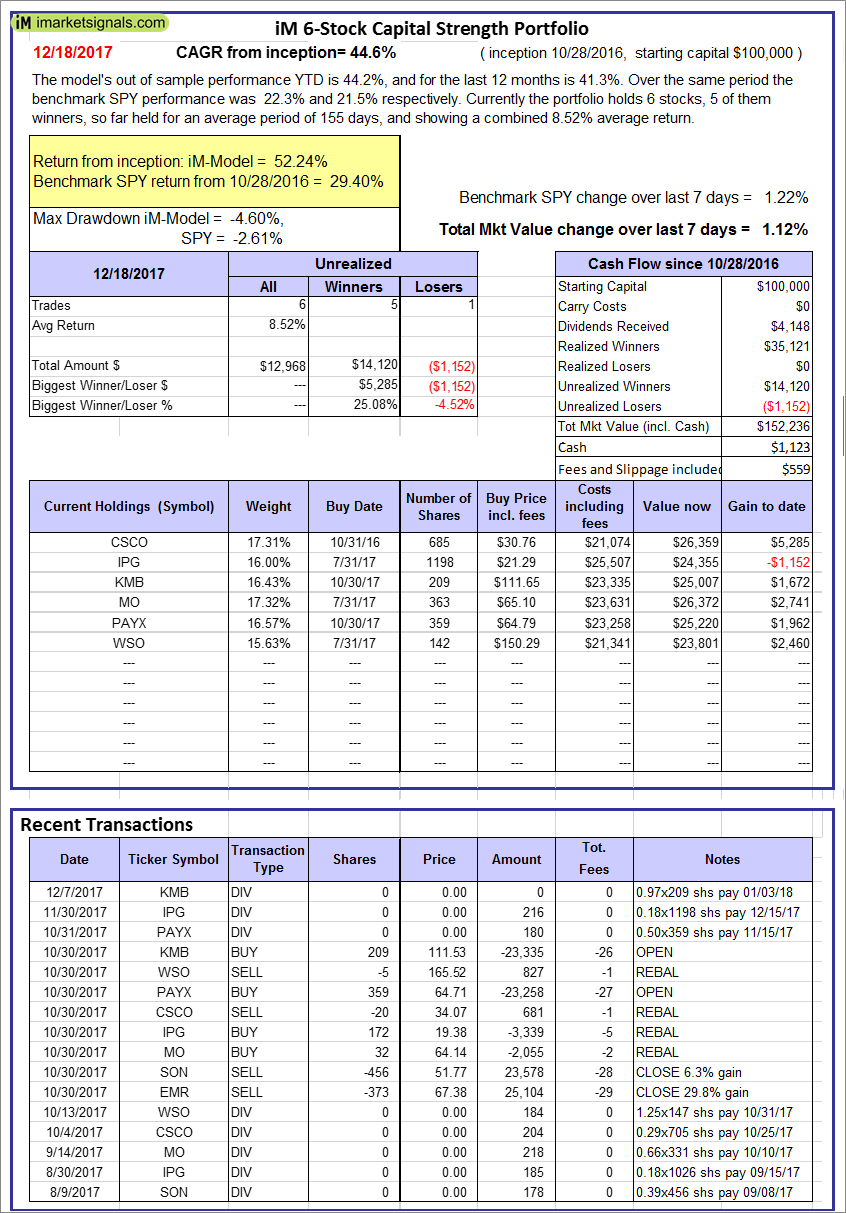
iM 6-Stock Capital Strength Portfolio: The model’s out of sample performance YTD is 44.2%, and for the last 12 months is 41.3%. Over the same period the benchmark SPY performance was 22.3% and 21.5% respectively. Over the previous week the market value of the iM 6-Stock Capital Strength Portfolio gained 1.12% at a time when SPY gained 1.22%. A starting capital of $100,000 at inception on 10/28/2016 would have grown to $152,236 which includes $1,123 cash and excludes $559 spent on fees and slippage. |
|
|
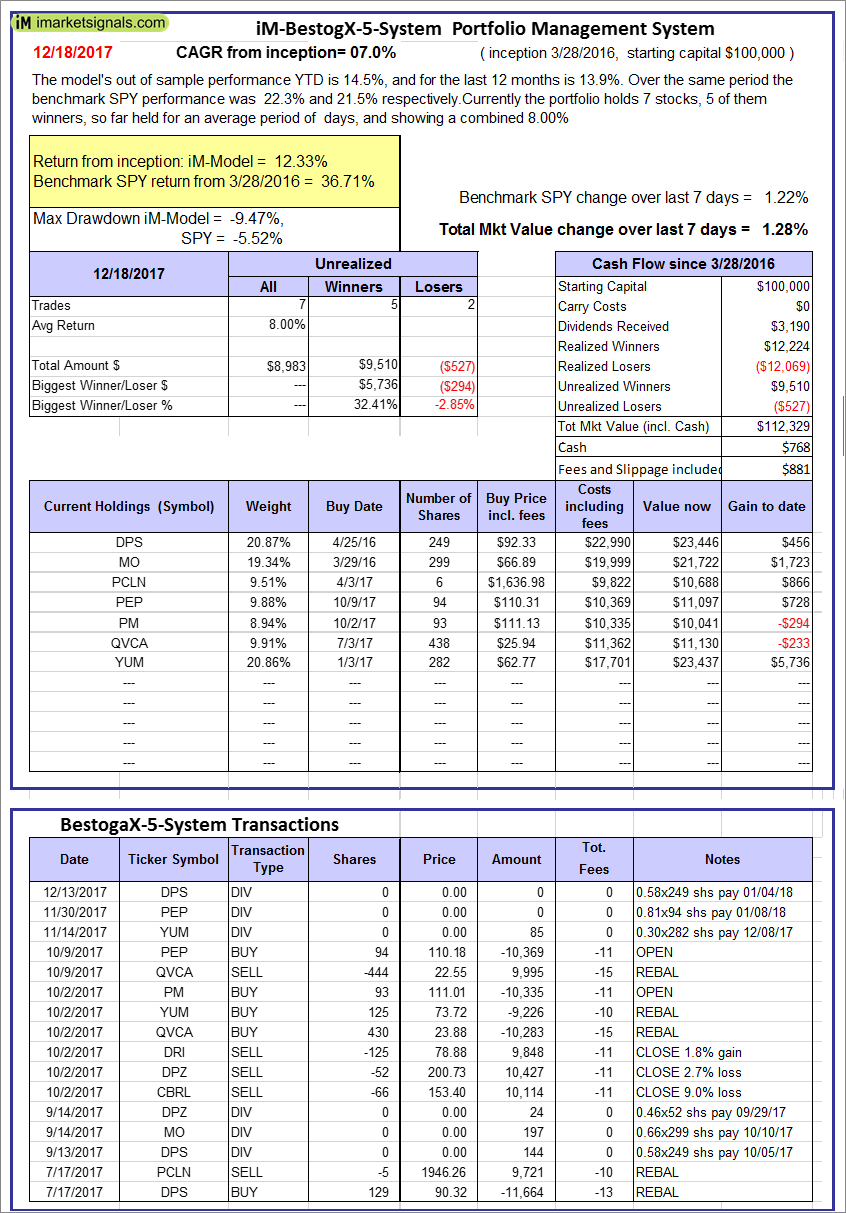
iM-BestogaX5-System: The model’s out of sample performance YTD is 14.5%, and for the last 12 months is 13.9%. Over the same period the benchmark SPY performance was 22.3% and 21.5% respectively. Over the previous week the market value of iM-Best8(S&P 500)Tax-Eff. gained 1.28% at a time when SPY gained 1.22%. A starting capital of $100,000 at inception on 3/28/2016 would have grown to $112,329 which includes $768 cash and excludes $881 spent on fees and slippage. |
|
|
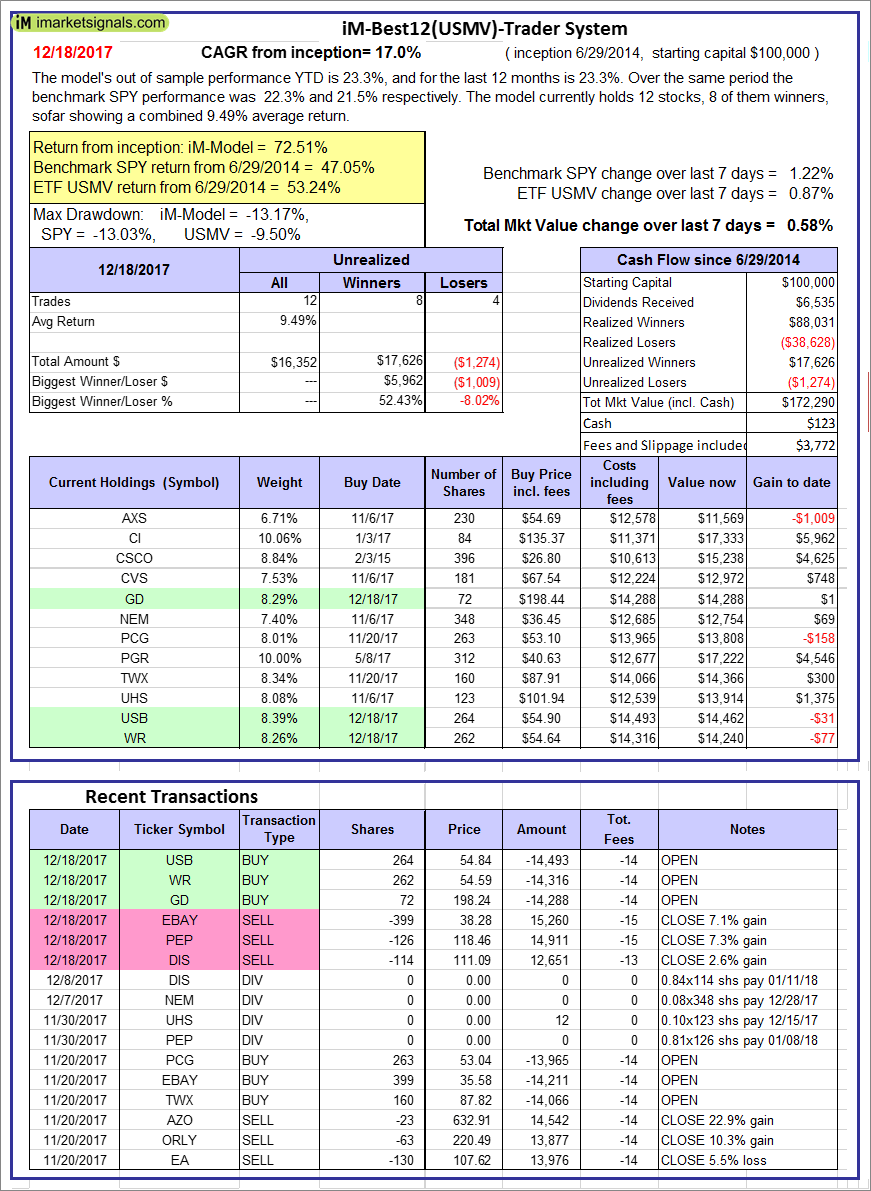
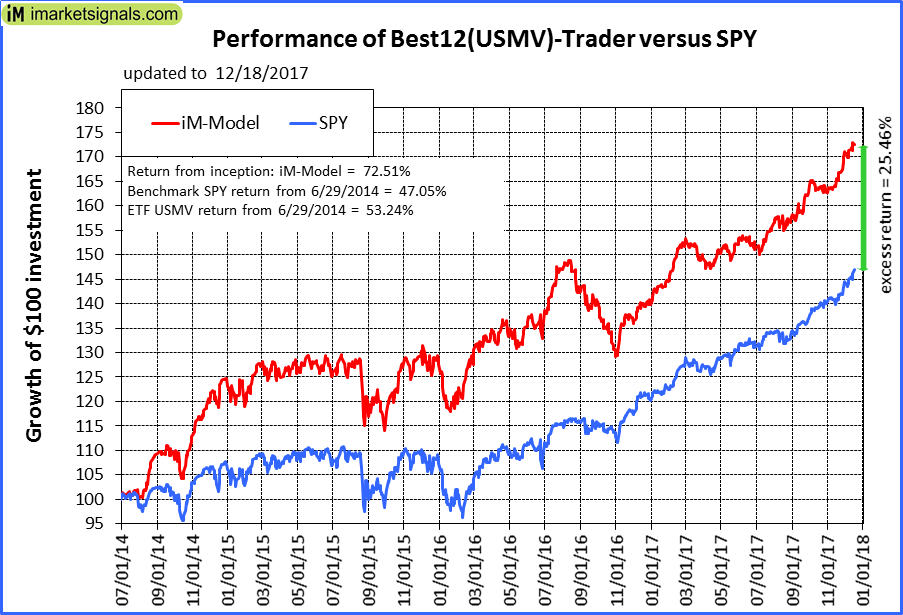
iM-Best12(USMV)-Trader: The model’s out of sample performance YTD is 23.3%, and for the last 12 months is 23.3%. Over the same period the benchmark SPY performance was 22.3% and 21.5% respectively. Since inception, on 6/30/2014, the model gained 72.51% while the benchmark SPY gained 47.05% and the ETF USMV gained 53.24% over the same period. Over the previous week the market value of iM-Best12(USMV)-Trader gained 0.58% at a time when SPY gained 1.22%. A starting capital of $100,000 at inception on 6/30/2014 would have grown to $172,290 which includes $123 cash and excludes $3,772 spent on fees and slippage. |
|
|
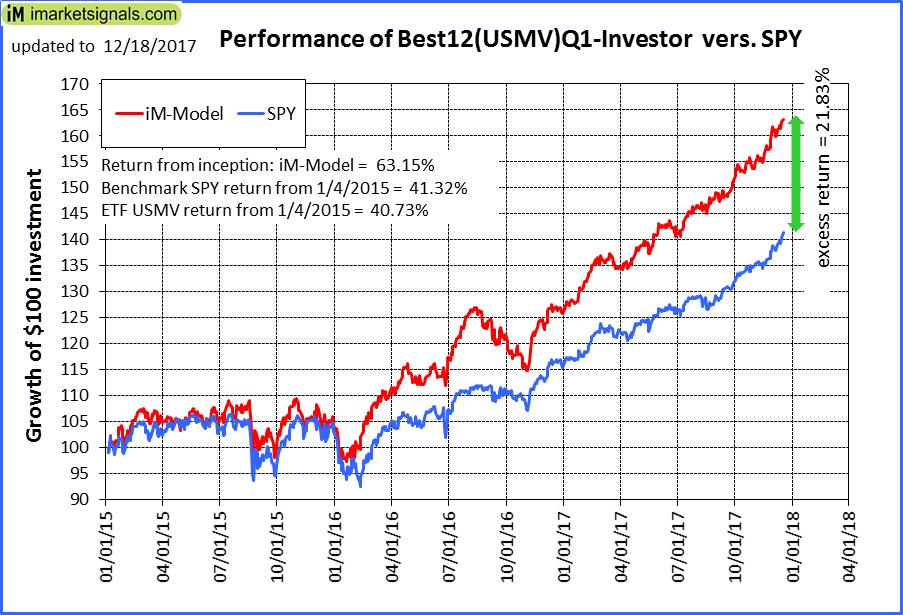
iM-Best12(USMV)Q1-Investor: The model’s out of sample performance YTD is 29.7%, and for the last 12 months is 28.5%. Over the same period the benchmark SPY performance was 22.3% and 21.5% respectively. Since inception, on 1/5/2015, the model gained 63.15% while the benchmark SPY gained 41.32% and the ETF USMV gained 40.73% over the same period. Over the previous week the market value of iM-Best12(USMV)Q1 gained 0.88% at a time when SPY gained 1.22%. A starting capital of $100,000 at inception on 1/5/2015 would have grown to $162,842 which includes $204 cash and excludes $871 spent on fees and slippage. |
|
|
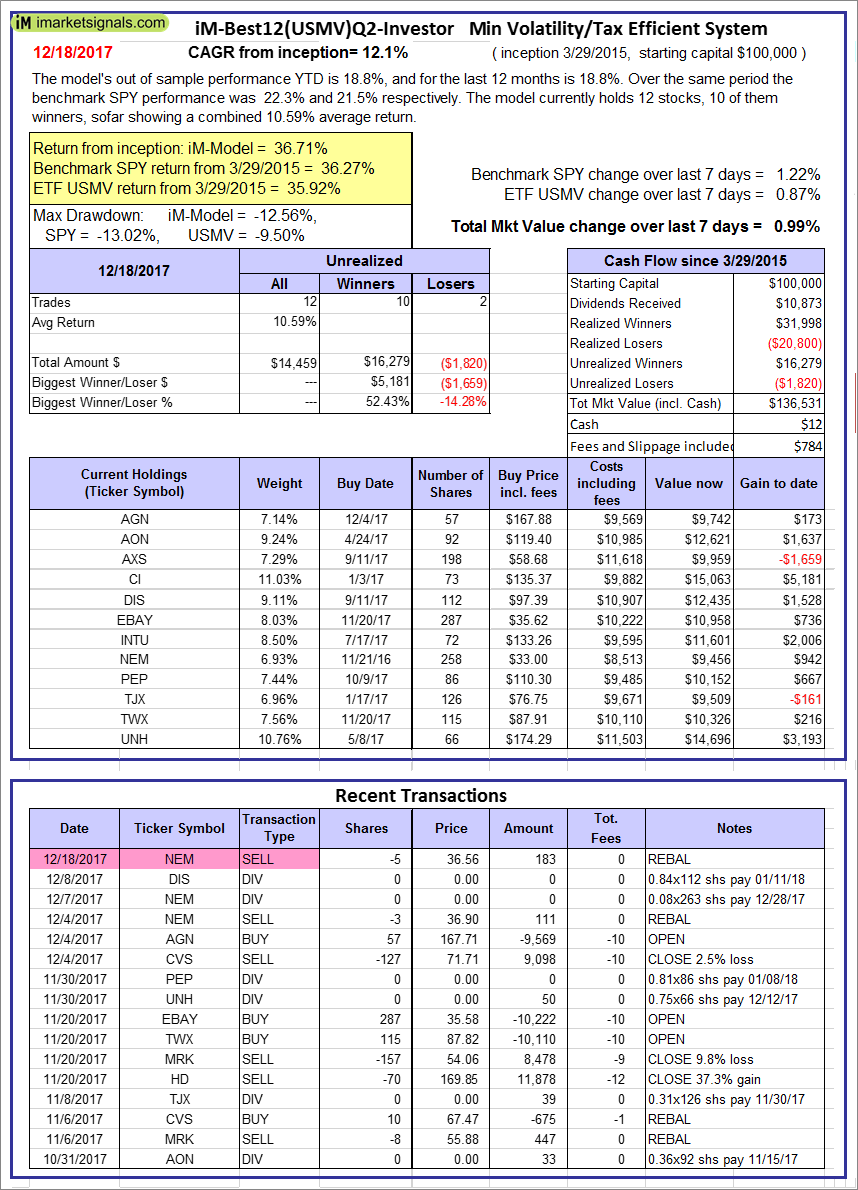
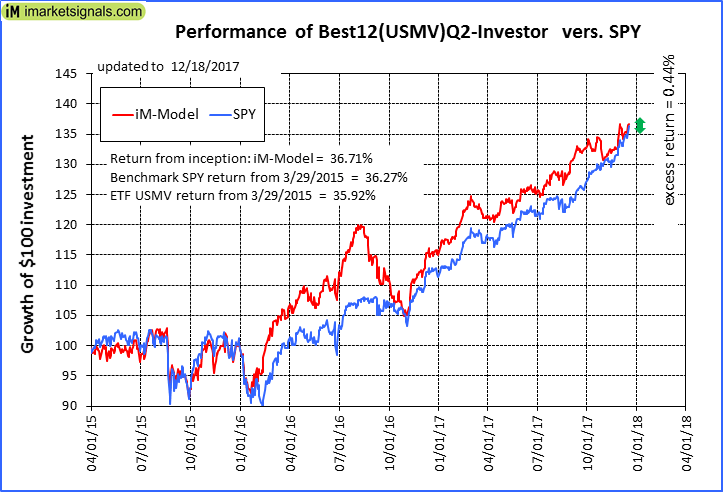
iM-Best12(USMV)Q2-Investor: The model’s out of sample performance YTD is 18.8%, and for the last 12 months is 18.8%. Over the same period the benchmark SPY performance was 22.3% and 21.5% respectively. Since inception, on 3/30/2015, the model gained 36.71% while the benchmark SPY gained 36.27% and the ETF USMV gained 35.92% over the same period. Over the previous week the market value of iM-Best12(USMV)Q2 gained 0.99% at a time when SPY gained 1.22%. A starting capital of $100,000 at inception on 3/30/2015 would have grown to $136,531 which includes $12 cash and excludes $784 spent on fees and slippage. |
|
|
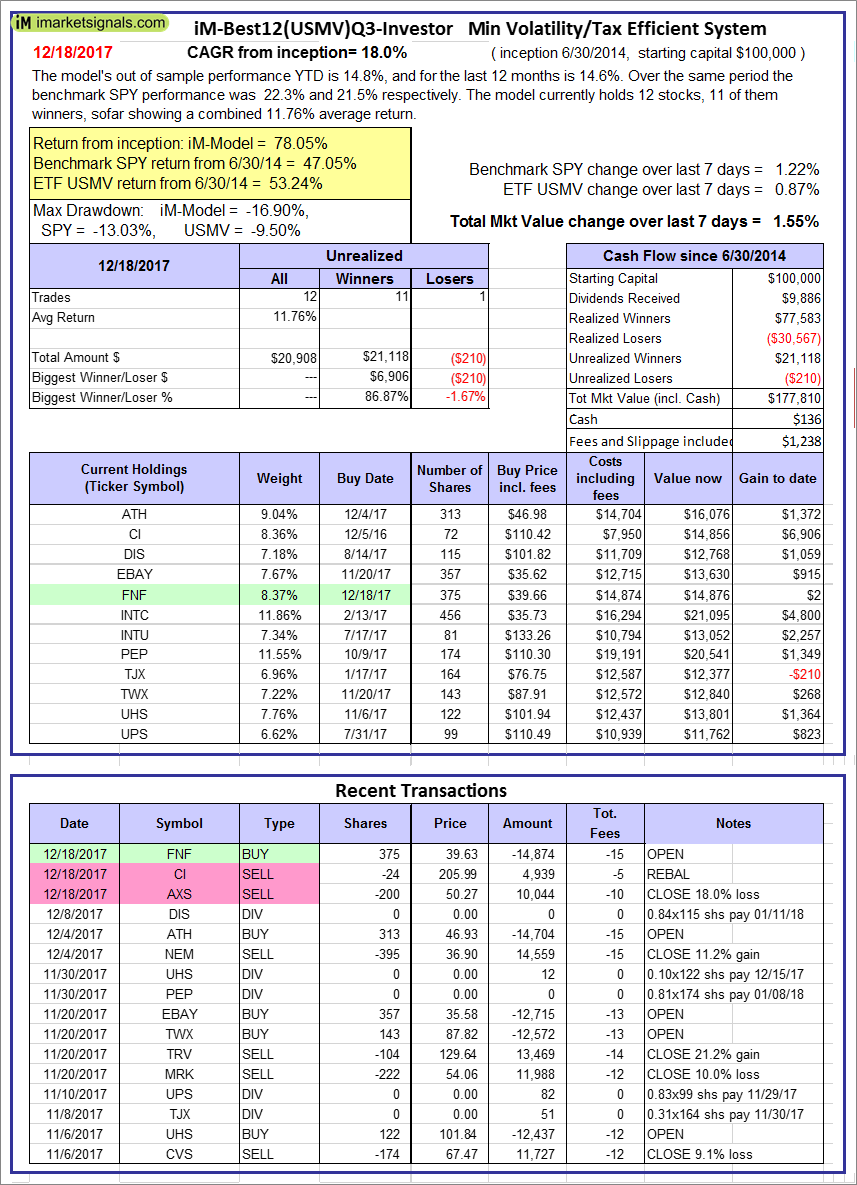
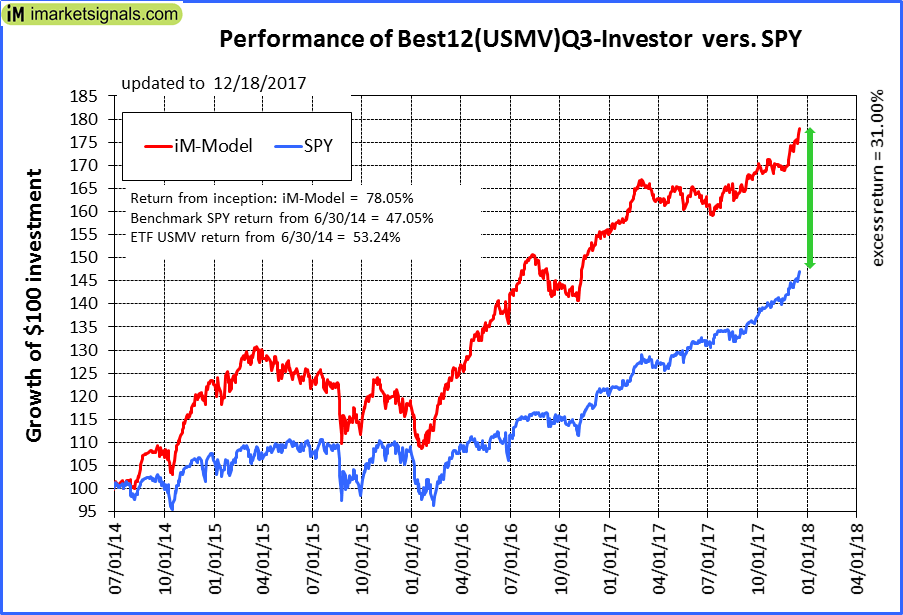
iM-Best12(USMV)Q3-Investor: The model’s out of sample performance YTD is 14.8%, and for the last 12 months is 14.6%. Over the same period the benchmark SPY performance was 22.3% and 21.5% respectively. Since inception, on 7/1/2014, the model gained 78.05% while the benchmark SPY gained 47.05% and the ETF USMV gained 53.24% over the same period. Over the previous week the market value of iM-Best12(USMV)Q3 gained 1.55% at a time when SPY gained 1.22%. A starting capital of $100,000 at inception on 7/1/2014 would have grown to $177,810 which includes $136 cash and excludes $1,238 spent on fees and slippage. |
|
|
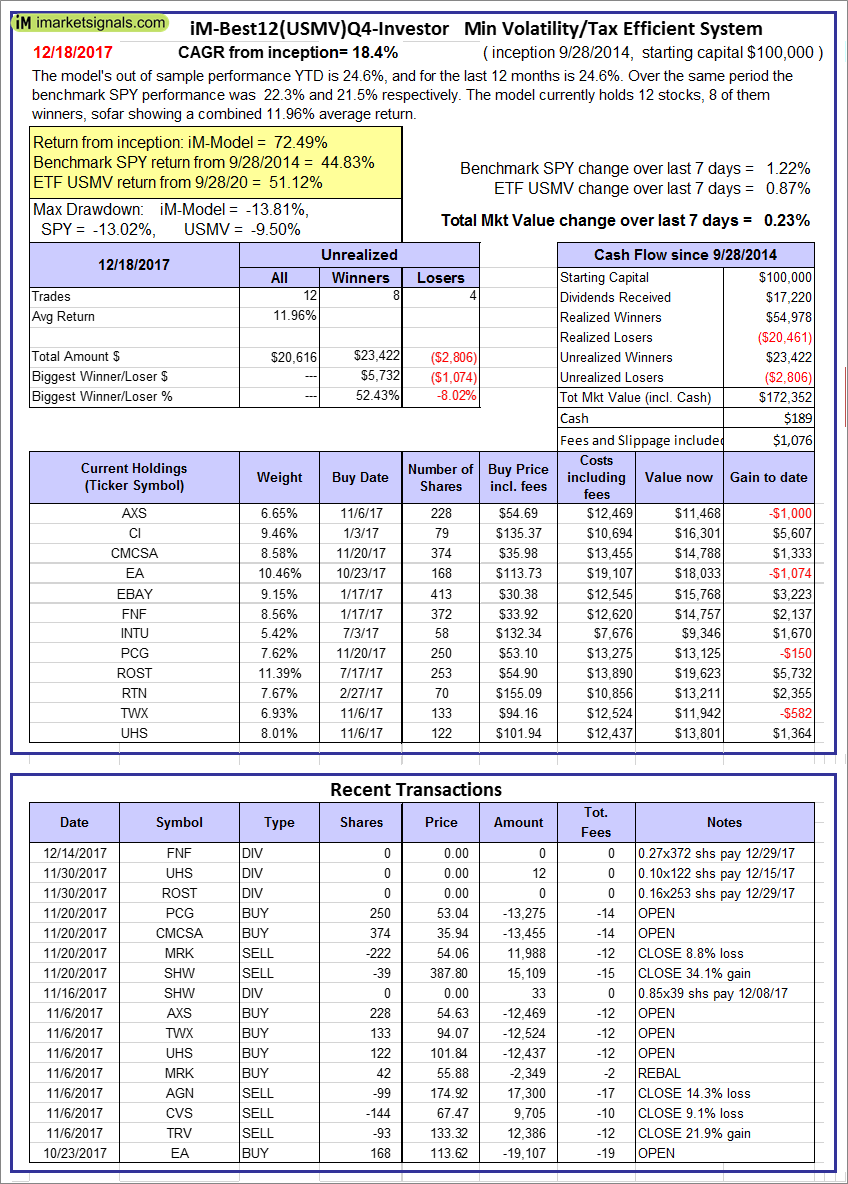
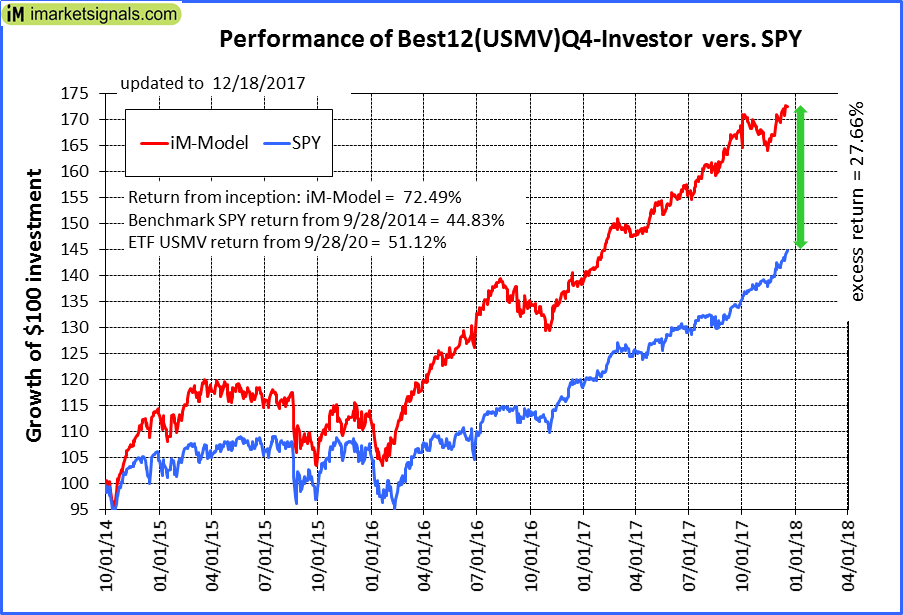
iM-Best12(USMV)Q4-Investor: Since inception, on 9/29/2014, the model gained 72.49% while the benchmark SPY gained 44.83% and the ETF USMV gained 51.12% over the same period. Over the previous week the market value of iM-Best12(USMV)Q4 gained 0.23% at a time when SPY gained 1.22%. A starting capital of $100,000 at inception on 9/29/2014 would have grown to $172,352 which includes $189 cash and excludes $1,076 spent on fees and slippage. |
|
|
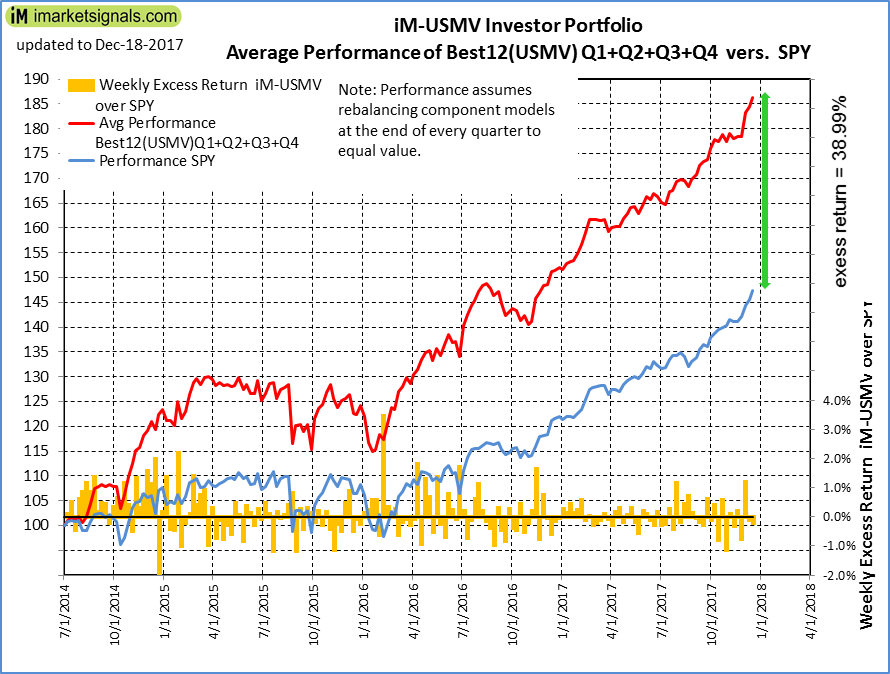
Average Performance of iM-Best12(USMV)Q1+Q2+Q3+Q4-Investor resulted in an excess return of 38.99% over SPY. (see iM-USMV Investor Portfolio) |
|
|
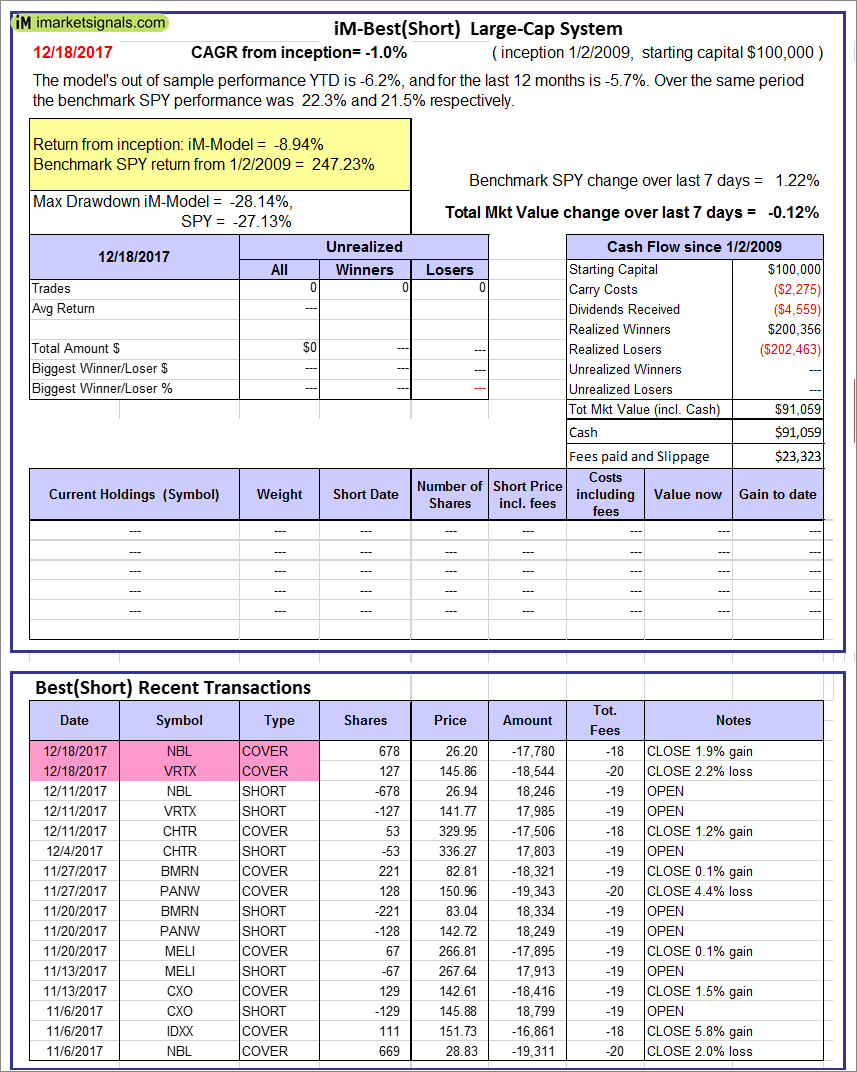
iM-Best(Short): The model’s out of sample performance YTD is -6.2%, and for the last 12 months is -5.7%. Over the same period the benchmark SPY performance was 22.3% and 21.5% respectively. Over the previous week the market value of iM-Best(Short) gained -0.12% at a time when SPY gained 1.22%. Over the period 1/2/2009 to 12/18/2017 the starting capital of $100,000 would have grown to $91,059 which includes $91,059 cash and excludes $23,323 spent on fees and slippage. |
|
|
iM-Best2 MC-Score ETF System: The model’s out of sample performance YTD is 16.2%, and for the last 12 months is 16.2%. Over the same period the benchmark SPY performance was 22.3% and 21.5% respectively. Over the previous week the market value of the iM-Best2 MC-Score ETF System gained 0.67% at a time when SPY gained 1.22%. A starting capital of $100,000 at inception on 6/30/2016 would have grown to $112,271 which includes $70 cash and excludes $115 spent on fees and slippage. |
|
|
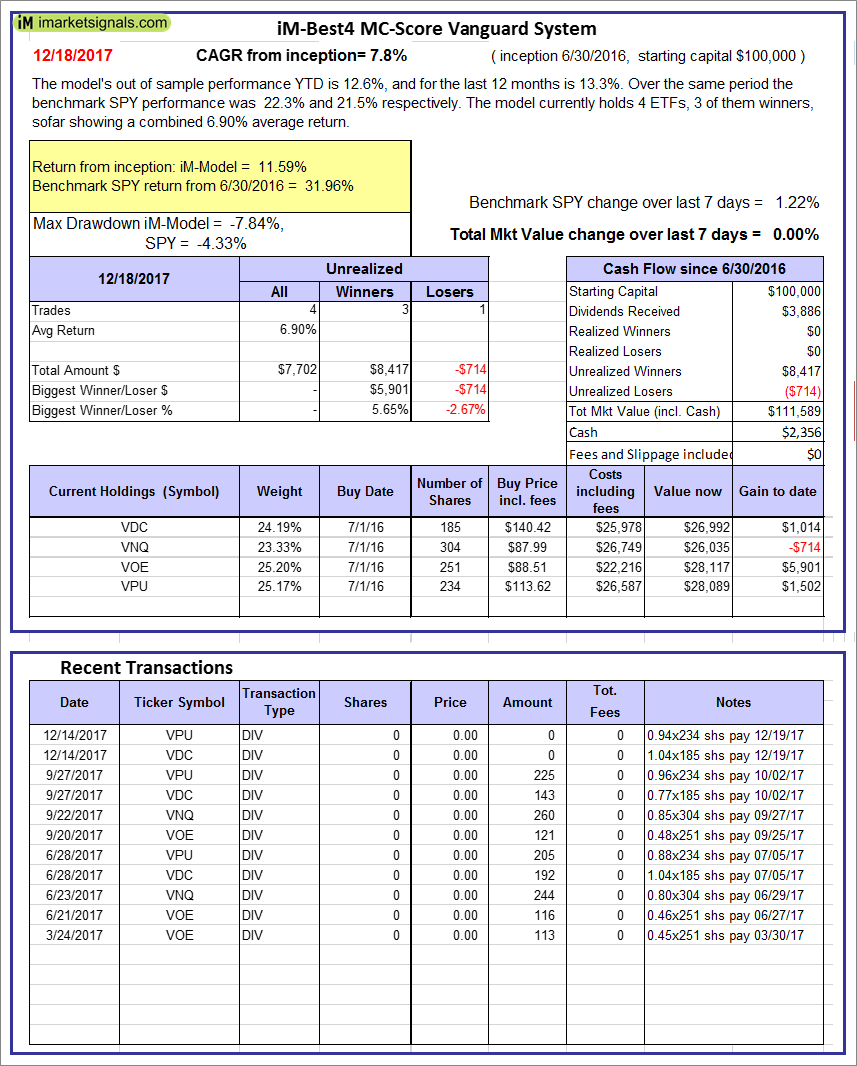
iM-Best4 MC-Score Vanguard System: The model’s out of sample performance YTD is 12.6%, and for the last 12 months is 13.3%. Over the same period the benchmark SPY performance was 22.3% and 21.5% respectively. Over the previous week the market value of the iM-Best4 MC-Score Vanguard System gained 0.00% at a time when SPY gained 1.22%. A starting capital of $100,000 at inception on 6/30/2016 would have grown to $111,589 which includes $2,356 cash and excludes $00 spent on fees and slippage. |
|
|
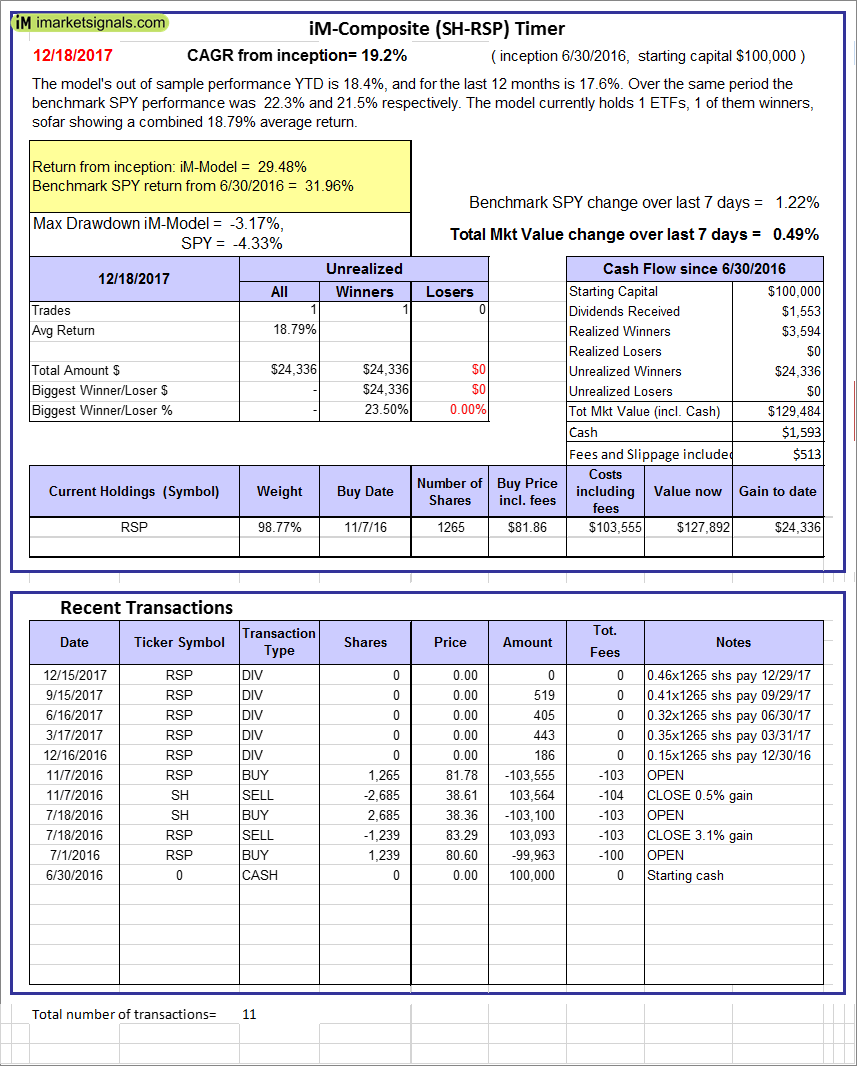
iM-Composite (SH-RSP) Timer: The model’s out of sample performance YTD is 18.4%, and for the last 12 months is 17.6%. Over the same period the benchmark SPY performance was 22.3% and 21.5% respectively. Over the previous week the market value of the iM-Composite (SH-RSP) Timer gained 0.49% at a time when SPY gained 1.22%. A starting capital of $100,000 at inception on 6/30/2016 would have grown to $129,484 which includes $1,593 cash and excludes $513 spent on fees and slippage. |
|
|
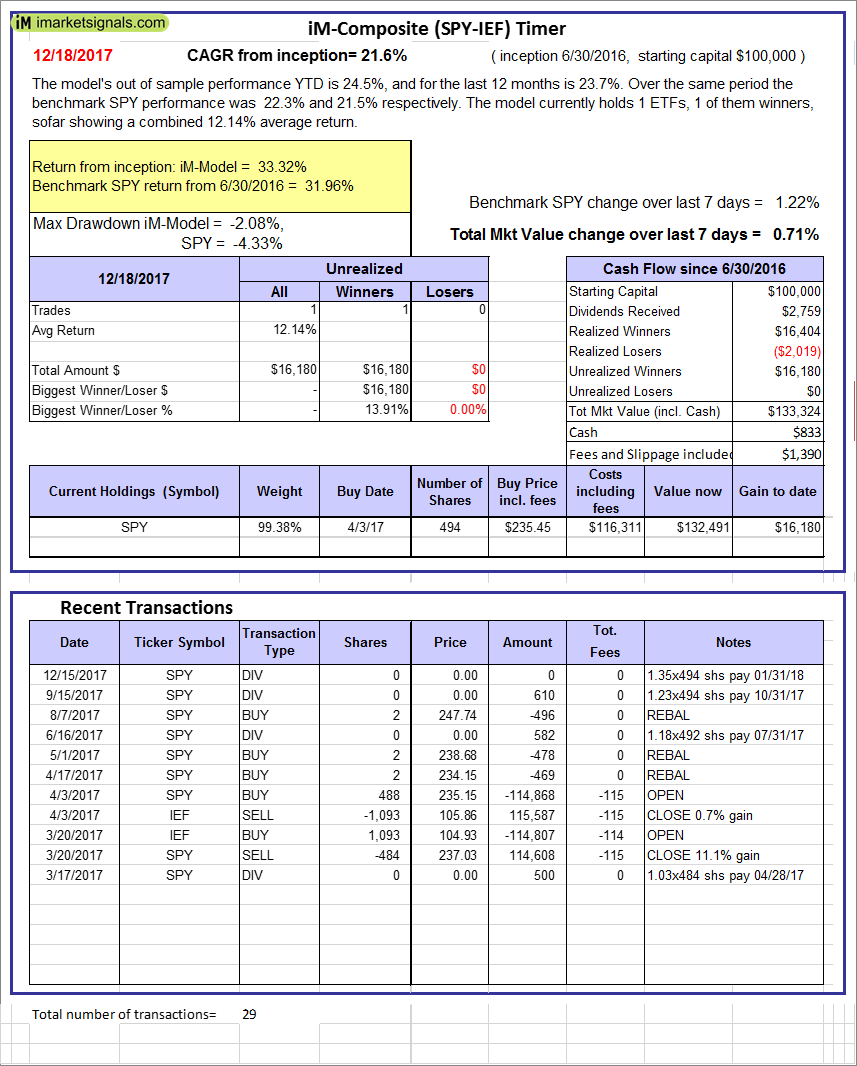
iM-Composite (SPY-IEF) Timer: The model’s out of sample performance YTD is 24.5%, and for the last 12 months is 23.7%. Over the same period the benchmark SPY performance was 22.3% and 21.5% respectively. Over the previous week the market value of the iM-Composite (SPY-IEF) Timer gained 0.71% at a time when SPY gained 1.22%. A starting capital of $100,000 at inception on 6/30/2016 would have grown to $133,324 which includes $833 cash and excludes $1,390 spent on fees and slippage. |
|
|
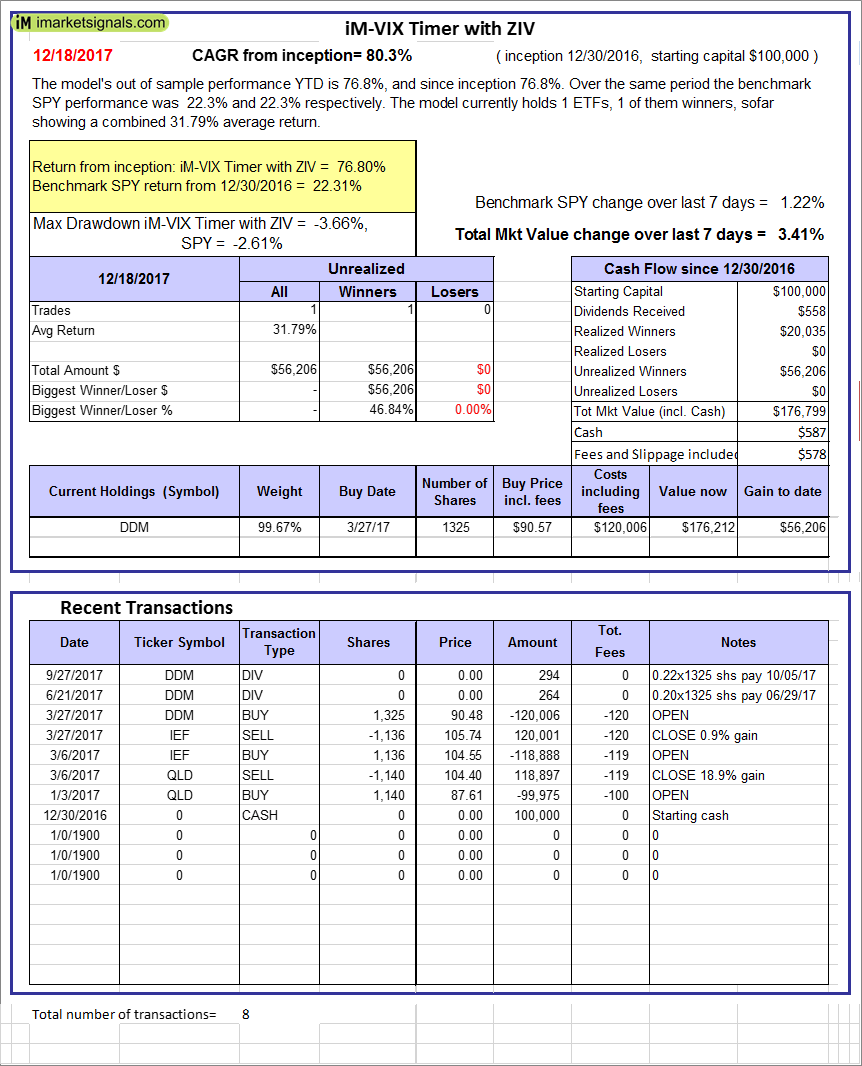
iM-VIX Timer with ZIV: The model’s out of sample performance YTD is 76.8%, and since inception 76.8%. Over the same period the benchmark SPY performance was 22.3% and 22.3% respectively. Over the previous week the market value of the iM-VIX Timer with ZIV gained 3.41% at a time when SPY gained 1.22%. A starting capital of $100,000 at inception on 6/30/2016 would have grown to $176,799 which includes $587 cash and excludes $578 spent on fees and slippage. |
|
|
iM-Composite(Gold-Stocks-Bond) Timer: The model’s out of sample performance YTD is 20.0%, and for the last 12 months is 21.7%. Over the same period the benchmark SPY performance was 22.3% and 21.5% respectively. Over the previous week the market value of the iM-Composite(Gold-Stocks-Bond) Timer gained 1.44% at a time when SPY gained 1.22%. A starting capital of $100,000 at inception on 6/30/2016 would have grown to $124,618 which includes $53 cash and excludes $1,955 spent on fees and slippage. |
|
|
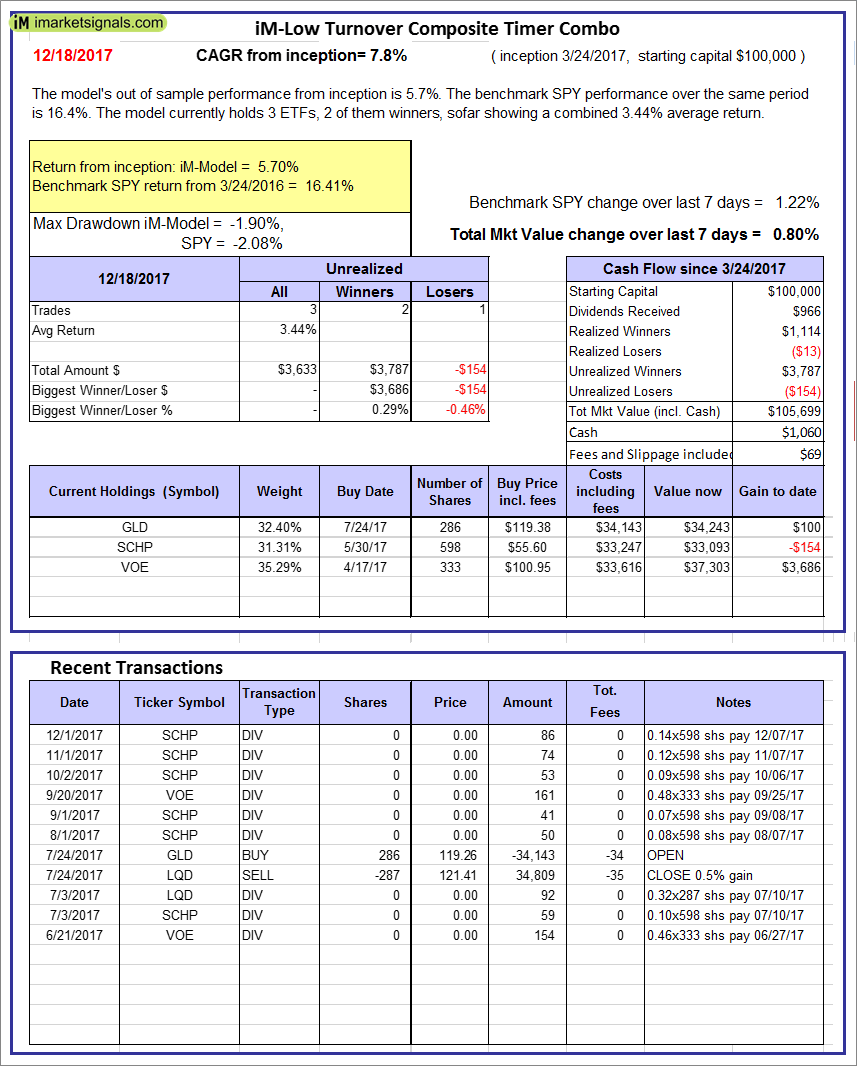
iM-Low Turnover Composite Timer Combo: The model’s out of sample performance from inception is 5.7%. The benchmark SPY performance over the same period is 16.4%. Over the previous week the market value of the iM-Low Turnover Composite Timer Combo gained 0.80% at a time when SPY gained 1.22%. A starting capital of $100,000 at inception on 3/24/27 would have grown to $105,699 which includes $1,060 cash and excludes $69 spent on fees and slippage. |
|
|
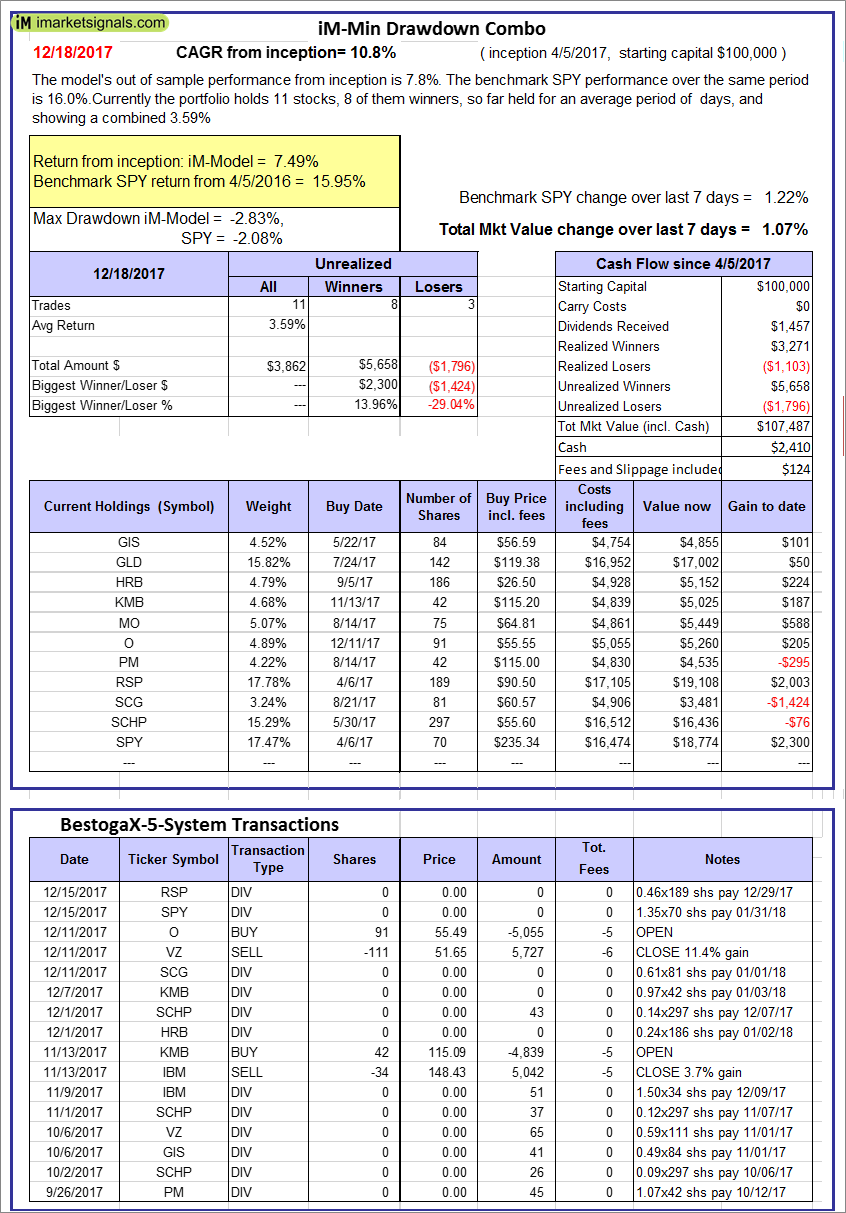
iM-Min Drawdown Combo: The model’s out of sample performance from inception is 7.8%. The benchmark SPY performance over the same period is 16.0%. Over the previous week the market value of the iM-Min Drawdown Combo gained 1.07% at a time when SPY gained 1.22%. A starting capital of $100,000 at inception on 4/5/2017 would have grown to $107,487 which includes $2,410 cash and excludes $124 spent on fees and slippage. |
|
|
iM-5ETF Trader (includes leveraged ETFs): The model’s out of sample performance YTD is 46.3%, and for the last 12 months is 45.3%. Over the same period the benchmark SPY performance was 22.3% and 21.5% respectively. Over the previous week the market value of the iM-5ETF Trader (includes leveraged ETFs) gained 2.94% at a time when SPY gained 1.22%. A starting capital of $100,000 at inception on 10/30/2016 would have grown to $165,076 which includes $757 cash and excludes $1,030 spent on fees and slippage. |
|
|
iM-Standard 5ETF Trader (excludes leveraged ETFs): The model’s out of sample performance YTD is 22.4%, and for the last 12 months is 22.2%. Over the same period the benchmark SPY performance was 22.3% and 21.5% respectively. Over the previous week the market value of the iM-Standard 5ETF Trader (excludes leveraged ETFs) gained 1.02% at a time when SPY gained 1.22%. A starting capital of $100,000 at inception on 10/30/2016 would have grown to $125,757 which includes $1,385 cash and excludes $880 spent on fees and slippage. |


Leave a Reply
You must be logged in to post a comment.