  |
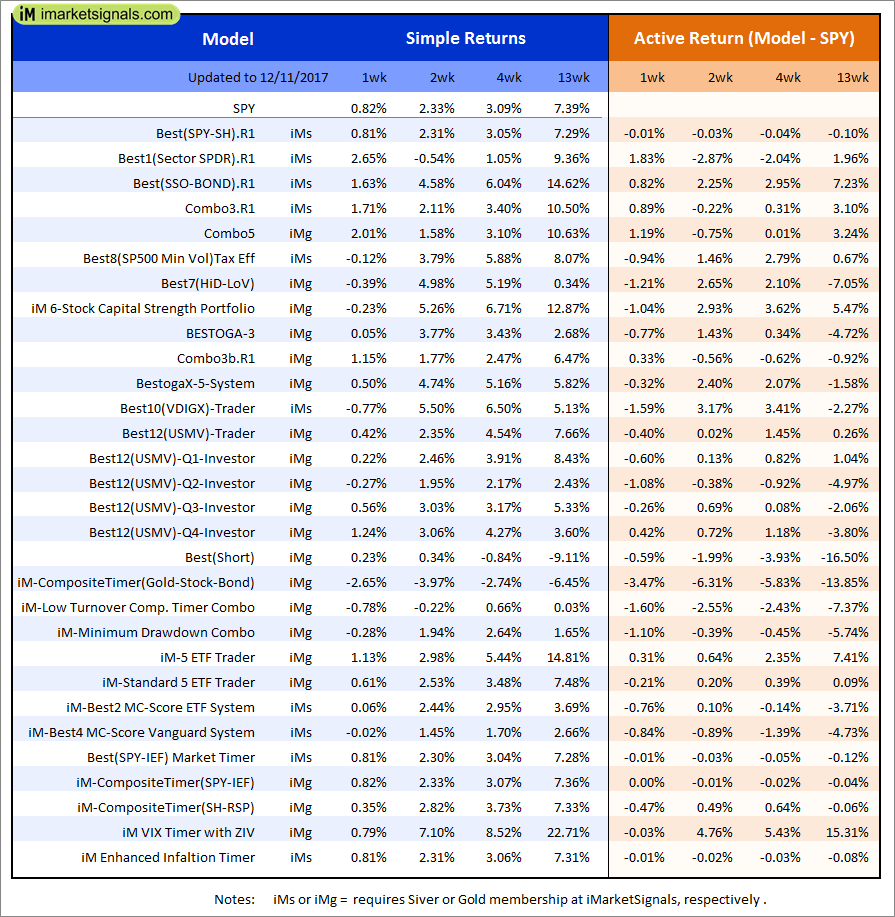
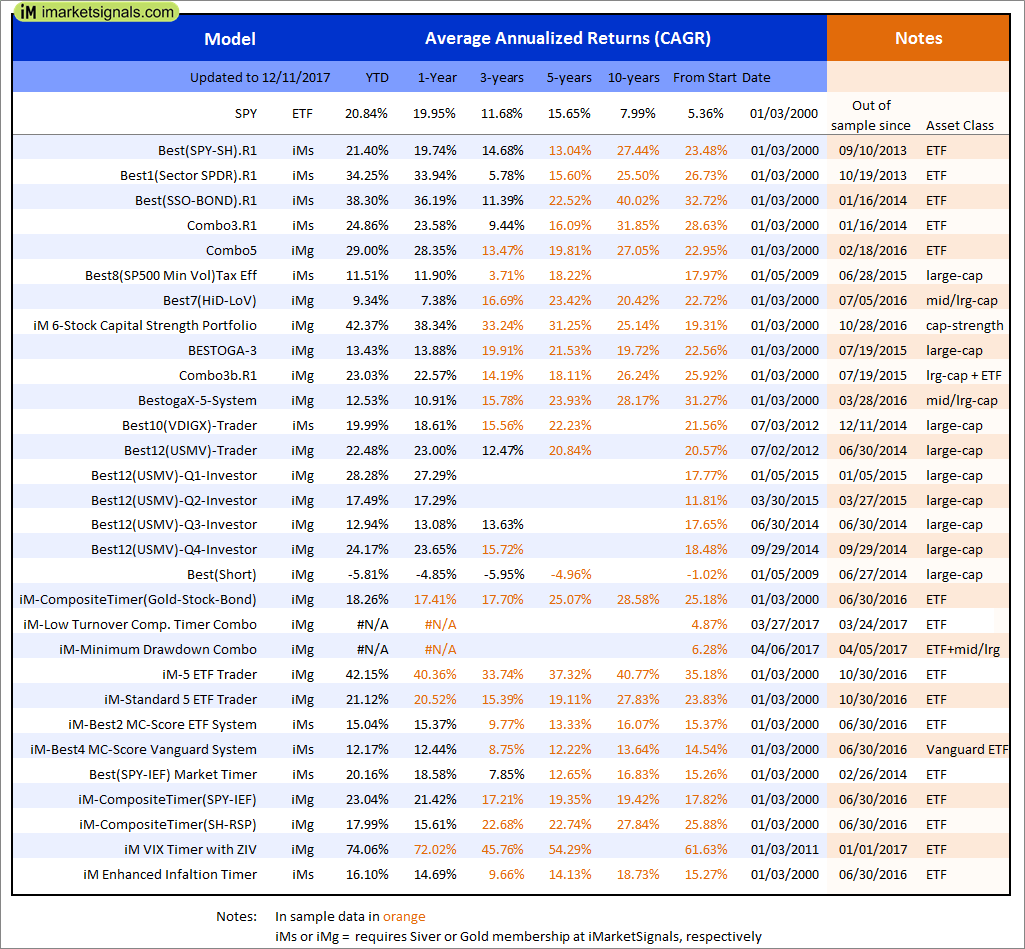
Out of sample performance summary of our models for the past 1, 2, 4 and 13 week periods. The active active return indicates how the models over- or underperformed the benchmark ETF SPY. Also the YTD, and the 1-, 3-, 5- and 10-year annualized returns are shown in the second table |
|
|
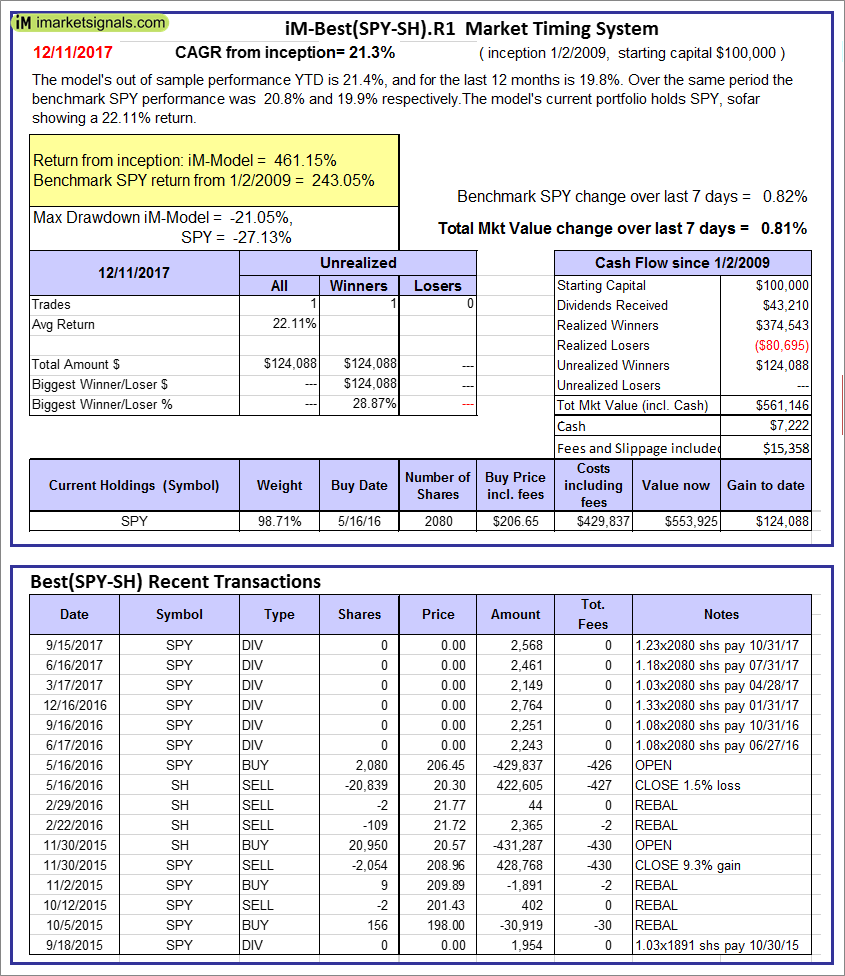
iM-Best(SPY-SH).R1: The model’s out of sample performance YTD is 21.4%, and for the last 12 months is 19.8%. Over the same period the benchmark SPY performance was 20.8% and 19.9% respectively. Over the previous week the market value of Best(SPY-SH) gained 0.81% at a time when SPY gained 0.82%. A starting capital of $100,000 at inception on 1/2/2009 would have grown to $561,146 which includes $7,222 cash and excludes $15,358 spent on fees and slippage. |
|
|
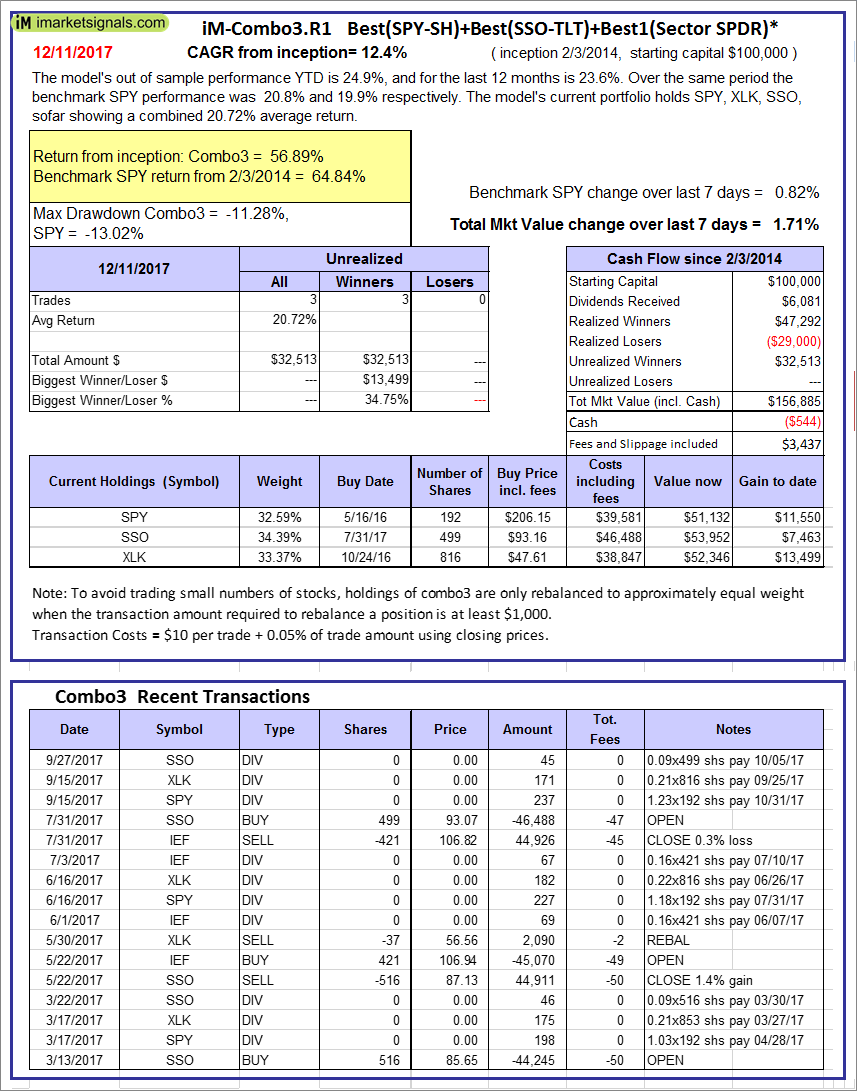
iM-Combo3.R1: The model’s out of sample performance YTD is 24.9%, and for the last 12 months is 23.6%. Over the same period the benchmark SPY performance was 20.8% and 19.9% respectively. Over the previous week the market value of iM-Combo3.R1 gained 1.71% at a time when SPY gained 0.82%. A starting capital of $100,000 at inception on 2/3/2014 would have grown to $156,885 which includes -$544 cash and excludes $3,437 spent on fees and slippage. |
|
|
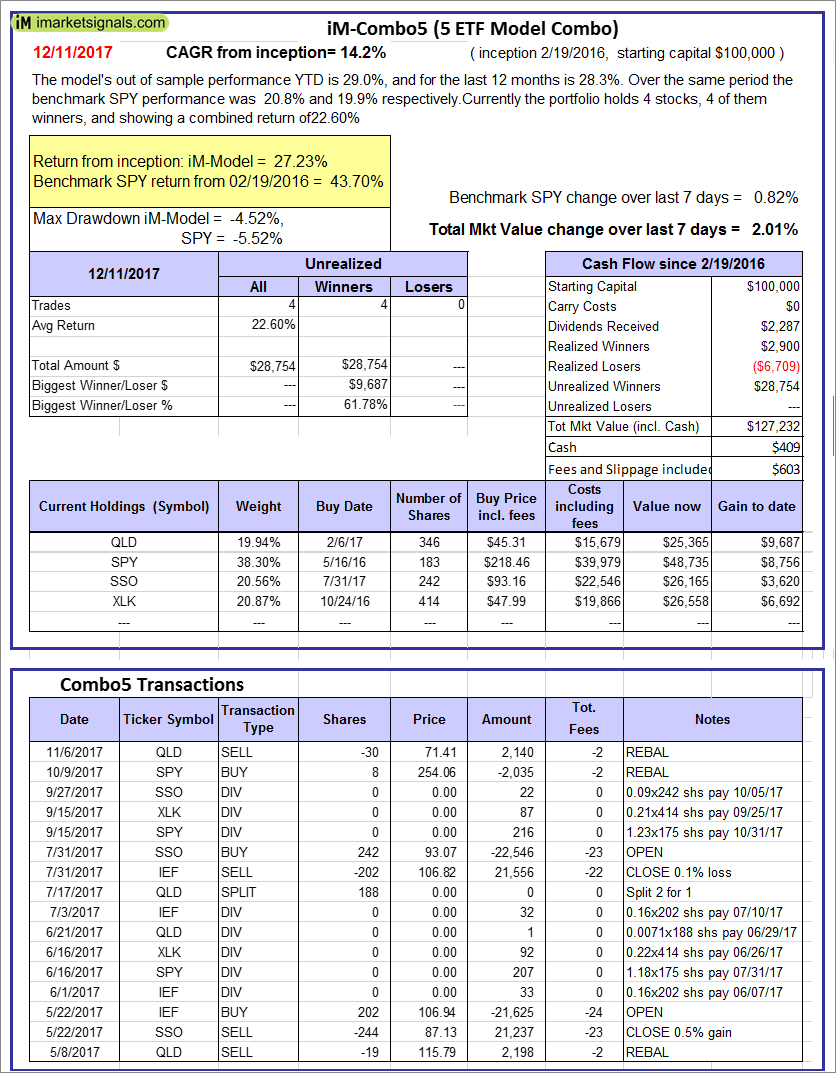
iM-Combo5: The model’s out of sample performance YTD is 29.0%, and for the last 12 months is 28.3%. Over the same period the benchmark SPY performance was 20.8% and 19.9% respectively. Over the previous week the market value of iM-Combo5 gained 2.01% at a time when SPY gained 0.82%. A starting capital of $100,000 at inception on 2/22/2016 would have grown to $127,232 which includes $409 cash and excludes $603 spent on fees and slippage. |
|
|
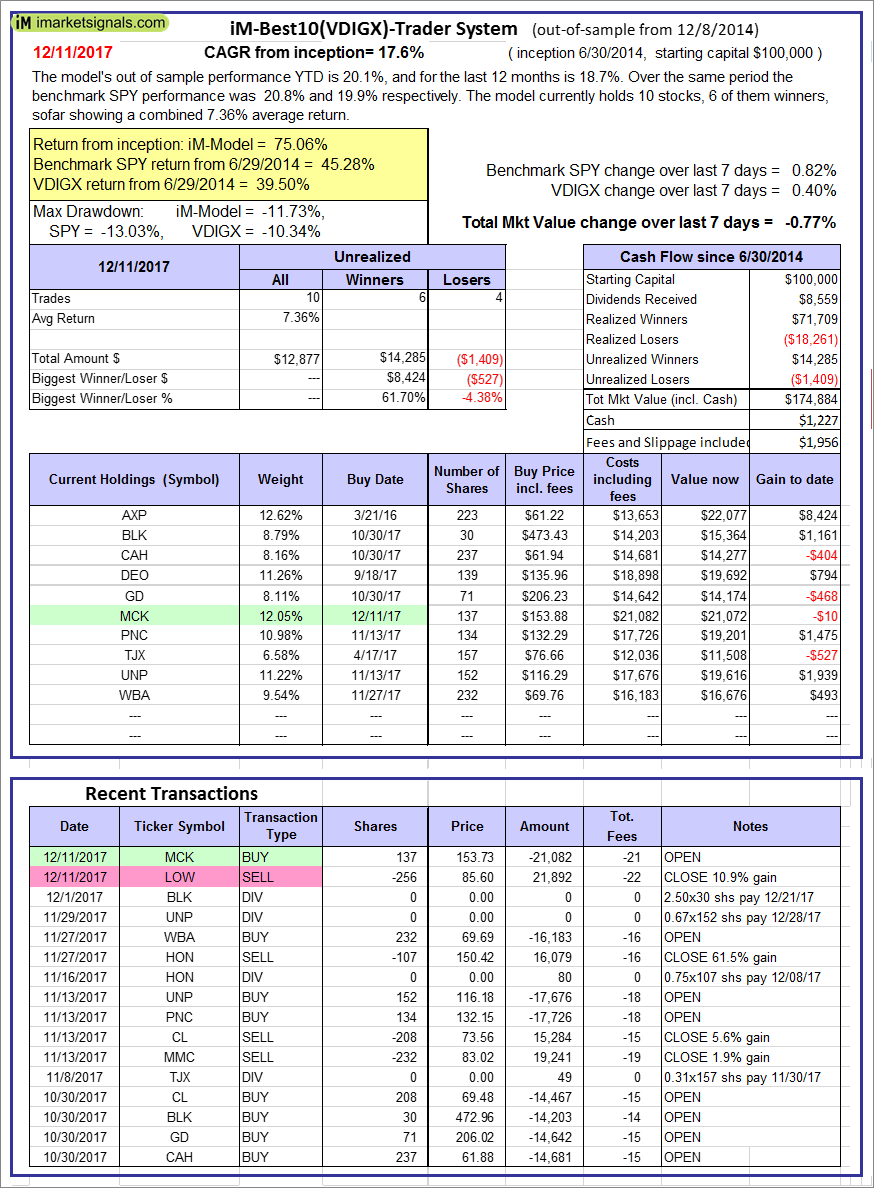
iM-Best10(VDIGX)-Trader: The model’s out of sample performance YTD is 20.1%, and for the last 12 months is 18.7%. Over the same period the benchmark SPY performance was 20.8% and 19.9% respectively. Since inception, on 7/1/2014, the model gained 75.06% while the benchmark SPY gained 45.28% and VDIGX gained 39.50% over the same period. Over the previous week the market value of iM-Best10(VDIGX) gained -0.77% at a time when SPY gained 0.82%. A starting capital of $100,000 at inception on 7/1/2014 would have grown to $174,884 which includes $1,227 cash and excludes $1,956 spent on fees and slippage. |
|
|
iM-BESTOGA-3: The model’s out of sample performance YTD is 13.7%, and for the last 12 months is 14.2%. Over the same period the benchmark SPY performance was 20.8% and 19.9% respectively. Over the previous week the market value of iM-BESTOGA-3 gained 0.05% at a time when SPY gained 0.82%. A starting capital of $100,000 at inception on 2/3/2014 would have grown to $229,553 which includes $1,003 cash and excludes $1,818 spent on fees and slippage. |
|
|
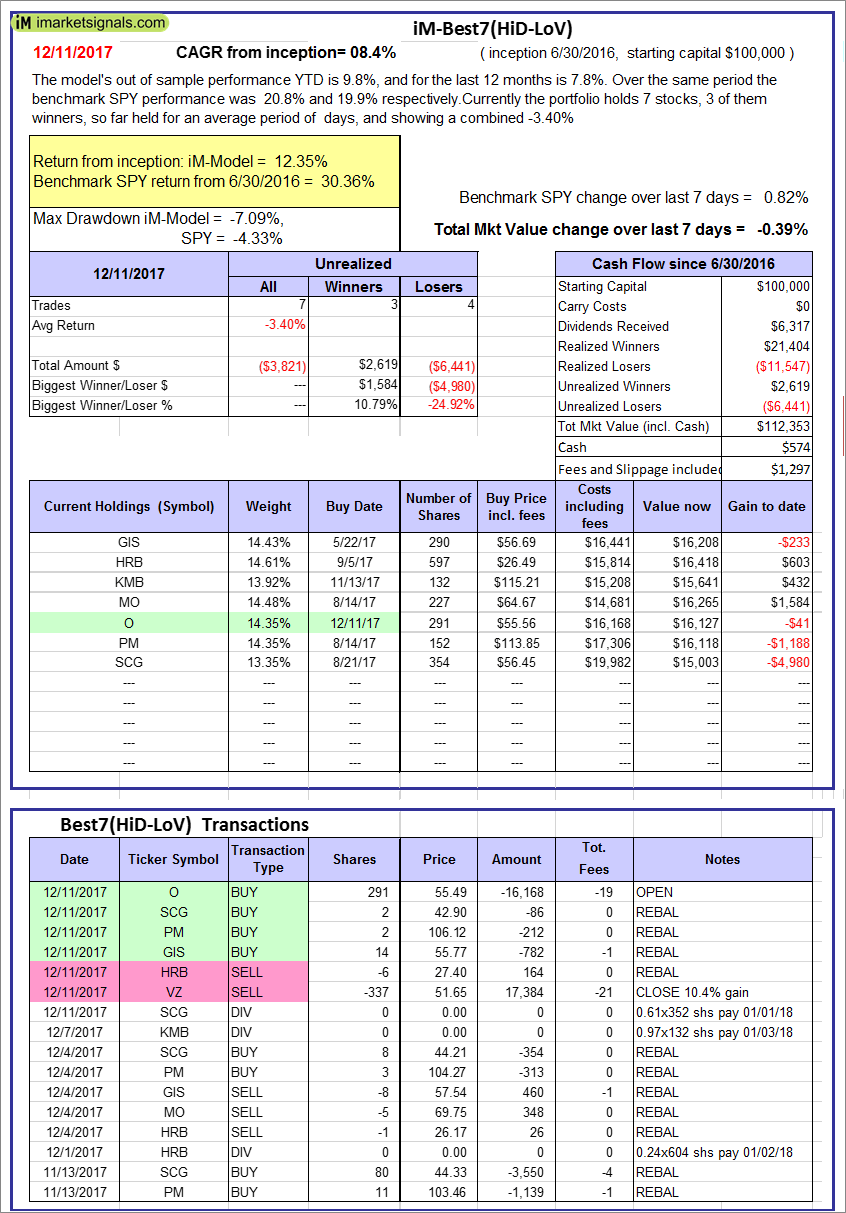
iM-Best7(HiD-LoV): The model’s out of sample performance YTD is 9.8%, and for the last 12 months is 7.8%. Over the same period the benchmark SPY performance was 20.8% and 19.9% respectively. Over the previous week the market value of iM-BESTOGA-3 gained -0.39% at a time when SPY gained 0.82%. A starting capital of $100,000 at inception on 6/30/2016 would have grown to $112,353 which includes $574 cash and excludes $1,297 spent on fees and slippage. |
|
|
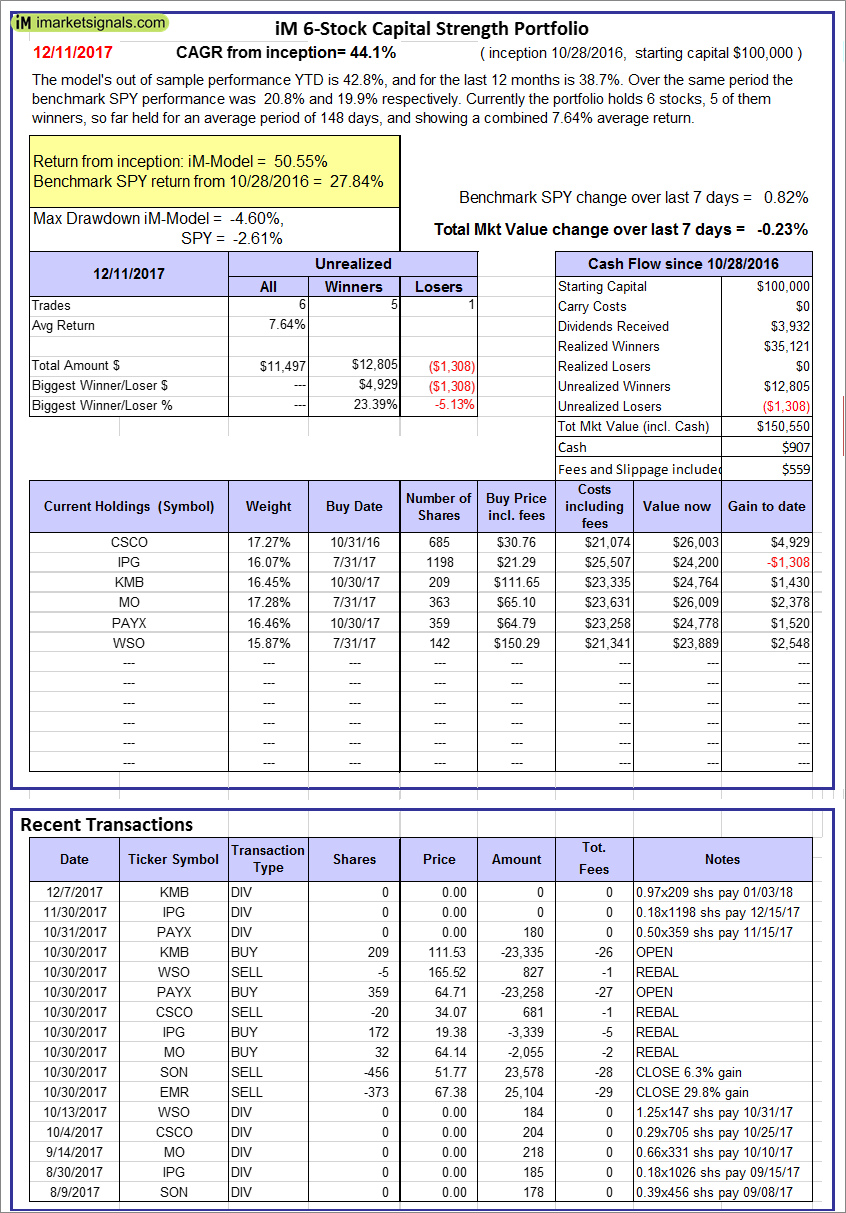
iM 6-Stock Capital Strength Portfolio: The model’s out of sample performance YTD is 42.8%, and for the last 12 months is 38.7%. Over the same period the benchmark SPY performance was 20.8% and 19.9% respectively. Over the previous week the market value of the iM 6-Stock Capital Strength Portfolio gained -0.23% at a time when SPY gained 0.82%. A starting capital of $100,000 at inception on 10/28/2016 would have grown to $150,550 which includes $907 cash and excludes $559 spent on fees and slippage. |
|
|
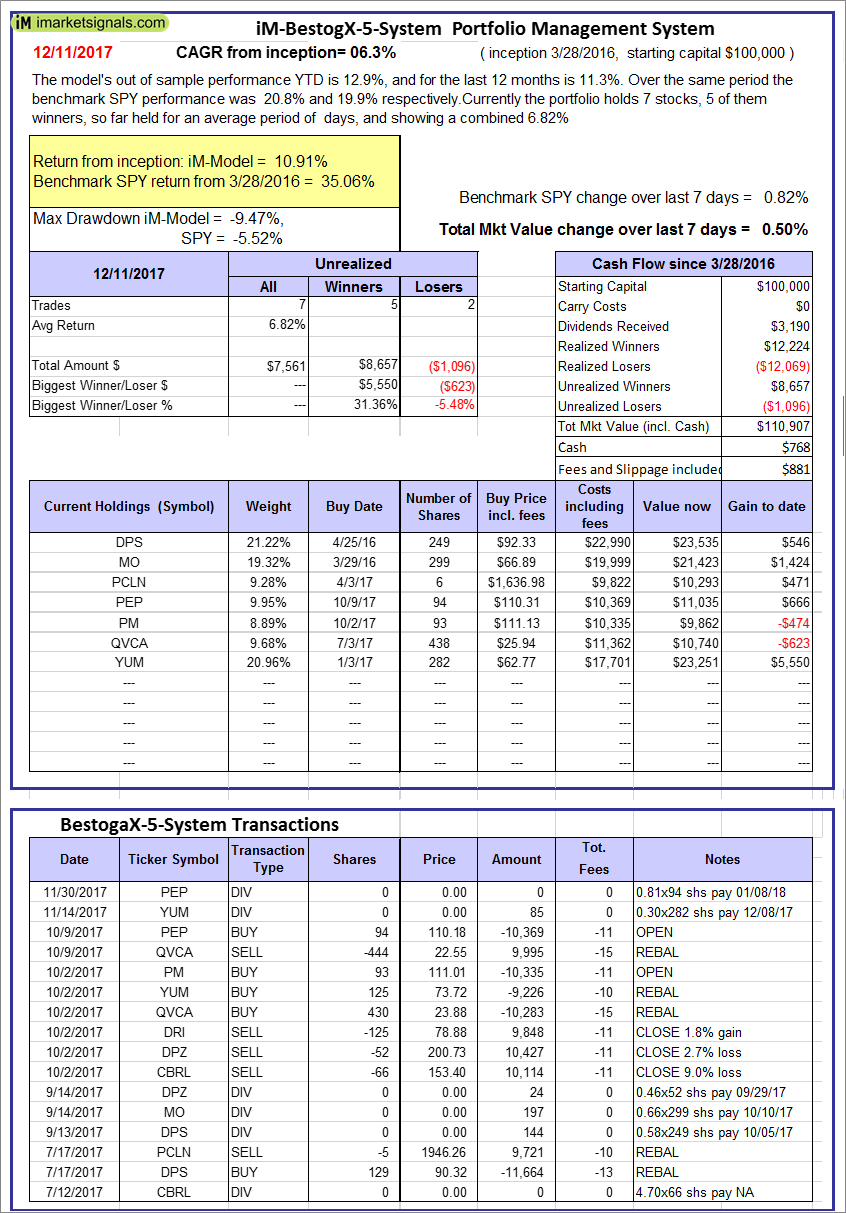
iM-BestogaX5-System: The model’s out of sample performance YTD is 12.9%, and for the last 12 months is 11.3%. Over the same period the benchmark SPY performance was 20.8% and 19.9% respectively. Over the previous week the market value of iM-Best8(S&P 500)Tax-Eff. gained 0.50% at a time when SPY gained 0.82%. A starting capital of $100,000 at inception on 3/28/2016 would have grown to $110,907 which includes $768 cash and excludes $881 spent on fees and slippage. |
|
|
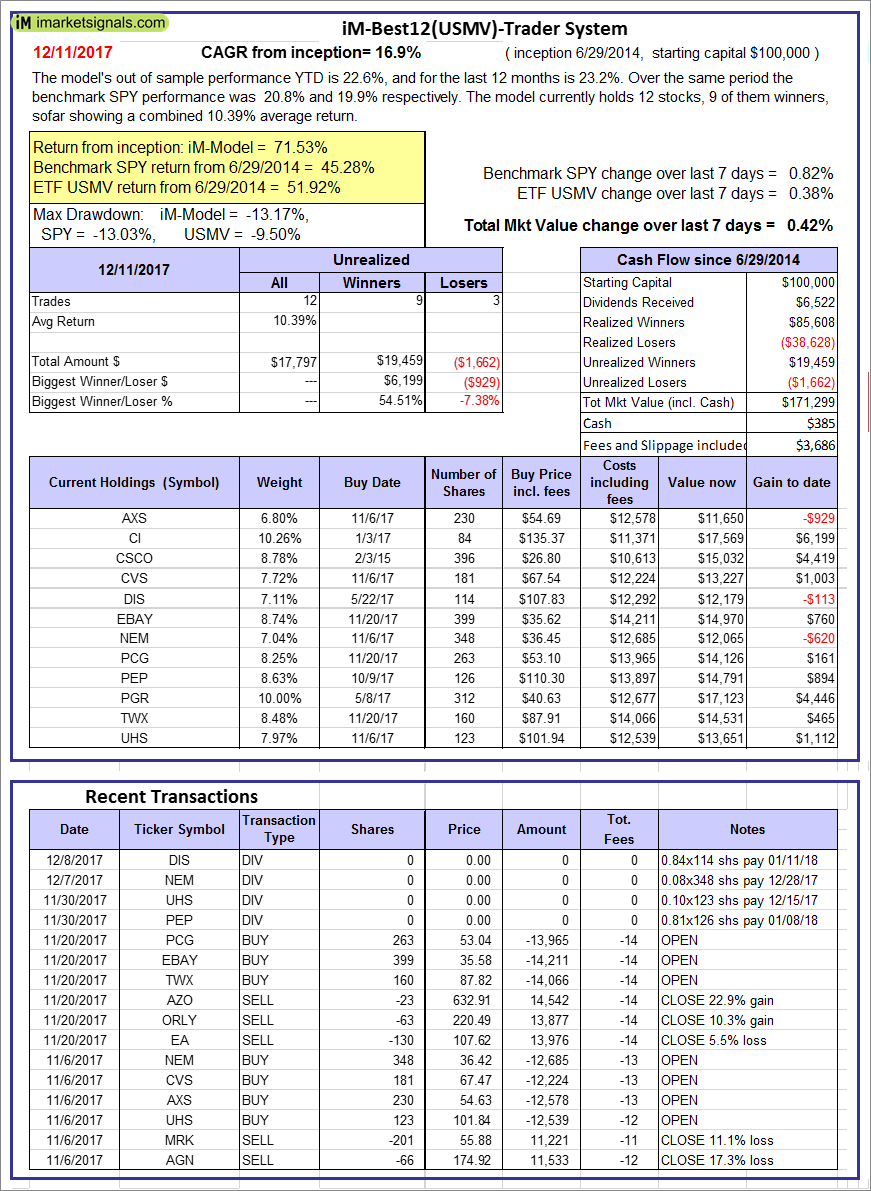
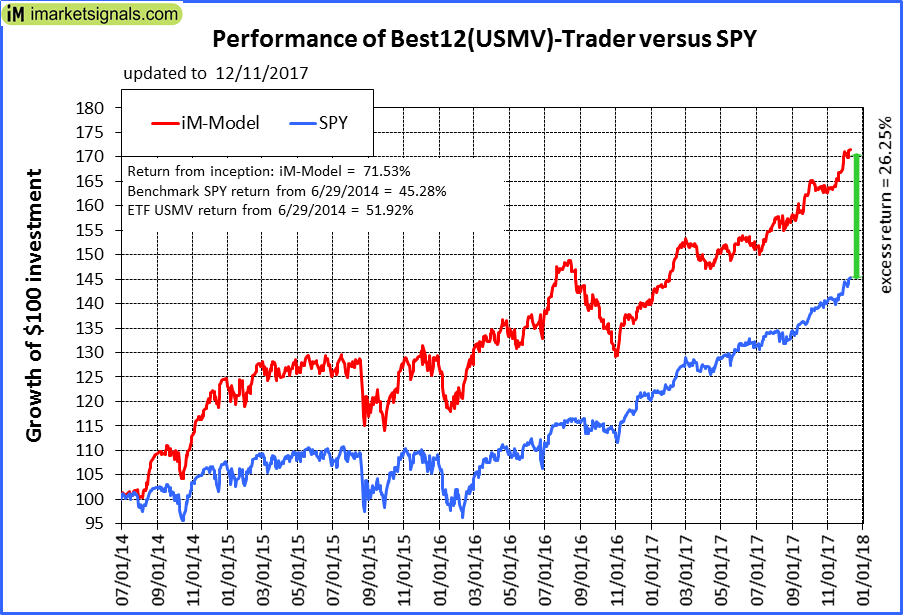
iM-Best12(USMV)-Trader: The model’s out of sample performance YTD is 22.6%, and for the last 12 months is 23.2%. Over the same period the benchmark SPY performance was 20.8% and 19.9% respectively. Since inception, on 6/30/2014, the model gained 71.53% while the benchmark SPY gained 45.28% and the ETF USMV gained 51.92% over the same period. Over the previous week the market value of iM-Best12(USMV)-Trader gained 0.42% at a time when SPY gained 0.82%. A starting capital of $100,000 at inception on 6/30/2014 would have grown to $171,299 which includes $385 cash and excludes $3,686 spent on fees and slippage. |
|
|
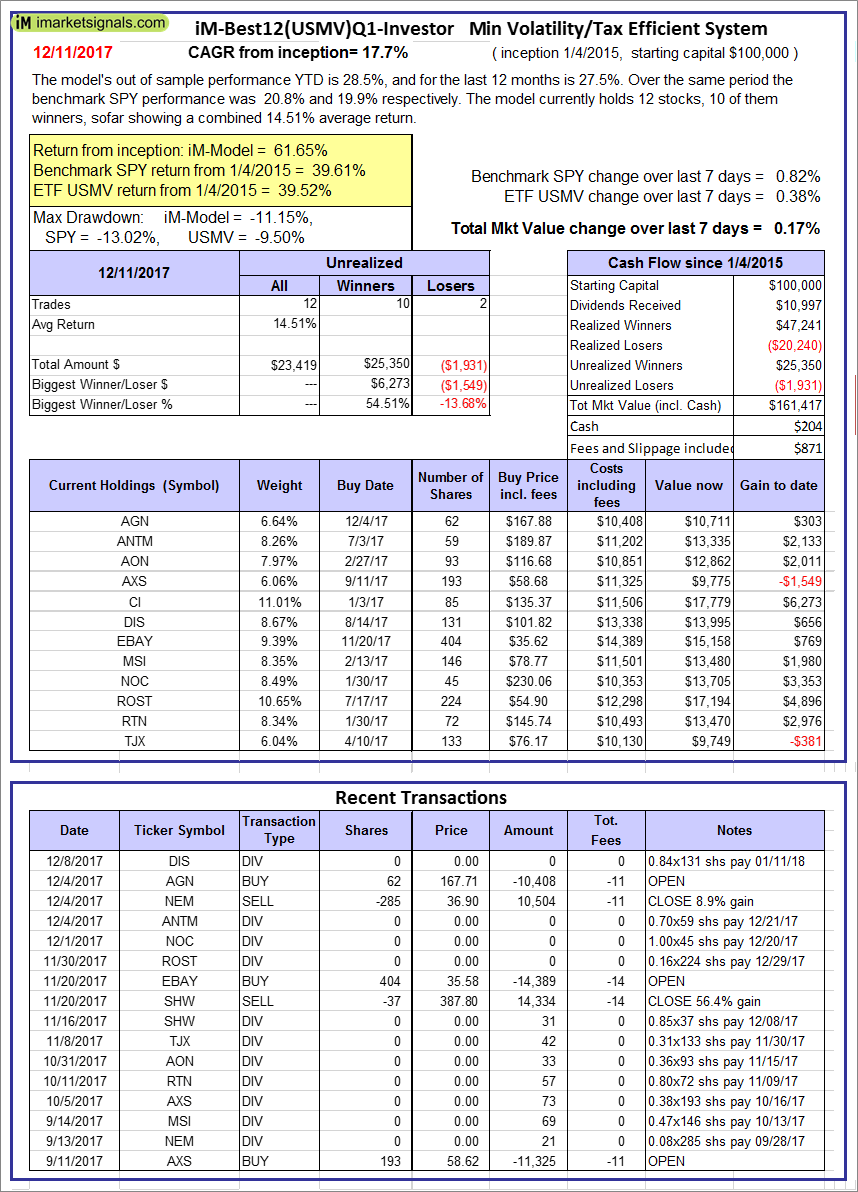
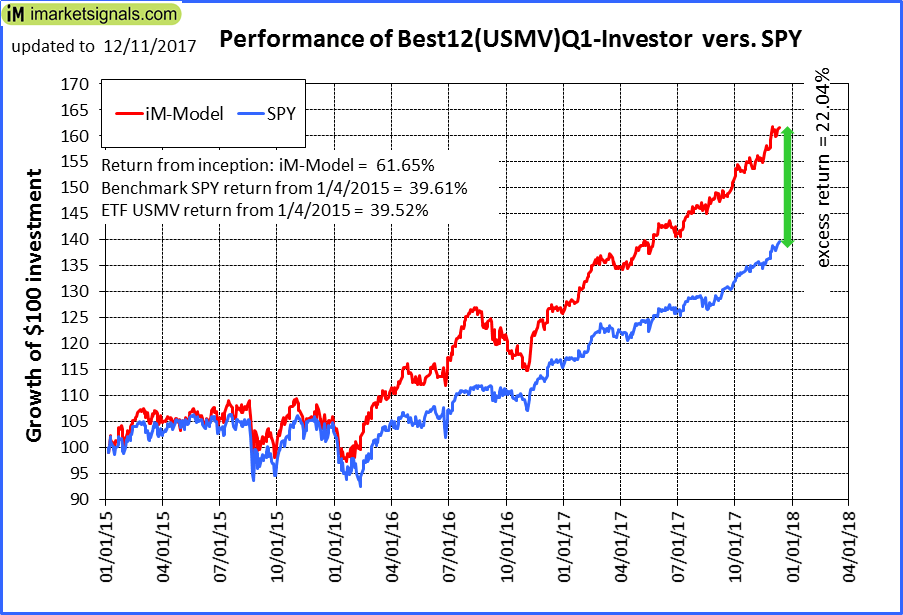
iM-Best12(USMV)Q1-Investor: The model’s out of sample performance YTD is 28.5%, and for the last 12 months is 27.5%. Over the same period the benchmark SPY performance was 20.8% and 19.9% respectively. Since inception, on 1/5/2015, the model gained 61.65% while the benchmark SPY gained 39.61% and the ETF USMV gained 39.52% over the same period. Over the previous week the market value of iM-Best12(USMV)Q1 gained 0.17% at a time when SPY gained 0.82%. A starting capital of $100,000 at inception on 1/5/2015 would have grown to $161,417 which includes $204 cash and excludes $871 spent on fees and slippage. |
|
|
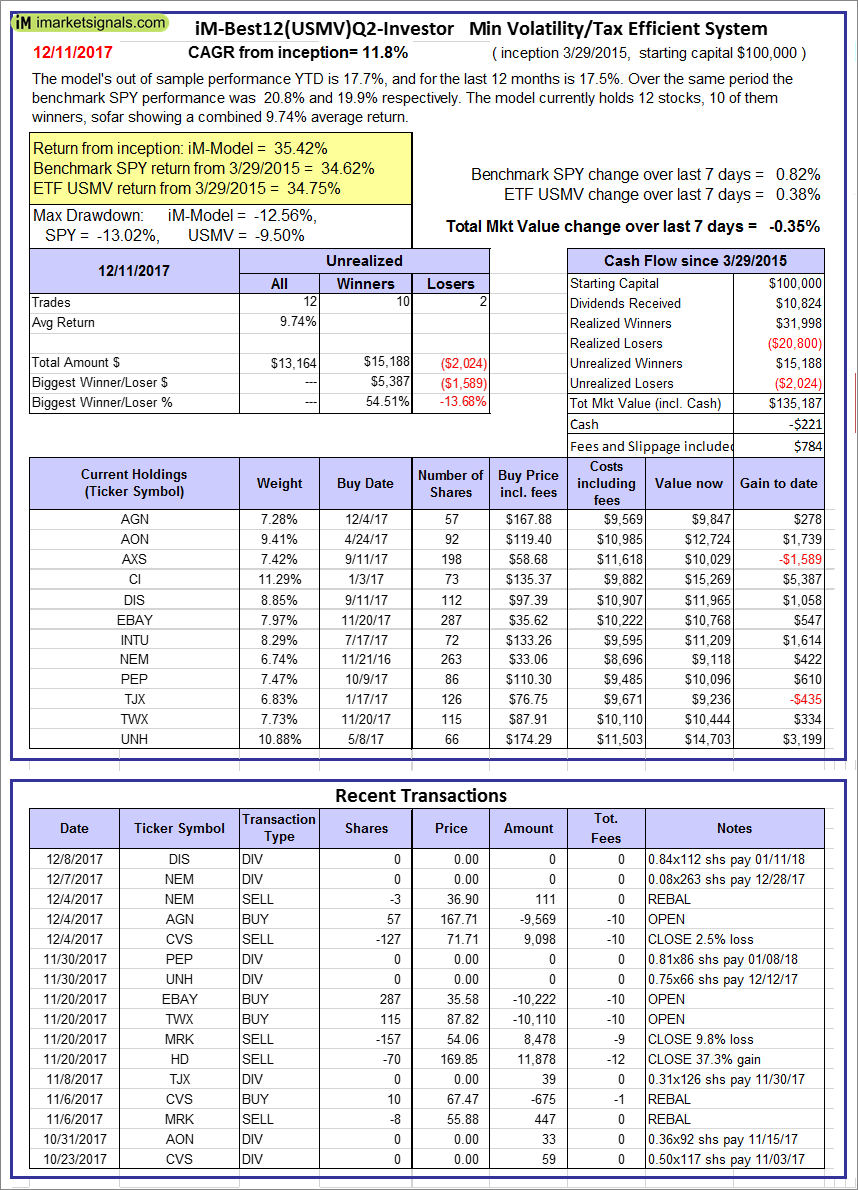
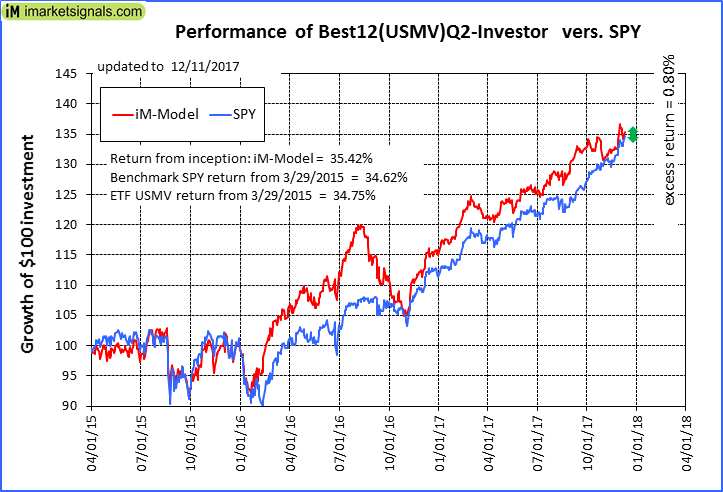
iM-Best12(USMV)Q2-Investor: The model’s out of sample performance YTD is 17.7%, and for the last 12 months is 17.5%. Over the same period the benchmark SPY performance was 20.8% and 19.9% respectively. Since inception, on 3/30/2015, the model gained 35.42% while the benchmark SPY gained 34.62% and the ETF USMV gained 34.75% over the same period. Over the previous week the market value of iM-Best12(USMV)Q2 gained -0.35% at a time when SPY gained 0.82%. A starting capital of $100,000 at inception on 3/30/2015 would have grown to $135,187 which includes -$221 cash and excludes $784 spent on fees and slippage. |
|
|
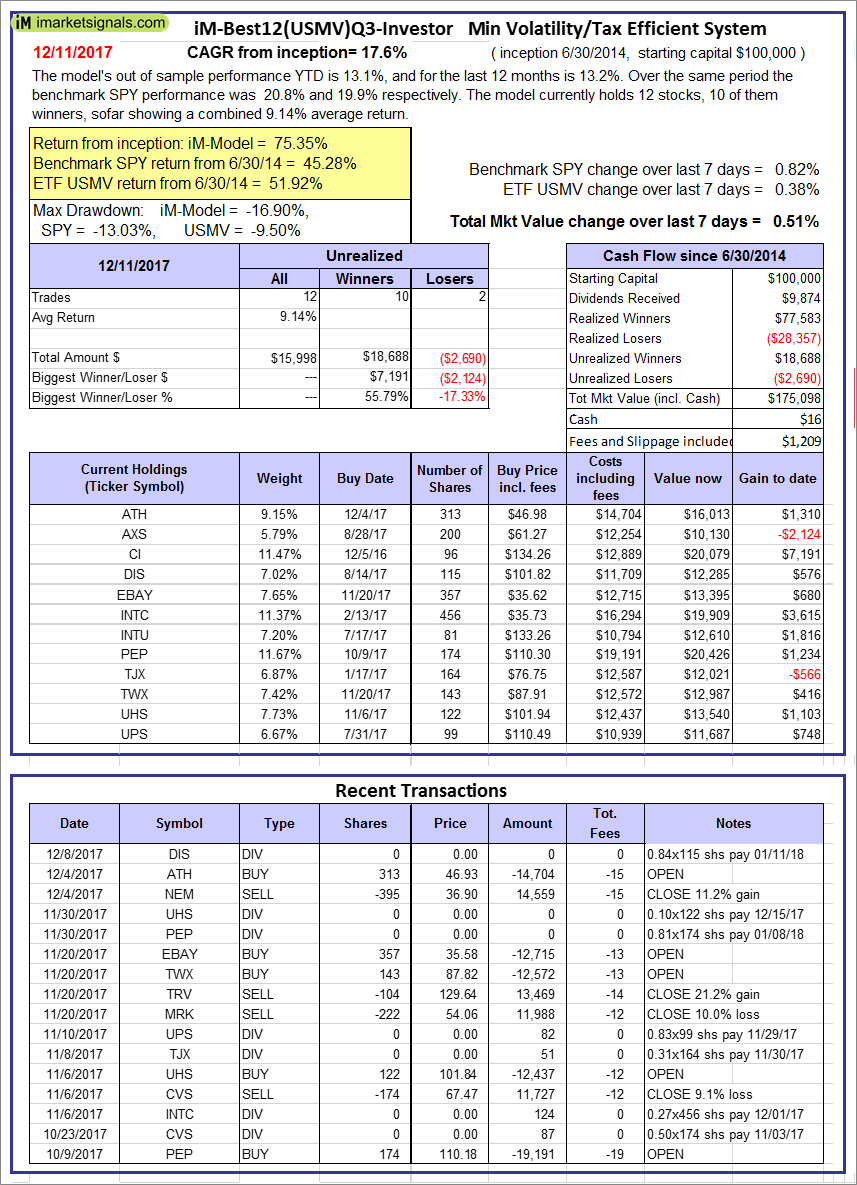
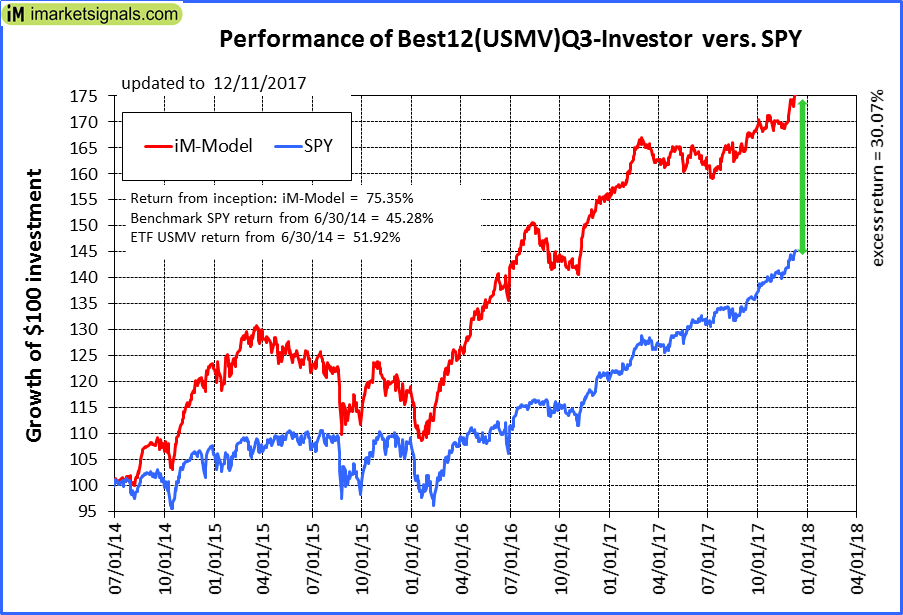
iM-Best12(USMV)Q3-Investor: The model’s out of sample performance YTD is 13.1%, and for the last 12 months is 13.2%. Over the same period the benchmark SPY performance was 20.8% and 19.9% respectively. Since inception, on 7/1/2014, the model gained 75.35% while the benchmark SPY gained 45.28% and the ETF USMV gained 51.92% over the same period. Over the previous week the market value of iM-Best12(USMV)Q3 gained 0.51% at a time when SPY gained 0.82%. A starting capital of $100,000 at inception on 7/1/2014 would have grown to $175,098 which includes $16 cash and excludes $1,209 spent on fees and slippage. |
|
|
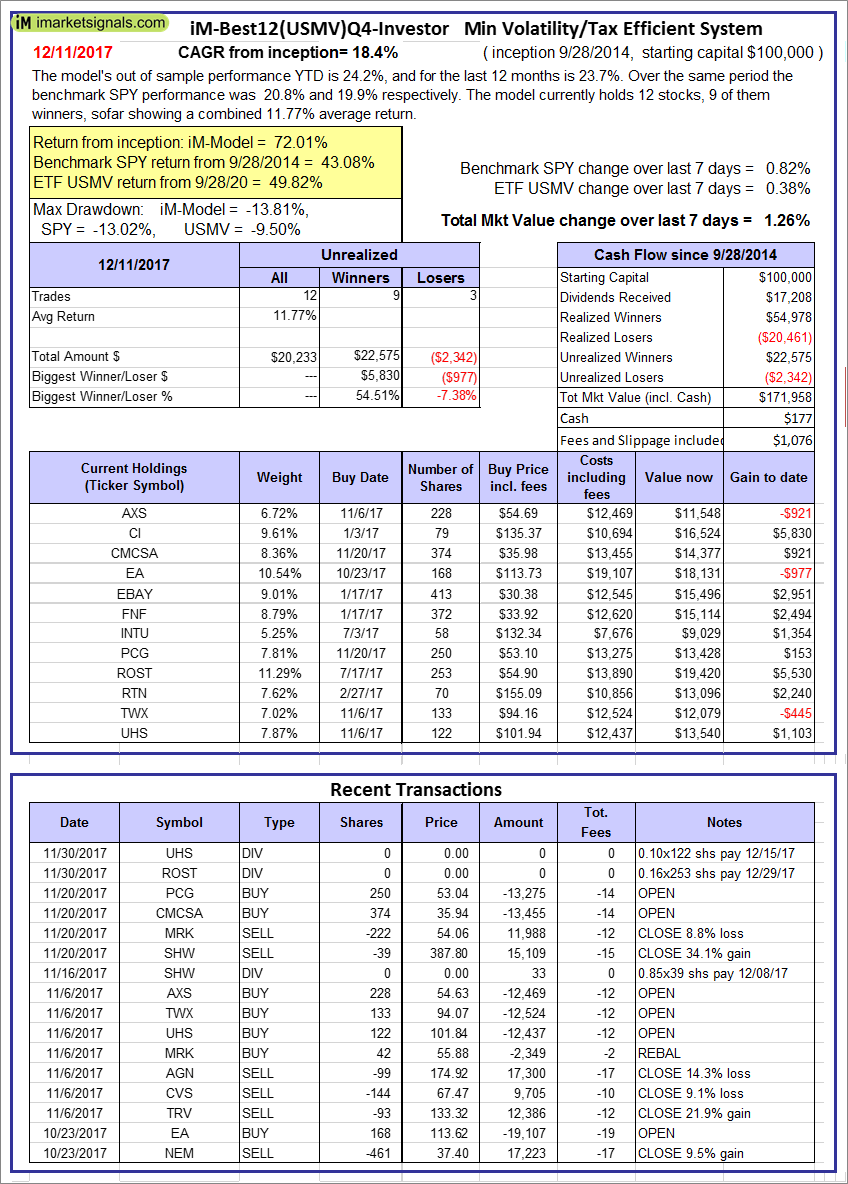
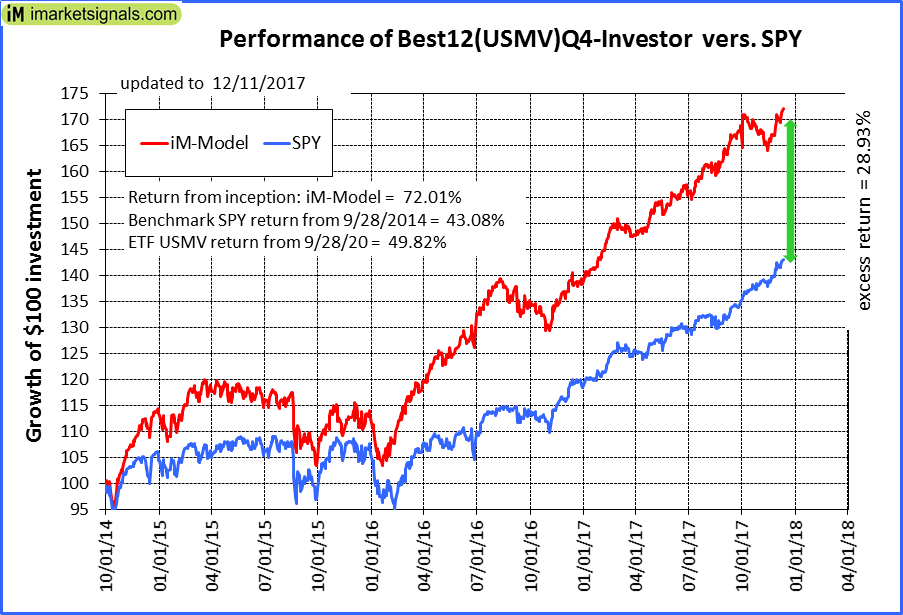
iM-Best12(USMV)Q4-Investor: Since inception, on 9/29/2014, the model gained 72.01% while the benchmark SPY gained 43.08% and the ETF USMV gained 49.82% over the same period. Over the previous week the market value of iM-Best12(USMV)Q4 gained 1.26% at a time when SPY gained 0.82%. A starting capital of $100,000 at inception on 9/29/2014 would have grown to $171,958 which includes $177 cash and excludes $1,076 spent on fees and slippage. |
|
|
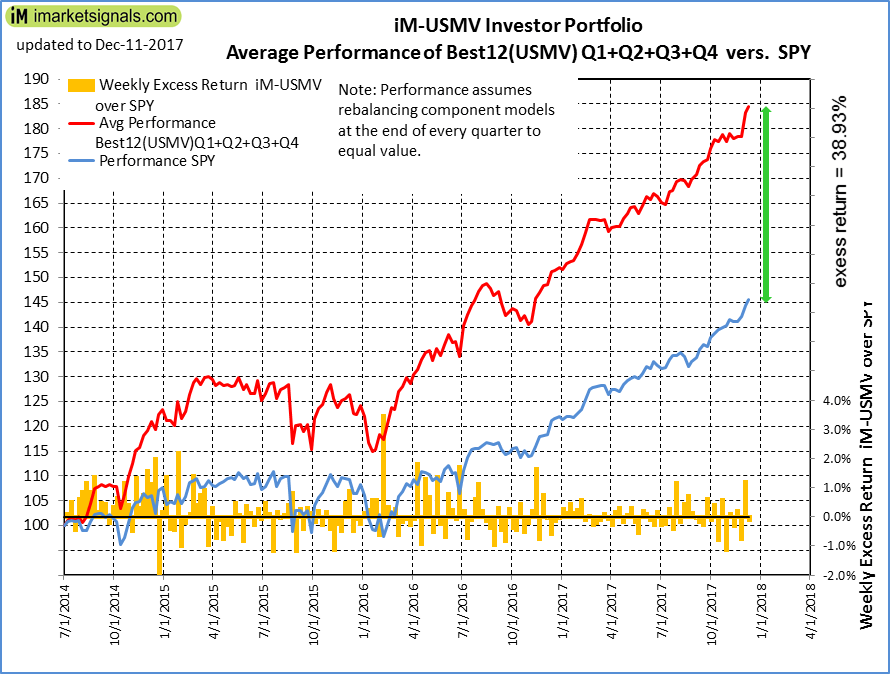
Average Performance of iM-Best12(USMV)Q1+Q2+Q3+Q4-Investor resulted in an excess return of 38.93% over SPY. (see iM-USMV Investor Portfolio) |
|
|
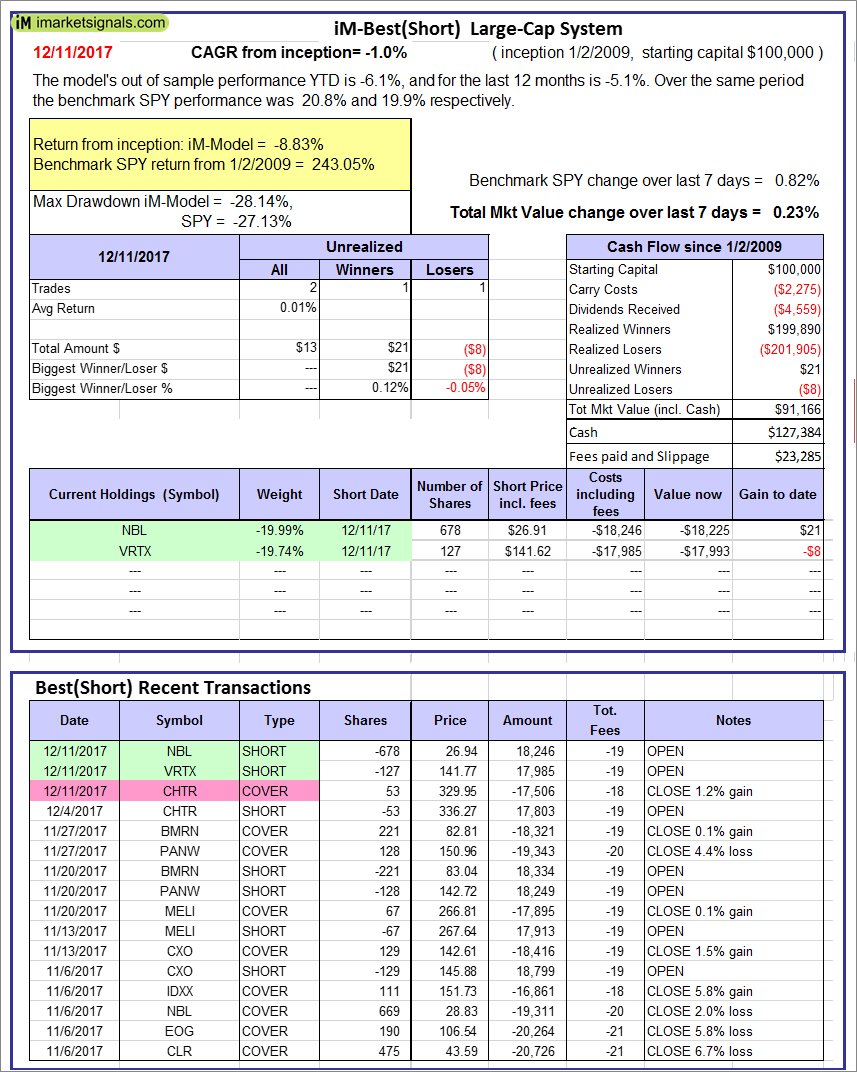
iM-Best(Short): The model’s out of sample performance YTD is -6.1%, and for the last 12 months is -5.1%. Over the same period the benchmark SPY performance was 20.8% and 19.9% respectively. Over the previous week the market value of iM-Best(Short) gained 0.23% at a time when SPY gained 0.82%. Over the period 1/2/2009 to 12/11/2017 the starting capital of $100,000 would have grown to $91,166 which includes $127,384 cash and excludes $23,285 spent on fees and slippage. |
|
|
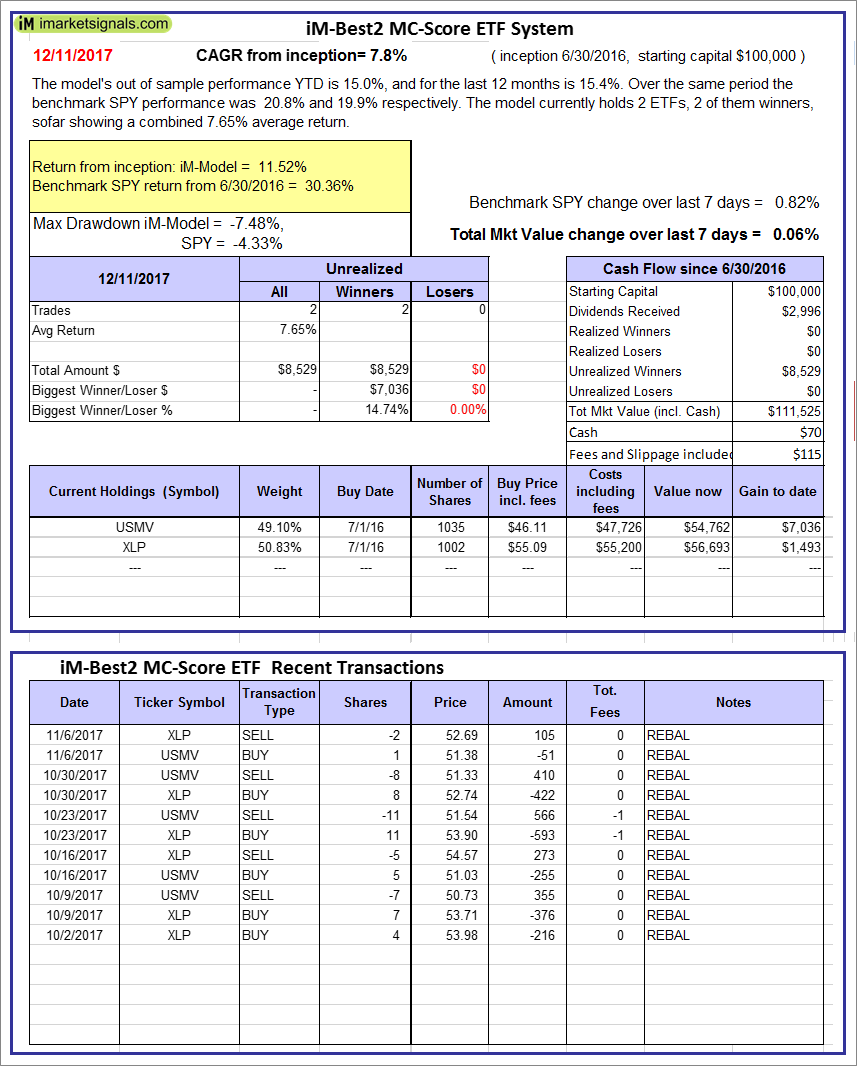
iM-Best2 MC-Score ETF System: The model’s out of sample performance YTD is 15.0%, and for the last 12 months is 15.4%. Over the same period the benchmark SPY performance was 20.8% and 19.9% respectively. Over the previous week the market value of the iM-Best2 MC-Score ETF System gained 0.06% at a time when SPY gained 0.82%. A starting capital of $100,000 at inception on 6/30/2016 would have grown to $111,525 which includes $70 cash and excludes $115 spent on fees and slippage. |
|
|
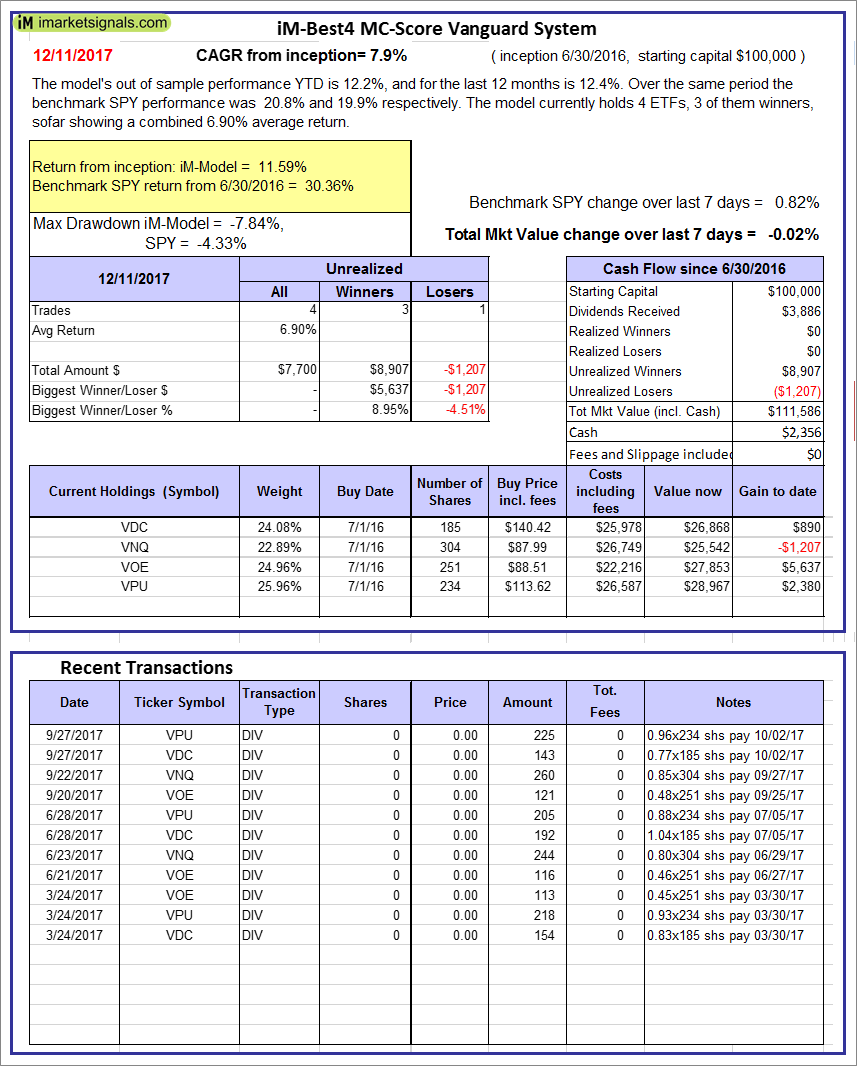
iM-Best4 MC-Score Vanguard System: The model’s out of sample performance YTD is 12.2%, and for the last 12 months is 12.4%. Over the same period the benchmark SPY performance was 20.8% and 19.9% respectively. Over the previous week the market value of the iM-Best4 MC-Score Vanguard System gained -0.02% at a time when SPY gained 0.82%. A starting capital of $100,000 at inception on 6/30/2016 would have grown to $111,586 which includes $2,356 cash and excludes $00 spent on fees and slippage. |
|
|
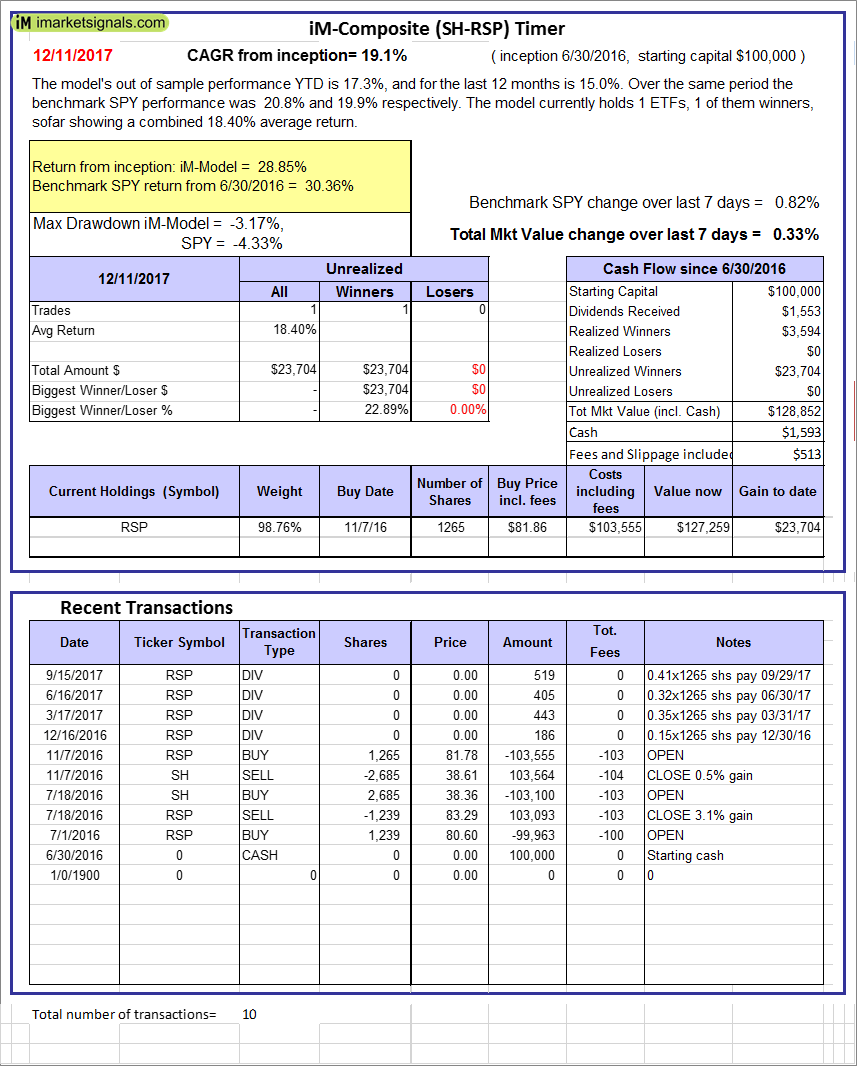
iM-Composite (SH-RSP) Timer: The model’s out of sample performance YTD is 17.3%, and for the last 12 months is 15.0%. Over the same period the benchmark SPY performance was 20.8% and 19.9% respectively. Over the previous week the market value of the iM-Composite (SH-RSP) Timer gained 0.33% at a time when SPY gained 0.82%. A starting capital of $100,000 at inception on 6/30/2016 would have grown to $128,852 which includes $1,593 cash and excludes $513 spent on fees and slippage. |
|
|
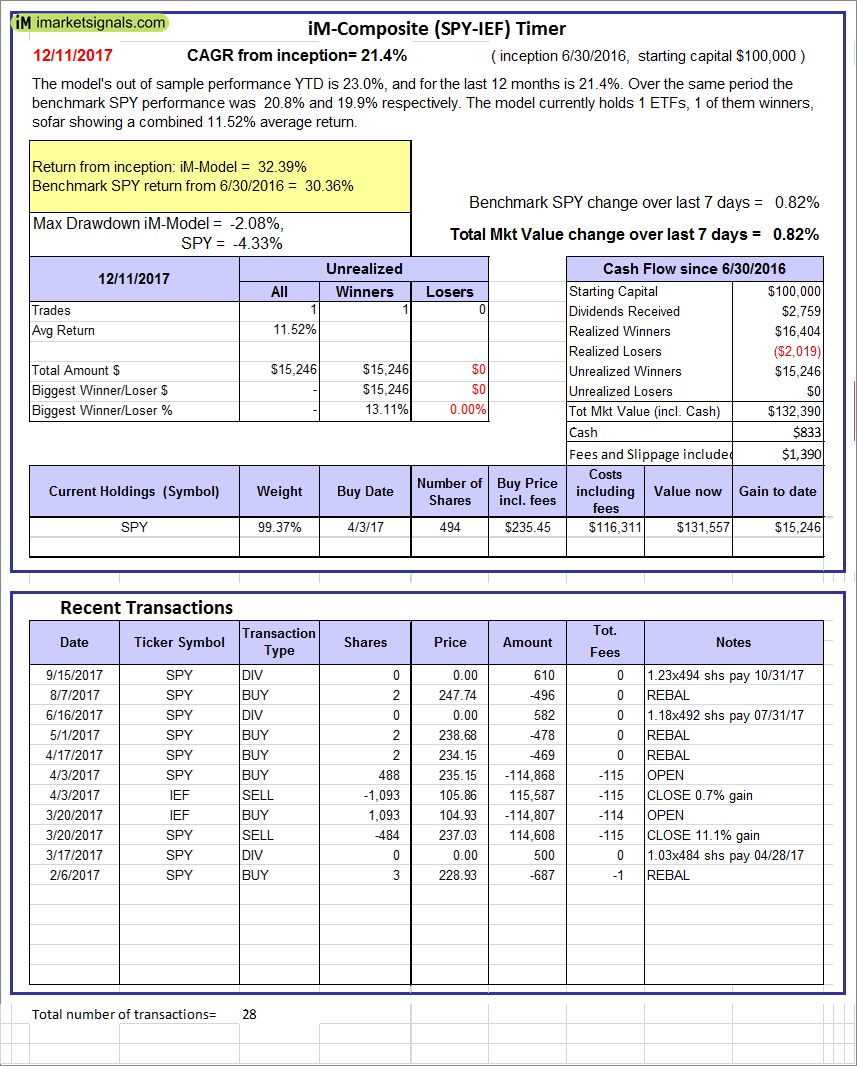
iM-Composite (SPY-IEF) Timer: The model’s out of sample performance YTD is 23.0%, and for the last 12 months is 21.4%. Over the same period the benchmark SPY performance was 20.8% and 19.9% respectively. Over the previous week the market value of the iM-Composite (SPY-IEF) Timer gained 0.82% at a time when SPY gained 0.82%. A starting capital of $100,000 at inception on 6/30/2016 would have grown to $132,390 which includes $833 cash and excludes $1,390 spent on fees and slippage. |
|
|
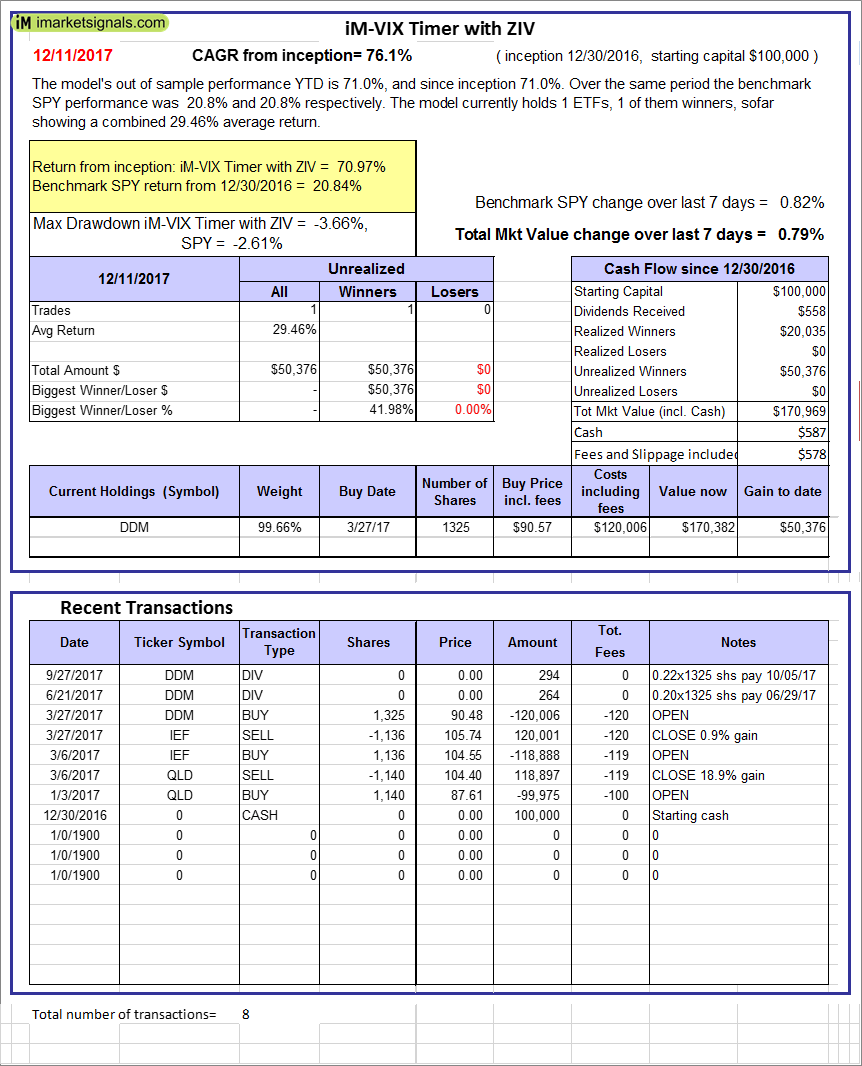
iM-VIX Timer with ZIV: The model’s out of sample performance YTD is 71.0%, and since inception 71.0%. Over the same period the benchmark SPY performance was 20.8% and 20.8% respectively. Over the previous week the market value of the iM-VIX Timer with ZIV gained 0.79% at a time when SPY gained 0.82%. A starting capital of $100,000 at inception on 6/30/2016 would have grown to $170,969 which includes $587 cash and excludes $578 spent on fees and slippage. |
|
|
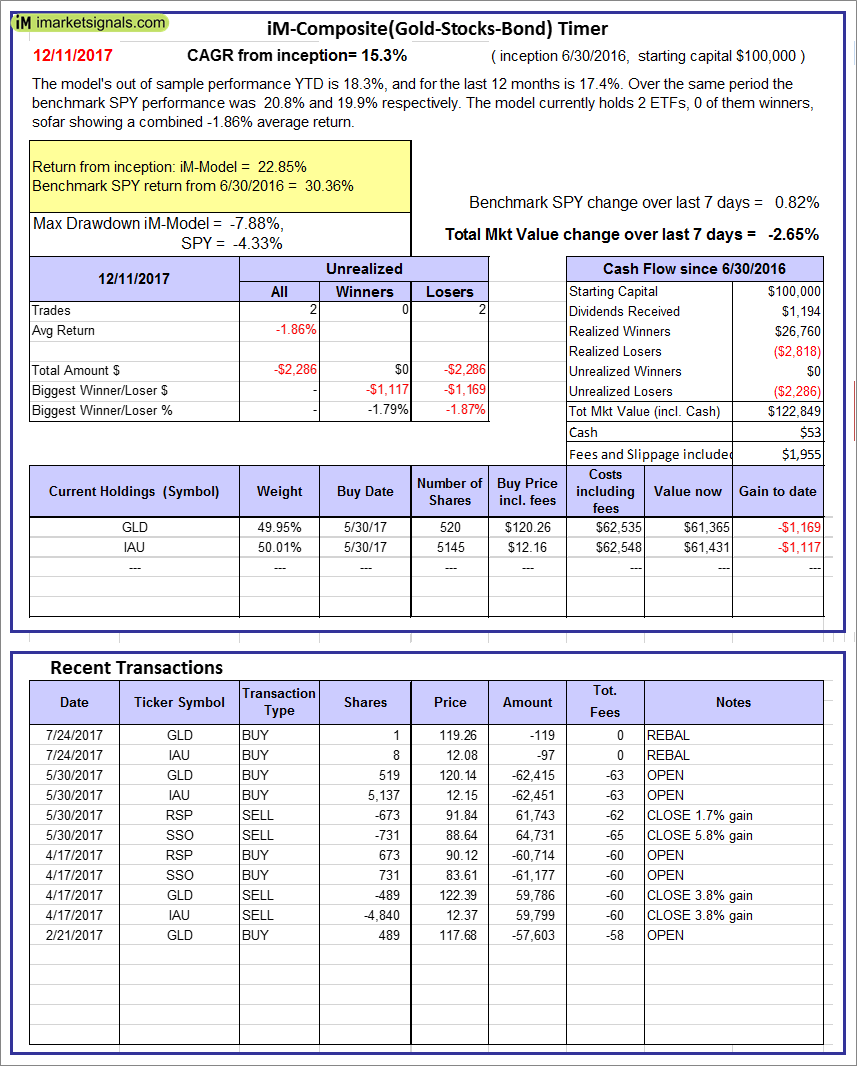
iM-Composite(Gold-Stocks-Bond) Timer: The model’s out of sample performance YTD is 18.3%, and for the last 12 months is 17.4%. Over the same period the benchmark SPY performance was 20.8% and 19.9% respectively. Over the previous week the market value of the iM-Composite(Gold-Stocks-Bond) Timer gained -2.65% at a time when SPY gained 0.82%. A starting capital of $100,000 at inception on 6/30/2016 would have grown to $122,849 which includes $53 cash and excludes $1,955 spent on fees and slippage. |
|
|
iM-Low Turnover Composite Timer Combo: The model’s out of sample performance from inception is 4.9%. The benchmark SPY performance over the same period is 15.0%. Over the previous week the market value of the iM-Low Turnover Composite Timer Combo gained -0.69% at a time when SPY gained 0.82%. A starting capital of $100,000 at inception on 3/24/27 would have grown to $104,857 which includes $1,060 cash and excludes $69 spent on fees and slippage. |
|
|
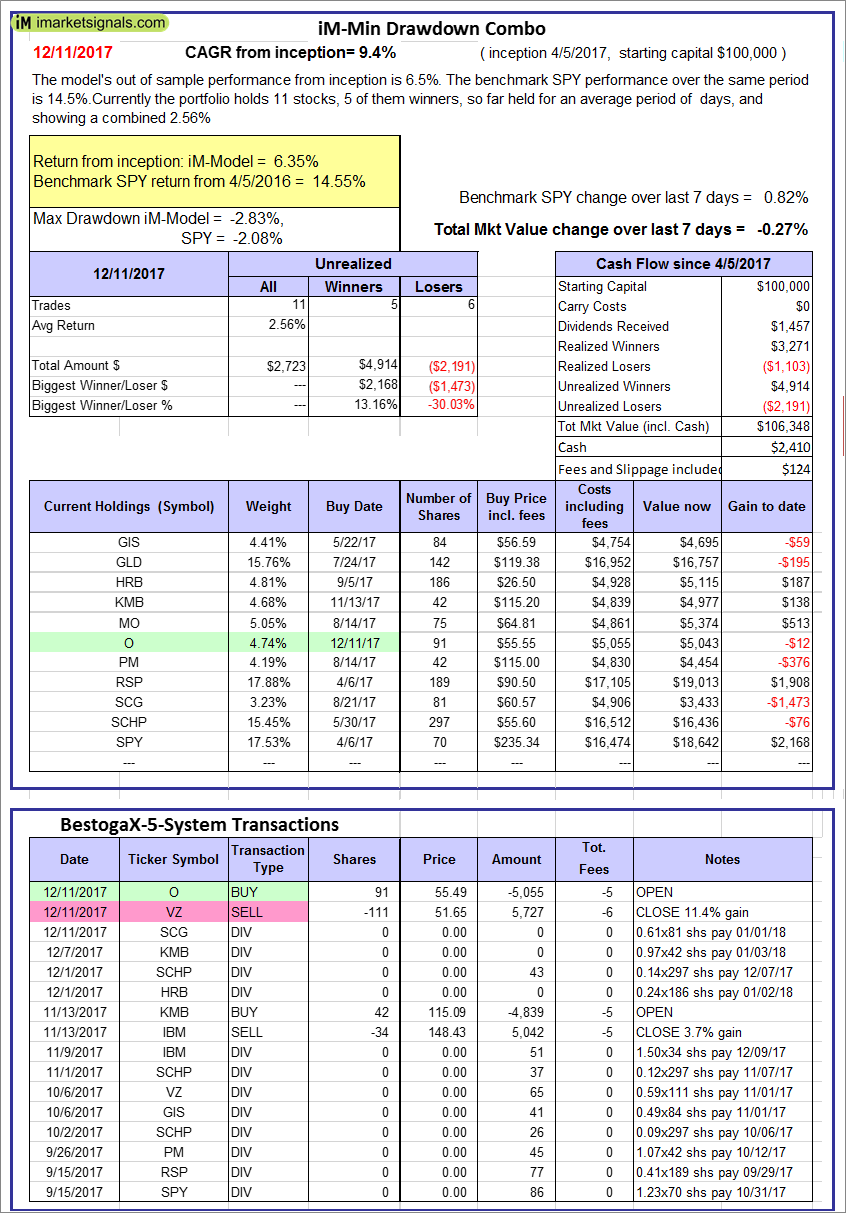
iM-Min Drawdown Combo: The model’s out of sample performance from inception is 6.5%. The benchmark SPY performance over the same period is 14.5%. Over the previous week the market value of the iM-Min Drawdown Combo gained -0.27% at a time when SPY gained 0.82%. A starting capital of $100,000 at inception on 4/5/2017 would have grown to $106,348 which includes $2,410 cash and excludes $124 spent on fees and slippage. |
|
|
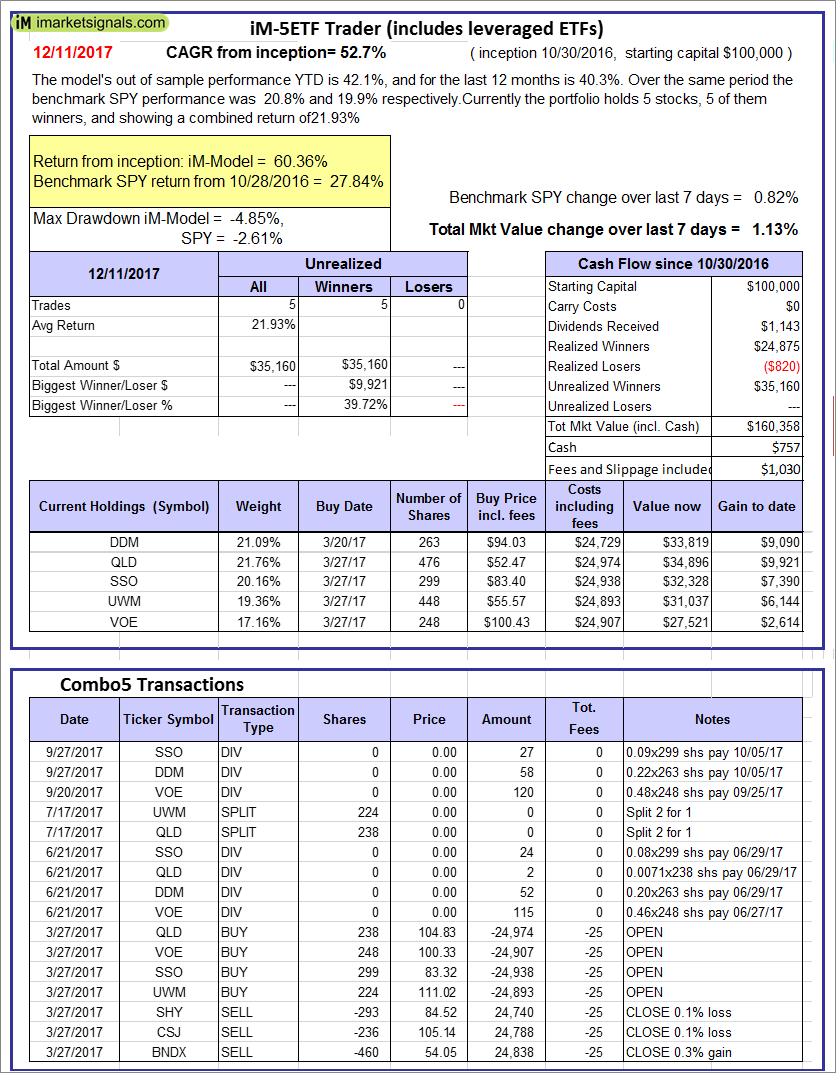
iM-5ETF Trader (includes leveraged ETFs): The model’s out of sample performance YTD is 42.1%, and for the last 12 months is 40.3%. Over the same period the benchmark SPY performance was 20.8% and 19.9% respectively. Over the previous week the market value of the iM-5ETF Trader (includes leveraged ETFs) gained 1.13% at a time when SPY gained 0.82%. A starting capital of $100,000 at inception on 10/30/2016 would have grown to $160,358 which includes $757 cash and excludes $1,030 spent on fees and slippage. |
|
|
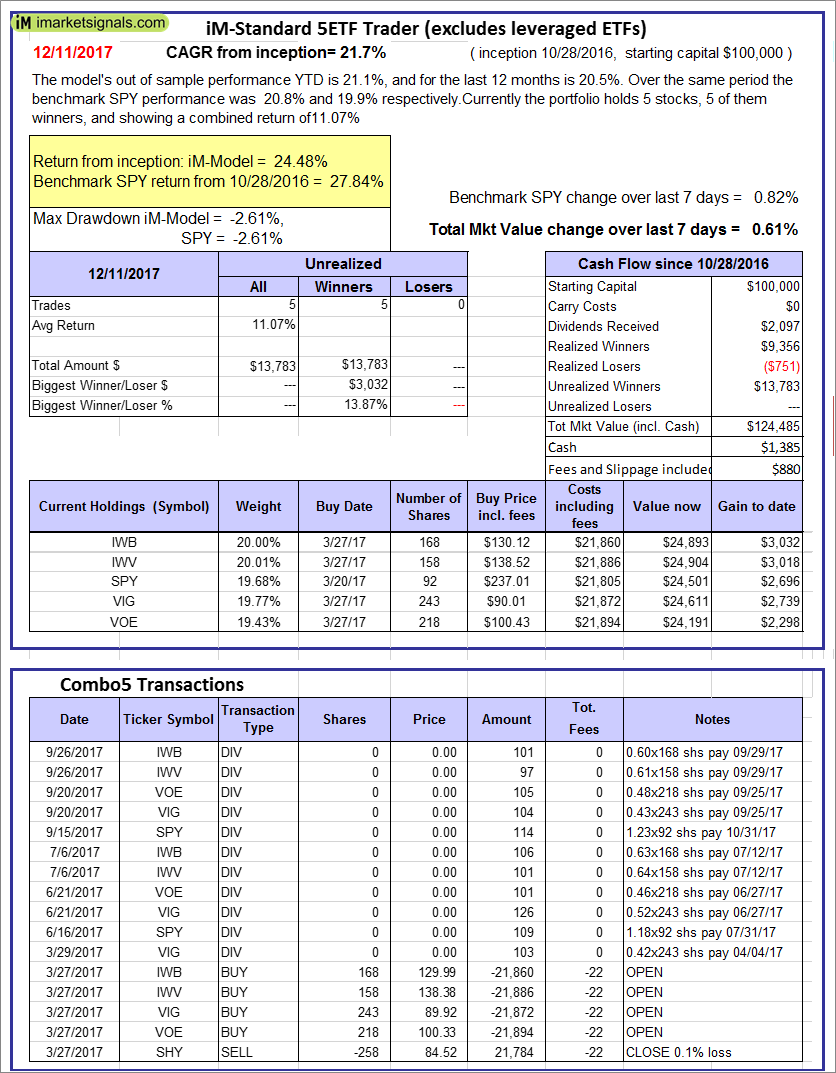
iM-Standard 5ETF Trader (excludes leveraged ETFs): The model’s out of sample performance YTD is 21.1%, and for the last 12 months is 20.5%. Over the same period the benchmark SPY performance was 20.8% and 19.9% respectively. Over the previous week the market value of the iM-Standard 5ETF Trader (excludes leveraged ETFs) gained 0.61% at a time when SPY gained 0.82%. A starting capital of $100,000 at inception on 10/30/2016 would have grown to $124,485 which includes $1,385 cash and excludes $880 spent on fees and slippage. |


Leave a Reply
You must be logged in to post a comment.