
  |
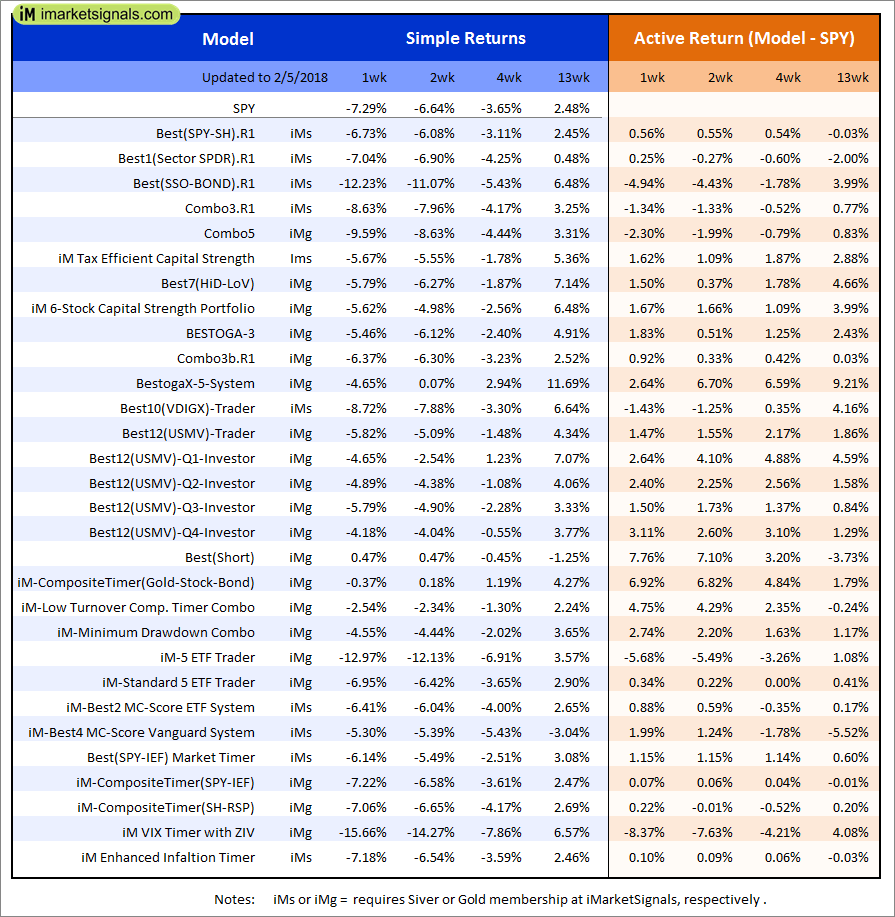
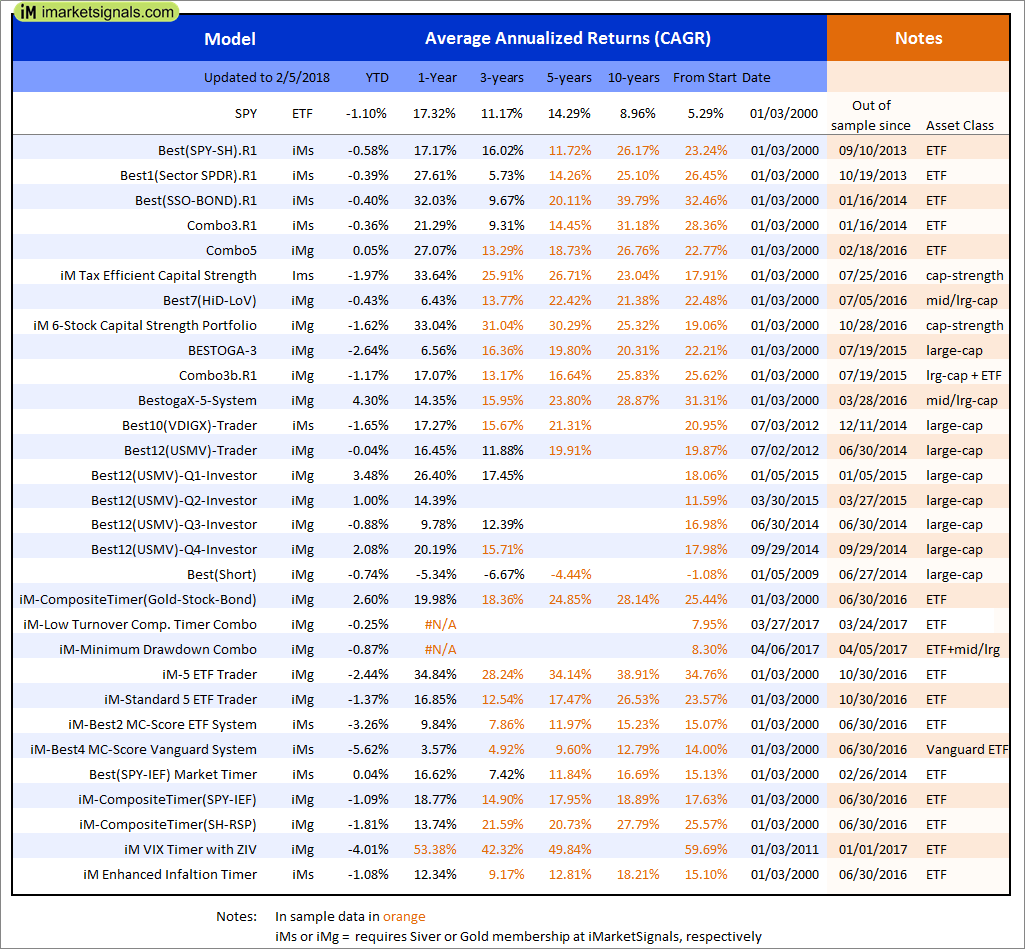
Out of sample performance summary of our models for the past 1, 2, 4 and 13 week periods. The active active return indicates how the models over- or underperformed the benchmark ETF SPY. Also the YTD, and the 1-, 3-, 5- and 10-year annualized returns are shown in the second table |
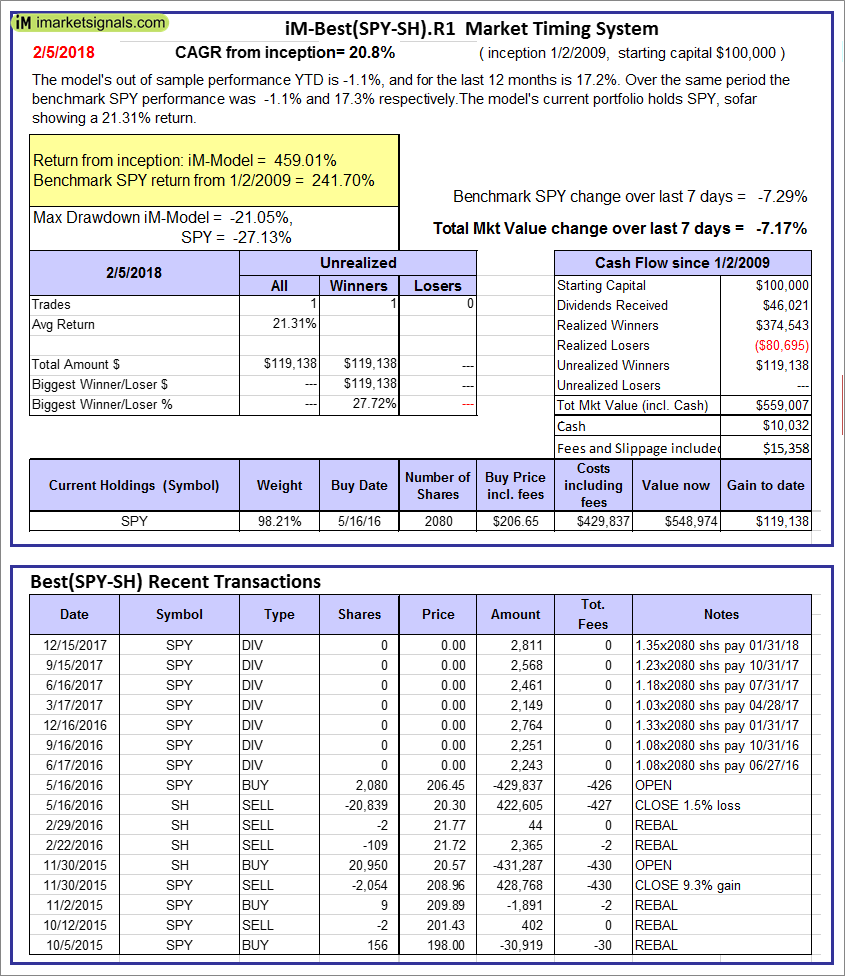 |
iM-Best(SPY-SH).R1: The model’s out of sample performance YTD is -1.1%, and for the last 12 months is 17.2%. Over the same period the benchmark SPY performance was -1.1% and 17.3% respectively. Over the previous week the market value of Best(SPY-SH) gained -7.17% at a time when SPY gained -7.29%. A starting capital of $100,000 at inception on 1/2/2009 would have grown to $559,007 which includes $10,032 cash and excludes $15,358 spent on fees and slippage. |
 |
iM-Combo3.R1: The model’s out of sample performance YTD is -0.6%, and for the last 12 months is 21.3%. Over the same period the benchmark SPY performance was -1.1% and 17.3% respectively. Over the previous week the market value of iM-Combo3.R1 gained -8.77% at a time when SPY gained -7.29%. A starting capital of $100,000 at inception on 2/3/2014 would have grown to $157,105 which includes -$2,740 cash and excludes $3,552 spent on fees and slippage. |
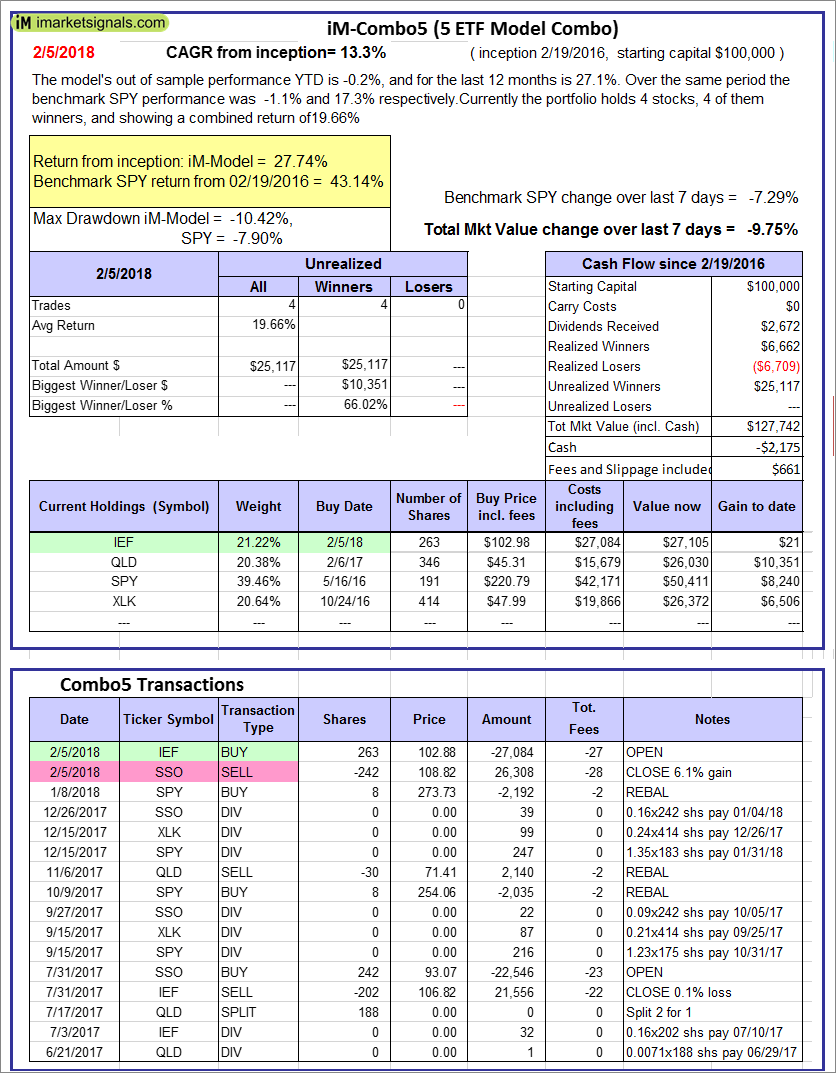 |
iM-Combo5: The model’s out of sample performance YTD is -0.2%, and for the last 12 months is 27.1%. Over the same period the benchmark SPY performance was -1.1% and 17.3% respectively. Over the previous week the market value of iM-Combo5 gained -9.75% at a time when SPY gained -7.29%. A starting capital of $100,000 at inception on 2/22/2016 would have grown to $127,742 which includes -$2,175 cash and excludes $661 spent on fees and slippage. |
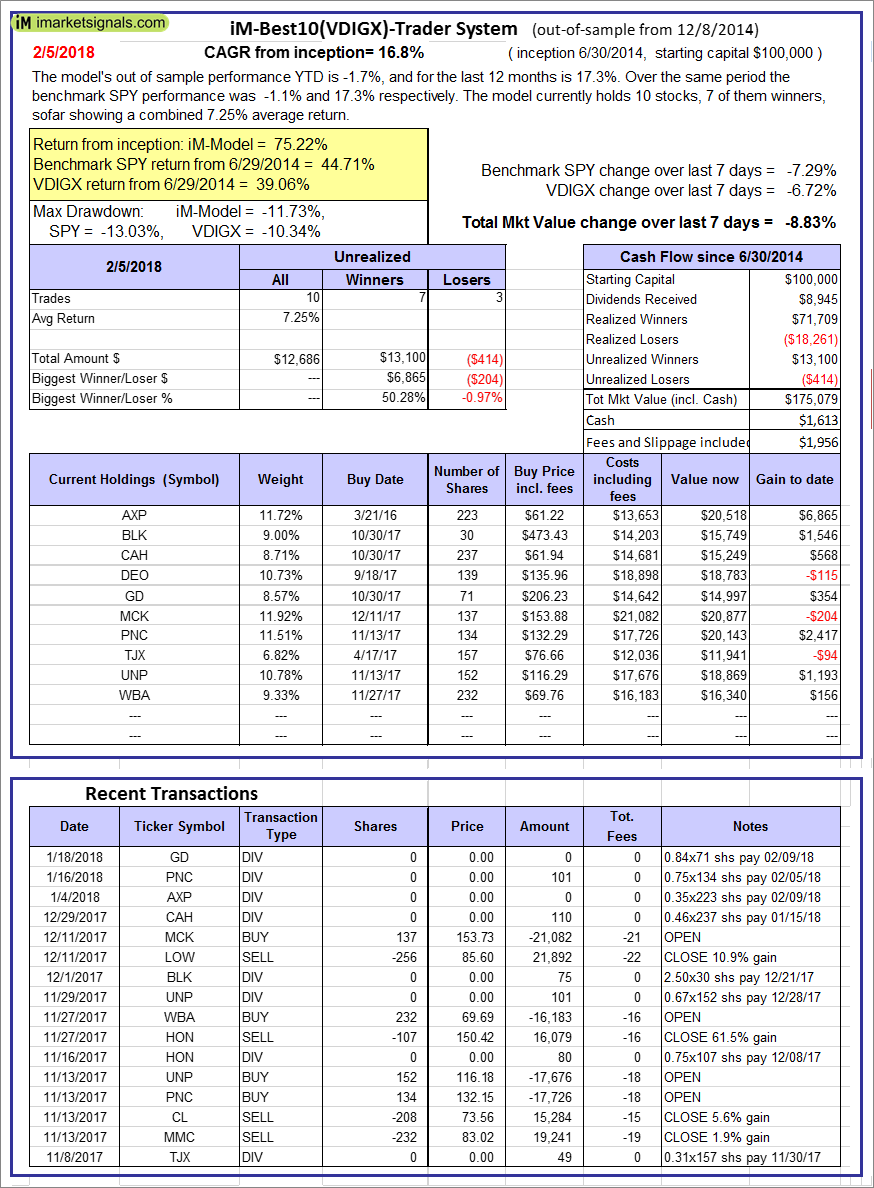 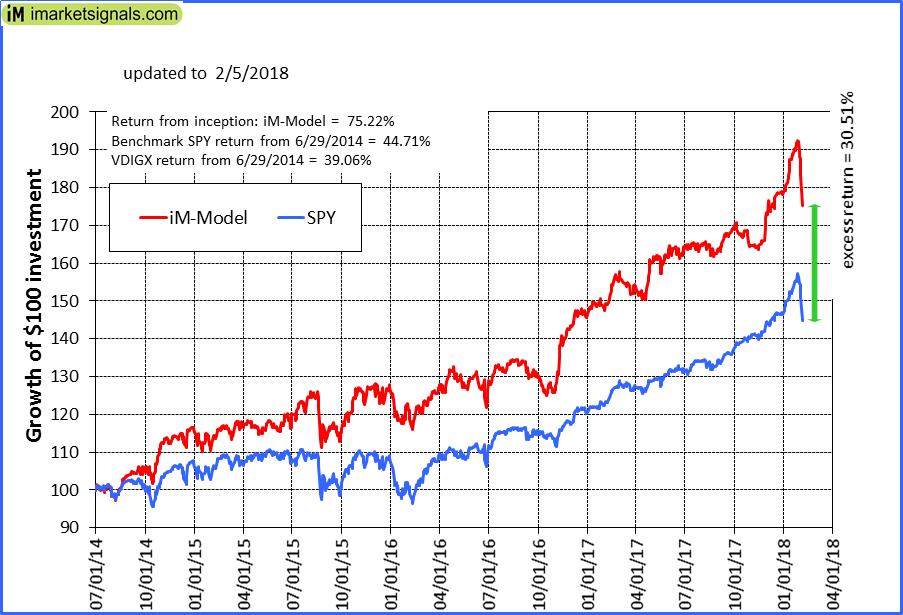 |
iM-Best10(VDIGX)-Trader: The model’s out of sample performance YTD is -1.7%, and for the last 12 months is 17.3%. Over the same period the benchmark SPY performance was -1.1% and 17.3% respectively. Since inception, on 7/1/2014, the model gained 75.22% while the benchmark SPY gained 44.71% and VDIGX gained 39.06% over the same period. Over the previous week the market value of iM-Best10(VDIGX) gained -8.83% at a time when SPY gained -7.29%. A starting capital of $100,000 at inception on 7/1/2014 would have grown to $175,079 which includes $1,613 cash and excludes $1,956 spent on fees and slippage. |
 |
iM-BESTOGA-3: The model’s out of sample performance YTD is -3.0%, and for the last 12 months is 6.6%. Over the same period the benchmark SPY performance was -1.1% and 17.3% respectively. Over the previous week the market value of iM-BESTOGA-3 gained -5.46% at a time when SPY gained -7.29%. A starting capital of $100,000 at inception on 2/3/2014 would have grown to $224,912 which includes $2,123 cash and excludes $2,007 spent on fees and slippage. |
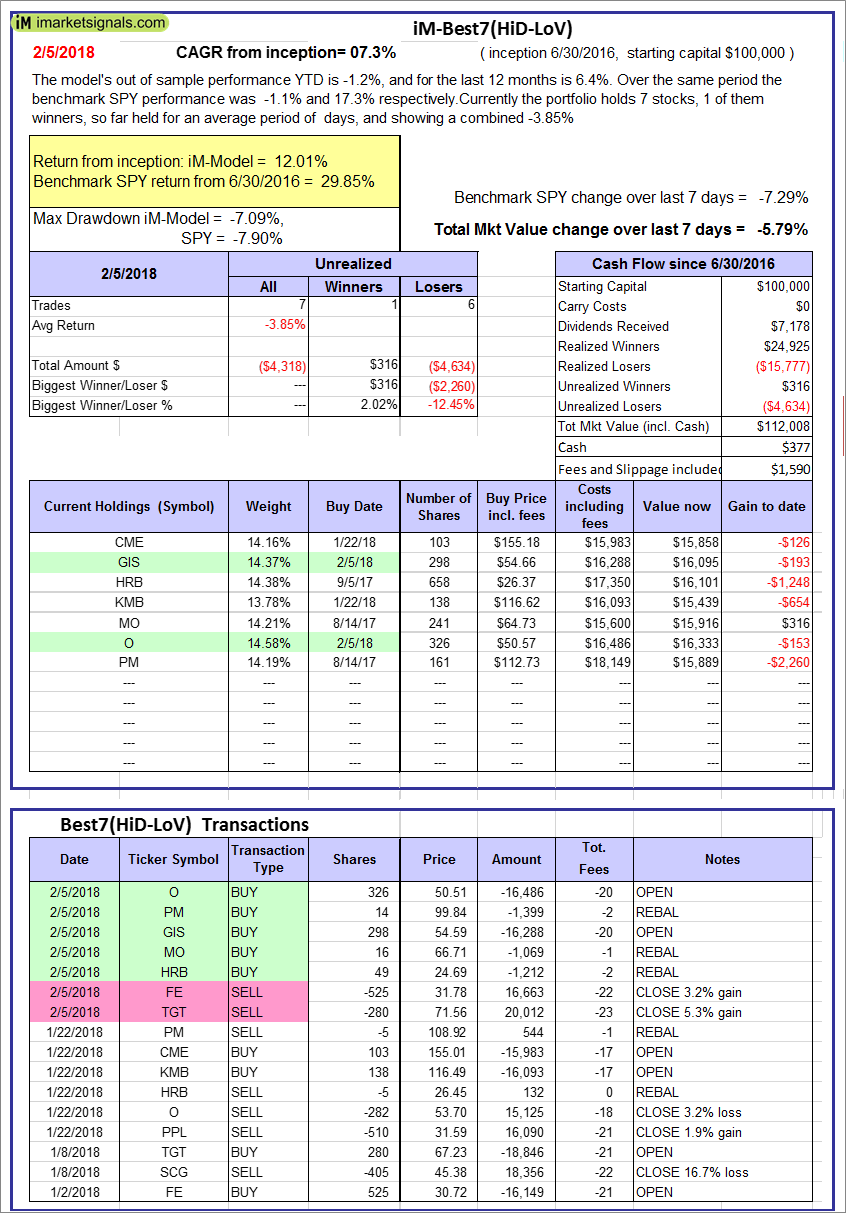 |
iM-Best7(HiD-LoV): The model’s out of sample performance YTD is -1.2%, and for the last 12 months is 6.4%. Over the same period the benchmark SPY performance was -1.1% and 17.3% respectively. Over the previous week the market value of iM-BESTOGA-3 gained -5.79% at a time when SPY gained -7.29%. A starting capital of $100,000 at inception on 6/30/2016 would have grown to $112,008 which includes $377 cash and excludes $1,590 spent on fees and slippage. |
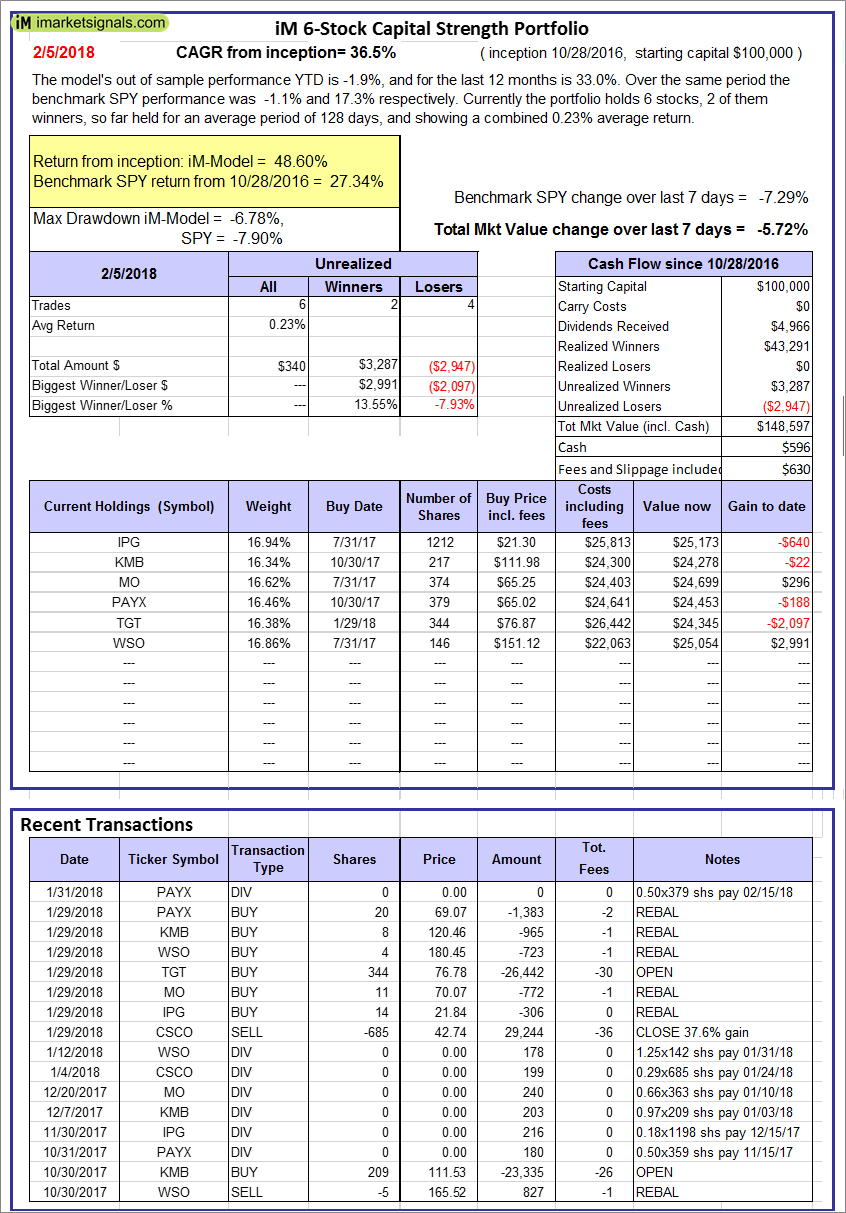 |
iM 6-Stock Capital Strength Portfolio: The model’s out of sample performance YTD is -1.9%, and for the last 12 months is 33.0%. Over the same period the benchmark SPY performance was -1.1% and 17.3% respectively. Over the previous week the market value of the iM 6-Stock Capital Strength Portfolio gained -5.72% at a time when SPY gained -7.29%. A starting capital of $100,000 at inception on 10/28/2016 would have grown to $148,597 which includes $596 cash and excludes $630 spent on fees and slippage. |
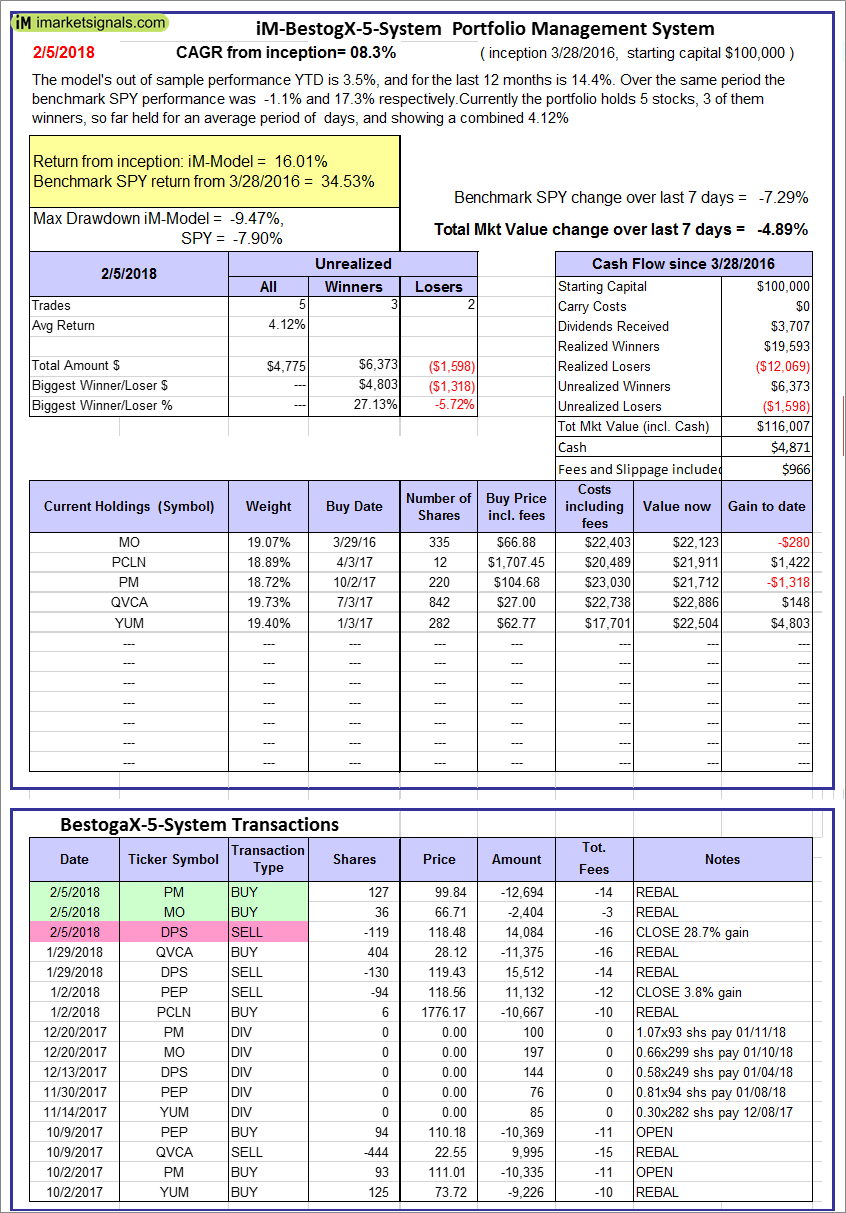 |
iM-BestogaX5-System: The model’s out of sample performance YTD is 3.5%, and for the last 12 months is 14.4%. Over the same period the benchmark SPY performance was -1.1% and 17.3% respectively. Over the previous week the market value of iM-BestogaX5-System gained -4.89% at a time when SPY gained -7.29%. A starting capital of $100,000 at inception on 3/28/2016 would have grown to $116,007 which includes $4,871 cash and excludes $966 spent on fees and slippage. |
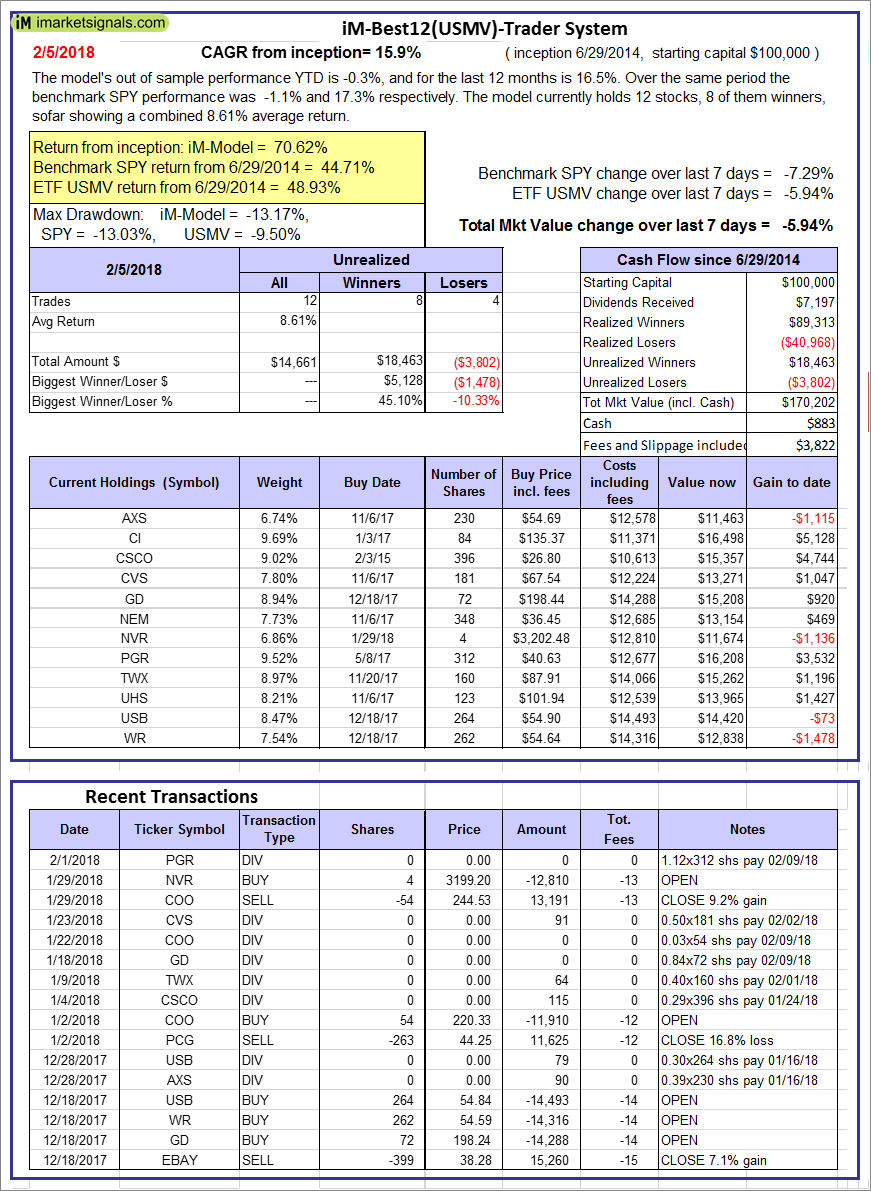 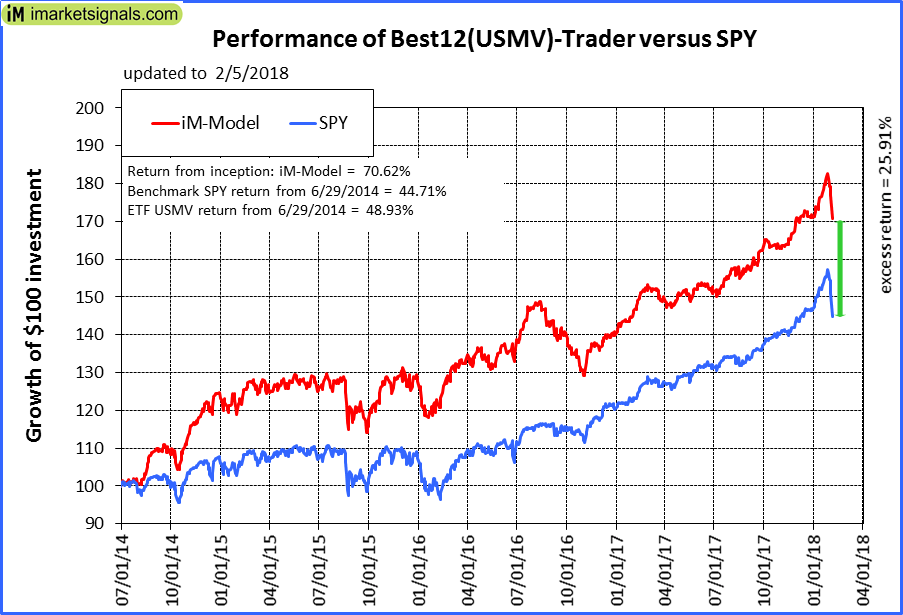 |
iM-Best12(USMV)-Trader: The model’s out of sample performance YTD is -0.3%, and for the last 12 months is 16.5%. Over the same period the benchmark SPY performance was -1.1% and 17.3% respectively. Since inception, on 6/30/2014, the model gained 70.62% while the benchmark SPY gained 44.71% and the ETF USMV gained 48.93% over the same period. Over the previous week the market value of iM-Best12(USMV)-Trader gained -5.94% at a time when SPY gained -7.29%. A starting capital of $100,000 at inception on 6/30/2014 would have grown to $170,202 which includes $883 cash and excludes $3,822 spent on fees and slippage. |
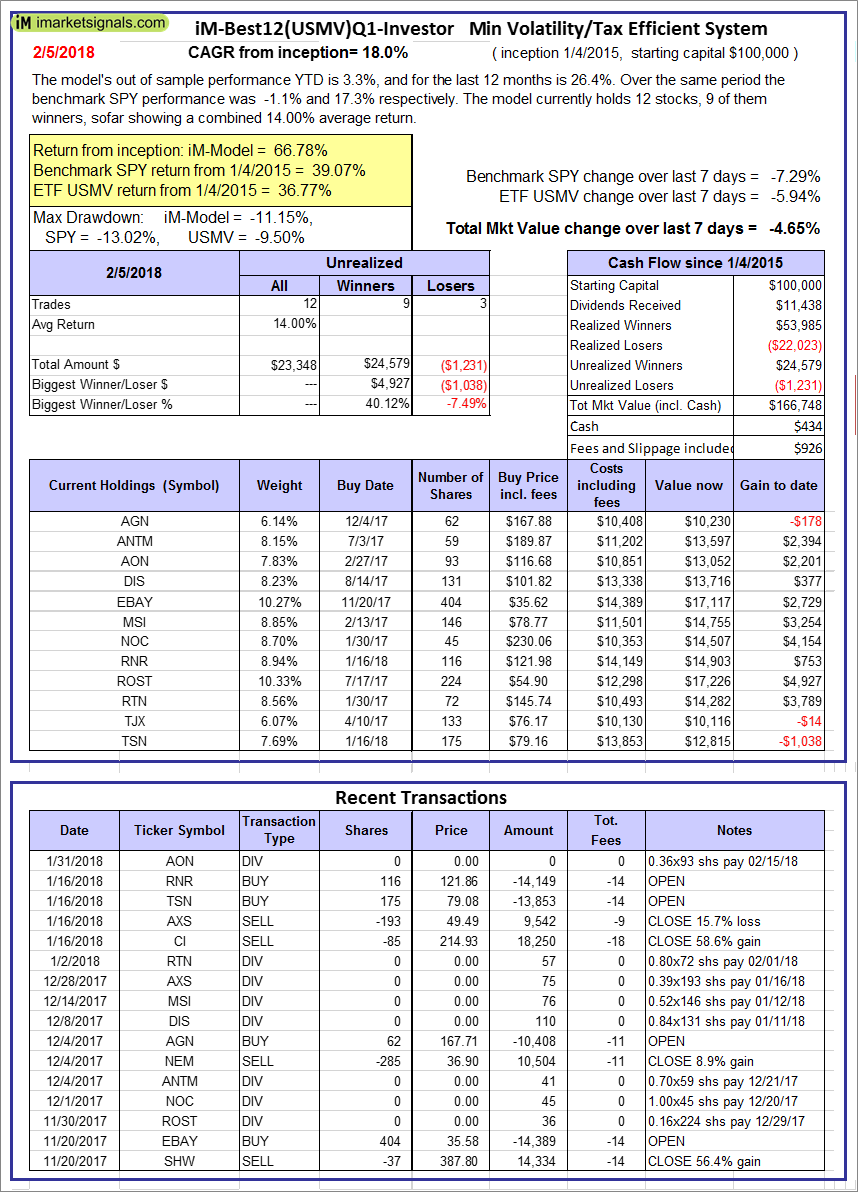 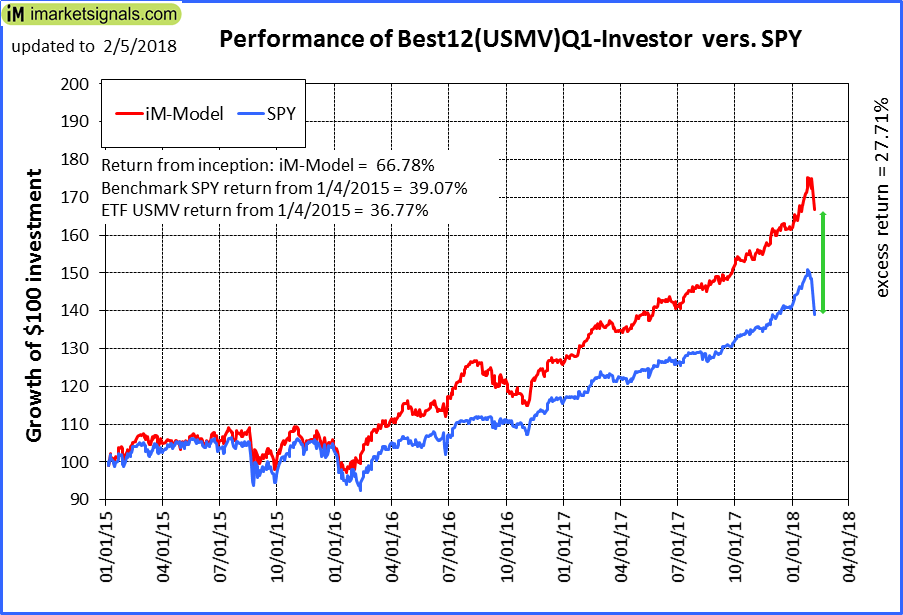 |
iM-Best12(USMV)Q1-Investor: The model’s out of sample performance YTD is 3.3%, and for the last 12 months is 26.4%. Over the same period the benchmark SPY performance was -1.1% and 17.3% respectively. Since inception, on 1/5/2015, the model gained 66.78% while the benchmark SPY gained 39.07% and the ETF USMV gained 36.77% over the same period. Over the previous week the market value of iM-Best12(USMV)Q1 gained -4.65% at a time when SPY gained -7.29%. A starting capital of $100,000 at inception on 1/5/2015 would have grown to $166,748 which includes $434 cash and excludes $926 spent on fees and slippage. |
 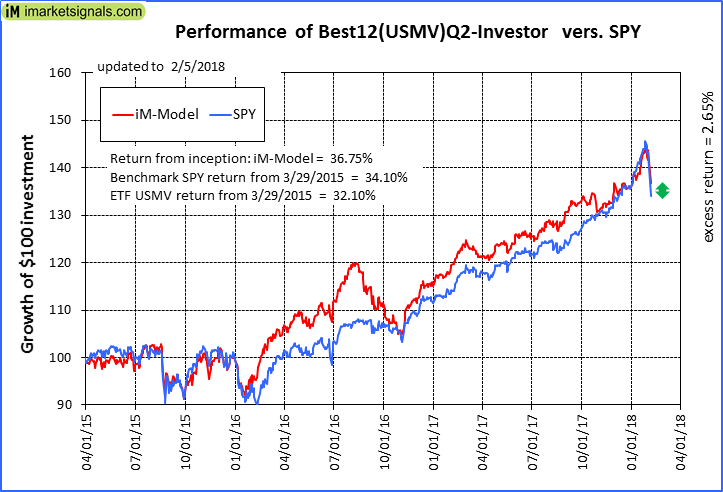 |
iM-Best12(USMV)Q2-Investor: The model’s out of sample performance YTD is 0.8%, and for the last 12 months is 14.4%. Over the same period the benchmark SPY performance was -1.1% and 17.3% respectively. Since inception, on 3/30/2015, the model gained 36.75% while the benchmark SPY gained 34.10% and the ETF USMV gained 32.10% over the same period. Over the previous week the market value of iM-Best12(USMV)Q2 gained -4.89% at a time when SPY gained -7.29%. A starting capital of $100,000 at inception on 3/30/2015 would have grown to $136,712 which includes $1,029 cash and excludes $874 spent on fees and slippage. |
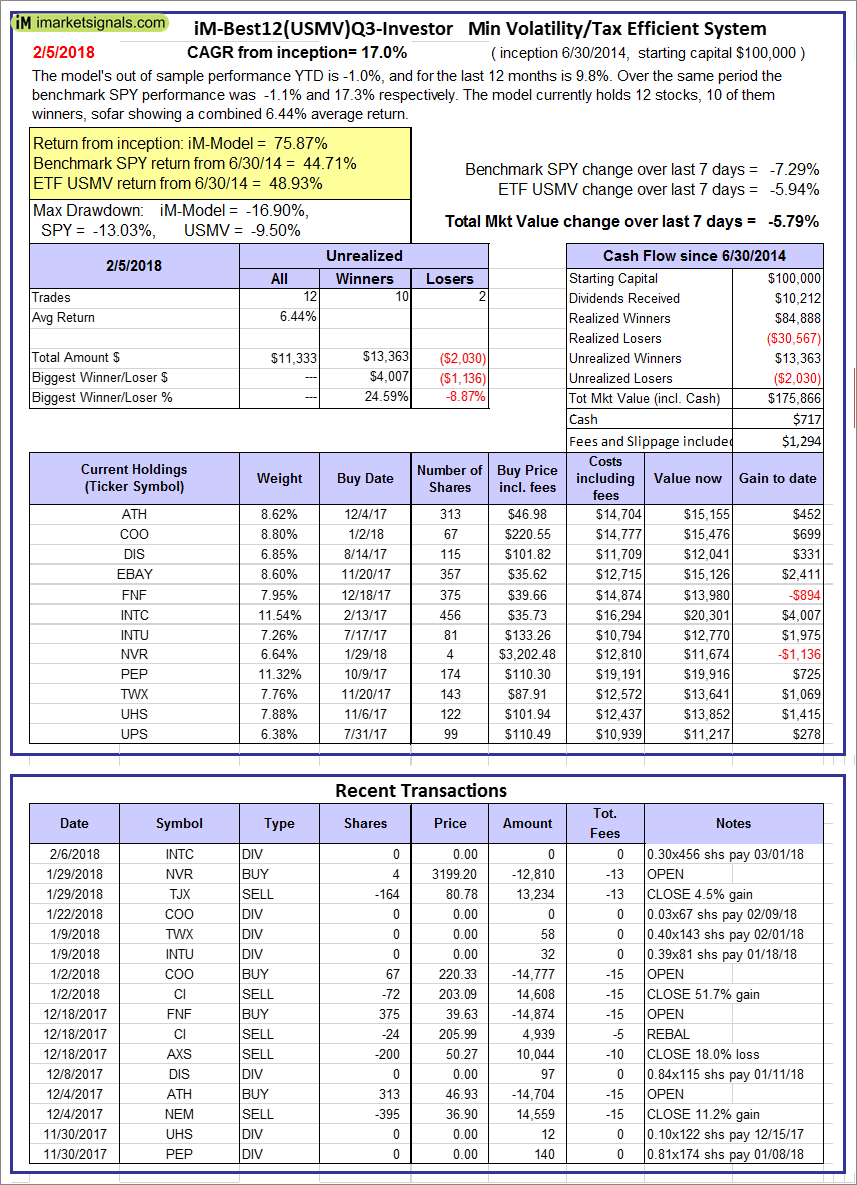 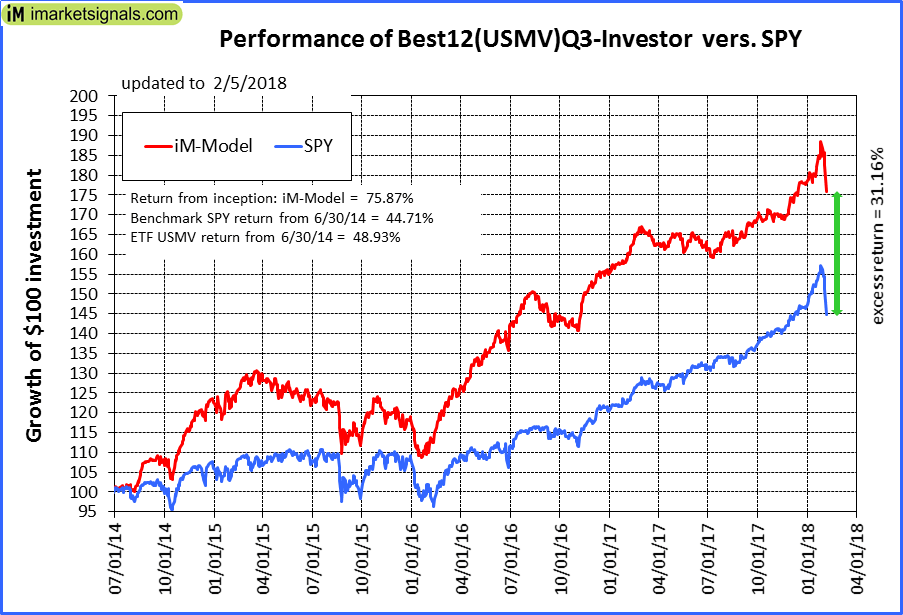 |
iM-Best12(USMV)Q3-Investor: The model’s out of sample performance YTD is -1.0%, and for the last 12 months is 9.8%. Over the same period the benchmark SPY performance was -1.1% and 17.3% respectively. Since inception, on 7/1/2014, the model gained 75.87% while the benchmark SPY gained 44.71% and the ETF USMV gained 48.93% over the same period. Over the previous week the market value of iM-Best12(USMV)Q3 gained -5.79% at a time when SPY gained -7.29%. A starting capital of $100,000 at inception on 7/1/2014 would have grown to $175,866 which includes $717 cash and excludes $1,294 spent on fees and slippage. |
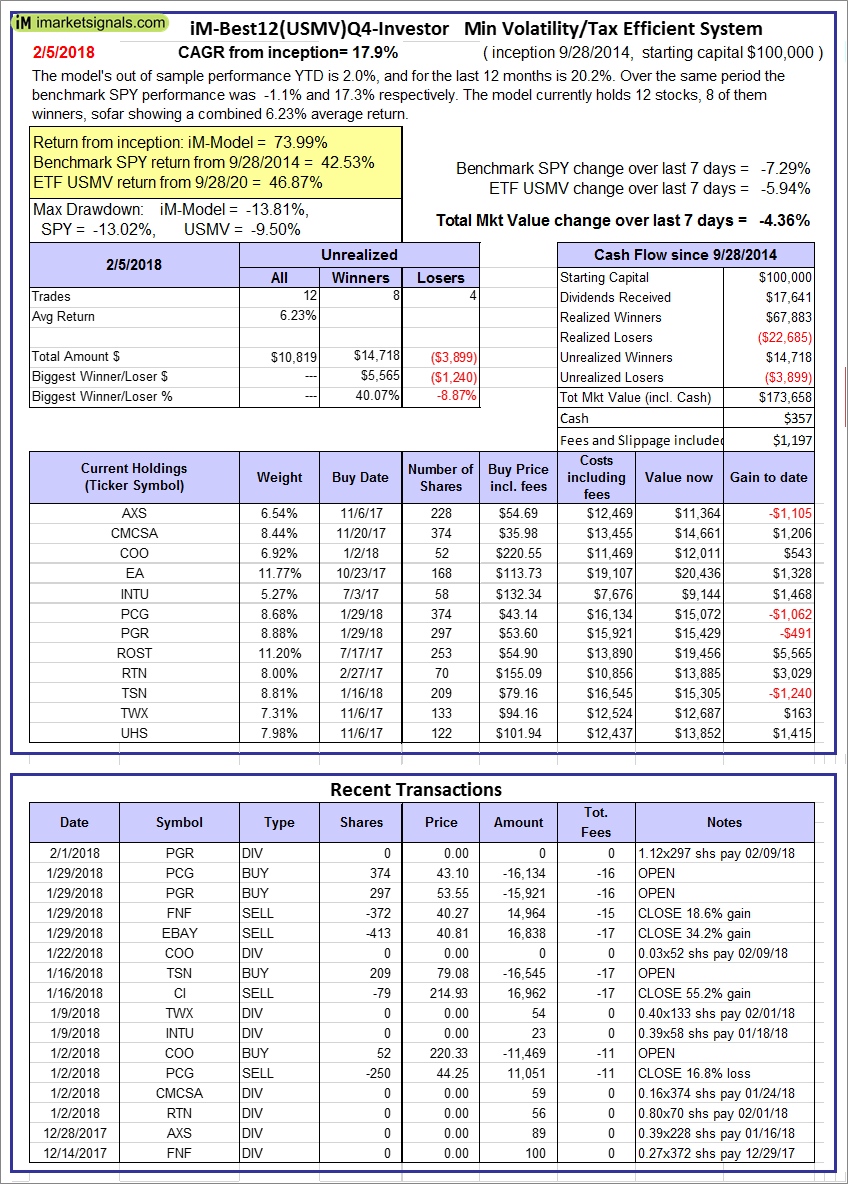  |
iM-Best12(USMV)Q4-Investor: Since inception, on 9/29/2014, the model gained 73.99% while the benchmark SPY gained 42.53% and the ETF USMV gained 46.87% over the same period. Over the previous week the market value of iM-Best12(USMV)Q4 gained -4.36% at a time when SPY gained -7.29%. A starting capital of $100,000 at inception on 9/29/2014 would have grown to $173,658 which includes $357 cash and excludes $1,197 spent on fees and slippage. |
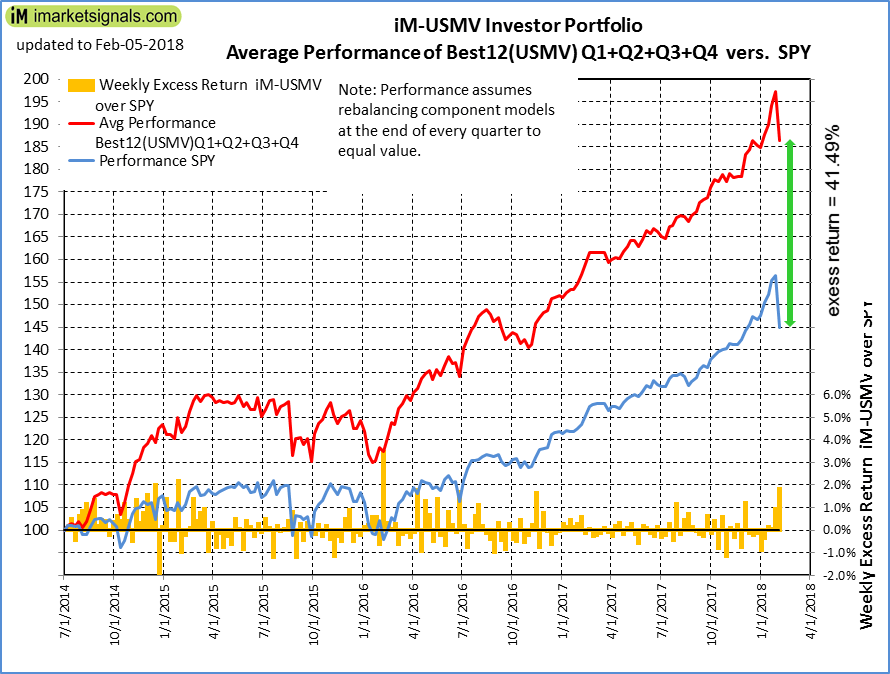 |
Average Performance of iM-Best12(USMV)Q1+Q2+Q3+Q4-Investor resulted in an excess return of 41.49% over SPY. (see iM-USMV Investor Portfolio) |
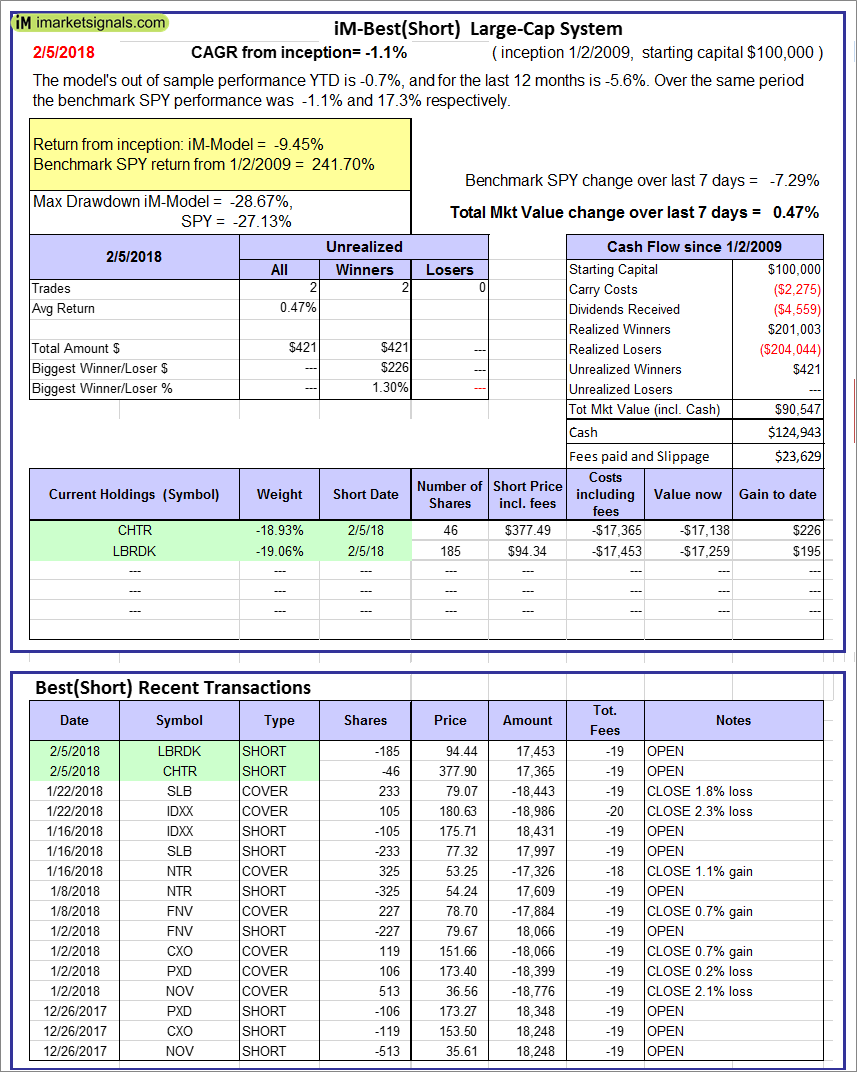 |
iM-Best(Short): The model’s out of sample performance YTD is -0.7%, and for the last 12 months is -5.6%. Over the same period the benchmark SPY performance was -1.1% and 17.3% respectively. Over the previous week the market value of iM-Best(Short) gained 0.47% at a time when SPY gained -7.29%. Over the period 1/2/2009 to 2/5/2018 the starting capital of $100,000 would have grown to $90,547 which includes $124,943 cash and excludes $23,629 spent on fees and slippage. |
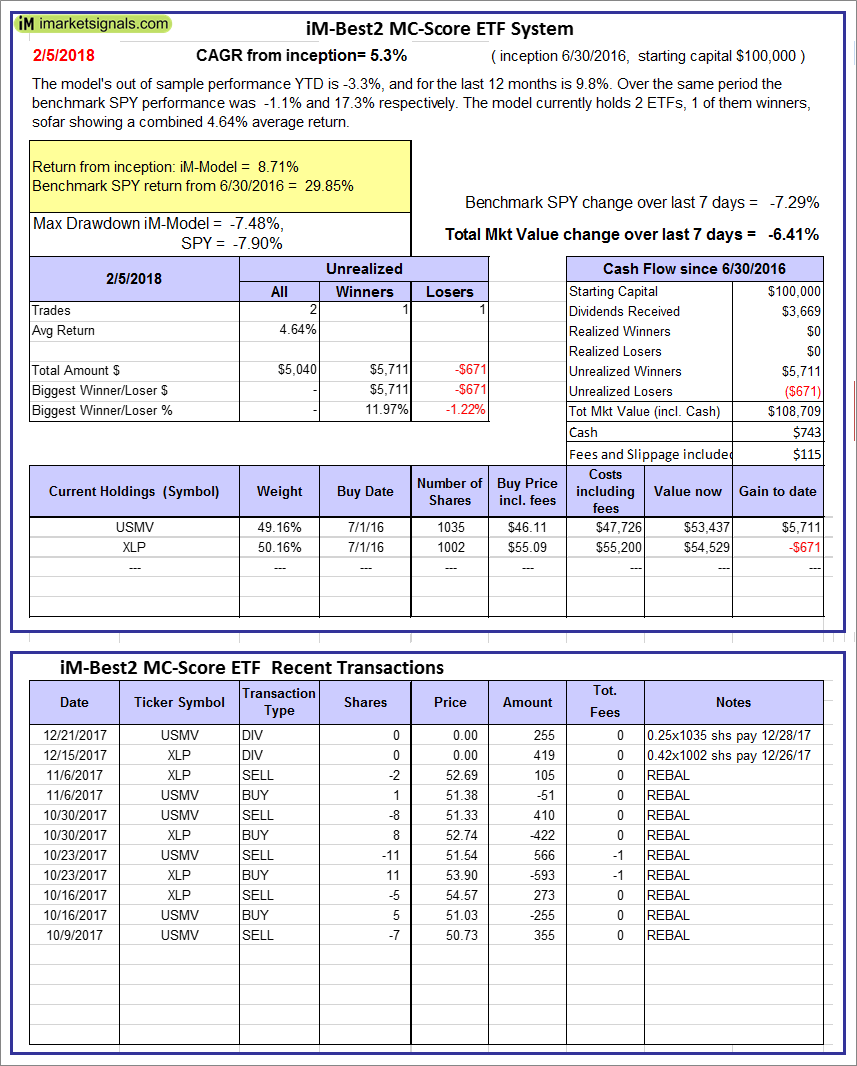 |
iM-Best2 MC-Score ETF System: The model’s out of sample performance YTD is -3.3%, and for the last 12 months is 9.8%. Over the same period the benchmark SPY performance was -1.1% and 17.3% respectively. Over the previous week the market value of the iM-Best2 MC-Score ETF System gained -6.41% at a time when SPY gained -7.29%. A starting capital of $100,000 at inception on 6/30/2016 would have grown to $108,709 which includes $743 cash and excludes $115 spent on fees and slippage. |
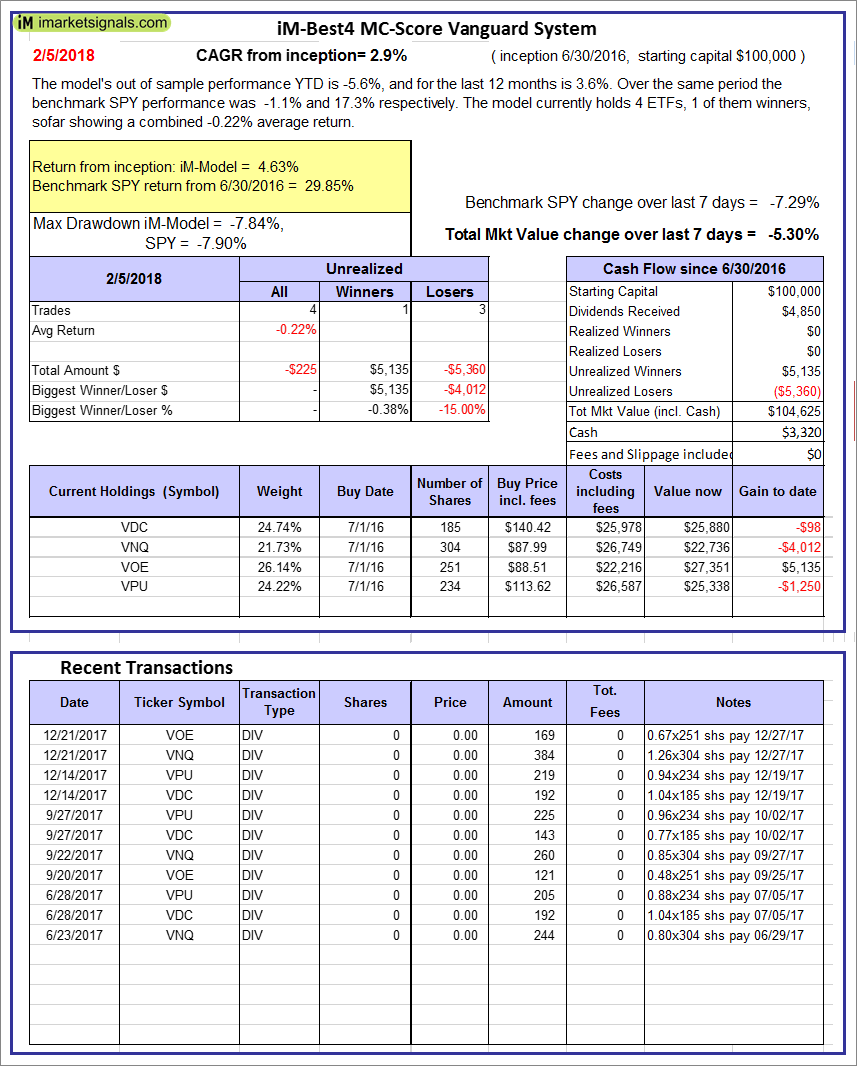 |
iM-Best4 MC-Score Vanguard System: The model’s out of sample performance YTD is -5.6%, and for the last 12 months is 3.6%. Over the same period the benchmark SPY performance was -1.1% and 17.3% respectively. Over the previous week the market value of the iM-Best4 MC-Score Vanguard System gained -5.30% at a time when SPY gained -7.29%. A starting capital of $100,000 at inception on 6/30/2016 would have grown to $104,625 which includes $3,320 cash and excludes $00 spent on fees and slippage. |
 |
iM-Composite (SH-RSP) Timer: The model’s out of sample performance YTD is -1.8%, and for the last 12 months is 13.2%. Over the same period the benchmark SPY performance was -1.1% and 17.3% respectively. Over the previous week the market value of the iM-Composite (SH-RSP) Timer gained -6.86% at a time when SPY gained -7.29%. A starting capital of $100,000 at inception on 6/30/2016 would have grown to $127,698 which includes $2,172 cash and excludes $513 spent on fees and slippage. |
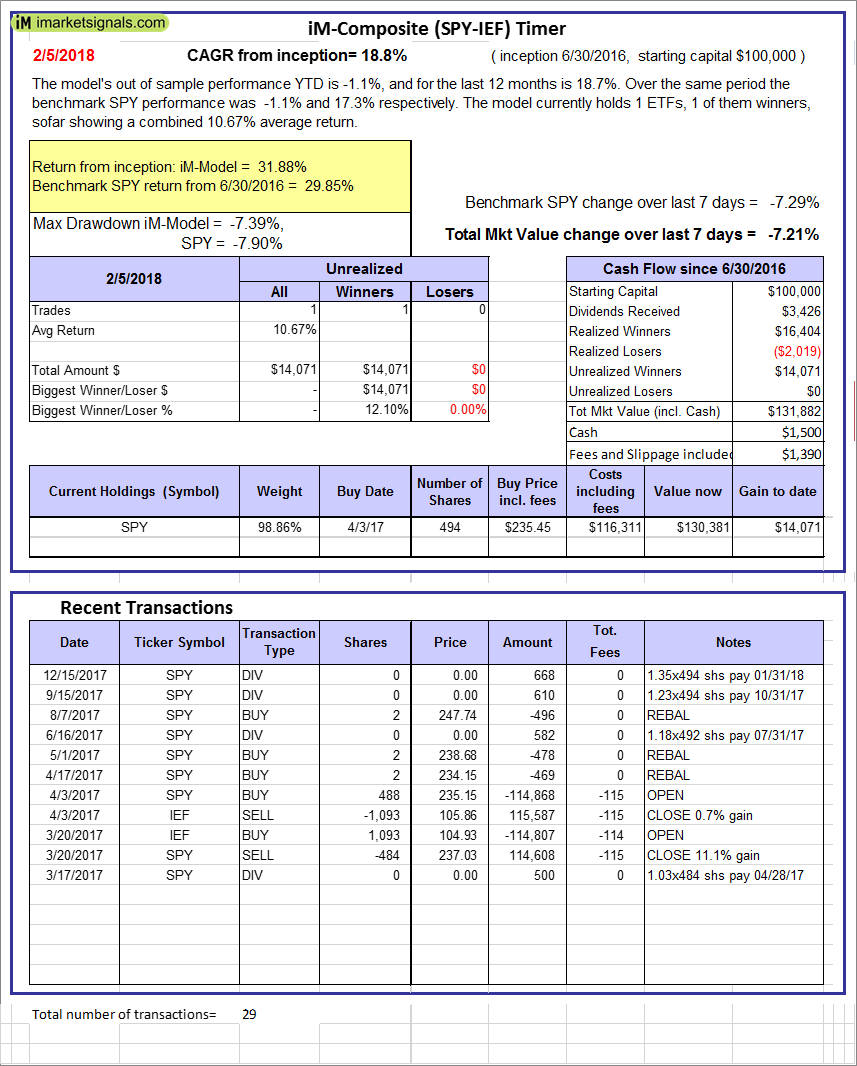 |
iM-Composite (SPY-IEF) Timer: The model’s out of sample performance YTD is -1.1%, and for the last 12 months is 18.7%. Over the same period the benchmark SPY performance was -1.1% and 17.3% respectively. Over the previous week the market value of the iM-Composite (SPY-IEF) Timer gained -7.21% at a time when SPY gained -7.29%. A starting capital of $100,000 at inception on 6/30/2016 would have grown to $131,882 which includes $1,500 cash and excludes $1,390 spent on fees and slippage. |
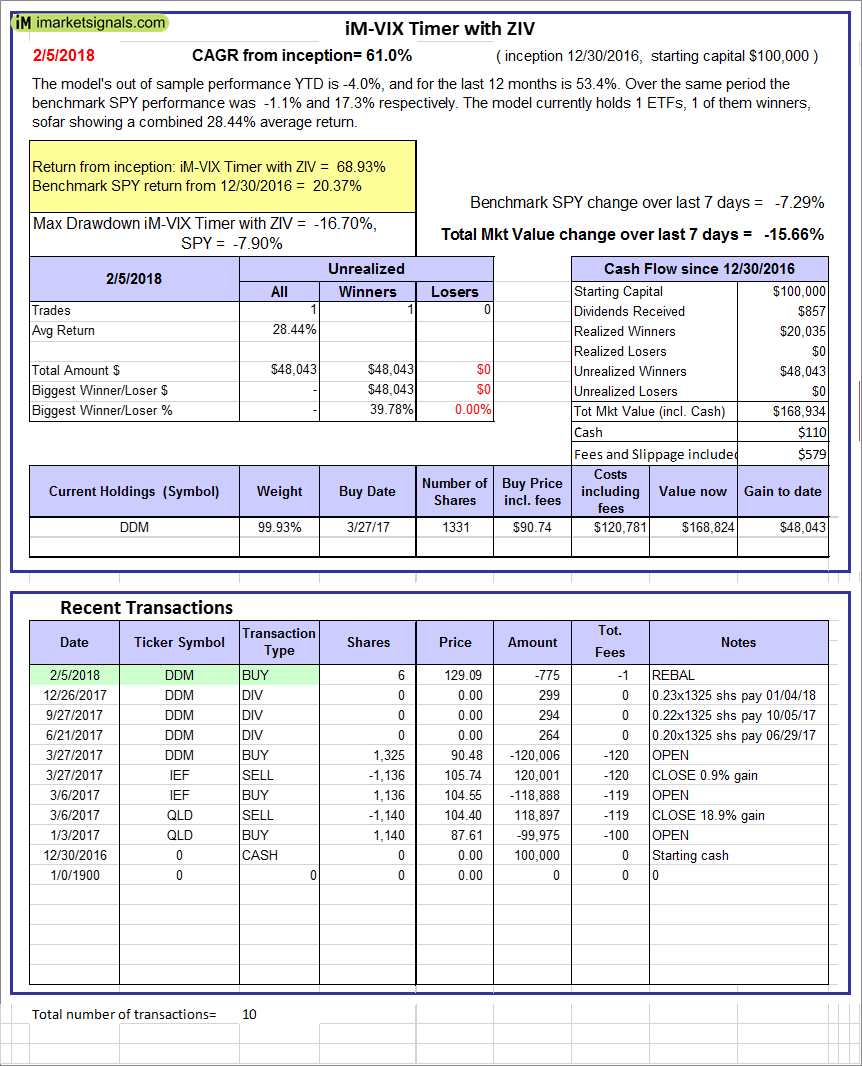 |
iM-VIX Timer with ZIV: The model’s out of sample performance YTD is -4.0%, and for the last 12 months is 53.4%. Over the same period the benchmark SPY performance was -1.1% and 17.3% respectively. Over the previous week the market value of the iM-VIX Timer with ZIV gained -15.66% at a time when SPY gained -7.29%. A starting capital of $100,000 at inception on 6/30/2016 would have grown to $168,934 which includes $110 cash and excludes $579 spent on fees and slippage. |
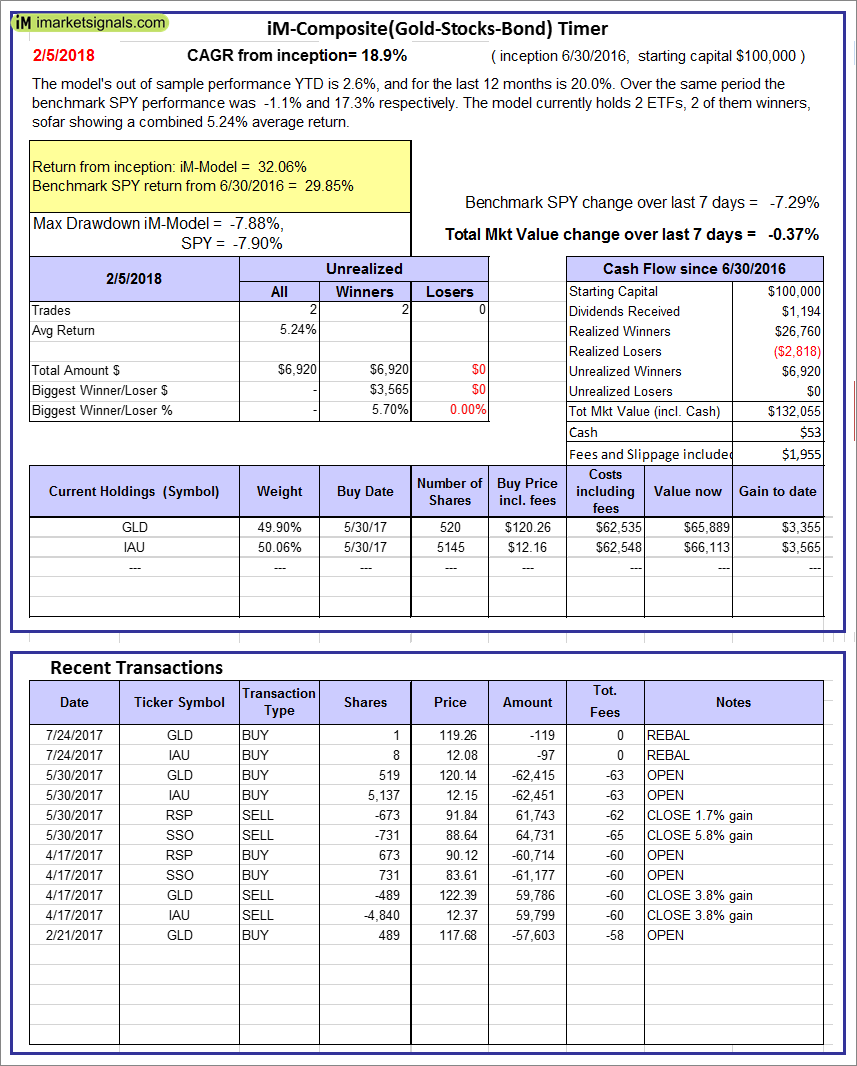 |
iM-Composite(Gold-Stocks-Bond) Timer: The model’s out of sample performance YTD is 2.6%, and for the last 12 months is 20.0%. Over the same period the benchmark SPY performance was -1.1% and 17.3% respectively. Over the previous week the market value of the iM-Composite(Gold-Stocks-Bond) Timer gained -0.37% at a time when SPY gained -7.29%. A starting capital of $100,000 at inception on 6/30/2016 would have grown to $132,055 which includes $53 cash and excludes $1,955 spent on fees and slippage. |
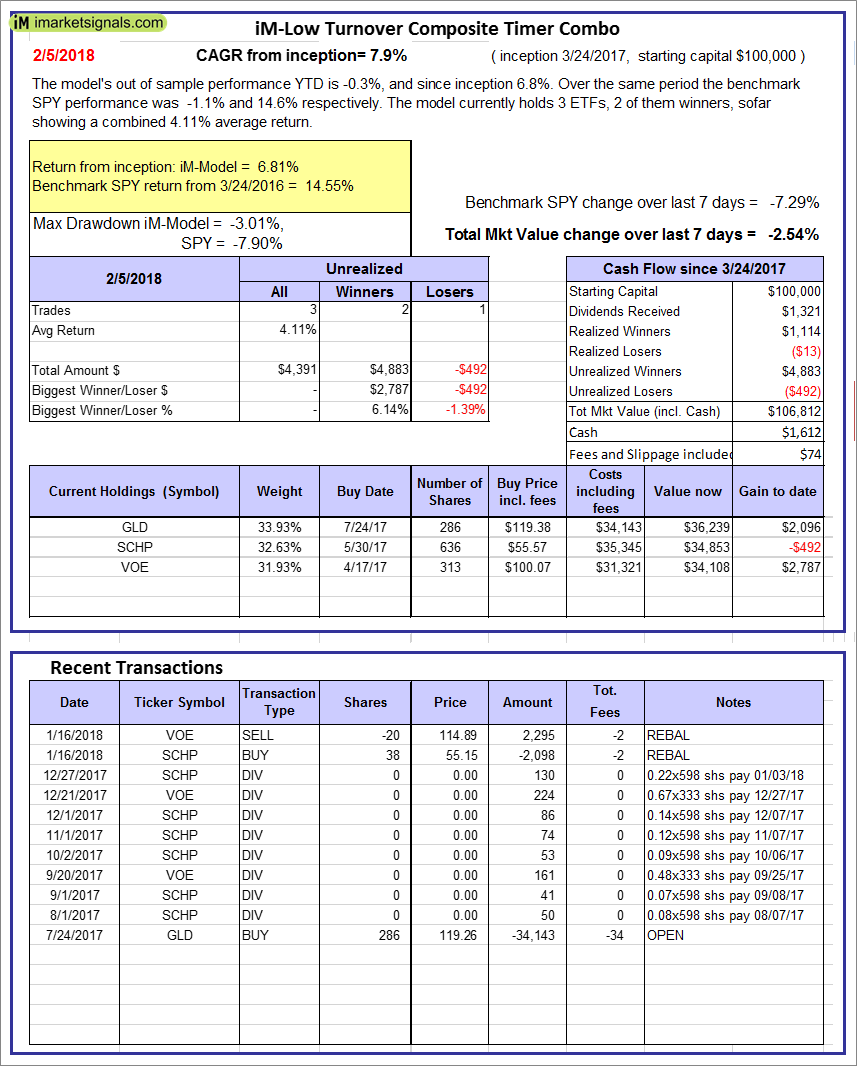 |
iM-Low Turnover Composite Timer Combo: The model’s out of sample performance YTD is -0.3%, and since inception 6.8%. Over the same period the benchmark SPY performance was -1.1% and 14.6% respectively. Over the previous week the market value of the iM-Low Turnover Composite Timer Combo gained -2.54% at a time when SPY gained -7.29%. A starting capital of $100,000 at inception on 3/24/27 would have grown to $106,812 which includes $1,612 cash and excludes $74 spent on fees and slippage. |
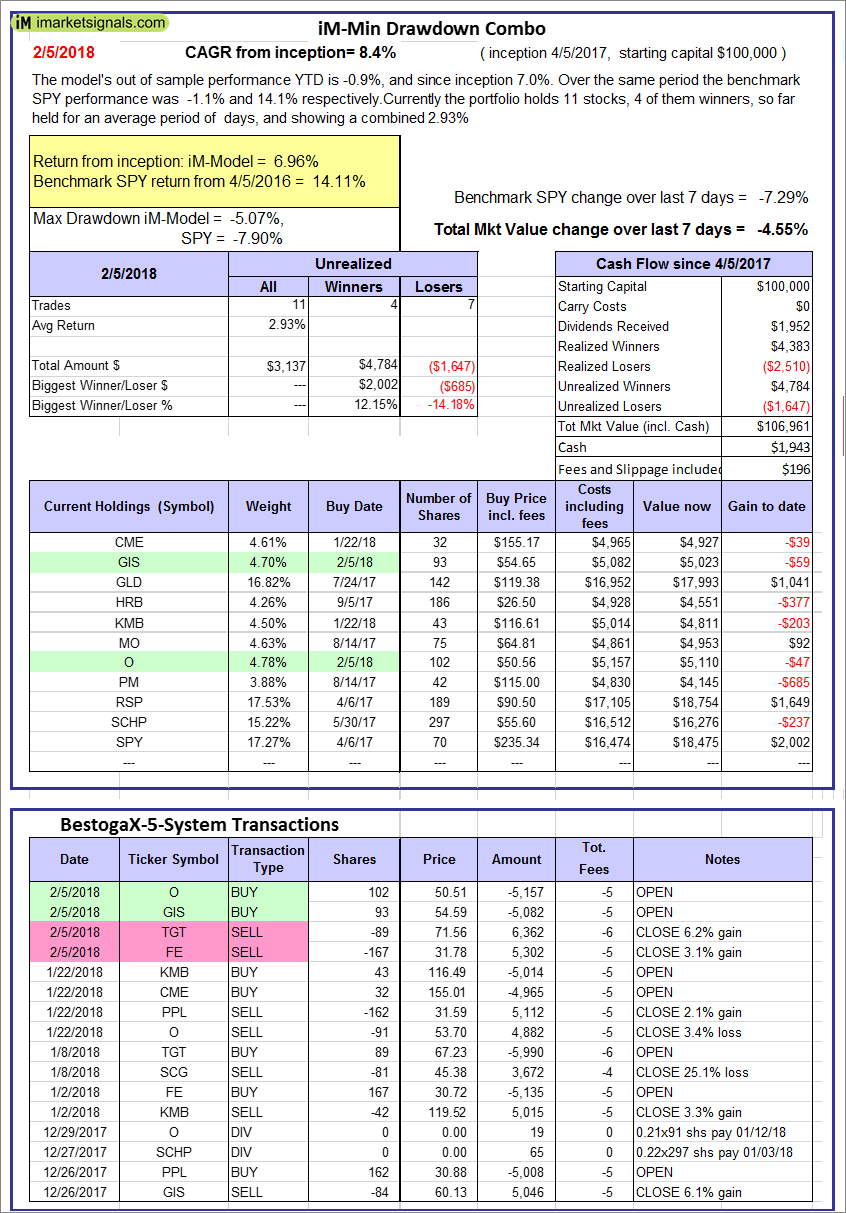 |
iM-Min Drawdown Combo: The model’s out of sample performance YTD is -0.9%, and since inception 7.0%. Over the same period the benchmark SPY performance was -1.1% and 14.1% respectively. Over the previous week the market value of the iM-Min Drawdown Combo gained -4.55% at a time when SPY gained -7.29%. A starting capital of $100,000 at inception on 4/5/2017 would have grown to $106,961 which includes $1,943 cash and excludes $196 spent on fees and slippage. |
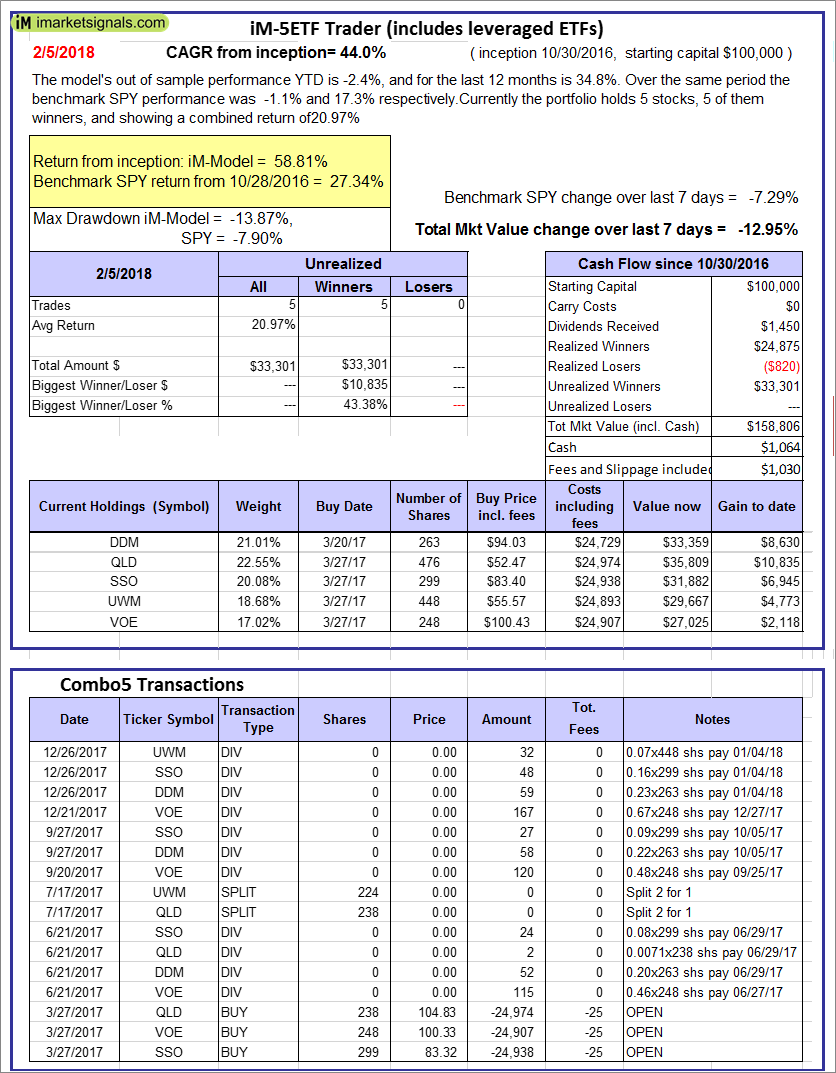 |
iM-5ETF Trader (includes leveraged ETFs): The model’s out of sample performance YTD is -2.4%, and for the last 12 months is 34.8%. Over the same period the benchmark SPY performance was -1.1% and 17.3% respectively. Over the previous week the market value of the iM-5ETF Trader (includes leveraged ETFs) gained -12.95% at a time when SPY gained -7.29%. A starting capital of $100,000 at inception on 10/30/2016 would have grown to $158,806 which includes $1,064 cash and excludes $1,030 spent on fees and slippage. |
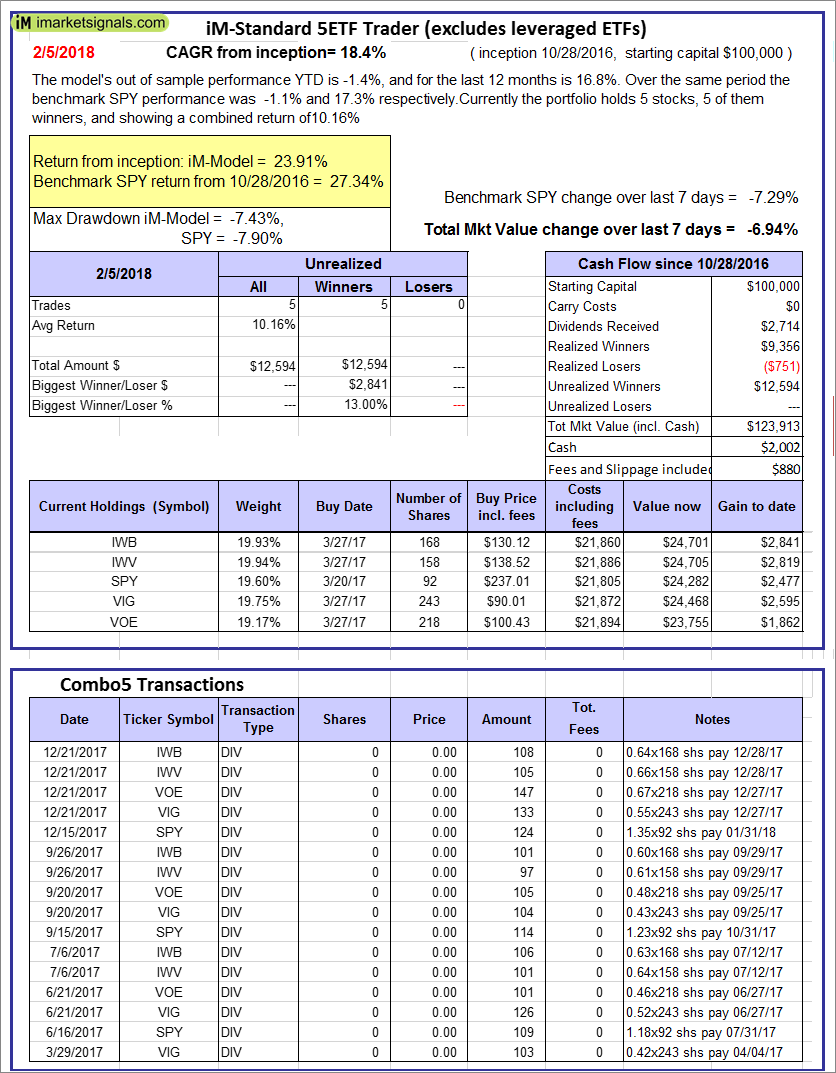 |
iM-Standard 5ETF Trader (excludes leveraged ETFs): The model’s out of sample performance YTD is -1.4%, and for the last 12 months is 16.8%. Over the same period the benchmark SPY performance was -1.1% and 17.3% respectively. Over the previous week the market value of the iM-Standard 5ETF Trader (excludes leveraged ETFs) gained -6.94% at a time when SPY gained -7.29%. A starting capital of $100,000 at inception on 10/30/2016 would have grown to $123,913 which includes $2,002 cash and excludes $880 spent on fees and slippage. |
iM-Best Reports – 2/5/2018
Posted in pmp SPY-SH
Leave a Reply
You must be logged in to post a comment.