
The Previous Updates
June 4, 2026
iM-Business Cycle Index
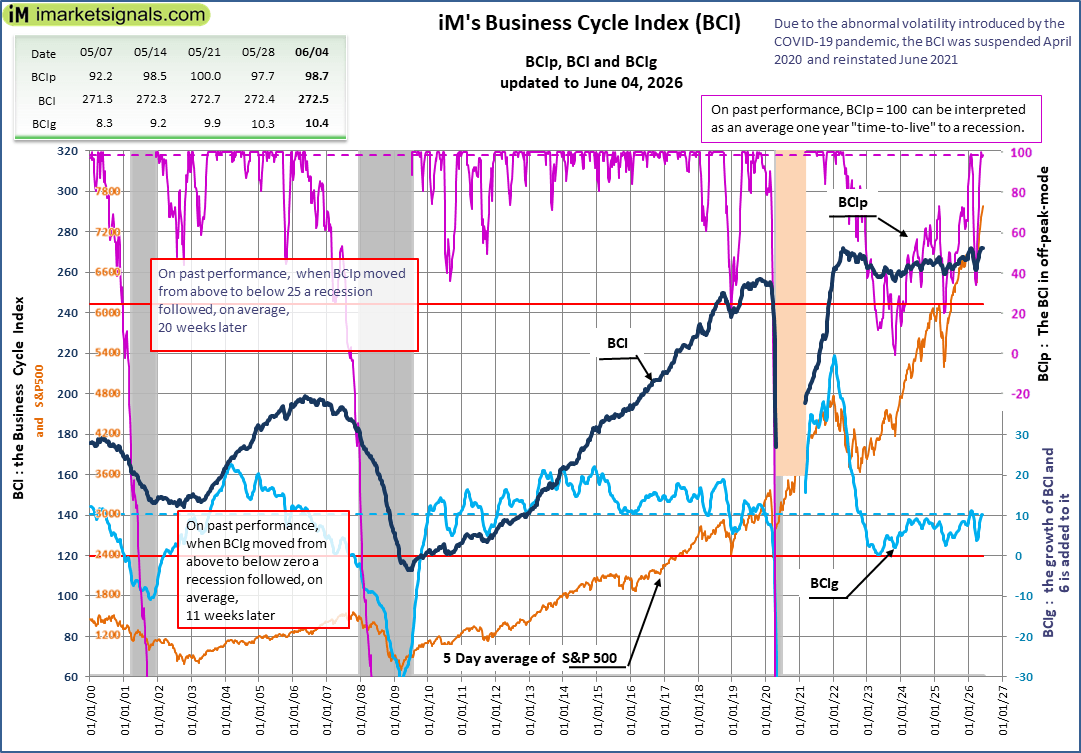
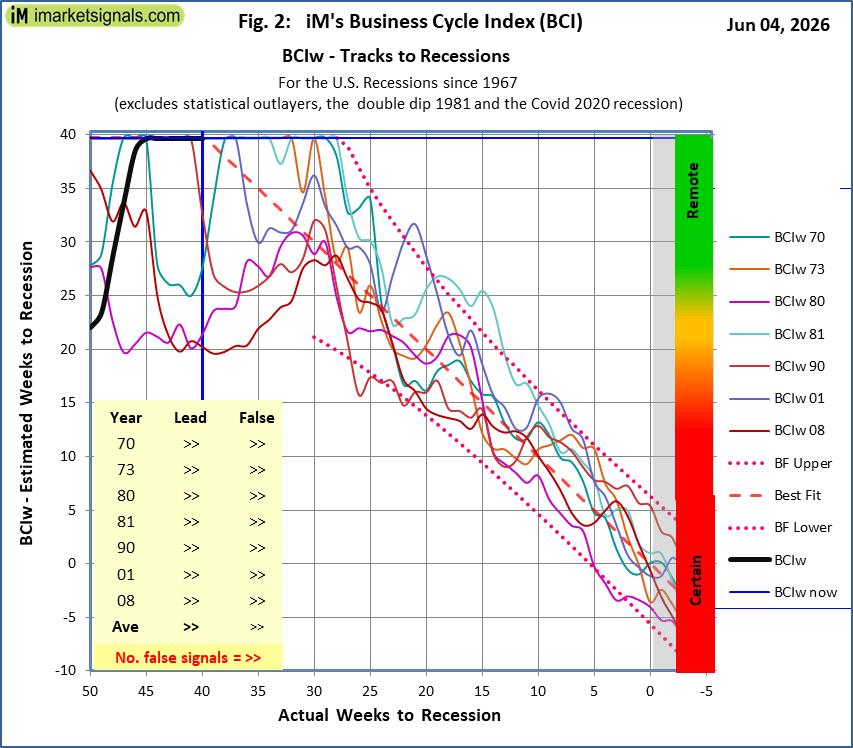 The BCI is not signalling a recession
May 7, 2026
iM-Business Cycle Index

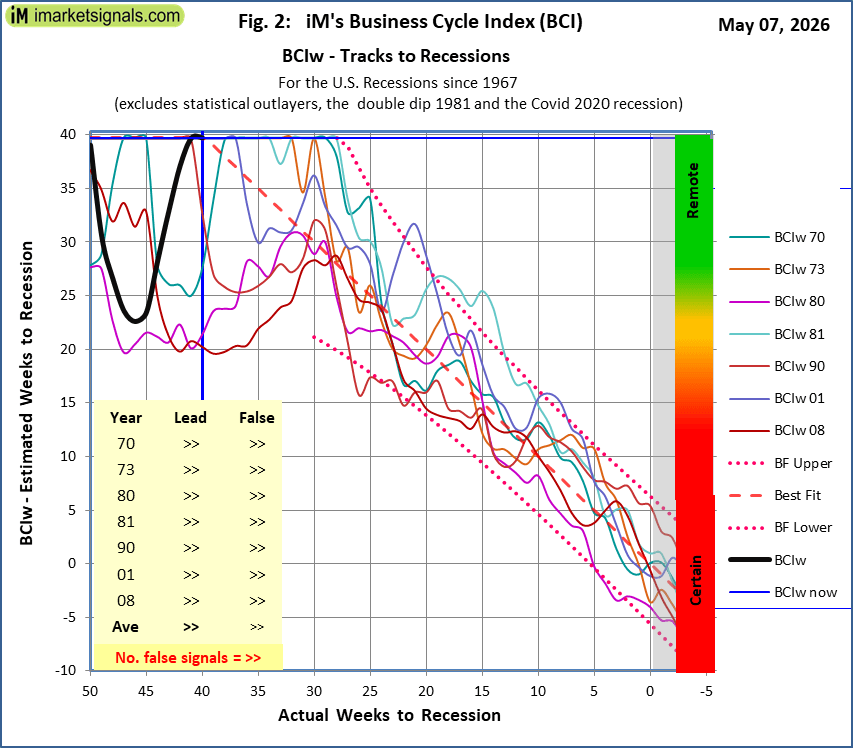 The BCI is not signalling a recession
June 5, 2026
Stock-markets:
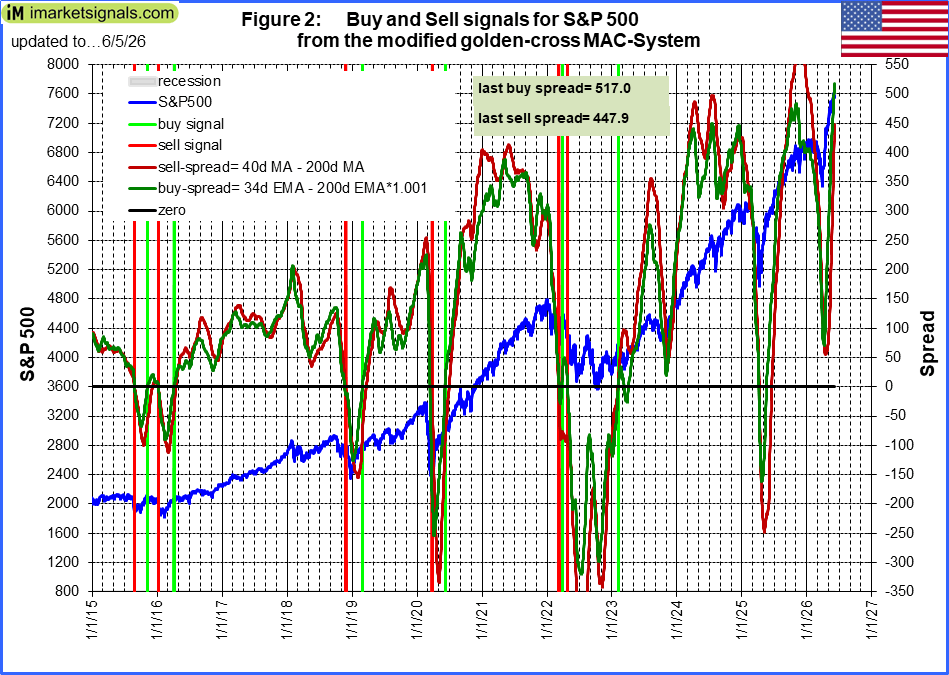 The MAC-US model is invested since mid June 2025,
.
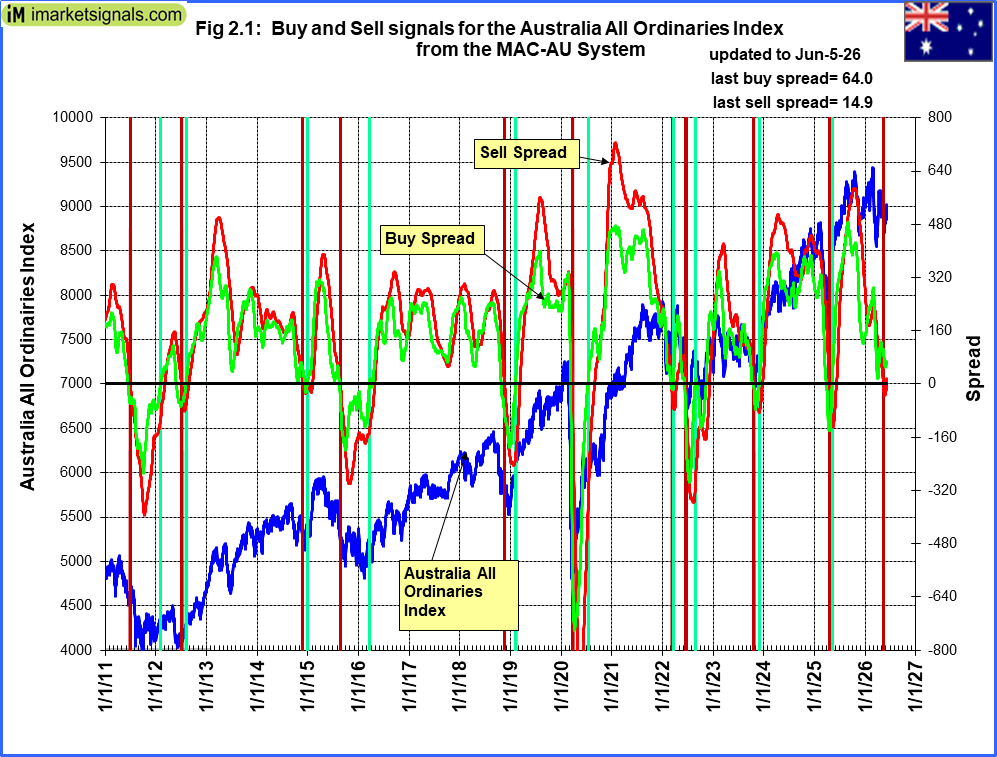 The MAC-AU model is dis-invested from the Australian stock market sine end April 2025.
This model and its application is described in MAC-Australia: A Moving Average Crossover System for Superannuation Asset Allocations.
Recession:
 BCIg is not signaling a recession.
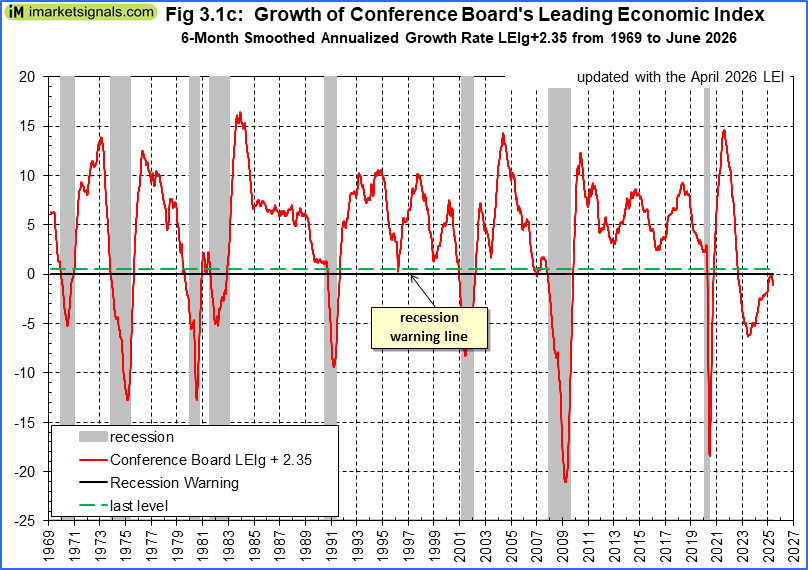 The growth of the Conference Board’s Leading Economic Indicator does not signal a recession, yet
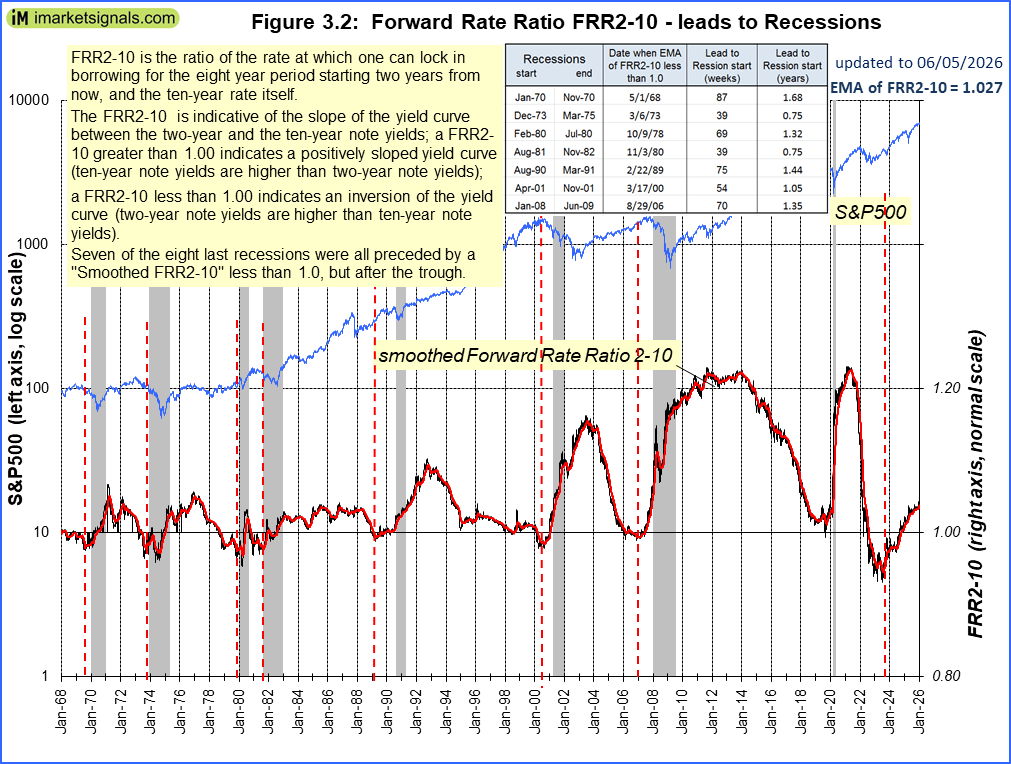 The Forward Rate Ratio between the 2-year and 10-year U.S. Treasury yields (FRR2-10) is no longer inverted and the curve is steepening.
A description of this indicator can be found here.
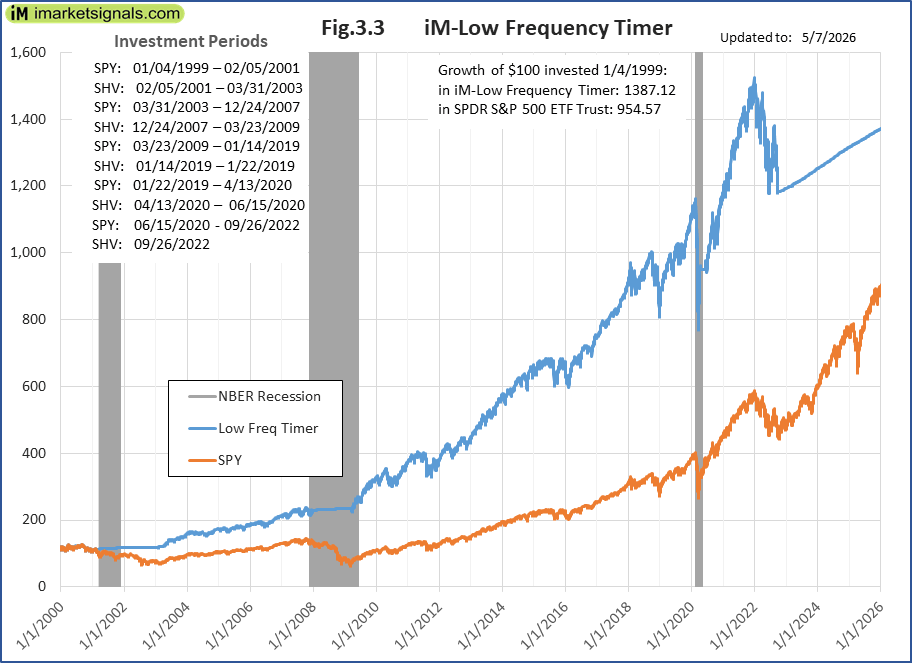
 The iM-Low Frequency Timer switched to bonds on 9/26/2022.
A description of this indicator can be found here.
May 8, 2026
Market Signals Summary:
The iM-Google Trend, the MAC-US, S&P 500 Coppock Indicator, CAPE-Cycle-ID are invested in the stock markets, whereas the the 3-Month Hi-Lo Index Index is dis-invested. The BCIg does not signal a recession as does the growth of the Conference Board’s Leading Economic Indicator. The Forward Rate Ratio between the 2 and 10 is no longer inverted and the curve is flattening The iM-Gold Timer and iM-Gold Coppock are invested in gold, whereas the iM-Silver Coppock is in cash.
Stock-markets:
 The MAC-US model is invested since mid June 2025,
.
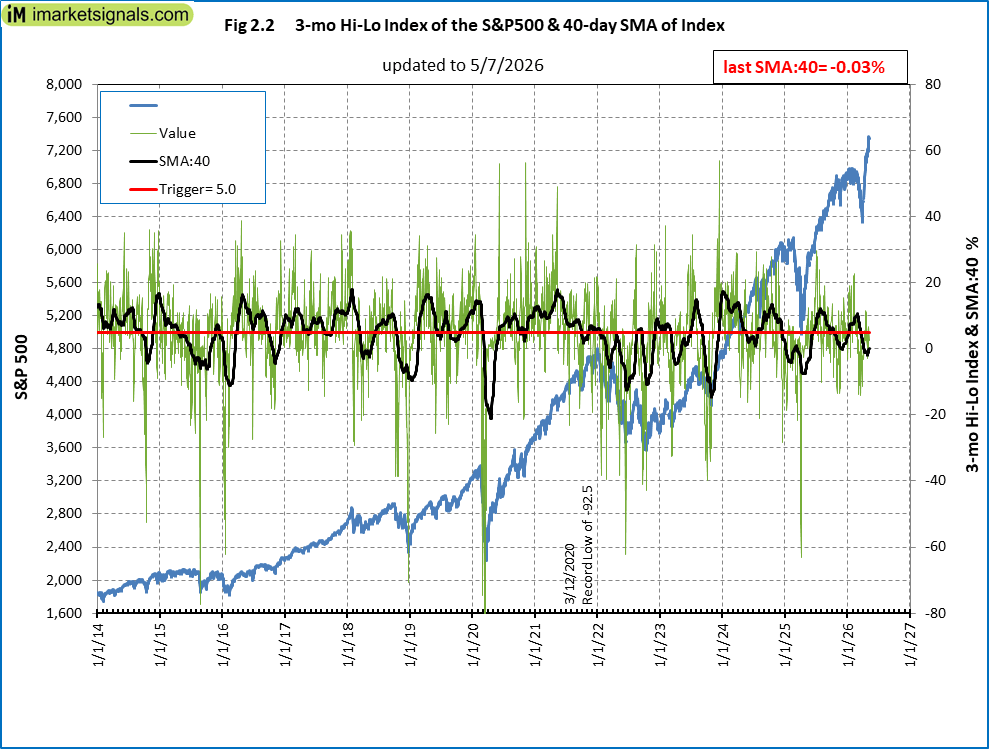 The 3-mo Hi-Lo Index Index of the S&P500 is at -0.03% (last week -1.12%) and is dis-invested from the markets.
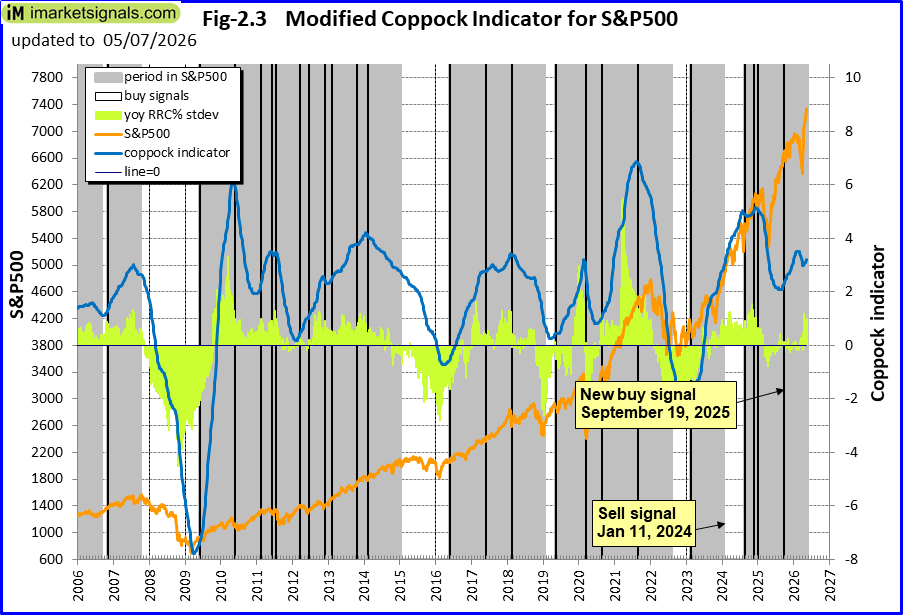 The Coppock indicator for the S&P500 invested the the US stock markets mid August 2024. This indicator is described here.
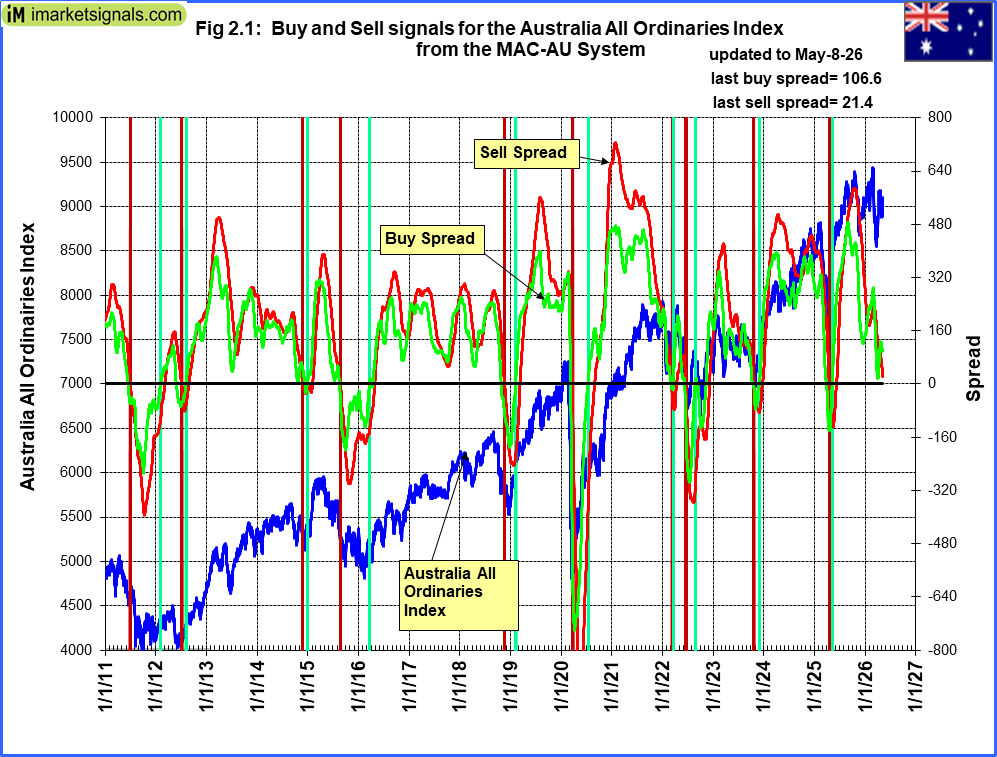 The MAC-AU model is dis-invested from the Australian stock market sine end April 2025.
This model and its application is described in MAC-Australia: A Moving Average Crossover System for Superannuation Asset Allocations.
Recession:
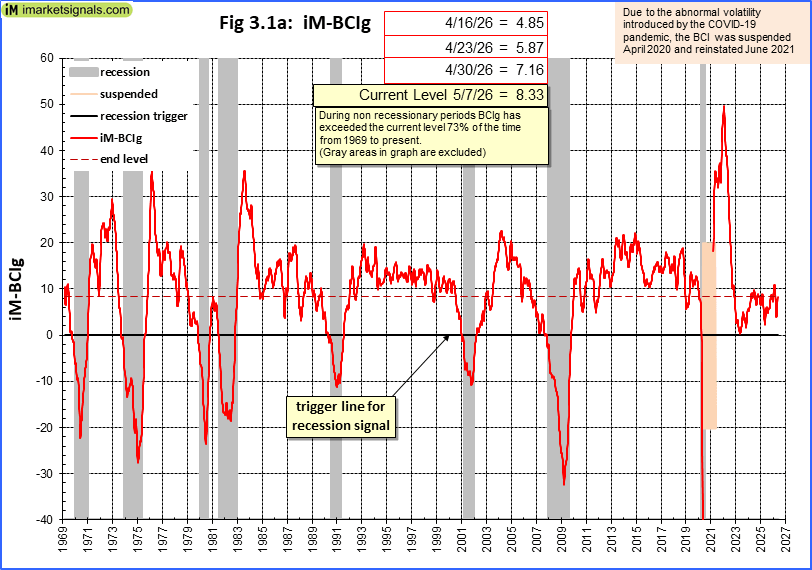 BCIg is not signaling a recession.
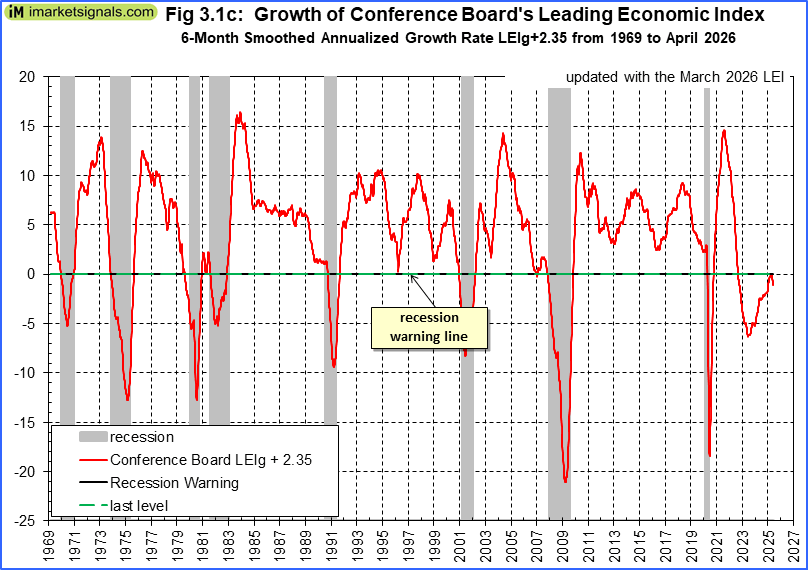 The growth of the Conference Board’s Leading Economic Indicator does not signal a recession, yet
 The Forward Rate Ratio between the 2-year and 10-year U.S. Treasury yields (FRR2-10) is no longer inverted and the curve is steepening.
A description of this indicator can be found here.
 The iM-Low Frequency Timer switched to bonds on 9/26/2022.
A description of this indicator can be found here.
Monthly Updates
May 8, 2026
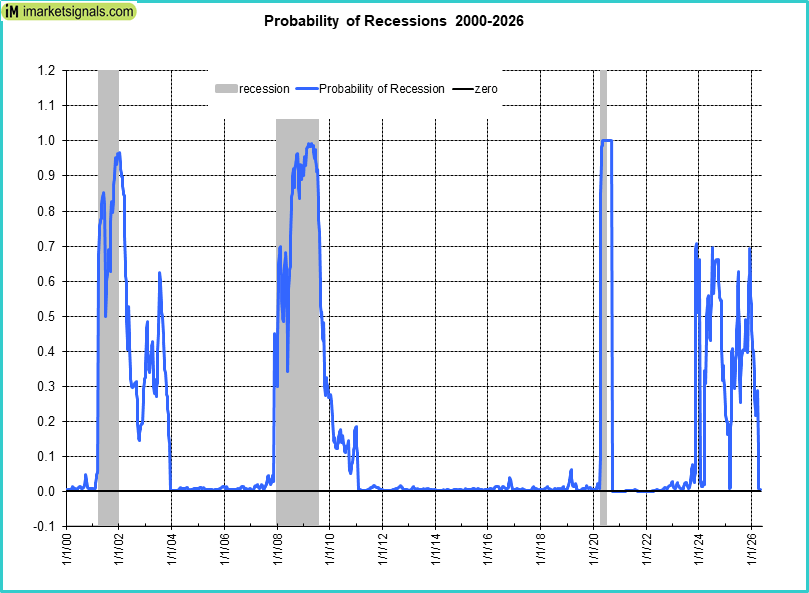
Unemployment
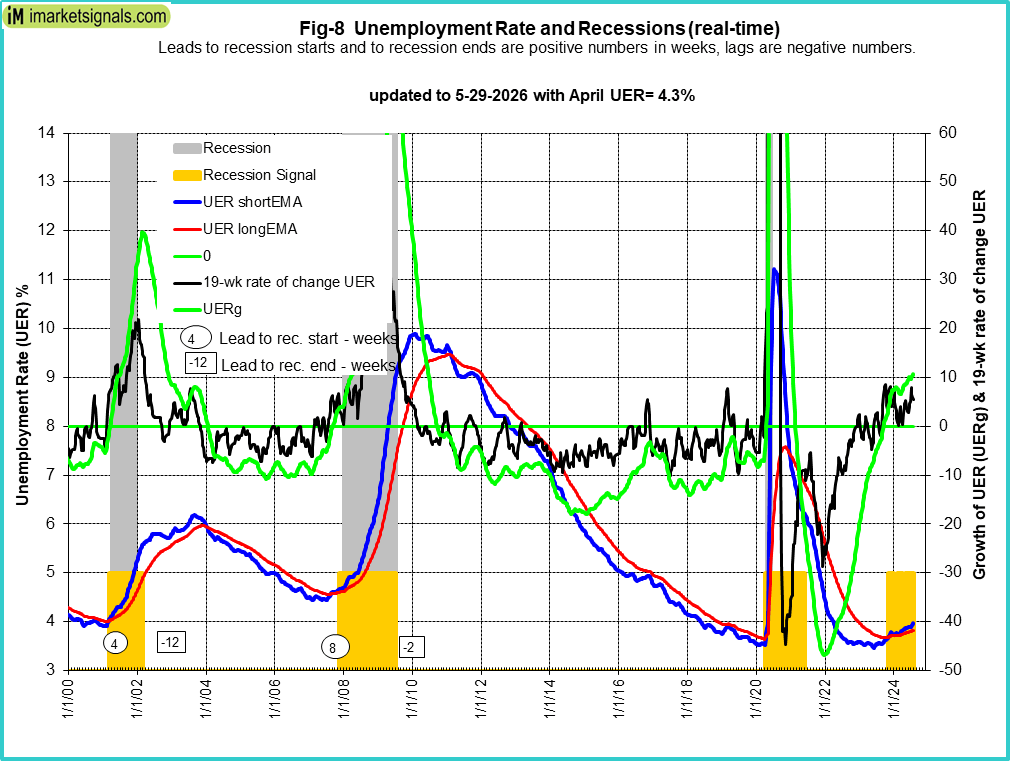

The 5/8/2026 BLS Employment Situation Report reports that the April 2026 unemployment rate remained unchanged at 4.3%.
Our UER model does signal a recession with a near zero recession probability of (see graph).
CAPE-Cycle-ID
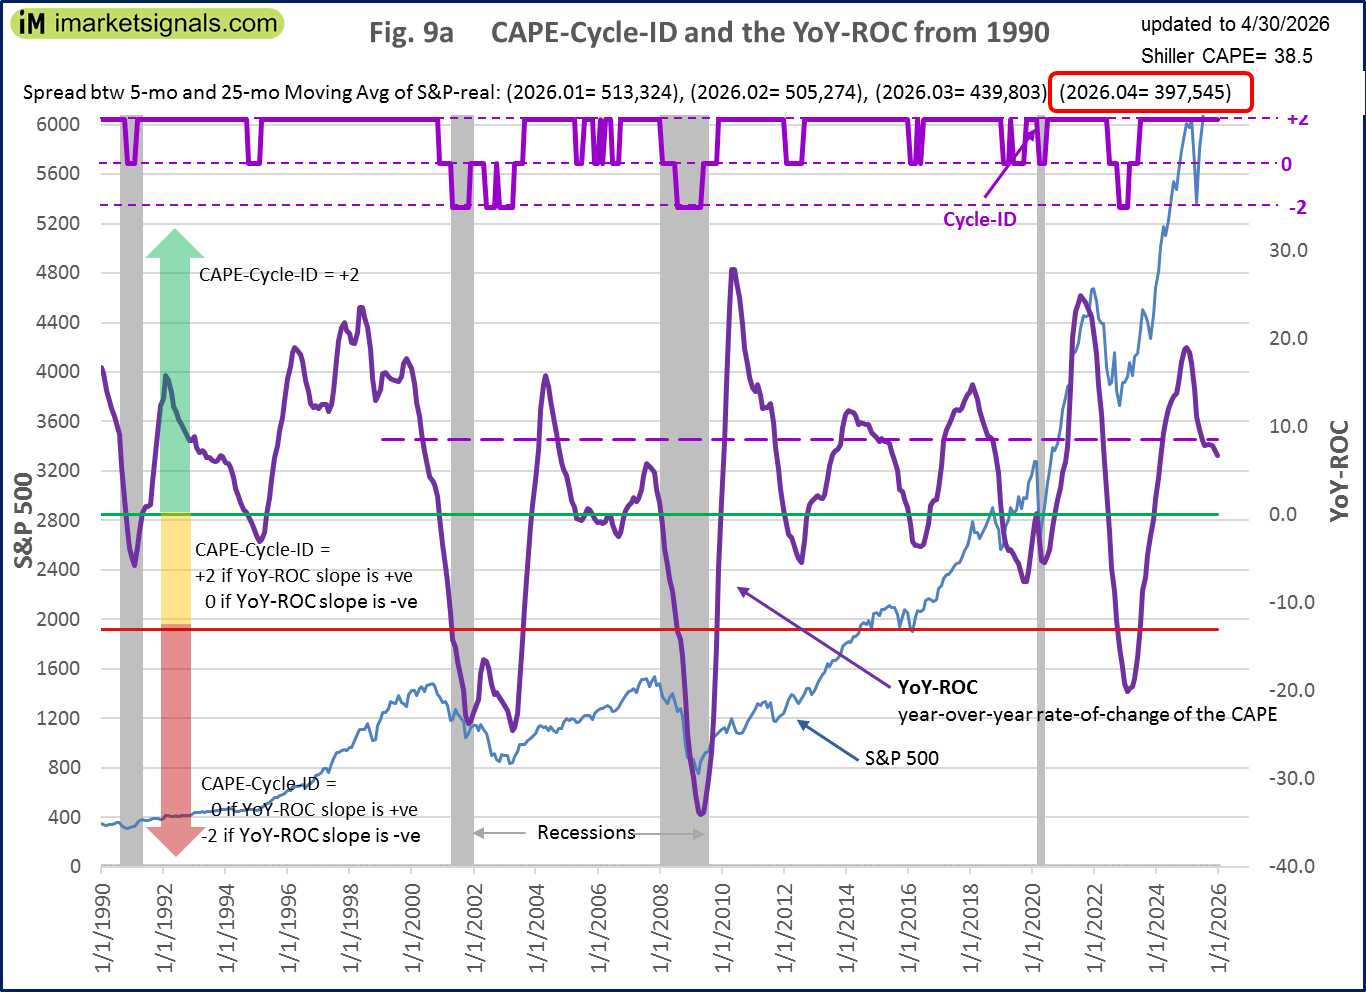 Fig 9a depicts the CAPE-Cycle-ID and the year-on-year rate-of-change of the Shiller CAPE; the level switched from -2 to 0 end of June 2023 generating a buy signal. This indicator now invested in the markets. This indicator is described here.
To avoid the bear market, exit stocks when the spread between the 5-month and 25-month moving averages of S&P-real becomes negative and simultaneously the CAPE-Cycle-ID score is 0 or -2. (read more)
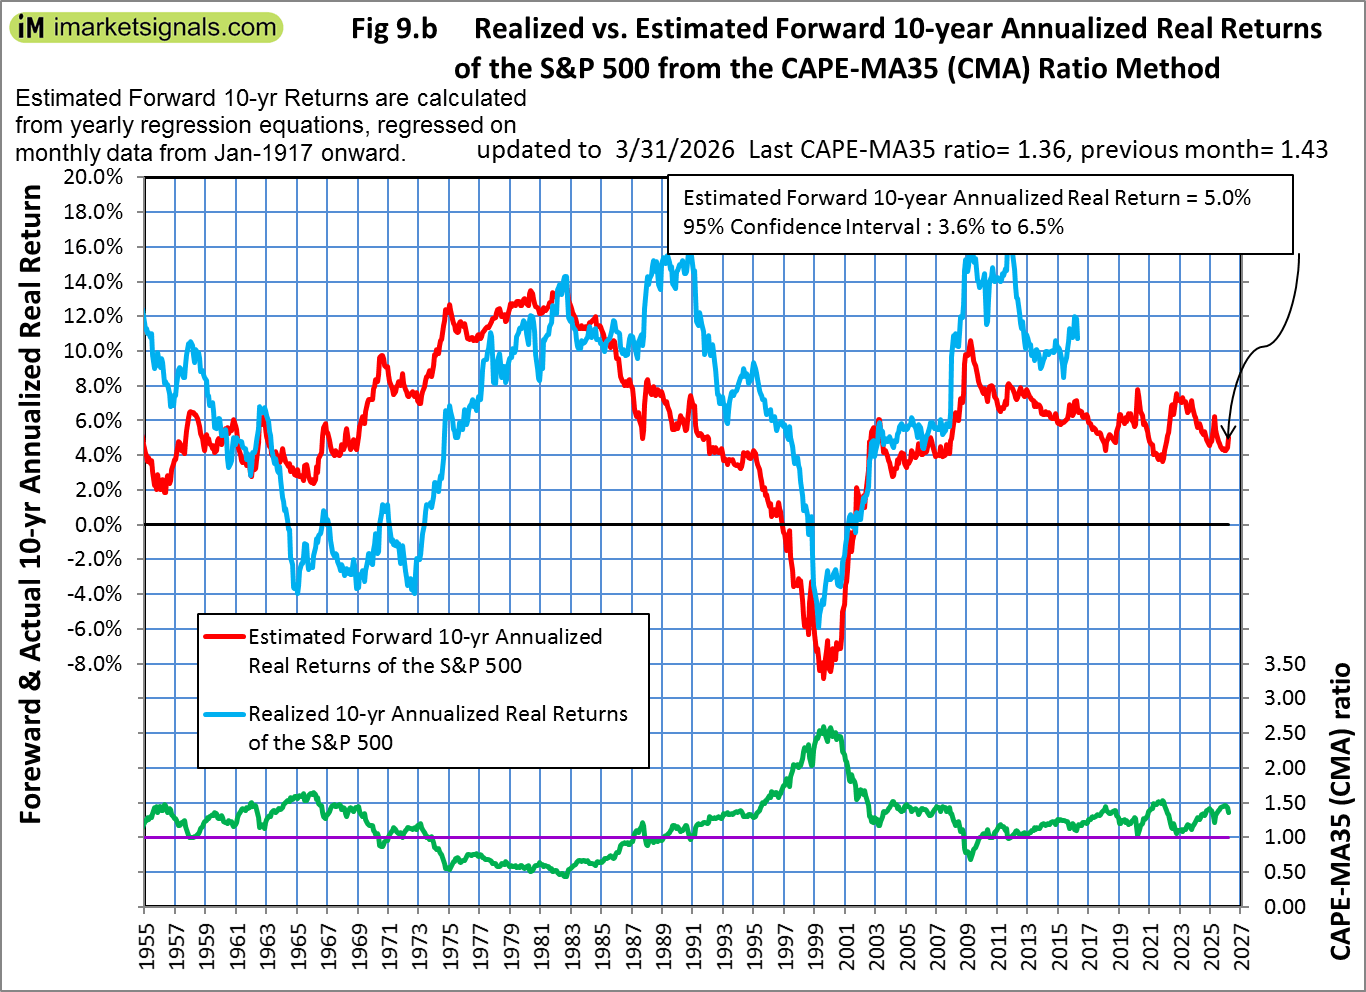
Estimated Forward 10-Year Returns
 The estimated forward 10‐year annualized real return is 4.7% (previous month 5.0%) with a 95% confidence interval 3.3% to 6.2% (3.6% to 6.5%). Also refer to the Realized Forward 10-Year Returns vs. Inflation Rate
 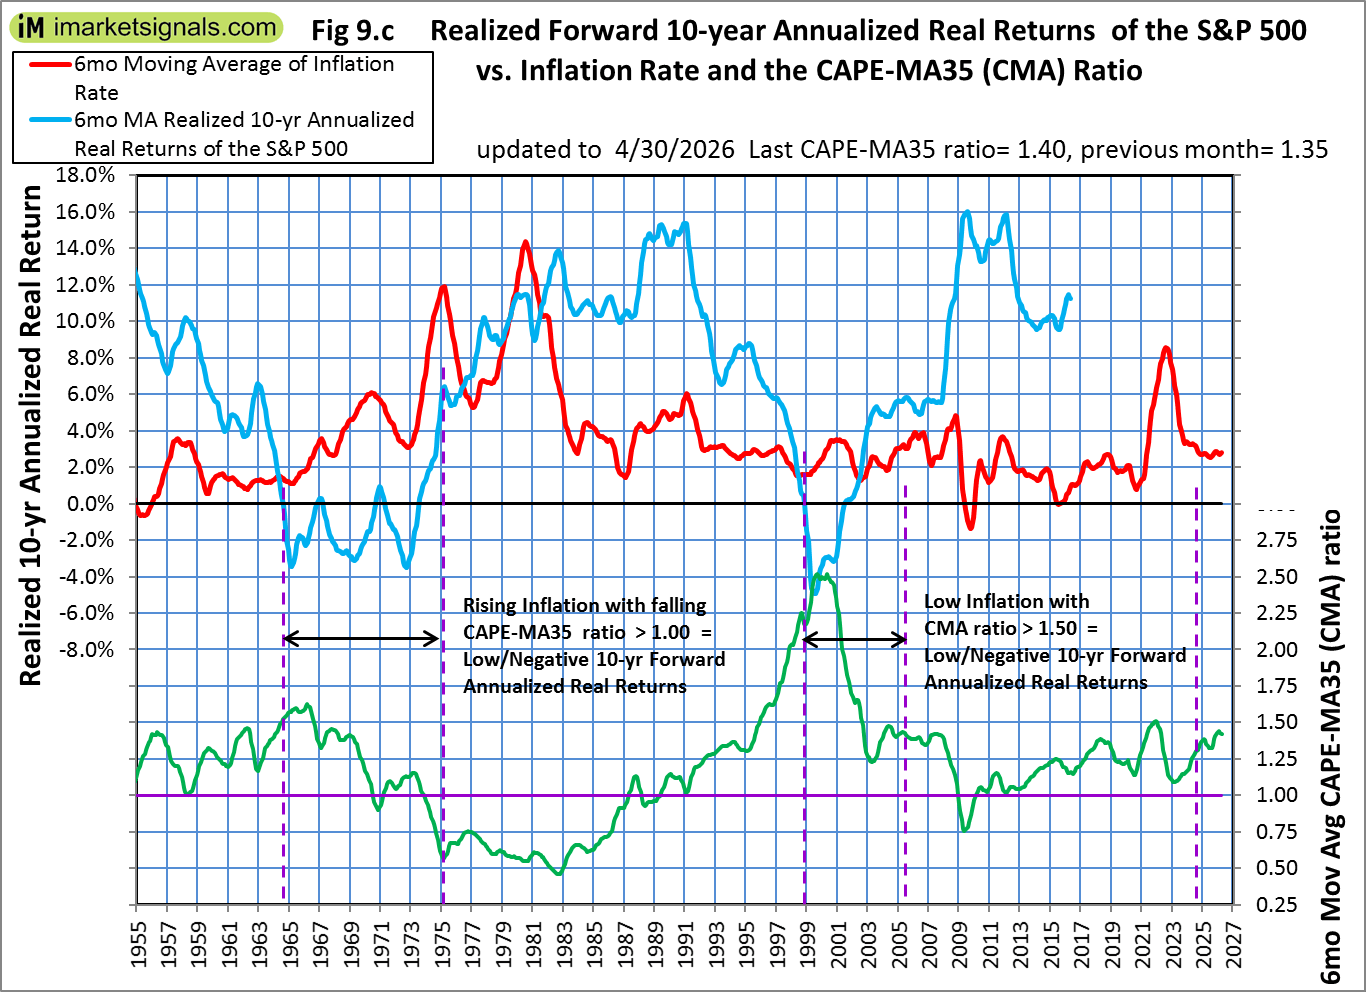 We may be in a rising inflation period with a falling CAPE-MA35 ratio similar to 1964-1973. This implies very low or negative 10 year forward annualized real returns, much lower than the returns indicated by regression analysis shown in the Estimated Forward 10-Year Returns.
.
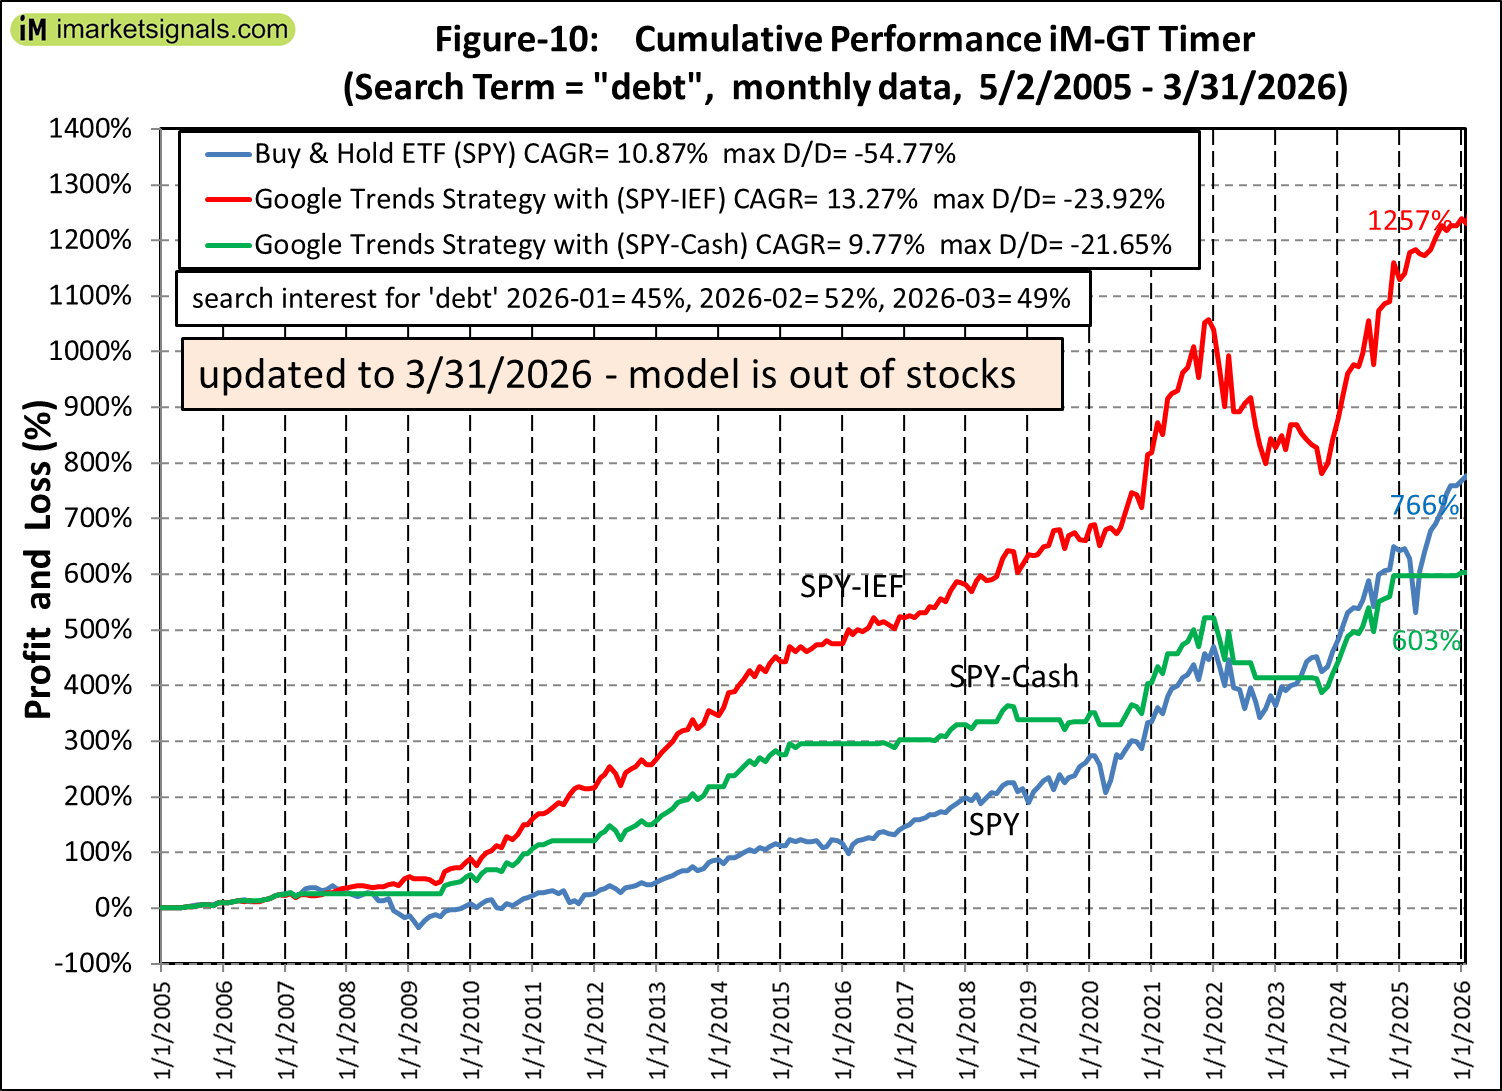
iM-GT Timer
 The iM-GT Timer, based on Google Search Trends volume indicator is not invested in the stock markets since beginning November 2025. This indicator is described here.
Trade Weighted USD
 Will be updated later, the weekly FRED data series we used was discontinued and replacement series is daily and runs from 2015. We need to adapt our software and graphics first.
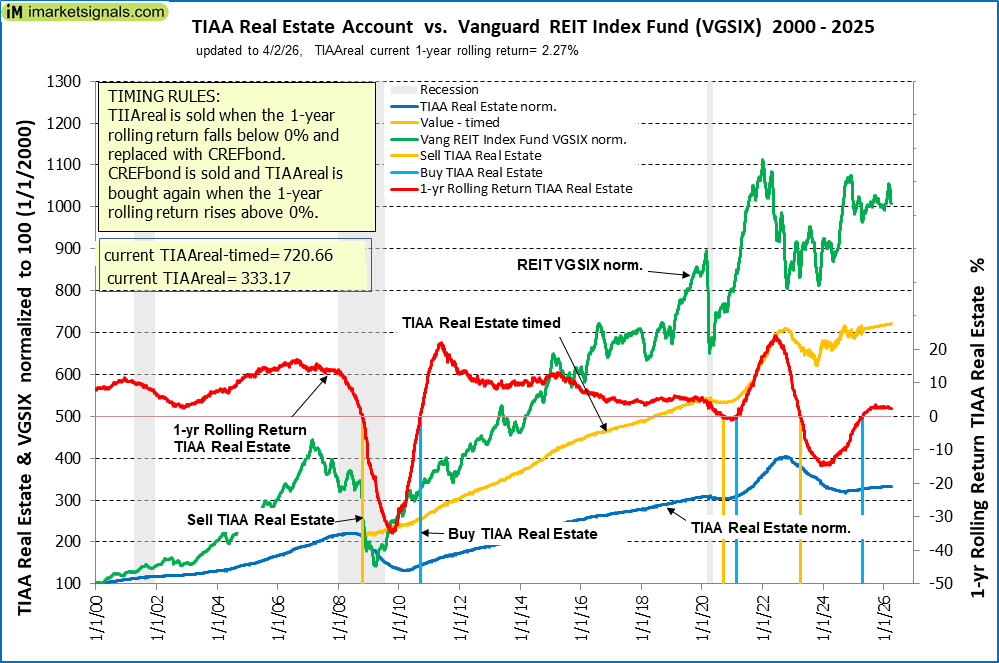
TIAA Real Estate Account
 The 1-year rolling return is =1.88% (previous month 2.26%) and is invested in the TIAA Real Estate Account since beginning May 2025.
April 3, 2026
Unemployment

The 3/6/2025 BLS Employment Situation Report reports that the February 2026 unemployment rate decreased by 0.1% to 4.3%.
Our UER model does signal a recession with a near zero recession probability of (see graph).
CAPE-Cycle-ID
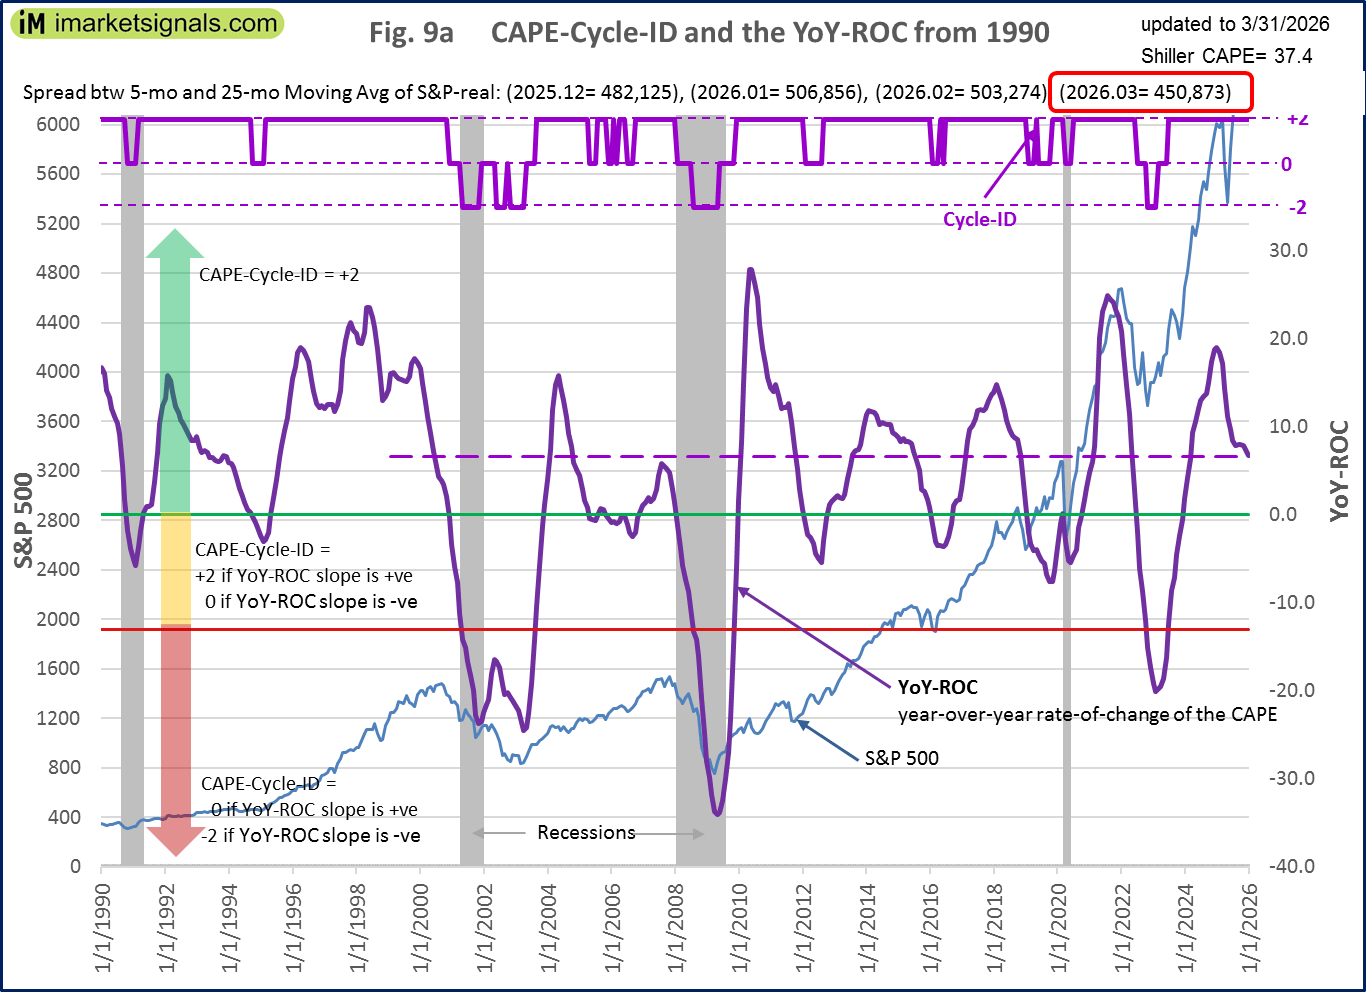 Fig 9a depicts the CAPE-Cycle-ID and the year-on-year rate-of-change of the Shiller CAPE; the level switched from -2 to 0 end of June 2023 generating a buy signal. This indicator now invested in the markets. This indicator is described here.
To avoid the bear market, exit stocks when the spread between the 5-month and 25-month moving averages of S&P-real becomes negative and simultaneously the CAPE-Cycle-ID score is 0 or -2. (read more)
Estimated Forward 10-Year Returns
 The estimated forward 10‐year annualized real return is 5.0% (previous month 4.5%) with a 95% confidence interval 3.6% to 6.5% (3.0% to 5.9%). Also refer to the Realized Forward 10-Year Returns vs. Inflation Rate
 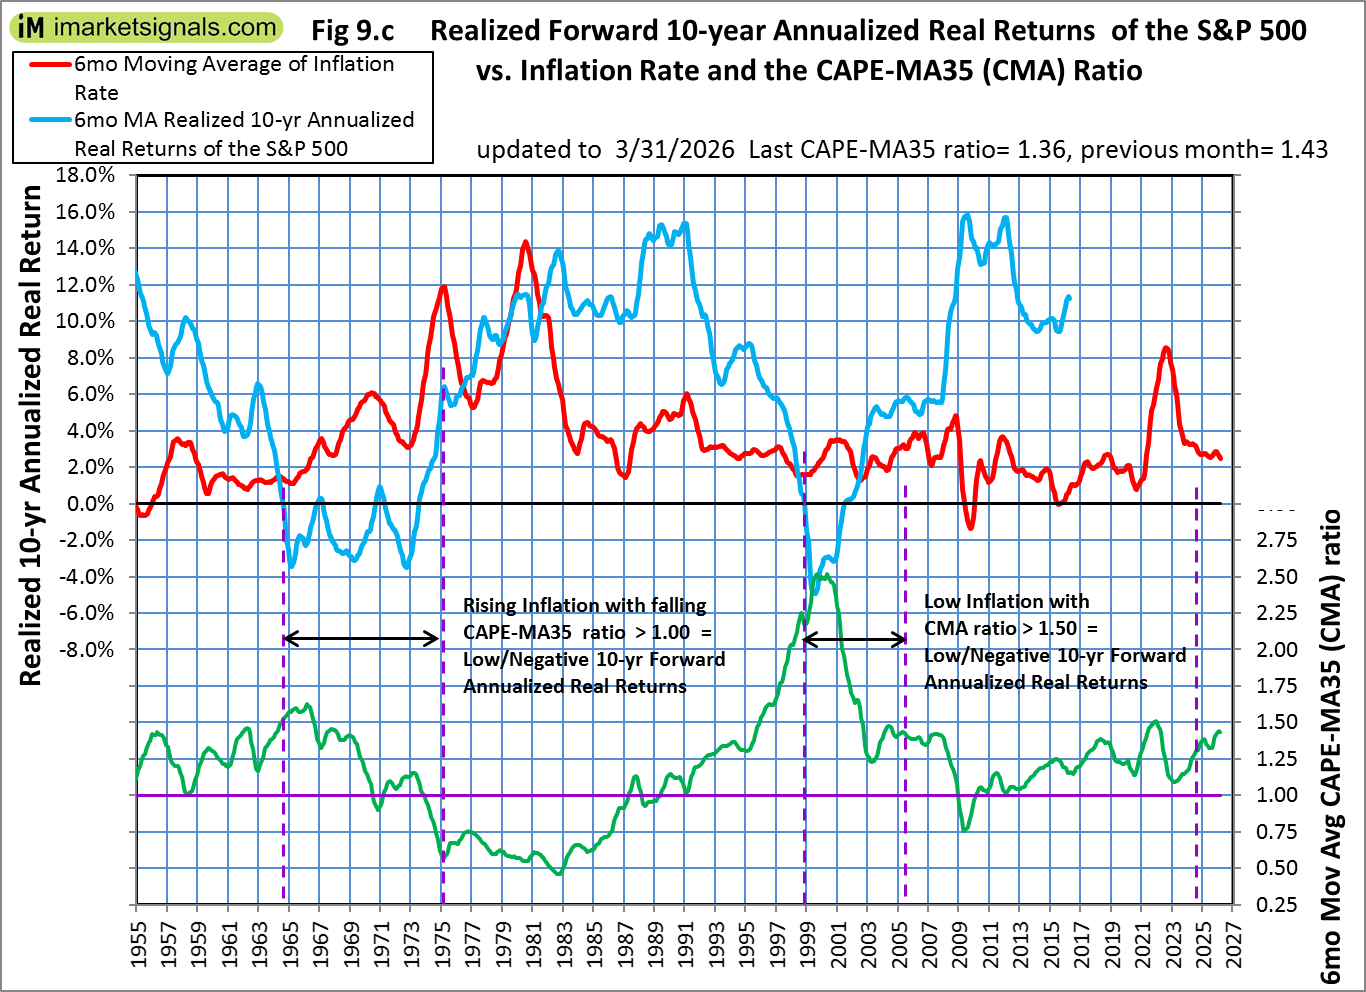 We may be in a rising inflation period with a falling CAPE-MA35 ratio similar to 1964-1973. This implies very low or negative 10 year forward annualized real returns, much lower than the returns indicated by regression analysis shown in the Estimated Forward 10-Year Returns.
.
iM-GT Timer
 The iM-GT Timer, based on Google Search Trends volume indicator is not invested in the stock markets since beginning November 2025. This indicator is described here.
Trade Weighted USD
 Will be updated later, the weekly FRED data series we used was discontinued and replacement series is daily and runs from 2015. We need to adapt our software and graphics first.
TIAA Real Estate Account
 The 1-year rolling return is =2.26% (previous month 2.34%) and is invested in the TIAA Real Estate Account since beginning May 2025.