
- The ModSum/YieldCurve Timer seeks to find optimum investment periods for equities. It uses two market timing algorithms: The ModSum Timer (weighted sum of five market timers), and the YieldCurve Timer.
- The ModSum Timer switches between SPY and IEF, and the YieldCurve Timer adds a hedge with GLD.
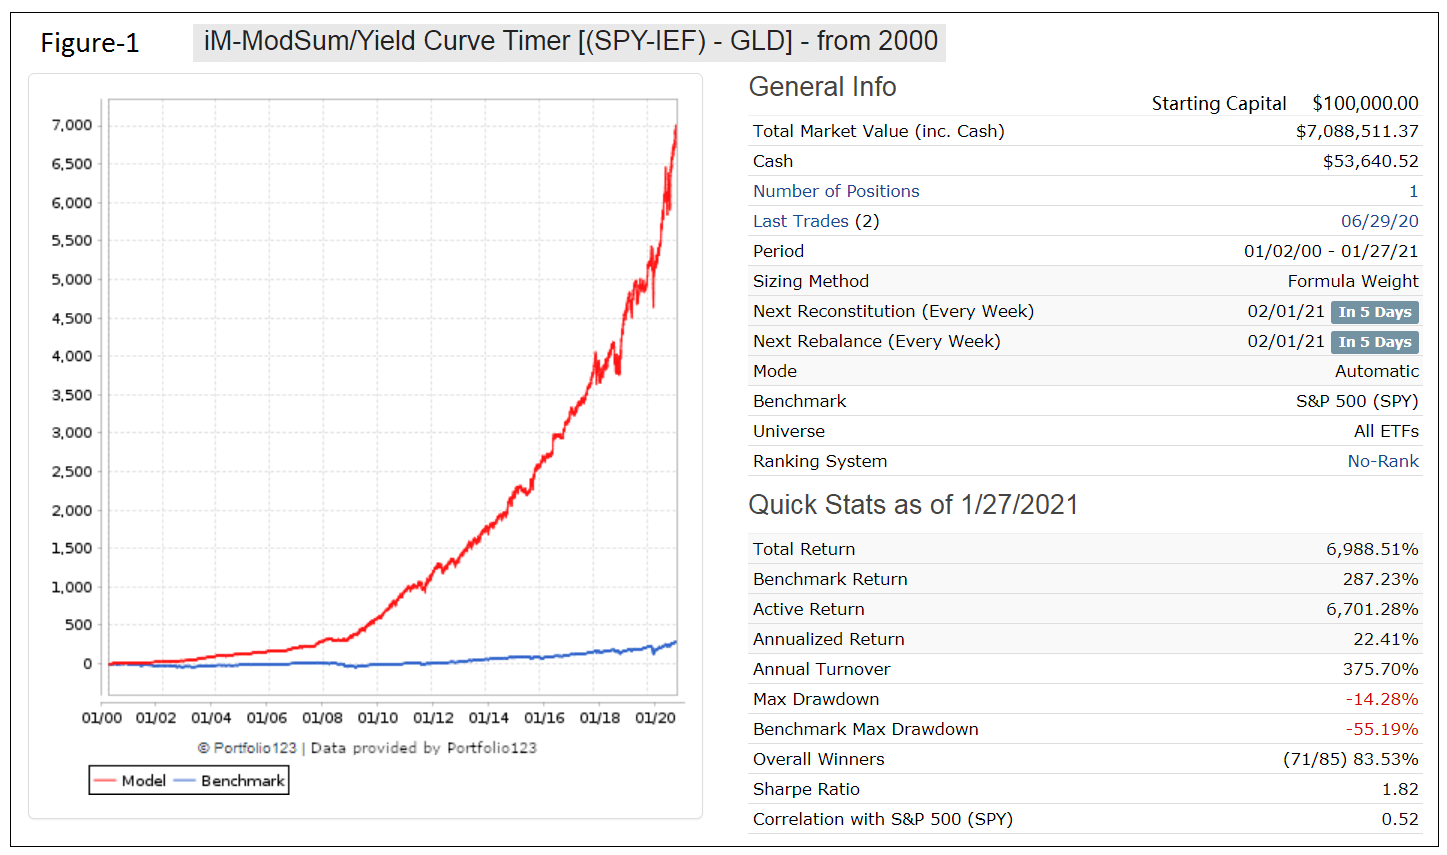
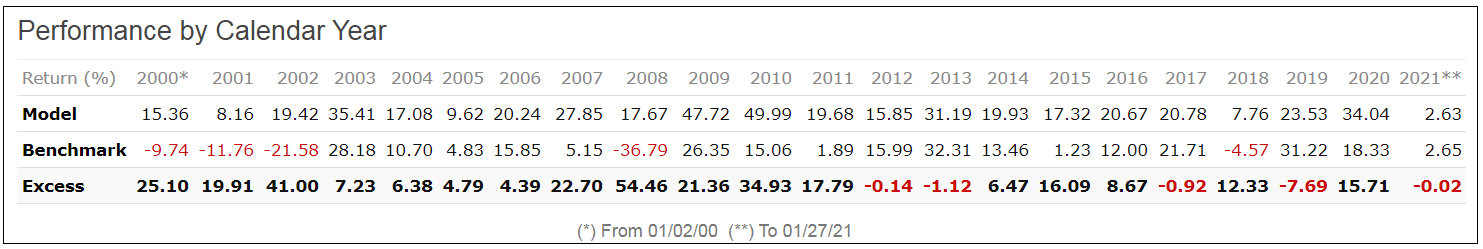
- For the period 1/02/2000 to 1/27/20121 this strategy would have produced an annualized return of 22.4% with a maximum drawdown of -14.3%.
The iM-ModSum Timer
This timer uses five live models with low correlation to each other, each designed to hold SPY during up-market conditions. These models are updated at the end of each week. When the majority of the models simultaneously hold SPY then the likelihood should be high that up-market conditions may exist.
The analysis and backtests were performed on the on-line portfolio simulation platform Portfolio 123 (P123) which provides historic financial data for stocks, bonds and ETFs from 1999 onward.
For each model the formula $model explores whether the model holds SPY at any particular time, and will return “1” if true otherwise “0”
The five models are:
- $model1= iM-Composite Market Timer (SPY-IEF)
- $model2= (SPY-IEF) with Best(SSO-Bond) algo
- $model3= iM-Composite (SH-SPY) Timer with Standard & Composite Timer rules
- $model4 = Enhanced Inflation Timer (SPY-IEF)
- $model5 = (SPY – IEF|VCIT) timed with S&P500 Momentum & VIX
The sum of the models’ formulas (ModSum) is calculated as shown below, which can have a maximum value of 6 (when all five models hold SPY simultaneously, and a minimum value of 0 (when none of the models holds SPY at the same time):
- ModSum = (2*(1*$model1 or 1*$model2) + 2*$model3+ 1*$model4+ 1*$model5)
Note, that $model3 was given a weight of “2” because the underlying model’s rules references two models. Also $model1 and $model2 can have has a weight of “2” because they are considered of higher importance in the analysis.
| Correlation between models | ||||||
| Model | A | B | C | D | E | |
| iM Composite Market Timer Stocks/Bonds (SPY-IEF) | A | – | 0.4 | 0.38 | 0.52 | 0.53 |
| SPY-IEF with Best(SSO-Bond) algo | B | 0.4 | – | 0.52 | 0.63 | 0.47 |
| iM-Composite(SH-SPY) Timer with Standard & Composite Timer rules | C | 0.38 | 0.52 | – | 0.48 | 0.39 |
| iM- Enhanced Inflation Timer (SPY-IEF) – 2000 | D | 0.52 | 0.63 | 0.48 | – | 0.54 |
| (SPY – IEF|VCIT) timed with S&P500 Momentum & VIX | E | 0.53 | 0.47 | 0.39 | 0.54 | – |
The iM-ModSum Timer’s trading rules are:
- Buy Rule: If ModSum>=4, buy Equity ETFs, otherwise buy Bond ETFs.
- Sell Rule: If ModSum>=4, sell Bond ETFs, otherwise sell Equity ETFs.
- Hold positions for at least 2 weeks.
The YieldCurve Timer
The timing rules for this model are based on the state of yield curve and on the trend of the Effective Federal Funds Rate and signal switches from stocks to gold, and vice versa, near or during recession periods. A detailed description is here.
Performance of the basic ModSum/YieldCurve Timer [(SPY-IEF) – GLD]
ETFs used:
- SPDR S&P 500 ETF Trust – SPY
- iShares 7-10 Year Treasury Bond ETF – IEF
- SPDR Gold Trust – GLD
The basic iM-ModSum/YieldCurve Timer [(SPY-IEF) – GLD] model switches between ETFs SPY and IEF according to the ModSum timer rules and also holds ETF GLD during periods indicated by the YieldCurve timer. During those periods the holding and weights are stipulated to be 20%SPY and 80%GLD, or 80%IEF and 20%GLD when the ModSum timer signals to hold SPY or IEF, respectively.
Performance for the period Jan-2000 to Jan-2021 is shown in Figure-1. The annualized return would have been 22.4% with a maximum drawdown of -14.3% with trading costs of about 0.03% of each trade amount taken into account. For the benchmark ETF SPY the annualized return was 6.6% with a maximum drawdown of -55.2% for this period.
Current holding (1/27/2021) is: 100% SPY
Conclusion
There are numerous possible ETF combinations that can be used in the iM-ModSum/Yield Timer model. For an example of a 1.5-times leveraged model see the Appendix.
It is not anticipated that the models will hold GLD anytime soon because the yield curve has to become inverted first.
At iMarketSignals we will report weekly holdings and performance of the basic iM-ModSum/Yield Curve Timer [(SPY-IEF) – GLD]. Members can then decide whether to follow a leveraged timer model, or make their own selection of equity and fixed income ETFs.
Appendix
Performance of the ModSum/YieldCurve Timer with 1.5-times leverage
ETFs used:
- SPDR S&P 500 ETF Trust – SPY
- iShares 7-10 Year Treasury Bond ETF – IEF
- SPDR Gold Trust – GLD
- ProShares Ultra S&P500 – SSO
- ProShares Ultra 7-10 Year Treasury – UST
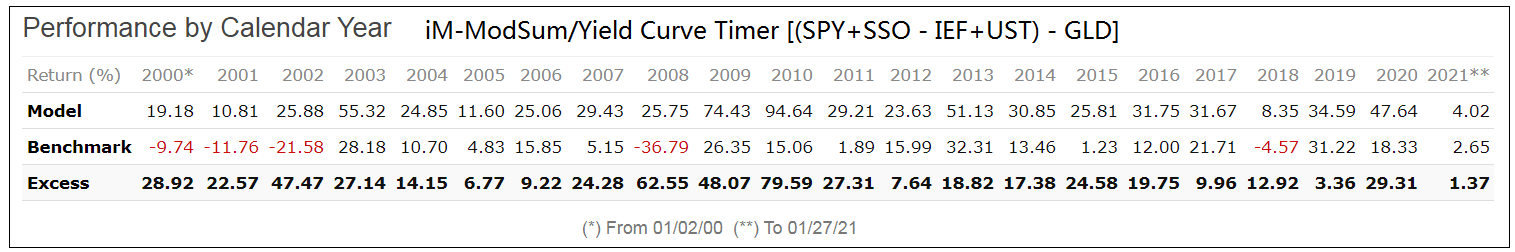
The iM-ModSum/Yield Curve Timer [(SPY+SSO – IEF+UST) – GLD] model switches between ETFs SPY+SSO (equal weight) and IEF+UST (equal weight) according to the ModSum timer rules and also holds ETF GLD during periods indicated by the YieldCurve timer. During those periods the holding and weights are stipulated to be 10%SPY+10%SSO and 80%GLD, or 40%IEF+40%UST and 20%GLD when the ModSum timer signals to hold SPY+SSO or IEF+UST, respectively.
For the period Jan-2000 to Jan-2021 the annualized return would have been 32.6% with a maximum drawdown of -17.4%. Current holdings are 50%SPY and 50%SSO.
This model would have had only positive returns every calendar year and would have also outperformed buy&hold SPY each year.
Disclaimer Note: All performance results are hypothetical and the result of backtesting over the period 2000 to 2021. Since performance is dependent on market-timing rules, the future out-of-sample performance may be significantly less if those rules are not as effective as they were during the backtest period.
This is a promising model. Curious, what are CAGR and Drawdown for ModSum without the GLD hedge?
Tom C
Without GLD:
Period 01/02/00 – 01/31/21
Last Reconstituted (Every Week) 02/01/21
Last Rebalanced (Every Week) 02/01/21
Benchmark S&P 500 (SPY)
Quick Stats as of 1/31/2021
Total Return 6,214.07%
Benchmark Return 273.39%
Active Return 5,940.68%
Annualized Return 21.73%
Annual Turnover 378.47%
Max Drawdown -33.14%
Benchmark Max Drawdown -55.19%
Overall Winners (68/82) 82.93%
Sharpe Ratio 1.66
Thanks. Those work well together. I’m guessing that would be a really strong hedge for the Super Timer and Composite Timer as well.
Tom C
Georg – can we see the trades it would have taken in 2002, 2008 & 2018?
Thanks!
Symbol … Open … Close … Pct
SPY … 6/22/2020 … – …
IEF … 6/8/2020 … 6/22/2020 … 1.20%
SPY … 4/20/2020 … 6/8/2020 … 14.70%
GLD … 4/20/2020 … 6/29/2020 … 1.70%
IEF … 3/30/2020 … 4/20/2020 … 0.60%
SPY … 12/24/2018 … 3/30/2020 … 11.40%
IEF … 12/10/2018 … 12/24/2018 … 0.50%
SPY … 4/3/2017 … 12/10/2018 … 12.20%
IEF … 3/27/2017 … 4/10/2017 … 0.00%
SPY … 11/7/2016 … 3/27/2017 … 9.60%
IEF … 9/6/2016 … 11/7/2016 … -1.80%
SPY … 7/25/2016 … 9/6/2016 … 1.10%
IEF … 7/11/2016 … 7/25/2016 … -1.10%
SPY … 6/27/2016 … 7/11/2016 … 6.90%
IEF … 3/21/2016 … 6/27/2016 … 3.80%
SPY … 3/14/2016 … 3/28/2016 … 0.30%
IEF … 12/7/2015 … 3/14/2016 … 2.20%
SPY … 11/16/2015 … 12/7/2015 … 1.30%
IEF … 11/2/2015 … 11/16/2015 … -0.60%
SPY … 8/24/2015 … 11/2/2015 … 11.00%
IEF … 7/6/2015 … 8/24/2015 … 2.30%
SPY … 6/1/2015 … 7/6/2015 … -2.30%
IEF … 3/16/2015 … 6/1/2015 … -0.60%
SPY … 1/5/2015 … 3/16/2015 … 3.40%
IEF … 12/22/2014 … 1/5/2015 … 0.90%
SPY … 10/13/2014 … 12/22/2014 … 9.00%
IEF … 10/6/2014 … 10/20/2014 … 2.00%
SPY … 11/21/2011 … 10/6/2014 … 63.90%
IEF … 11/14/2011 … 11/28/2011 … 0.30%
SPY … 9/26/2011 … 11/14/2011 … 7.90%
IEF … 8/22/2011 … 9/26/2011 … 1.10%
SPY … 8/8/2011 … 8/22/2011 … -6.60%
IEF … 8/1/2011 … 8/15/2011 … 3.50%
SPY … 5/31/2011 … 8/1/2011 … -0.20%
IEF … 5/23/2011 … 6/6/2011 … 1.10%
SPY … 6/28/2010 … 5/23/2011 … 22.80%
IEF … 6/14/2010 … 6/28/2010 … 1.90%
SPY … 6/7/2010 … 6/21/2010 … 5.60%
IEF … 4/5/2010 … 6/7/2010 … 6.40%
SPY … 1/25/2010 … 4/5/2010 … 8.10%
IEF … 1/4/2010 … 1/25/2010 … 1.70%
SPY … 11/23/2009 … 1/4/2010 … 3.00%
IEF … 11/16/2009 … 11/30/2009 … 1.40%
SPY … 3/23/2009 … 11/16/2009 … 35.20%
IEF … 2/9/2009 … 3/23/2009 … 3.10%
GLD … 12/22/2008 … 3/9/2009 … 8.50%
SPY … 12/22/2008 … 2/9/2009 … 0.00%
IEF … 5/5/2008 … 12/22/2008 … 12.40%
SPY … 4/7/2008 … 5/5/2008 … 2.80%
IEF … 11/5/2007 … 4/7/2008 … 6.30%
SPY … 8/27/2007 … 11/5/2007 … 2.10%
IEF … 8/13/2007 … 8/27/2007 … 1.60%
SPY … 8/14/2006 … 8/13/2007 … 14.20%
IEF … 7/31/2006 … 8/14/2006 … -0.50%
SPY … 7/10/2006 … 7/31/2006 … 0.80%
IEF … 6/26/2006 … 7/10/2006 … 0.50%
SPY … 6/5/2006 … 6/26/2006 … 0.80%
IEF … 5/30/2006 … 6/12/2006 … 0.30%
SPY … 4/18/2005 … 5/30/2006 … 10.10%
IEF … 1/10/2005 … 4/18/2005 … 0.10%
SPY … 10/25/2004 … 1/10/2005 … 4.80%
IEF … 10/18/2004 … 11/1/2004 … -0.50%
SPY … 8/9/2004 … 10/18/2004 … 4.30%
IEF … 7/19/2004 … 8/9/2004 … 0.60%
SPY … 7/6/2004 … 7/19/2004 … -1.50%
IEF … 6/7/2004 … 7/6/2004 … 1.90%
SPY … 5/17/2004 … 6/7/2004 … 4.00%
IEF … 5/10/2004 … 5/24/2004 … 0.50%
SPY … 4/19/2004 … 5/10/2004 … -4.40%
IEF … 4/5/2004 … 4/19/2004 … -1.10%
SPY … 8/4/2003 … 4/5/2004 … 16.80%
IEF … 7/28/2003 … 8/11/2003 … -0.30%
SPY … 3/31/2003 … 7/28/2003 … 17.80%
IEF … 12/2/2002 … 3/31/2003 … 2.40%
GLD … 11/18/2002 … 3/10/2003 … 10.60%
SPY … 11/18/2002 … 12/2/2002 … 4.00%
IEF … 11/4/2002 … 11/18/2002 … 0.20%
SPY … 9/3/2002 … 11/4/2002 … 3.40%
IEF … 12/10/2001 … 9/3/2002 … 11.90%
SPY … 10/22/2001 … 12/10/2001 … 4.40%
IEF … 11/6/2000 … 10/22/2001 … 14.30%
SPY … 10/2/2000 … 11/6/2000 … -0.10%
IEF … 6/26/2000 … 10/2/2000 … 3.10%
SPY … 2/22/2000 … 6/26/2000 … 8.30%
IEF … 1/3/2000 … 2/22/2000 … 1.10%
Georg, could we have an update on trades between 6/22/20 (the most recent trade posted above) and 5/24/21, when the portfolio went into IEF, where it has remained to date?
Hi,
What was the re-balance period of the simulation in Appendix A?
What would be the impact of different re-balance periods (i.e. weekly/monthly/none) on return and drawdown as the SPY/SSO?
Thanks.
The model in Appendix A was reconstituted weekly and rebalanced weekly.
Since all the underlying timers are reconstituted weekly, this model must also be reconstituted weekly.
Rebalancing refers to adjusting the model’s holdings to stipulated weights.
For example, rebalancing every 13 weeks would have reduced the annualized return to 28.4% and max D/D would have been 17.0%.
.. as the SPY/SSO diverge ..
Where will these be posted?
Because the model is new it will only appear on the web site on Feb-17-2021.
However, holdings were emailed to gold subscribers since Jan-31.
hello GEOVRBA
between February 19, 2020 and March 23, 2020 the spy made -35%. how can you say: For the period 1/02/2000 to 1/27/20121 this strategy would have produced a maximum drawdown of -14.3%.
Thanks you for your reply.
Best regards richard
Richard, on Sep-9-2019 this model sold SPY and bought GLD. It sold GLD on Jun-29-2020. That is why it’s drawdown was not -35% during the period you mention.
The trades posted above do not show model holding any gold in September 2020?
SPY … 4/20/2020 … 6/8/2020 … 14.70%
GLD … 4/20/2020 … 6/29/2020 … 1.70%
IEF … 3/30/2020 … 4/20/2020 … 0.60%
SPY … 12/24/2018 … 3/30/2020 … 11.40%
Sept 2019 I should say
hello
please excuse me but in your answer just above you put the following period. there is something that I probably don’t understand it must be my french origin :)
SPY … 12/24/2018 … 3/30/2020 … 11.40%
Thank you in advance for your answer
The model can hold SPY or IEF together with GLD.
It bought 16,689 shares of SPY on 12/24/2018 at $234.34.
On 9/9/2019 it sold 13,322 shares of SPY at $298.20 to buy GLD. On 3/30/2020 it sold the remainder of SPY at 261.65 for a gain of 11.40%.
The trades reported are only realized trades. So he first part from 12/24/2018 to 9/9/2019 is not shown in the listing.
thanks you
Found my own answer in dedicated gold timer article, probably the trades posted above are incorrect
P123 9/9/2019 6/29/2020 294 17.90% 2.30% 15.60%
You are referencing the article “Stock – Gold Switch Signals From The Yield Curve And The Federal Funds Rate”.
Any specific reason to use SPY and IEF? For stock, VTI’s expense ratio is a third of SPY.
Are there any significant changes if we use VTI / BND ?
We used SPY and IEF because most of our timers use those two ETFs, so that allows easy comparison.
You can use VTI – BND instead. Simulated annualized return is about 2% lower.
Period 01/02/00 – 02/21/21
Benchmark S&P 500 (SPY)
Quick Stats as of 2/21/2021
Total Return 5,485.84%
Benchmark Return 293.52%
Active Return 5,192.32%
Annualized Return 20.96%
Annual Turnover 373.07%
Max Drawdown -16.11%
Benchmark Max Drawdown -55.19%
Overall Winners (69/85) 81.18%
Sharpe Ratio 1.67
thank you!
Hello again, Georg and Anton,
I have been looking for a model like this for a few months to help boost my REIT portfolio gains and decrease downside risk with the IEF switch and/or GLD hedge! I propose, for myself, using the 1.5x leverage option of this model to trade a basket of 15-20 individual REITS (50%) + URE (50%) in place of the SPY+SSO when it is is signaling. The IEF+UST and GLD signals would be traded as per the model, and allocations (e.g. 50-50, 20-80, etc.) per the model would be adhered to as designed. Any thoughts or words of ideas to offer before experimenting with this? Thanks in advance. Great work!
numejak, I ran the backtest with 50%VNQ and 50%URE from 1/30/2007. (URE inception was 1/30/07.) Here are the stats. Looks pretty good, but model does better with SPY and SSO which shows an annualized return of 35.4% and similar max D/D for the same period.
Period 01/30/07 – 03/06/21
Benchmark S&P 500 (SPY)
Quick Stats as of 3/6/2021
Total Return 4,856.62%
Benchmark Return 256.71%
Active Return 4,599.91%
Annualized Return 31.90%
Annual Turnover 359.16%
Max Drawdown -26.25%
Benchmark Max Drawdown -55.19%
Overall Winners (79/104) 75.96%
Sharpe Ratio 1.32
Correlation with S&P 500 (SPY) 0.38
numejak, I ran the backtest with 50%SSO and 50%URE from 1/30/2007. So the equity has 2x leverage and the bonds have 1.5x leverage. This model shows an annualized return of 42.3% and similar max D/D of -24%.
Period 01/30/07 – 03/06/21
Benchmark S&P 500 (SPY)
Quick Stats as of 3/6/2021
Total Return 14,345.68%
Benchmark Return 256.71%
Active Return 14,088.97%
Annualized Return 42.30%
Annual Turnover 357.19%
Max Drawdown -24.09%
Benchmark Max Drawdown -55.19%
Overall Winners (81/104) 77.88%
Sharpe Ratio 1.60
Correlation with S&P 500 (SPY) 0.56
thank you this extra backtesting was most helpful! Appreciate your hard work as always!
Hi,
I noticed that on the ‘out of sample performance summary’ (dated 4/20/2021), the simple return for this model is -3.36%, and the return since 01/03/2000 is 10.02%. Is this a typo?
Robert, Thank you for pointing this out. Not a typo, but corrupt data in an excel sheet. Correct values are 21.38% and 22.59%, respectively.
I am looking to follow and trade the Leveraged version but I note that trade signals are only posted for the basic ModSum YC Timer….. where can i find the signals for the Leveraged one? Or is it as simple as just replacing the SPY with SSO, IEF with UET etc ? I dont think it is as in the notes to the model i see that as an example you show the enhanced model as holding at one time 50% SPY and 50% SSO
Thanks
The basic iM-ModSum/YieldCurve Timer [(SPY-IEF) – GLD] model switches between ETFs SPY and IEF according to the ModSum timer rules and also holds ETF GLD during periods indicated by the YieldCurve timer. During those periods the holding and weights are stipulated to be 20%SPY and 80%GLD, or 80%IEF and 20%GLD when the ModSum timer signals to hold SPY or IEF, respectively.
So the basic model can hold:
100% SPY, or
100% IEF, or
20%SPY + 80%GLD, or
80%IEF + 20%GLD.
For the 1.5 x leveraged model the corresponding holdings would be:
50% SPY + 50% SSO, or
50% IEF + 50% UST, or
10%SPY + 10%SSO + 80%GLD, or
40%IEF + 40%UST + 20%GLD.
Many thanks