- This 5-stock trading strategy with the stocks from Invesco QQQ Trust produces much higher returns than the ETF (QQQ).
- The universe from which stocks are selected is the Nasdaq 100 Index which represents all the point-in-time holdings of QQQ.
- The model ranks the stocks of the Nasdaq 100 Index and selects periodically the highest ranked stocks which also satisfy certain yield requirements.
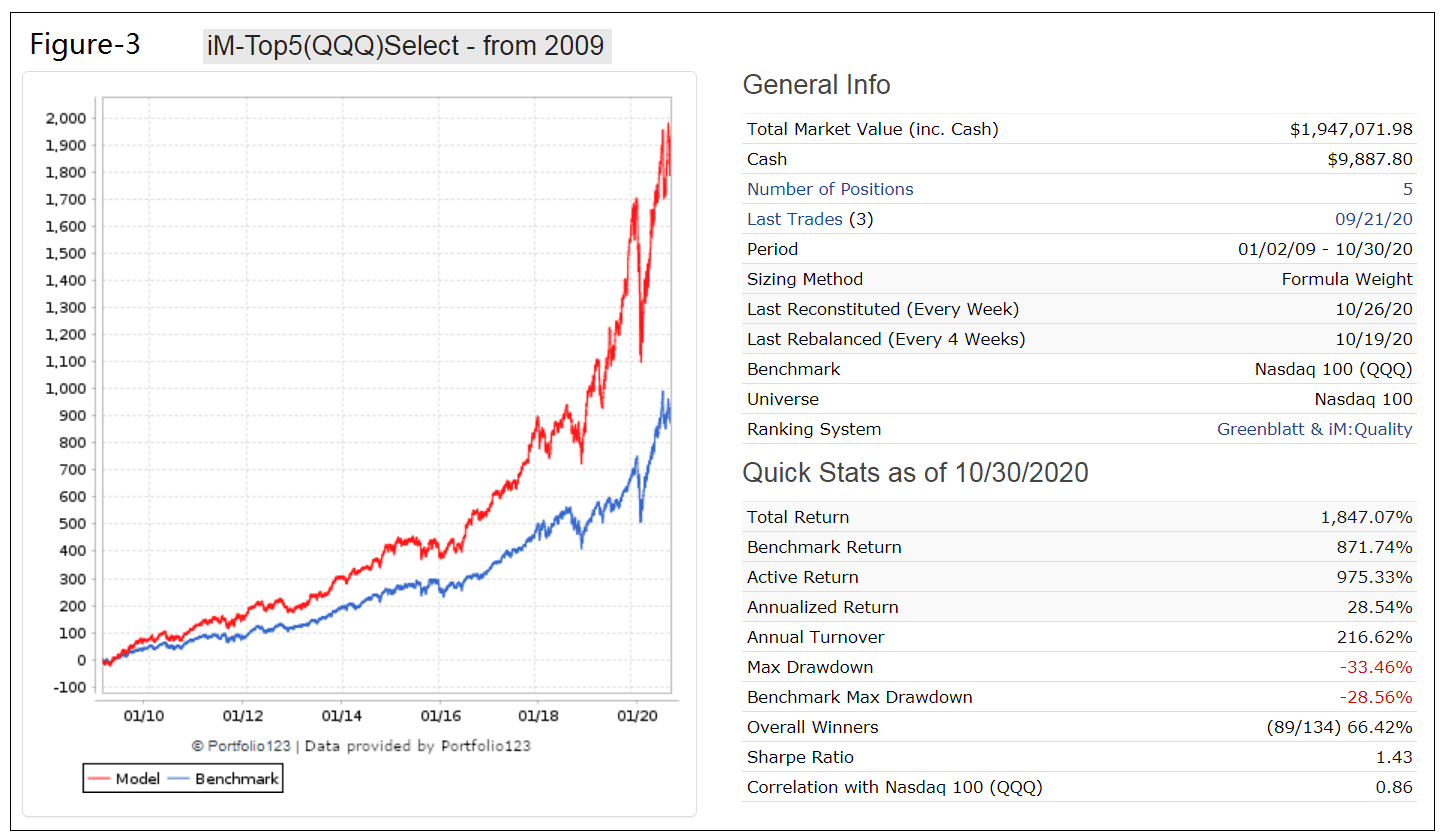
- From 1/2/2009 to 10/30/2020 this strategy would have produced an annualized return (CAGR) of 28.5%, more than the 21.2% CAGR of QQQ over this period.
Previous articles describing profitable trading strategies with the stocks of seven Select Sector SPDR Funds are:
- The Technology Select Sector SPDR Fund (XLK) (article-1);
- The Consumer Staples Select Sector SPDR Fund (XLP) (article-2);
- The Healthcare Select Sector SPDR Fund (XLV) (article-3);
- The Industrial Select Sector SPDR Fund (XLI) (article-4);
- The Utility Select Sector SPDR Fund (XLU) (article-5);
- The Materials Select Sector SPDR Fund (XLB) (article-6); and
- The Consumer Discretionary Select Sector SPDR Fund (XLY) (article-7) .
Although the Invesco QQQ Trust holdings fall into various sectors, the aim according to its brochure is to hold stocks from innovative companies. Therefore, it is not unreasonable to consider it to represent the “Innovation Sector” of the economy. Similarly to the seven sector models above, the stocks of the Invesco QQQ Trust can be profitably traded to provide better returns than the Trust itself.
Emulating the Invesco QQQ Trust (QQQ)
The analysis was performed on the on-line portfolio simulation platform Portfolio 123.
A close match to the typically 100 holdings of QQQ can be obtained from the Portfolio 123 point-in-time universe “Nasdaq 100”.
Backtesting of the Nasdaq 100 universe
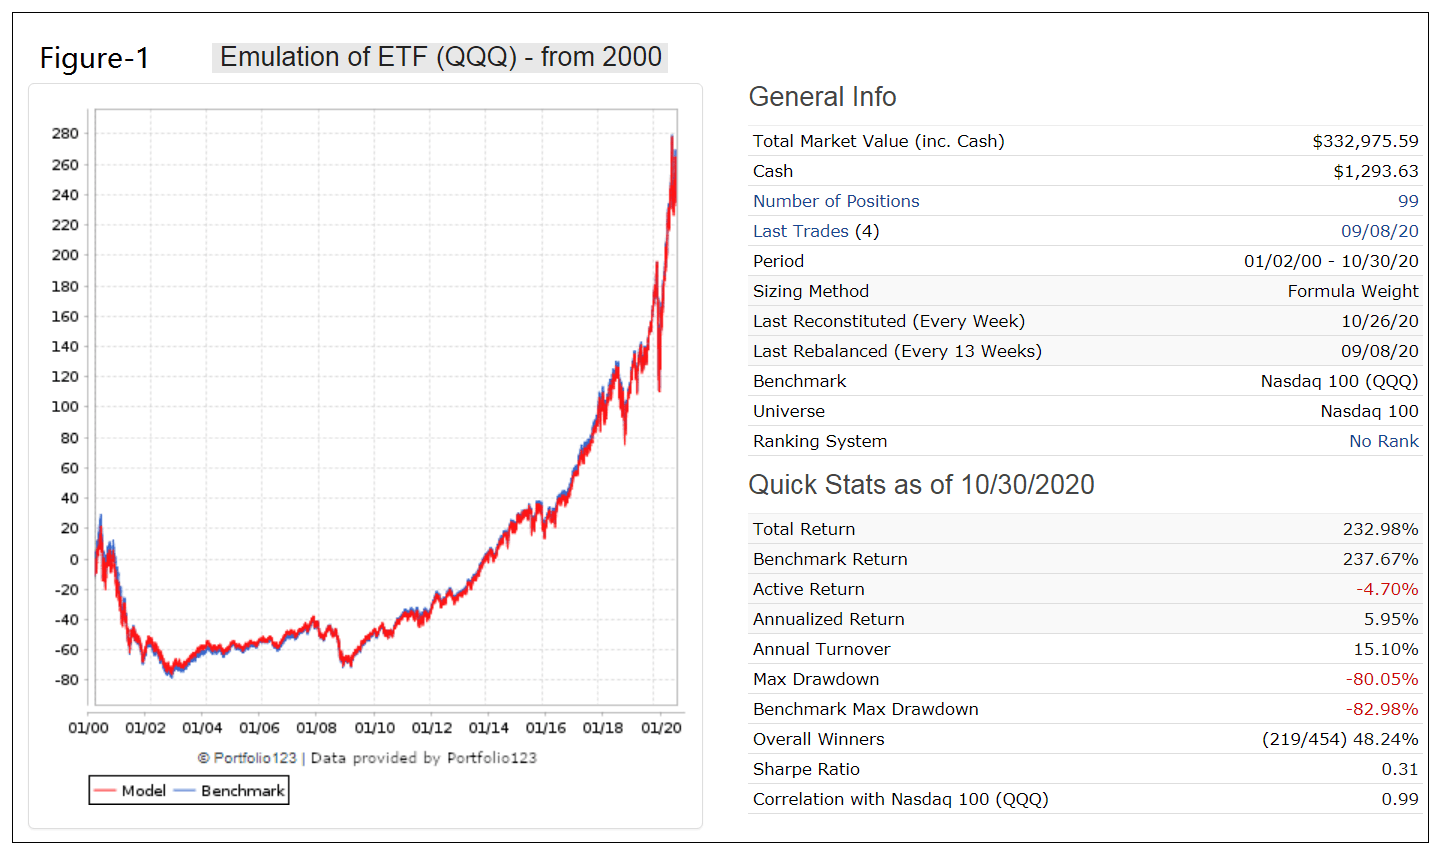
A backtest from 1/2/2000 to 10/30/2020 with all the cap-weighted stocks in the universe shows a 99% correlation with the performance of benchmark QQQ and nearly identical total returns of about 235% over this period. A management fee of 0.2% was taken into account in the simulation, the same as the total expense ratio the Trust’s sponsor currently applies.
In the Figure-1 below, the red graph depicts the performance of the Nasdaq 100 universe and the blue graph (partly hidden) the performance of QQQ; the plots are identical.
One can therefore expect that stocks selected by the model from the Nasdaq 100 universe will be representative to what would have been selected from the historic holdings of QQQ.
Trading 5 stocks from the universe Nasdaq 100
The iM-Top5(QQQ)Select trading strategy invests periodically in only five equal weighted stocks from the universe Nasdaq 100 ranked with a combination of the Portfolio 123 “Greenblatt” and the “iM: Quality” ranking systems, the latter described in this article.
The buy rules require stocks to have a dividend yield greater than 0.5%. Additionally, stocks must Piotroski F-Score greater than 4. Also, the Price to Earnings Ratio (excluding extraordinary items, for trailing 12 months) and the Current Year Projected P/E Ratio must be less than 1.25 times that of the average and median for the stocks of the S&P 500 index, respectively.
A minimum holding period of 4 weeks is specified. A position is sold based on its rank, or if the percentage from highest close since a position was started becomes less than -15%.
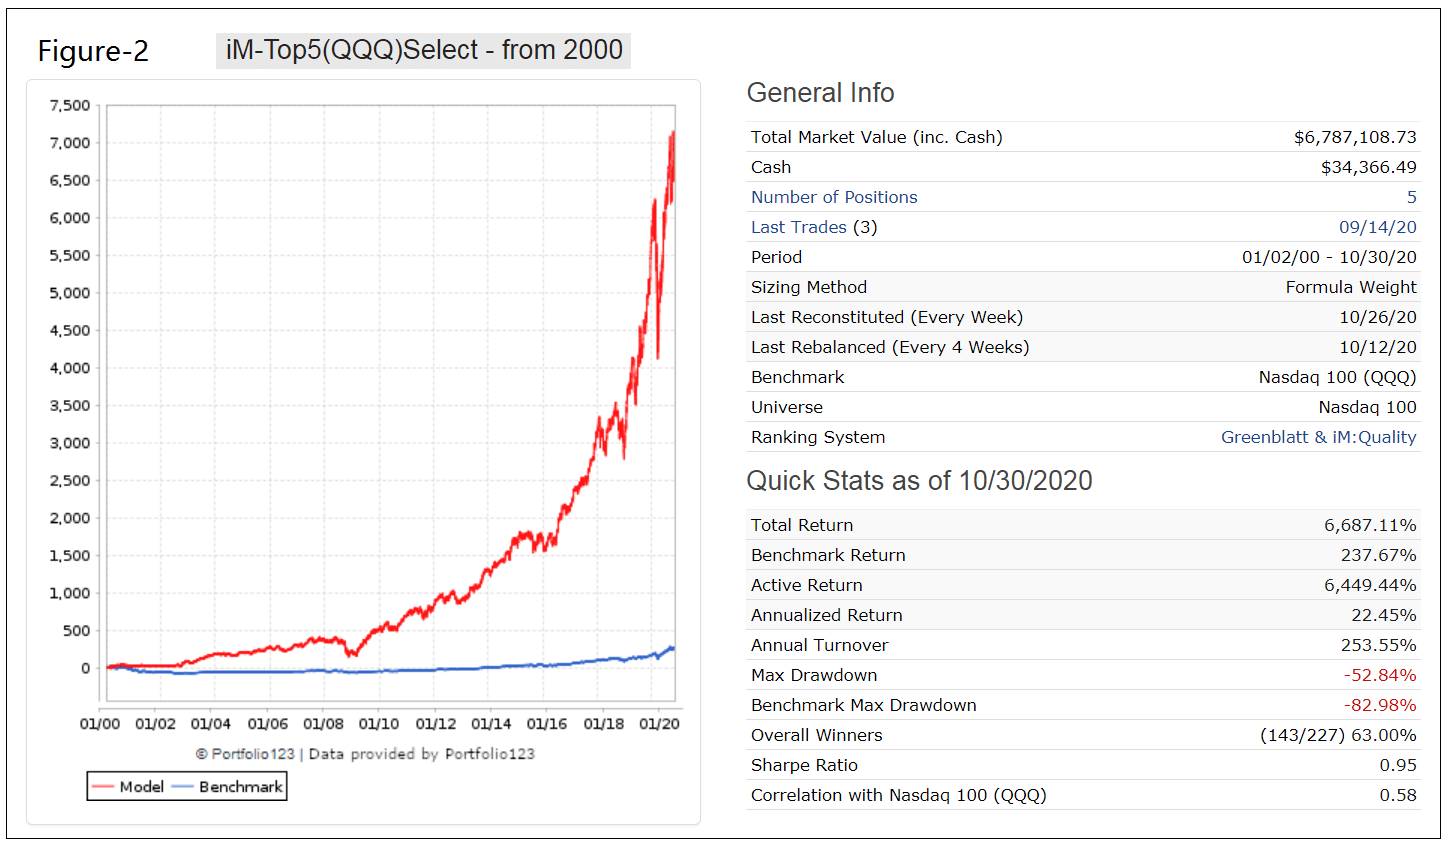
Figure-2 shows the simulated performance of this strategy from 1/2/2000 to 10/30/2020 and also that of the benchmark QQQ. The model shows an annualized return of 22.5% (QQQ produced 5.8%) and maximum drawdown of -53% (-83% for QQQ). Annual turnover is low, about 250%. Trading costs of 0.12% of each trade amount were assumed in the simulation.
Stocks from the Nasdaq 100 Index have performed well since 2009, with QQQ showing a 21.2% annualized return for the period 1/2/2009 to 10/30/2020. The simulated performance of the trading strategy for the same period is shown in Figure-3. The model outperformed QQQ; the backtest shows an annualized return of 28.5% and similar maximum drawdowns of about -30%.
Investment Risk
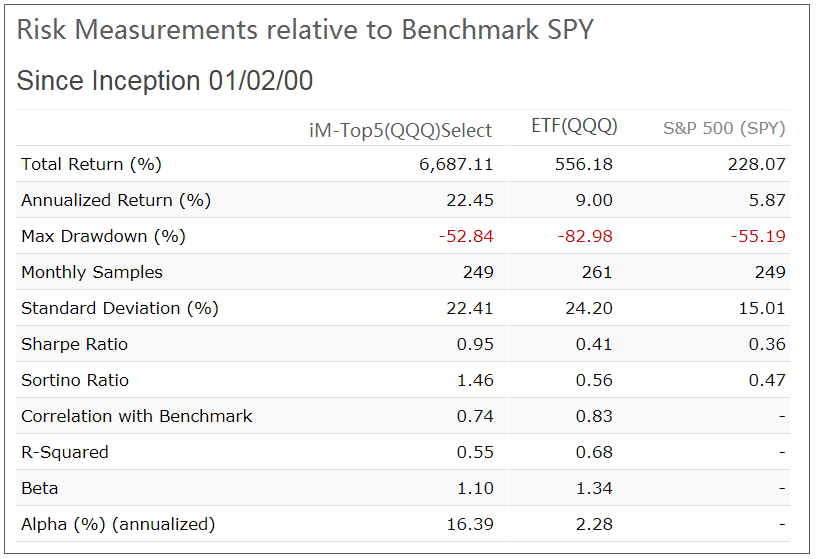
In the table below are the risk statistics from 2000 to 2020 for the model and QQQ relative to the benchmark S&P 500 (SPY). It is evident from the risk measures that the trading strategy carries less risk than investing in QQQ or SPY over the longer term. The positive alpha of 16.4% indicates that this strategy would have outperformed its risk-adjusted benchmark (SPY) return on average by 16.4% per year.
Performance comparison with a 4% withdrawal rate
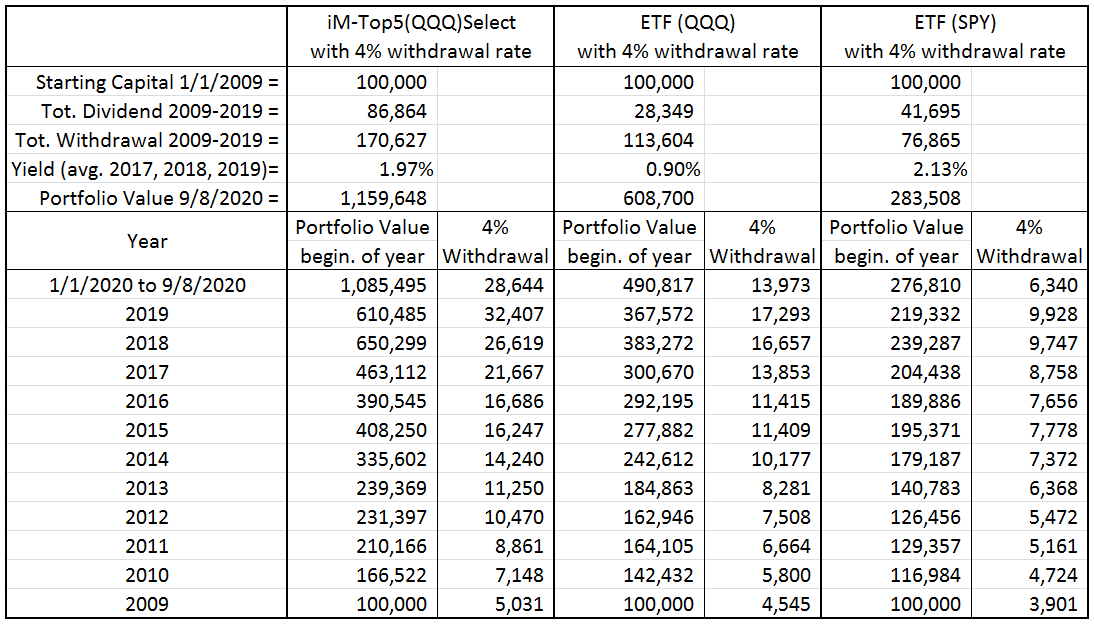
The table below compares the annual withdrawal amounts and portfolio values for the trading strategy, QQQ and SPY assuming an initial investment of $100,000 at the beginning of 2009 and annual withdrawals of 4.0% of portfolio value.
Total withdrawals and end portfolio value for the trading strategy are 50% and 91% higher, respectively, than what would have been provided by 4% withdrawal rate from a buy-and-hold investment in QQQ. Also for the model the average dividend yield over the preceding three calendar years is significantly higher than that of QQQ.
Conclusion
The analysis shows that the iM-Top5(QQQ)Select investment strategy would have produced good returns, preferable to a buy-and-hold investment in stock index funds QQQ or SPY. Reasonably high withdrawal rates should be possible without depleting the investment.
Moderate trading is required. The model shows a an average annual turnover of about 250% with a position held on average for 20 weeks and not shorter than 4 weeks. The current holdings are listed in the appendix.
Also, at iMarketSignals one can follow this strategy where the performance will be updated weekly.
Appendix
Holdings (as of 11/12/2020)
Ticker |
Name |
MktCap |
Days Held |
Yield % |
Sector |
| EA | Electronic Arts Inc | 35 B | 3 | 0.57% | Technology |
| KLAC | KLA Corp | 36 B | 87 | 1.54% | Technology |
| LRCX | Lam Research Corp | 61 B | 10 | 1.24% | Technology |
| PAYX | Paychex Inc. | 32 B | 213 | 2.74% | Business Services |
| TXN | Texas Instruments Inc | 142 B | 108 | 2.64% | Technology |
Disclaimer:
All results shown are hypothetical and the result of backtesting over the period 2000 to 2020. No claim is made about future performance.

Georg,
Any plans to combine all these Select Sector portfolios into one master portfolio…..possibly allocating to the top 2 or 3 based on the Relative Strength relationships between them, or some other ranking system?
It seems to me you make up rules (i.e. yield and P/E requirements) that optimize returns using data from the past 20 years. The problem is, the market changes the rules and the investment rules no longer work the next decade. It seems most of your strategies have not performed that great with real money. Like the concept here but have my doubts. Would feel more confident if the stocks were simply ranked by the Greenblatt and iM Quality rankings – no additional rules.
I don’t see what is so unusual in the buy- and sell rules which would make them obsolete over the next decade.
The buy rules specify a min dividend yield, a min Piotroski F-Score and a max Price to Earnings Ratio.
Sell rules are based on rank, or on the percentage from highest close since a position was started.
Hi Georg,
I’m a big fan of your site
Is it possible to see the key statistics (Sharpe, max DD, Cage, stddev etc) when this QQQ strategy is mixed with a portfolio of 50% long term Treasuries (eg TLT)
I’ve been doing some back testing and a combo of Tech plus long term treasuries results is a great return but minimises Drawdowns too.
It would be great to see how much this 50% DD is reduced in this QQQ strategy by throwing in 50% TLT in the mix
Thanks for your help
James
Sorry about the typo, it was meant to say CAGR in the key stats
Thanks
50%Top5-QQQ + 50%TLT from 2000:
Period 12/31/99 – 08/09/21
Benchmark S&P 500 (SPY)
Quick Stats as of 8/9/2021
Total Return 2,762.73%
Benchmark Return 349.02%
Active Return 2,413.71%
Annualized Return 16.78%
Max Drawdown -23.96%
Benchmark Max Drawdown -55.19%
Sharpe Ratio 1.29
Correlation with S&P 500 (SPY) 0.56
Standard Deviation (%) 11.45 14.98
Sortino Ratio 1.97 0.57
R-Squared 0.31 –
Beta 0.42 –
Alpha (%) (annualized) 12.65 –
50%Top5-QQQ + 50%TLT from 2016:
Period 12/31/15 – 08/09/21
Benchmark S&P 500 (SPY)
Quick Stats as of 8/9/2021
Total Return 216.65%
Benchmark Return 140.42%
Active Return 76.23%
Annualized Return 22.80%
Max Drawdown -15.89%
Benchmark Max Drawdown -33.72%
Sharpe Ratio 1.93
Correlation with S&P 500 (SPY) 0.59
Standard Deviation (%) 10.57 14.55
Sortino Ratio 2.80 1.41
R-Squared 0.35 –
Beta 0.43 –
Alpha (%) (annualized) 14.5
this is awesome. I’m going to make this my new permanent /all weather portfolio.
Thanks again Georg :)
Hi Georg,
Could you please post calendar year returns for this similar to the other strategy pages you have (ie. vs SPY)
Thanks again :)
Year … Model … SPY … Excess
2000 … 22.45 … -9.74 … 32.18
2001 … 3.61 … -11.76 … 15.37
2002 … 35.20 … -21.58 … 56.79
2003 … 62.33 … 28.18 … 34.15
2004 … 8.34 … 10.70 … -2.36
2005 … 21.84 … 4.83 … 17.01
2006 … 7.82 … 15.85 … -8.02
2007 … 20.71 … 5.15 … 15.56
2008 … -36.42 … -36.79 … 0.37
2009 … 95.67 … 26.35 … 69.31
2010 … 31.76 … 15.06 … 16.71
2011 … 14.23 … 1.89 … 12.34
2012 … 7.99 … 15.99 … -8.00
2013 … 46.56 … 32.31 … 14.25
2014 … 26.67 … 13.46 … 13.21
2015 … -0.33 … 1.23 … -1.57
2016 … 22.14 … 12.00 … 10.14
2017 … 45.05 … 21.71 … 23.34
2018 … -1.05 … -4.57 … 3.52
2019 … 84.67 … 31.22 … 53.45
2020 … 46.60 … 18.33 … 28.26
2021 … 25.58 … 20.05 … 5.53
How to start … ? Let’s say I signed up, how best to start taking singles and to get your money fully working
The iM-Top5(QQQ)Select only holds 5 positions. It is in the Gold section of iM.
If one wanted to slowly move into the model, then perhaps one could just buy the new Buys as they occur. It could take quite a long time then before one is fully invested because a position is held on average for about 160 days.
thanks, understand
Any chance you could run this (iM-Top5(QQQ)Select) in conjunction with your iM Consumer Sentiment + CARP Risk-on/off model?
how can i find the models at p123?
Hi Georg,
I’m looking to combine this model with some other iM models to potentially reduce drawdowns.
I’ve backtested a combination of sector ETfs as a proxy which seems to work well (QQQ, GLD, XLV). Just seeing if it’s possible to combine the equivalent iM models to see what the back test to ~1999 looks like.
So that would be the QQQ model, gold momentum timer and XLV model.
I’ve tried different weights, but perhaps just testing evenly weight for now to see what the max drawdown is over that period.
Thanks 👍
James
It would appear from the backtest that the combination below should provide good results.
50% iM-Composite(Gold-Stocks-Bonds) Timer
25% iM-Top5(XLV)Select
25% iM-Top5(QQQ)Select
Thanks Georg, much appreciated