
- This 5-stock trading strategy with the Utility Sector stocks of the S&P 500 produces much higher returns than the Utility Select Sector SPDR Fund (XLU).
- The universe from which stocks are selected holds point-in-time, the S&P 500 utility stocks of FactSet’s Reverse Business Industry Classification System.
- The model ranks the stocks of this custom universe and selects periodically the highest ranked stocks which also satisfy stipulated yield requirements.
- From 1/2/2009 to 10/1/2020 this strategy would have produced an annualized return (CAGR) of 12.7%, versus the 10.2% CAGR of XLU over this period.
Previous articles described profitable trading strategies with the stocks of the Technology Select Sector SPDR Fund (XLK) (article-1), the Consumer Staples Select Sector SPDR Fund (XLP) (article-2), the Healthcare Select Sector SPDR Fund (XLV) (article-3), and the Industrial Select Sector SPDR Fund (XLI) (article-4). Similarly, the utility stocks of the S&P 500 can be profitably employed to provide better returns than the Utility Select Sector SPDR Fund (XLU).
Emulating the Utilities Select Sector SPDR Fund (XLU).
The analysis was performed on the on-line portfolio simulation platform Portfolio 123.
Since historic holdings of XLU are not published a custom universe was constructed from the S&P 500 utility stocks of FactSet’s Revere Business Industry Classifications System
The rule to set up the custom universe “S&P 500 (UTIL)” in Portfolio 123 is: RBICS(UTIL).
The current holdings (28 stocks) of S&P 500 (UTIL) are identical to the current holdings of XLU.
Backtesting of S&P 500 (UTIL) universe
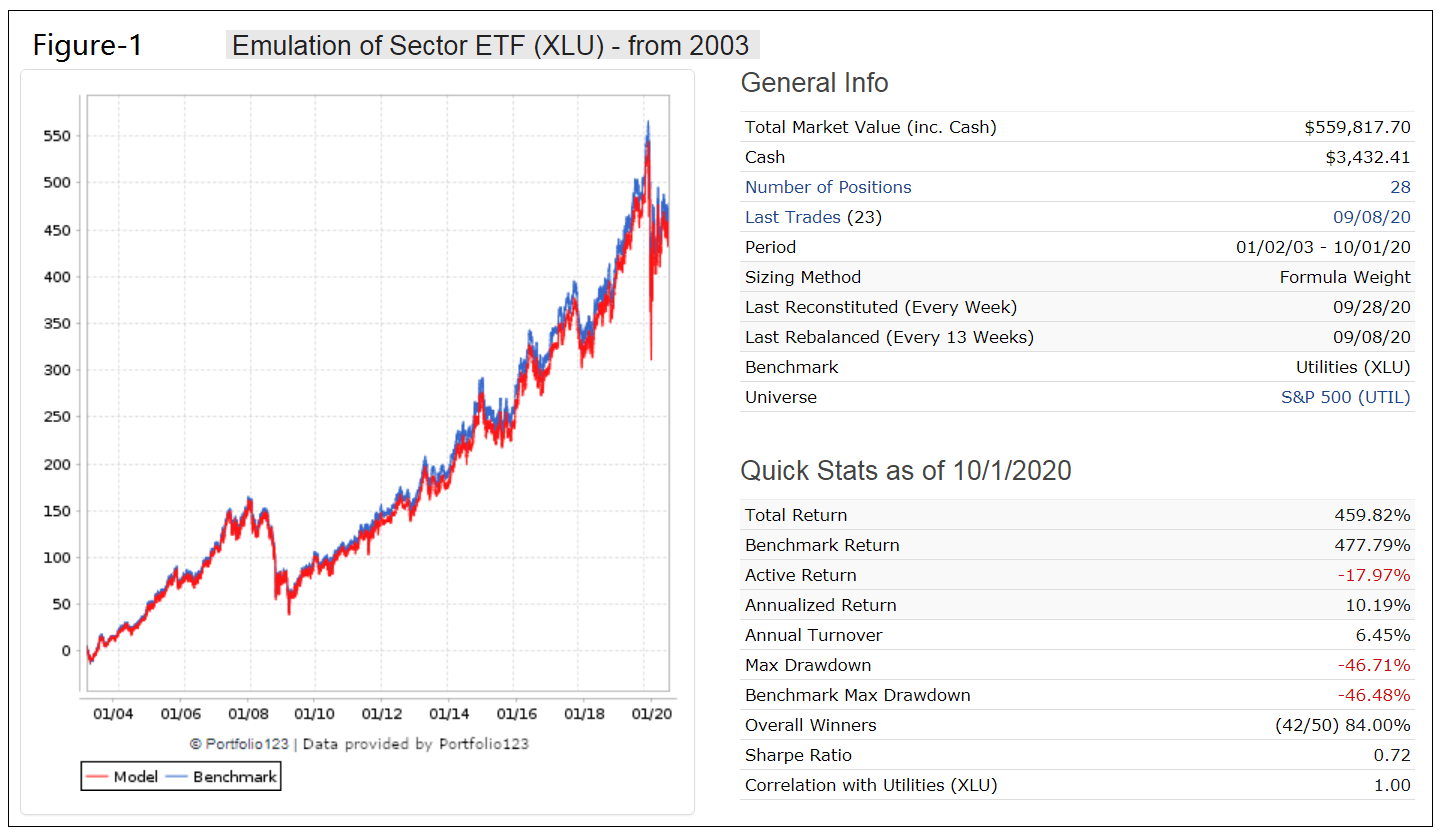
A backtest from 1/2/2003 to 10/1/2020 with all the cap-weighted stocks in the custom universe shows a 100% correlation with the performance of benchmark XLU and almost identical total returns of 470% over this period, with similar holding weights as shown on ETF provider’s website.
In the Figure-1 below, the red graph depicts the performance of the custom universe and the blue graph (partly hidden) the performance of XLU.
One can therefore expect that the custom universe S&P 500 (UTIL) will reasonably accurately reflect the holdings of XLU, and stocks selected by the model should not differ much from what would have been selected from a universe of XLU’s actual historic holdings.
Trading 5 stocks from the custom universe S&P 500 (UTIL)
The iM-Top5(XLU)Select trading strategy invests periodically in only five equal weighted stocks from the custom universe S&P 500 (UTIL) selected by a multi-factor ranking system
The buy rules require stocks to have a dividend yield 1% greater than that of the S&P 500 index. Additionally, an Altman Z-Score for non-manufacturing companies greater than 0.75 to predict possible corporate bankruptcy, a Beneish M-Score less than -1.70 to eliminate companies that are associated with increased probability of manipulations (for example, Enron), and a Piotroski F-Score greater than 2.
A position is sold only after a minimum holding period of 6 weeks if its rank gets less than 75%, or if it has gained less than 9% after a minimum holding period of 12 weeks, or the percentage from highest close since a position was started becomes less than -9% after a one week minimum holding period.
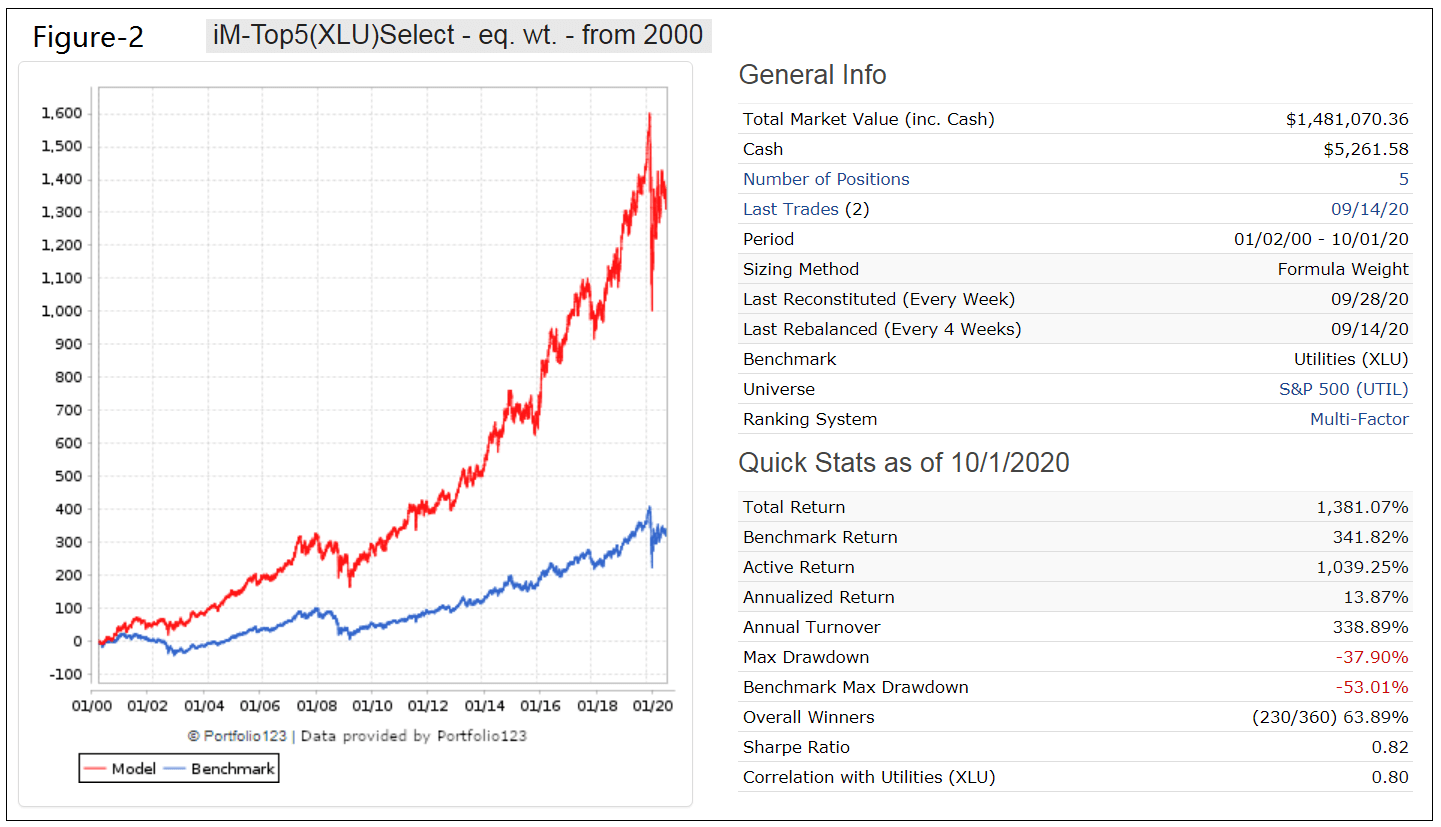
Figure-2 shows the simulated performance of this strategy from 1/2/2000 to 10/1/2020 and also that of the benchmark XLU. The model shows an annualized return of 13.9% (XLU produced 7.5%) and maximum drawdown of -38% (-53% for XLU). Annual turnover is reasonably low, about 330%. Trading costs of 0.12% of each trade amount were assumed in the simulation.
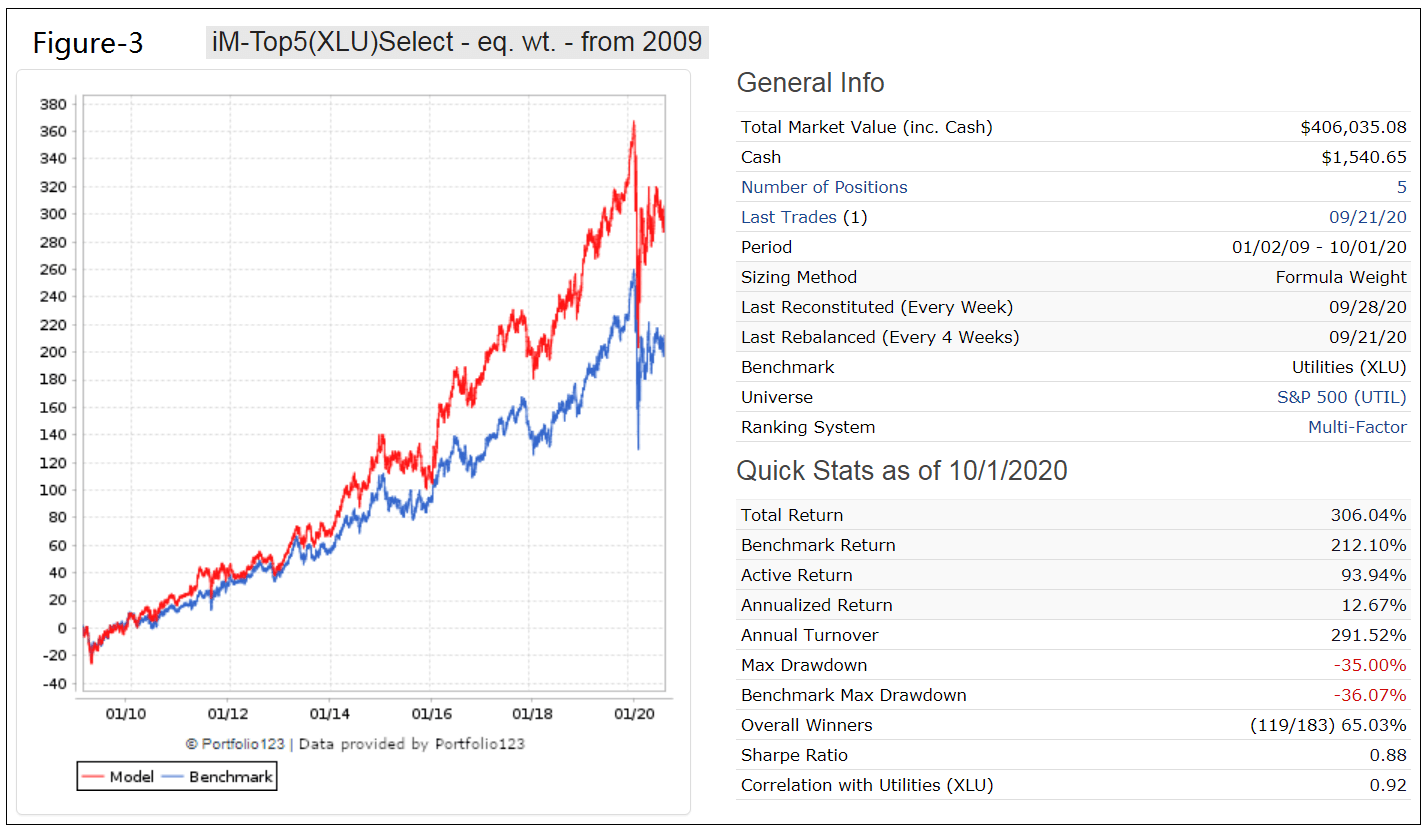
Utility stocks have performed reasonably well since 2009, with XLU showing a 10.2% annualized return for the period 1/2/2009 to 10/1/2020. The simulated performance of the trading strategy for the same period is shown in Figure-3. The model outperformed XLU; the backtest shows an annualized return of 12.7% and similar maximum drawdown of -35%. Annual turnover is reasonably low, less than 300%.
Investment Risk
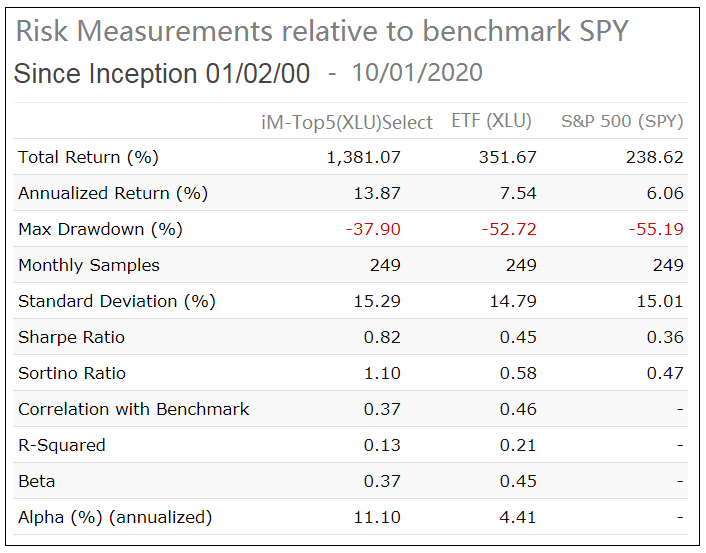
In the table below are the risk statistics from 2000 to 2020 for the model and XLU relative to the benchmark S&P 500 (SPY). It is evident from the risk measures that the trading strategy carries less risk than investing in XLU or SPY over the longer term.
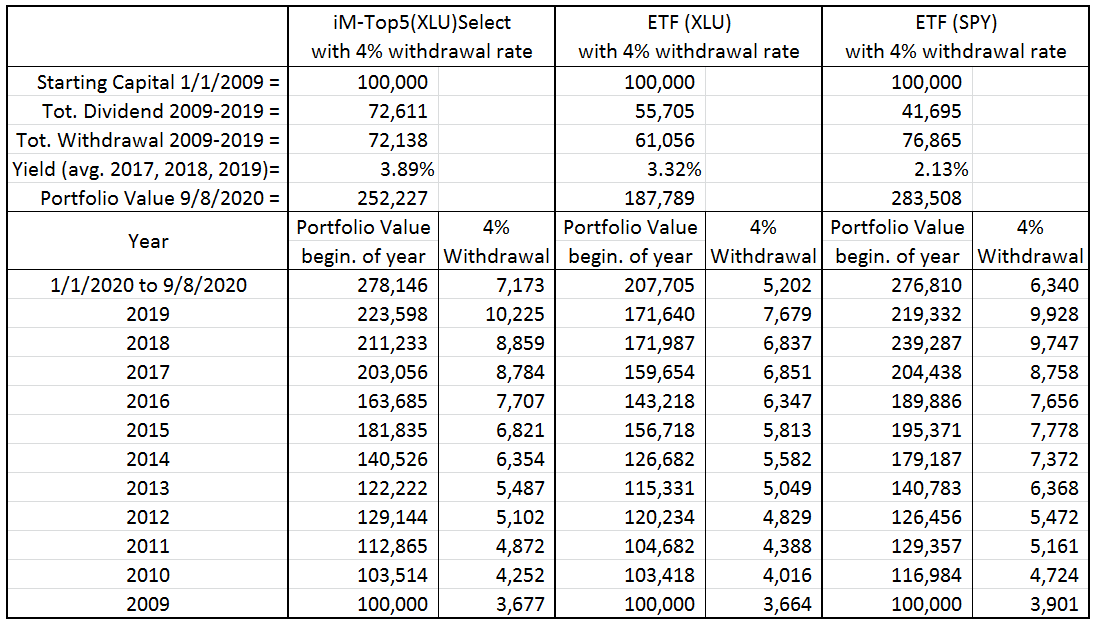
Performance comparison with 4% withdrawal rate
The table below compares the annual withdrawal amounts and portfolio values for the trading strategy, XLU and SPY assuming an initial investment of $100,000 at the beginning of 2009 and annual withdrawals of 4.0% of portfolio value.
Total withdrawals and end portfolio value for the trading strategy are 18% and 34% higher, respectively, than what would have been provided by 4% withdrawal rate from a buy-and-hold investment in XLU. Also for the model the average dividend yield over the preceding three calendar years is significantly higher than that of XLU.
Conclusion
The analysis shows that the iM-Top5(XLU)Select investment strategy would have produced good returns, preferable to a buy-and-hold investment in stock index fund XLU. Reasonably high withdrawal rates should be possible without depleting the investment.
Moderate trading is required. The model shows a an average annual turnover of about 300% with a position held on average for 15 weeks and not shorter than 2 weeks. The current holdings are listed in the appendix.
Also, at iMarketSignals one can follow this strategy where the performance will be updated weekly.
Appendix
Current Holdings (as of 10/22/2020)
Ticker |
Name |
MktCap |
Days Held |
Yield % |
Sector |
| ETR | Entergy Corp. | 21 B | 170 | 3.48 | UTIL |
| EXC | Exelon Corp | 41 B | 198 | 3.63 | UTIL |
| PEG | Public Service Enterprise Group Inc | 30 B | 2 | 3.29 | UTIL |
| PNW | Pinnacle West Capital Corp | 9 B | 37 | 3.74 | UTIL |
| SRE | Sempra Energy | 38 B | 58 | 3.23 | UTIL |
Disclaimer:
All results shown are hypothetical and the result of backtesting over the period 2000 to 2020. No claim is made about future performance.
Leave a Reply
You must be logged in to post a comment.