
- This trading strategy with five stocks from those of ETF (XLK), mainly with a dividend yield greater than that of the S&P 500 index, produces much higher returns than XLK.
- The universe from which stocks are selected holds point-in-time, the S&P 500 technology stocks of FactSet’s Reverse Business Industry Classification System and some electronic payments industry stocks, similar to XLK.
- The model ranks the stocks of this custom universe with the Portfolio 123 “Greenblatt” ranking system and selects periodically the highest ranked stocks which also satisfy the stipulated yield requirement.
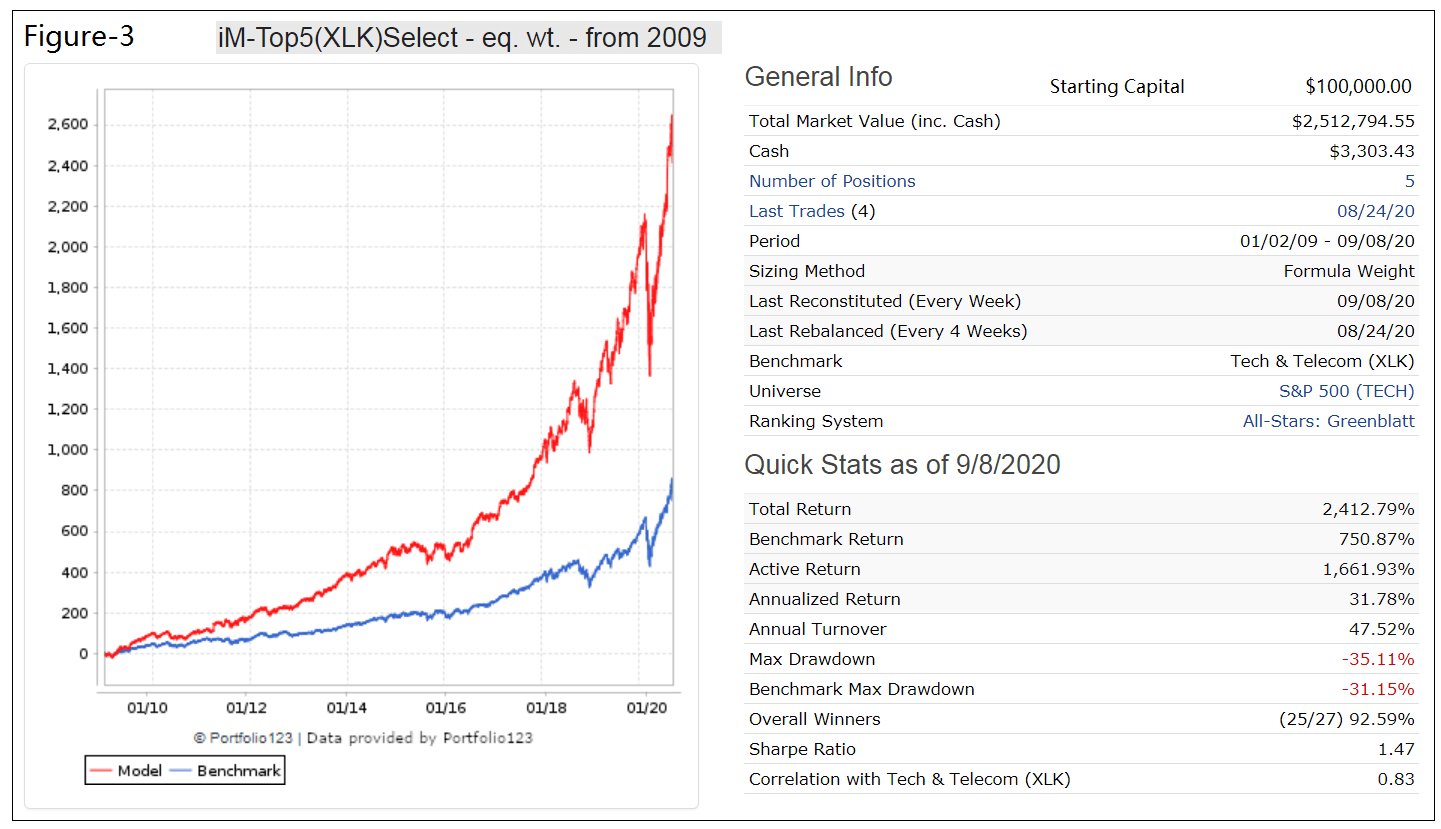
- From 1/2/2009 to 9/8/2020 this strategy would have produced an annualized return (CAGR) of 31.8%, significantly more than the 20.1% CAGR of XLK over this period.
Emulating the Technology Select Sector SPDR Fund (XLK).
The analysis was performed on the on-line portfolio simulation platform Portfolio 123.
According to the Technology Select Sector SPDR Fund’s fact sheet the fund is composed of S&P 500 companies primarily involved in such industries as software and services, IT consulting services, semiconductor equipment, computer and peripherals. As of Sep-10-2020 total assets under management were $34,430 M. Holdings of XLK are cap-weighted, which is reflected in two of its 71 holdings, Apple and Microsoft, having a weight of 45%, meaning that XLK has $15,335 M in those two stocks alone.
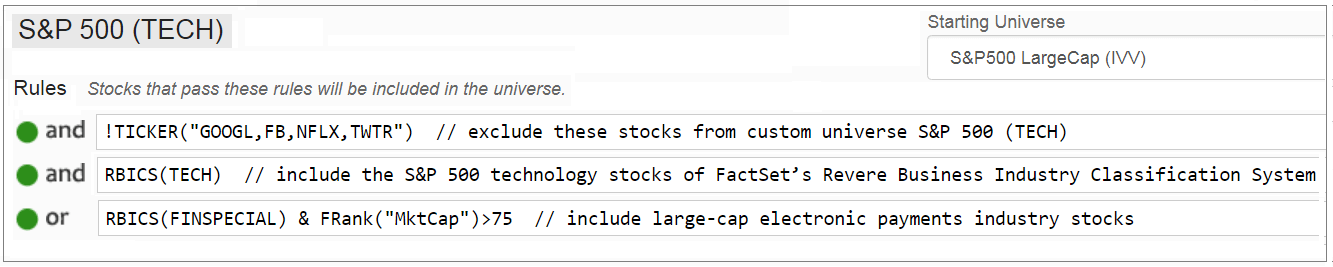
Since historic holdings of XLK are not published, a custom universe was constructed from the technology stocks of FactSet’s Revere Business Industry Classifications System, together with some electronic payments industry stocks. All stocks must also be included in the S&P 500 index.
The simple rules to set up the custom universe “S&P 500 (TECH)” in Portfolio 123 are shown below. Note that the high-growth stocks – Facebook (FB), Netflix (NFLX) and Google-owner Alphabet (GOOGL) are excluded. Also Amazon (AMZN) is not included because it is not classified as a tech stock.
Backtesting of S&P 500 (TECH) universe
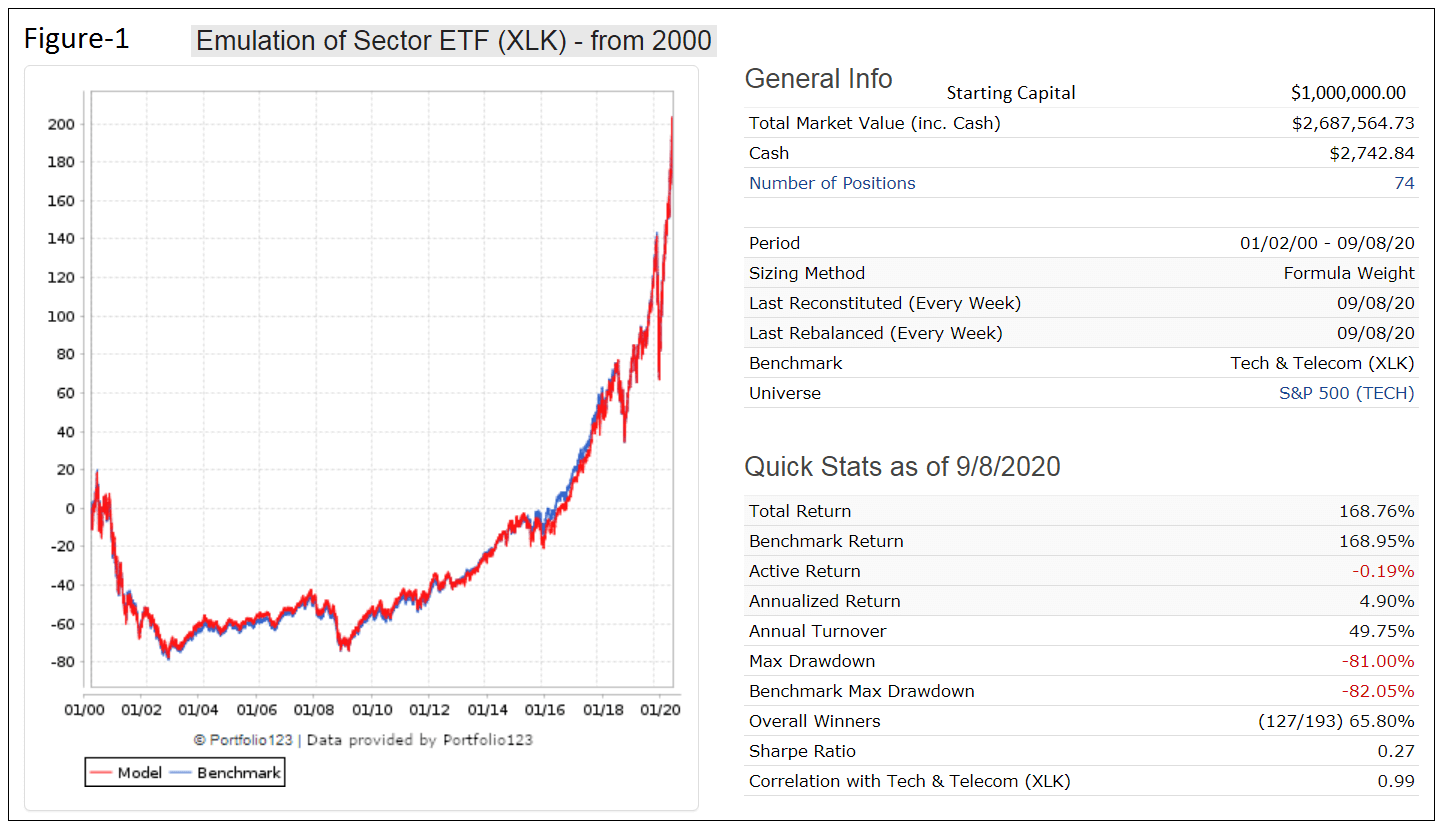
A backtest of the custom universe from 1/2/2000 to 9/8/2020 shows a 99% correlation with the performance of benchmark XLK and identical total returns of 169% over this period. The current 10 largest holdings of the backtest also coincide with what is published for XLK, with small variations in weights. A management fee of 1.0% was taken into account in the simulation, higher than the 0.13% fee that the managers of XLK currently apply.
The annualized return of XLK over the backtest period was only 4.9% and the maximum drawdown was over 80% as one can see from the statistics in the Figure-1 below, where the red graph depicts the performance of the custom universe and the blue graph (mostly hidden) the performance of XLK.
Thus, one can confidently conclude that the custom universe S&P 500 (TECH) reflects reasonably accurately the performance of the cap-weighted holdings of XLK over the backtest period, and stocks selected should not differ by much from what would have been selected from a universe of XLK’s actual historic holdings.
Trading 5 stocks from the custom universe S&P 500 (TECH)
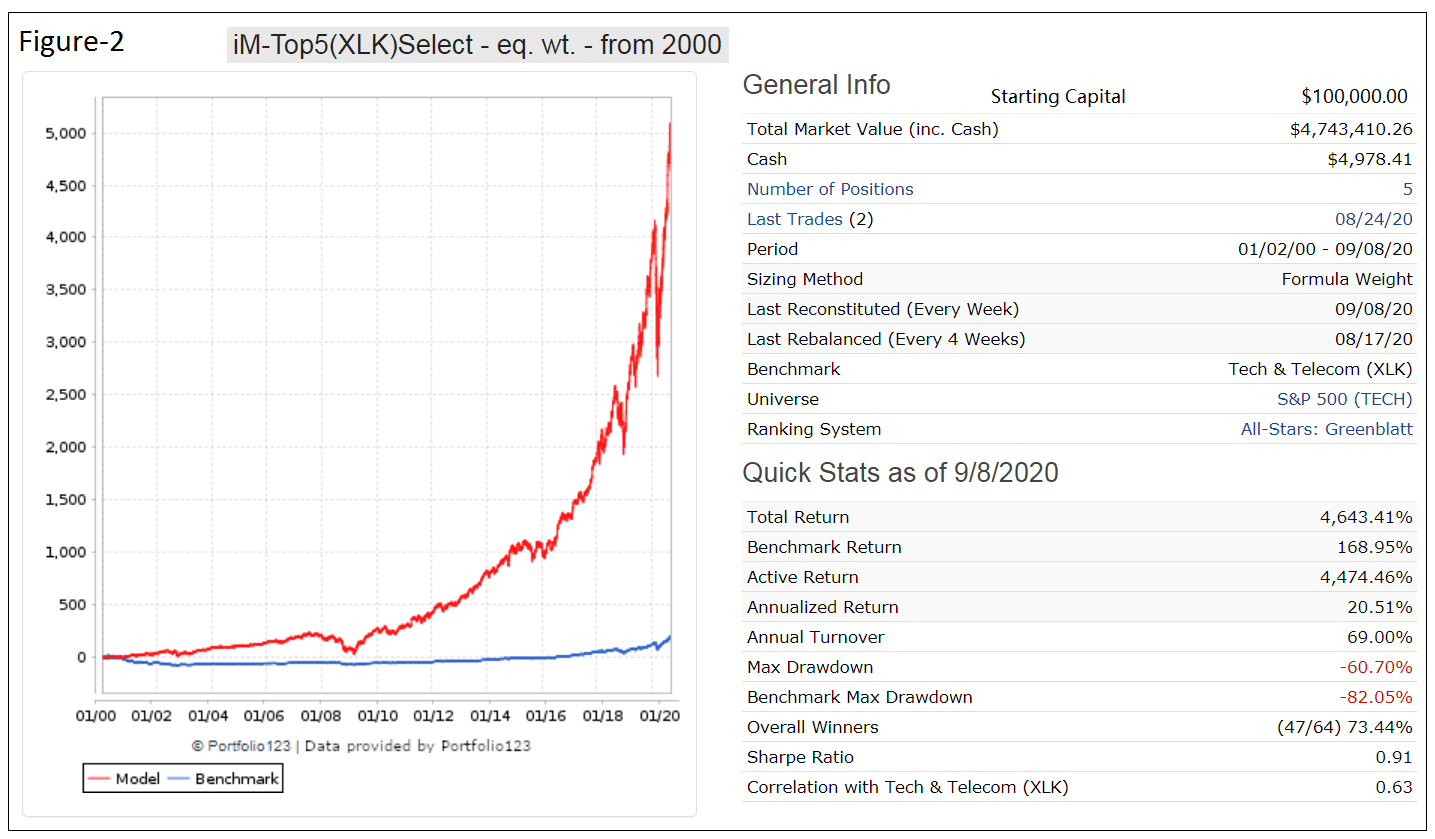
The iM-Top5(XLK)Select trading strategy invests periodically in only five equal weighted stocks from the custom universe S&P 500 (TECH) selected by the Portfolio 123 “Greenblatt” two variable ranking system.
The only buy rule requires tech-stocks to have a dividend yield greater than that of the S&P 500 index. The financial stocks are not subject to this constraint. Also there is only one rank based sell rule and a specified minimum holding period of 6 weeks.
Figure-2 shows the simulated performance of this strategy from 1/2/2000 to 9/8/2020 and also that of the benchmark XLK. The model shows an annualized return of over 20% (XLK produced 4.9%) and a low annual turnover of about 70%. Trading costs of 0.12% of each trade amount were assumed.
Tech-stocks have performed well since 2009, with XLK showing a 20.1% annualized return for the period 1/2/2009 to 9/8/2020 versus 13.8% for the S&P 500 ETF (SPY). The simulated performance of the trading strategy for the same period is shown in Figure-3. Again the model outperformed XLK; the backtest shows an annualized return of over 30% and a low annual turnover of about 50%.
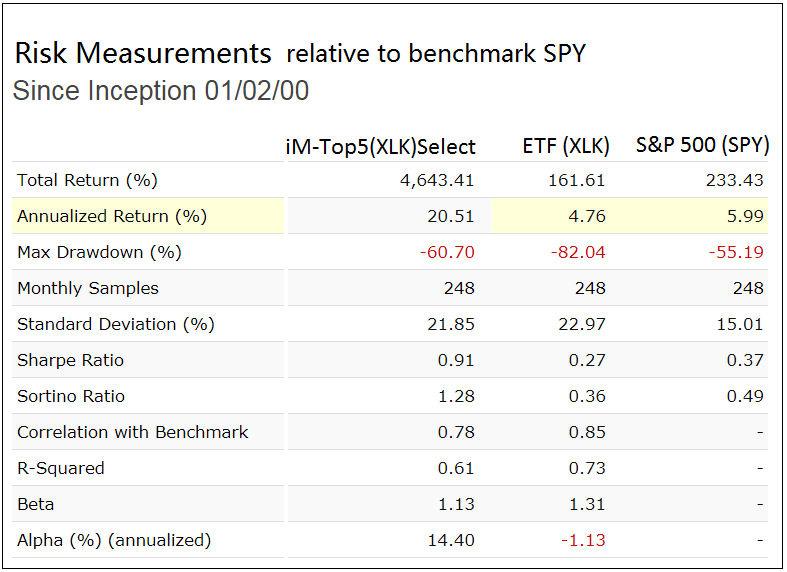
Investment Risk
The investment risk of this 5-stock portfolio should be similar or less than holding XLK which currently has 45% of its assets in only two stocks. If Apple and Microsoft continue to increase their market capitalization relative to the remainder of the ETF’s holdings then this percentage will increase further. That is not a desirable risk situation.
In the table below are the risk statistics from 2000 to 2020 for the model and XLK relative to the benchmark S&P 500 (SPY). It is evident from the risk measures that the trading strategy carries less risk than investing in XLK over the longer term.
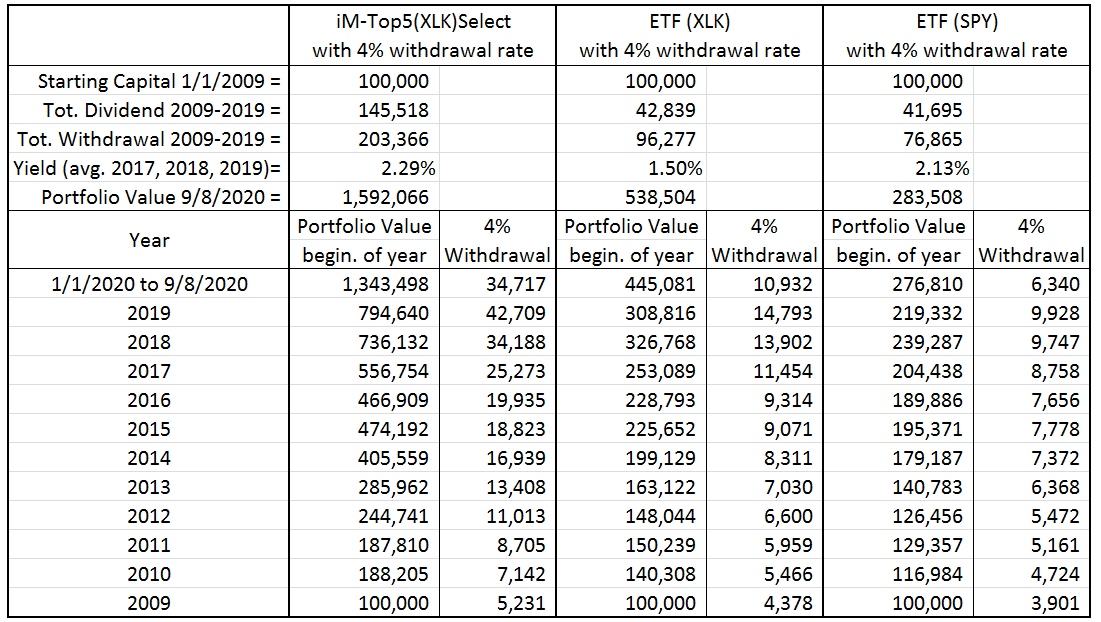
Performance comparison with 4% withdrawal rate
The table below compares the annual withdrawal amounts and portfolio values for the trading strategy, XLK, and SPY assuming an initial investment of $100,000 at the beginning of 2009 and annual withdrawals of 4.0% of portfolio value.
As expected, the yield of the trading strategy is similar to that of SPY. Total withdrawals and end portfolio value for the trading strategy are about twice and three times, respectively, that of XLK.
Conclusion
The analysis shows that the iM-Top5(XLK)Select investment strategy would have produced excellent returns, much preferable to a buy-and-hold investment strategy of stock index funds such as XLK or SPY. Reasonably high withdrawal rates should be possible without depleting the investment.
Minimum trading is required. The model shows a low average annual turnover of about 50% with a position held on average for 18 months and not shorter than 6 weeks. The current holdings are listed in the appendix.
This model can easily be reproduced on Portfolio 123 from the information provided here. Also at iMarketSignals one can follow this strategy where the performance will be updated weekly.
Appendix
Current Holdings (as of 9/15/2020)
Ticker |
Name |
MktCap |
Days Held |
Sector |
| CSCO | Cisco Systems Inc | 171 B | 1716 | Technology |
| LRCX | Lam Research Corp | 44 B | 792 | Technology |
| NLOK | NortonLifeLock Inc | 12 B | 43 | Technology |
| NTAP | NetApp Inc | 10 B | 22 | Technology |
| V | Visa Inc | 444 B | 7 | Technology |
Disclaimer:
All results shown are hypothetical and the result of backtesting over the period 2000 to 2020. No claim is made about future performance.
Leave a Reply
You must be logged in to post a comment.