
- This 5-stock trading strategy with the Healthcare Sector stocks of the S&P 500 produces much higher returns than the Healthcare Select Sector SPDR Fund (XLV).
- The universe from which stocks are selected holds point-in-time, the S&P 500 healthcare stocks of FactSet’s Reverse Business Industry Classification System.
- The model ranks the stocks of this custom universe with the Portfolio123 “Greenblatt” ranking system and selects periodically the highest ranked stocks which also satisfy stipulated industry and yield requirements.
- From 1/2/2009 to 9/28/2020 this strategy would have produced an annualized return (CAGR) of 23.6%, significantly more than the 13.8% CAGR of XLV over this period.
This previous article described a profitable trading strategy with the stocks of the Technology Select Sector SPDR Fund (XLK), and this article described a strategy with the consumer staple stocks (XLP) of the S&P 500. Similarly, the healthcare stocks of the S&P 500 can be profitably traded to provide good returns.
Emulating the Healthcare Select Sector SPDR Fund (XLV).
The analysis was performed on the on-line portfolio simulation platform Portfolio 123.
Since historic holdings of XLV are not published, a custom universe was constructed from the S&P 500 healthcare stocks of FactSet’s Revere Business Industry Classifications System.
The rule to set up the custom universe “S&P 500 (HEALTH)” in Portfolio 123 is: RBICS(HEALTHCARE).
The current holdings (61 stocks) of S&P 500 (HEALTH) are almost identical to the current holdings of XLV (63 stocks).
Backtesting of S&P 500 (HEALTH) universe
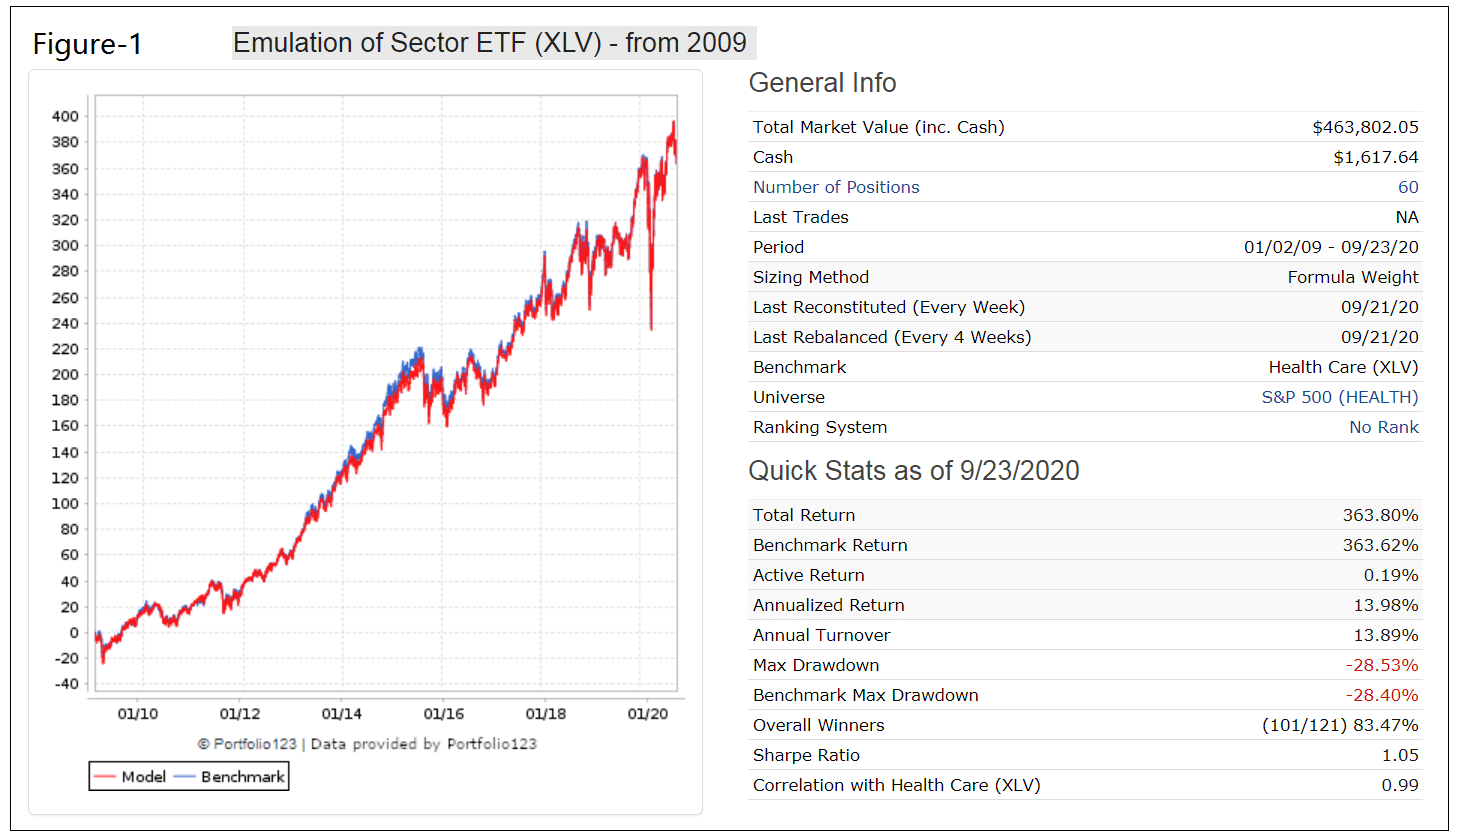
A backtest from 1/2/2009 to 9/23/2020 with all the cap-weighted stocks in the custom universe shows a 99% correlation with the performance of benchmark XLV and identical total returns of 364% over this period. A management fee of 0.3% was taken into account in the simulation, a bit higher than the 0.13% fee that the managers of XLV currently apply. In the Figure-1 below, the red graph depicts the performance of the custom universe and the blue graph (mostly hidden) the performance of XLV.
From the beginning of 2000 the custom universe shows 82% correlation with the performance of benchmark XLV and a total return of 355% versus 348% for XLV.
One can therefore expect that the custom universe S&P 500 (HEALTH) should reasonably accurately reflect the performance of the cap-weighted holdings of XLV, and stocks selected by the model should not differ much from what would have been selected from a universe of the actual historic holdings of XLV.
Trading 5 stocks from the custom universe S&P 500 (HEALTH)
The iM-Top5(XLV)Select trading strategy invests periodically in only five equal weighted stocks selected by the Portfolio 123 “Greenblatt” ranking system from various industries in the custom universe S&P 500 (HEALTH). The industries are:
- Bio-pharmaceuticals with a dividend yield 2% greater than that of the S&P 500 index
- Miscellaneous Healthcare
- Outsourced Development and Manufacturing Services
- Diagnostics and Drug Delivery Devices
- General Medical Devices
- Other Medical Devices
Currently there are 34 companies in the above named industries.
The buy rule is simply a listing of industries 1 to 6 above with the yield stipulation for Biopharmaceuticals.
A percentile is assigned to each stock in the universe based on the ratio Free Cash Flow Latest Quarter to Total Assets Latest Quarter, with the highest ratio in the array getting a value of 100. A position is sold only after a minimum holding period of 4 weeks if this array value gets less than 80, or if a position shows a loss after 6 weeks from when it was bought.
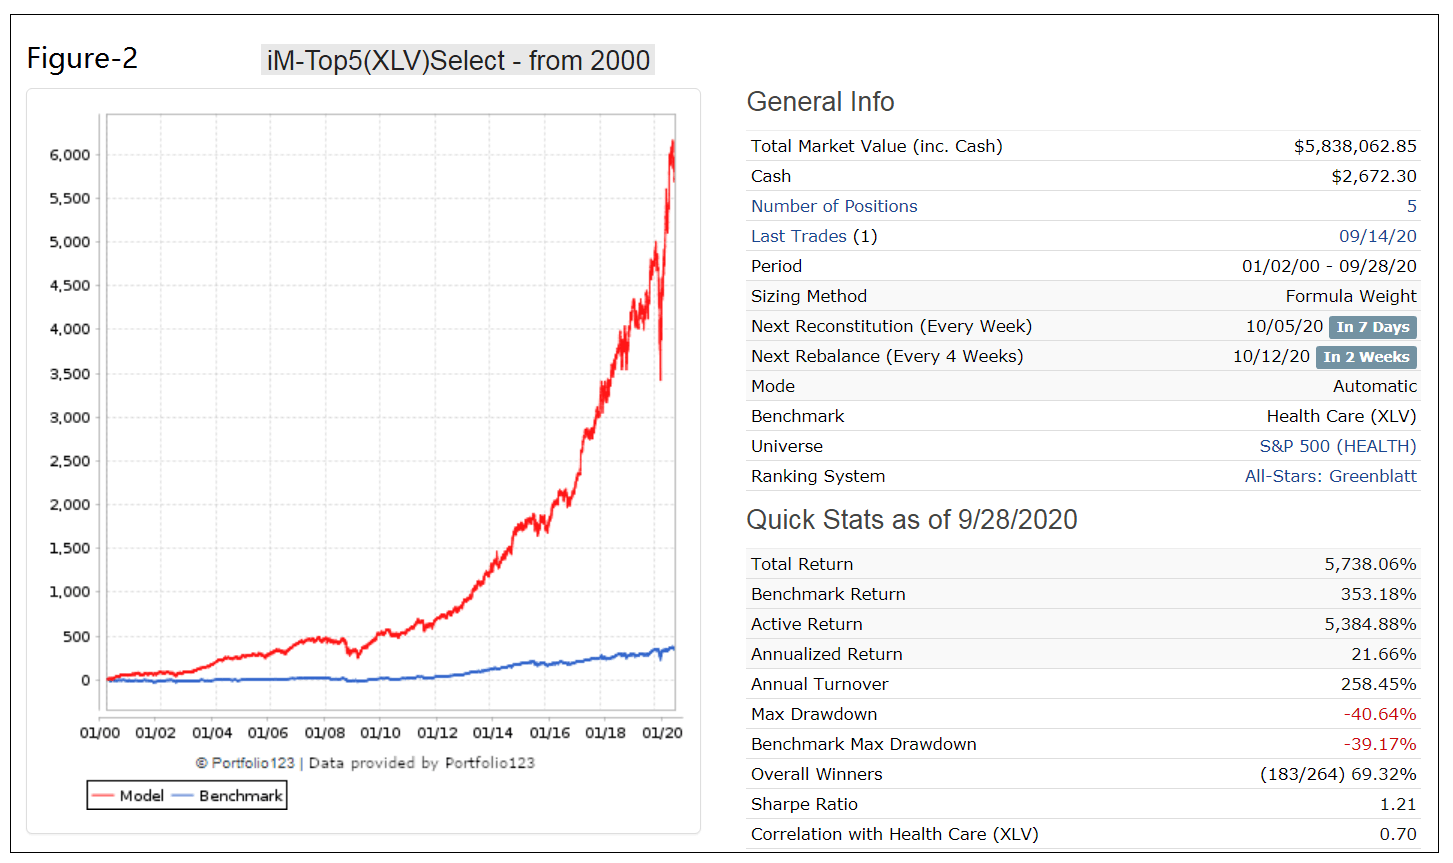
Figure-2 shows the simulated performance of this strategy from 1/2/2000 to 9/28/2020 and also that of the benchmark XLV. The model shows an annualized return of 21.7% (XLV produced 7.6%) and similar maximum drawdowns of -40%. Annual turnover is low, about 250%. Trading costs of 0.12% of each trade amount were assumed in the simulation.
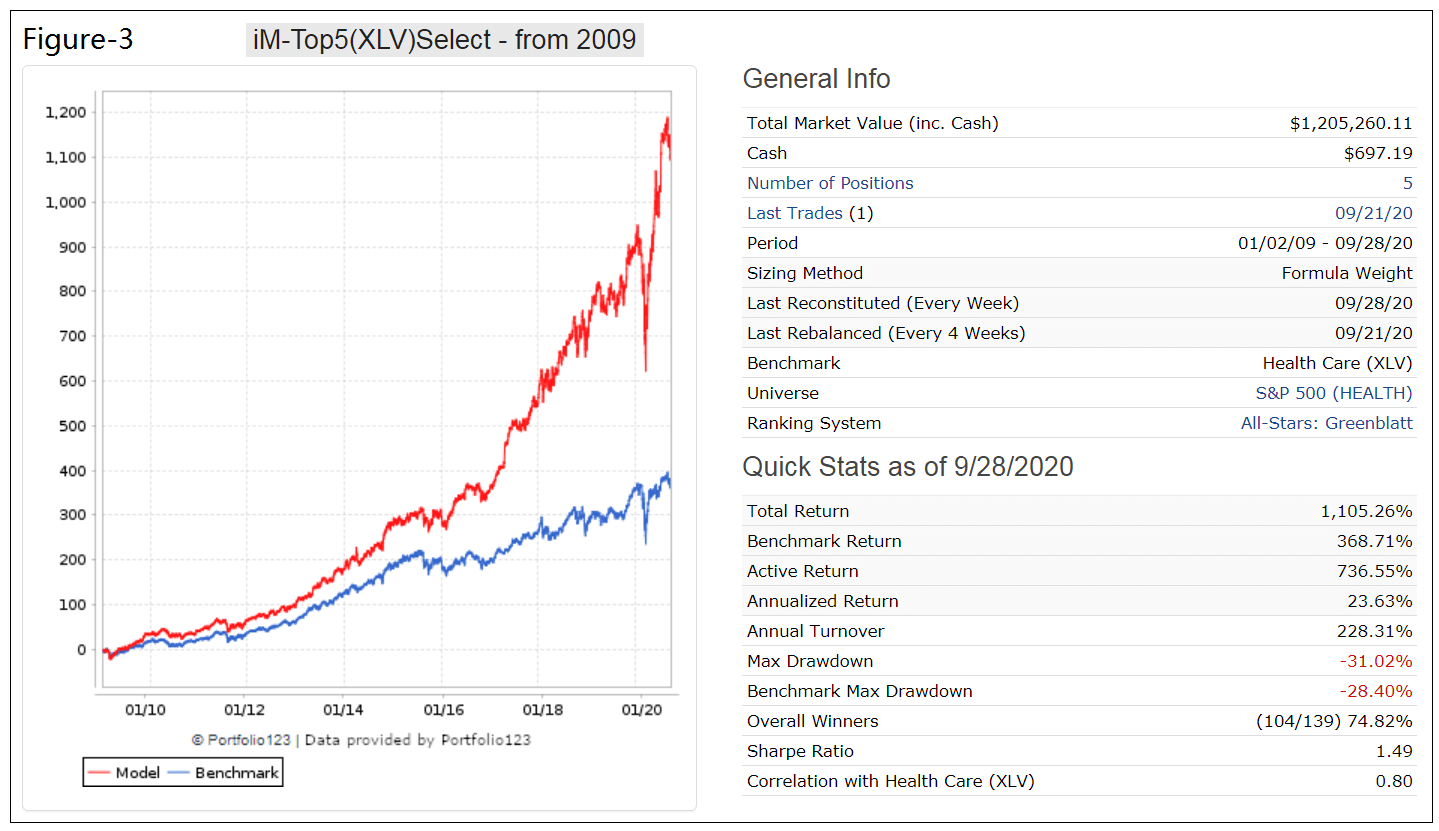
Healthcare stocks have performed reasonably well since 2009, with XLV showing a 14.1% annualized return for the period 1/2/2009 to 9/28/2020, similar to the 13.8% for the S&P 500 ETF (SPY). The simulated performance of the trading strategy for the same period is shown in Figure-3. The model outperformed XLV; the backtest shows an annualized return of over 23% and similar maximum drawdown of about -30%.
Investment Risk
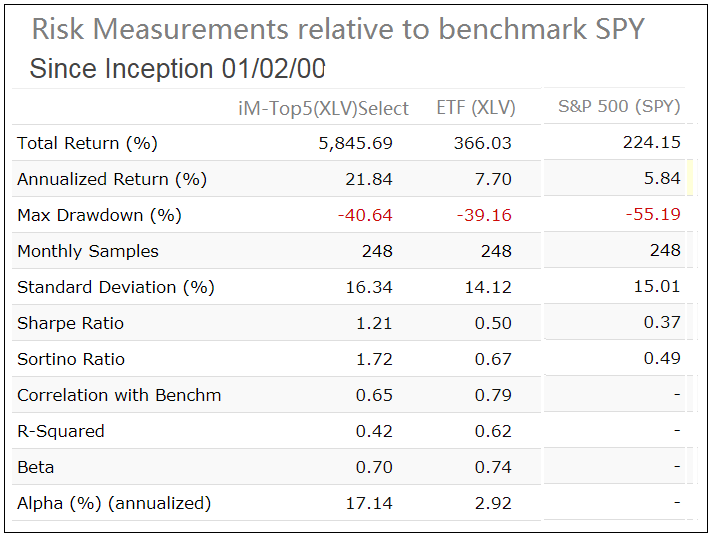
In the table below are the risk statistics from 2000 to 2020 for the model iM-Top5(XLV)Select and XLV relative to the benchmark S&P 500 (SPY). It is evident from the risk measures that the trading strategy carries less risk than investing in SPY over the longer term. However, XLV has a lower Standard Deviation signifying lower volatility, but also much lower Sharpe and Sortino ratios than the iM-Top5(XLV)Select model indicating lower performance as adjusted by the associated risks.
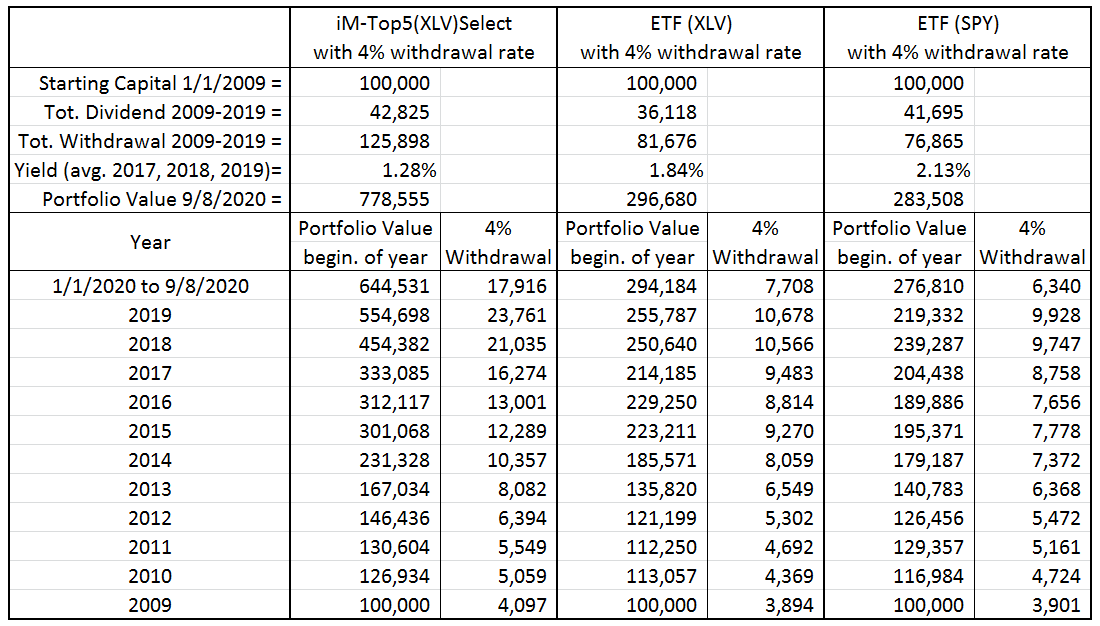
Performance comparison with 4% withdrawal rate
The table below compares the annual withdrawal amounts and portfolio values for the trading strategy, XLV and SPY assuming an initial investment of $100,000 at the beginning of 2009 and annual withdrawals of 4.0% of portfolio value.
For the model the average dividend yield over the preceding three calendar years is lower than that of XLV. Total withdrawals and end portfolio value for the trading strategy are about 1.5-times and 2.6-times, respectively, that of XLV.
Conclusion
The analysis shows that the iM-Top5(XLV)Select investment strategy would have produced excellent returns, much preferable to a buy-and-hold investment in stock index funds such as XLV or SPY. Reasonably high withdrawal rates should be possible without depleting the investment.
Moderate trading is required. The model shows a reasonable average annual turnover of about 250%, with a position held on average for 20 weeks and not shorter than 4 weeks. The current holdings are listed in the appendix.
Also, at iMarketSignals one can follow this strategy where the performance will be updated weekly.
Appendix
Current Holdings (as of 9/28/2020)
Ticker |
Name |
MktCap |
Days Held |
IndCode |
| ABBV | AbbVie Inc | 154 B | 763 | BIOPHARMASYS |
| MTD | Mettler-Toledo International Inc | 23 B | 63 | HCAREMISC |
| PFE | Pfizer Inc | 202 B | 28 | BIOPHARMAOTHER |
| RMD | Resmed Inc | 25 B | 49 | MEDDEVICESOTHER |
| WAT | Waters Corp | 12 B | 1981 | HCAREMISC |
Disclaimer:
Results shown are hypothetical and the result of backtesting over the period 2000 to 2020. No claim is made about future performance.
in your updates, seasonal XLV sector, you bought RMD twice
please check and amend
Thank you for informing us, now corrected. Also, you can always check recent trades on the Tuesday update pictures
https://imarketsignals.com/wp-content/uploads/2023/11/33-iM-Top5XLVSelect-11-14-2023.png