
- This 5-stock trading strategy with the Consumer Staples Sector stocks of the S&P 500 produces much higher returns than Consumer Staples Select Sector SPDR Fund (XLP).
- The universe from which stocks are selected holds point-in-time, the S&P 500 consumer non-cyclical stocks of FactSet’s Reverse Business Industry Classification System.
- The model ranks the stocks of this custom universe with a modified “Greenblatt” ranking system and selects periodically the highest ranked stocks which also satisfy stipulated yield requirements.
- From 1/2/2009 to 9/23/2020 this strategy would have produced an annualized return (CAGR) of 25.3%, significantly more than the 11.4% CAGR of XLP over this period.
A previous article described a profitable trading strategy with the stocks of the Technology Select Sector SPDR Fund (XLK). Similarly, the consumer staple stocks of the S&P 500 can be profitably employed to provide good returns with less risk.
Emulating the Consumer Staples Select Sector SPDR Fund (XLP).
The analysis was performed on the on-line portfolio simulation platform Portfolio 123.
Since historic holdings of XLP are not published a custom universe was constructed from the consumer non-cyclical stocks of FactSet’s Revere Business Industry Classifications System of the S&P 500 index.
The rule to set up the custom universe “S&P 500 (STAPLE)” in Portfolio 123 is: RBICS(NONCYCLICAL).
The current holdings (44 stocks) of S&P 500 (STAPLE) are similar, but not identical to the current holdings of XLK (32 stocks).
Backtesting of S&P 500 (STAPLE) universe
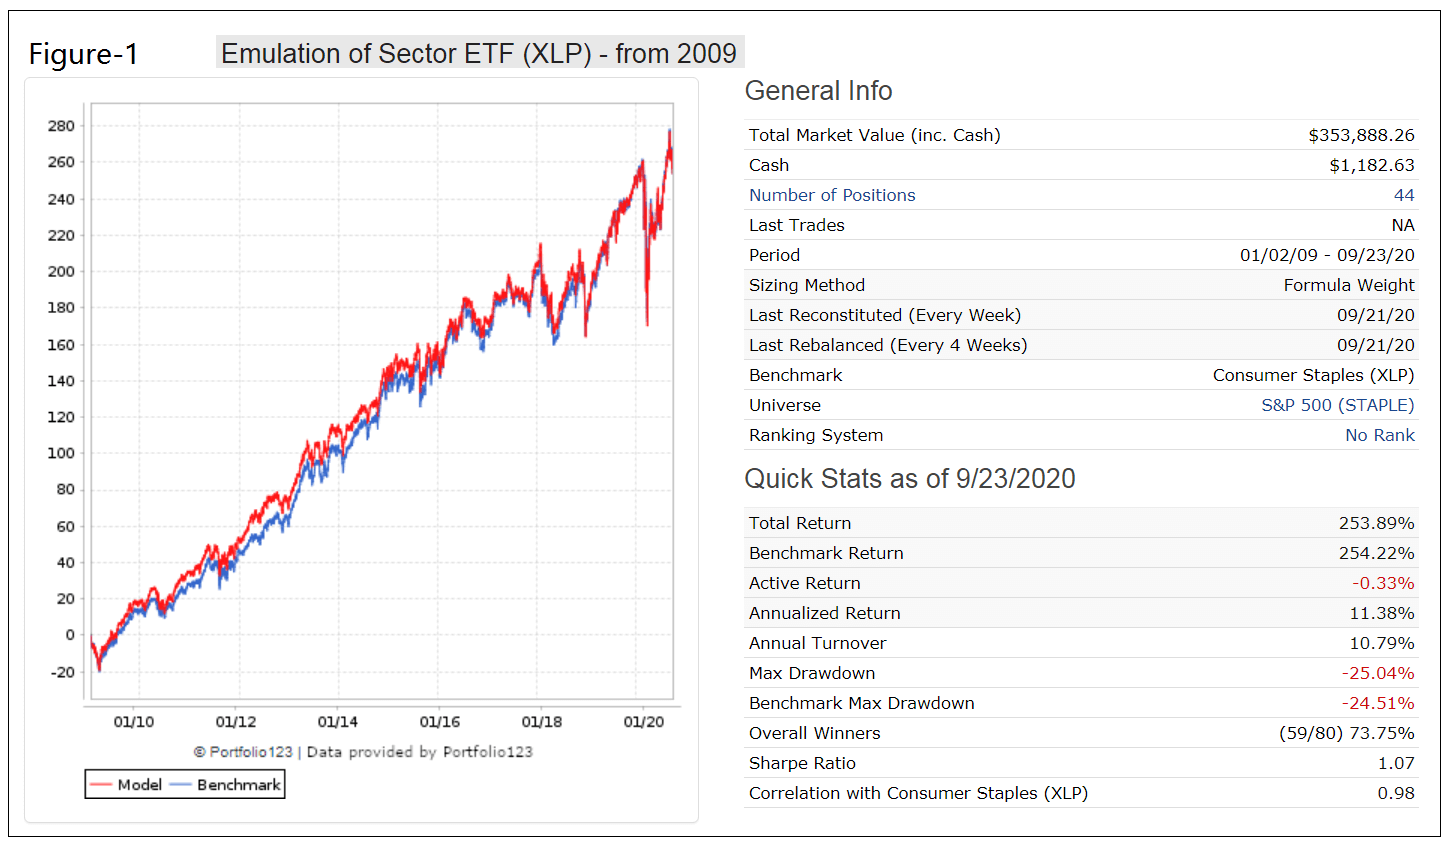
A backtest from 1/2/2009 to 9/23/2020 with all the cap-weighted stocks in the custom universe shows a 98% correlation with the performance of benchmark XLP and identical total returns of 254% over this period. A management fee of 0.6% was taken into account in the simulation, higher than the 0.13% fee that the managers of XLP currently apply. In the Figure-1 below, the red graph depicts the performance of the custom universe and the blue graph (partly hidden) the performance of XLP.
From the beginning of 2000 the custom universe shows a 91% correlation with the performance of benchmark XLP and a total return of 364% versus 338% for XLP.
One can therefore expect that the custom universe S&P 500 (STAPLE) should reasonably accurately reflect the performance of the cap-weighted holdings of XLP, and stocks selected by the model should not differ much from what would have been selected from a universe of XLP’s actual historic holdings.
Trading 5 stocks from the custom universe S&P 500 (STAPLE)
The iM-Top5(XLP)Select trading strategy invests periodically in only five equal weighted stocks from the custom universe S&P 500 (STAPLE) selected by a modified Portfolio 123 “Greenblatt” ranking system together with two quality-ranking systems which factors in Profit Margins, Turnover, Returns on Capital, and Financial Strength.
A percentile is assigned to each stock in the universe S&P 500 (STAPLE) based on dividend yield, with the top yielding stock in the array getting a value of 100. The buy rules require stocks to have an array value greater than 20; i.e. stocks in the lowest dividend yield quintile are not considered for selection. Additionally, a stock’s dividend yield must be greater than 1.0% and less than 6.0% to qualify.
A percentile is also assigned to each stock in the universe based on the ratio Free Cash Flow Latest Quarter to Total Assets Latest Quarter, with the highest ratio in the array getting a value of 100. A position is sold only after a minimum holding period of 13 weeks if this array value gets less than 50, and the rank gets less than 70%, or the dividend yield exceeds 7.0%.
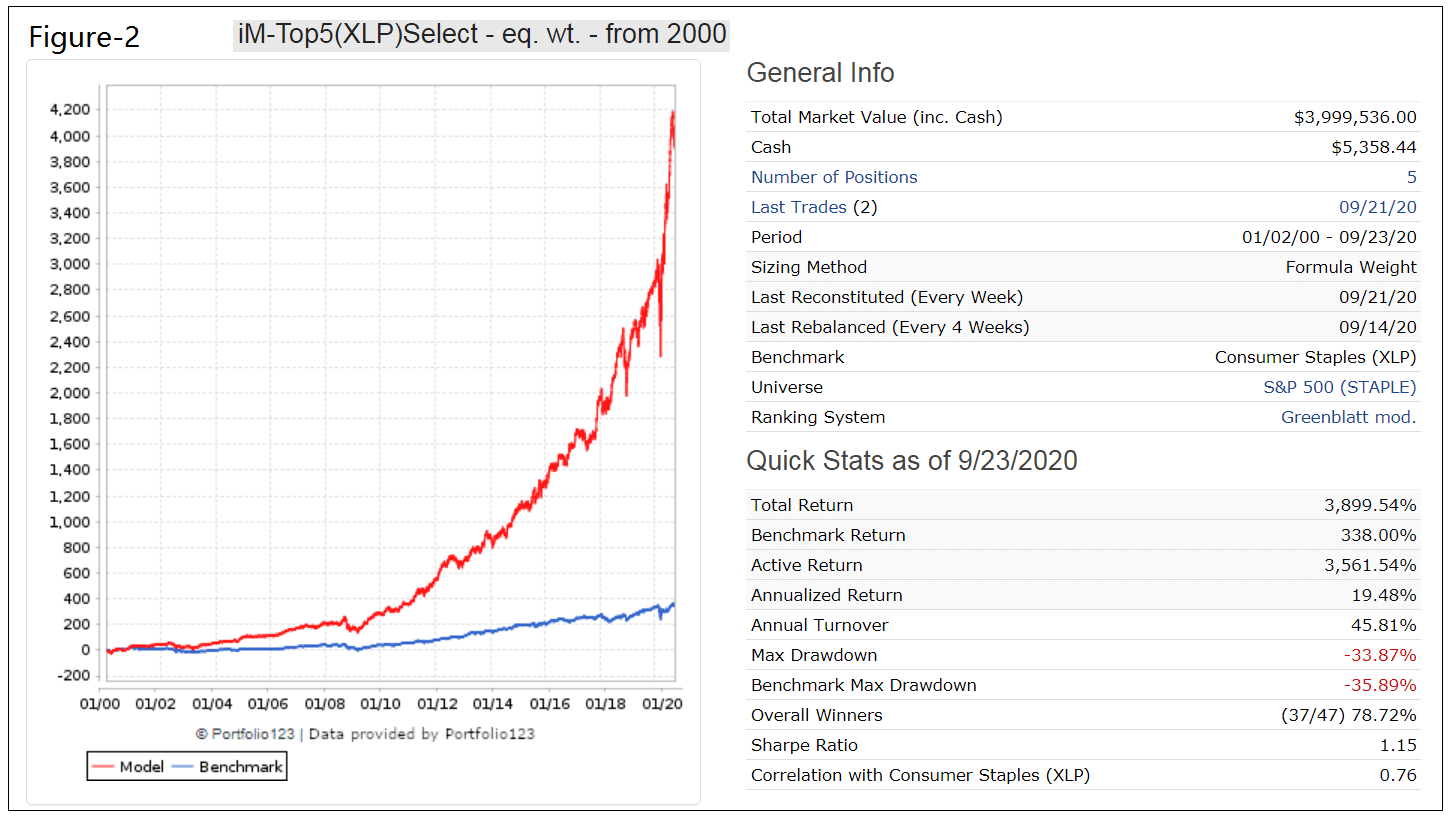
Figure-2 shows the simulated performance of this strategy from 1/2/2000 to 9/23/2020 and also that of the benchmark XLP. The model shows an annualized return of 19.5% (XLP produced 7.4%) and similar maximum drawdowns of -35%. Annual turnover is very low, about 50%. Trading costs of 0.12% of each trade amount were assumed in the simulation.
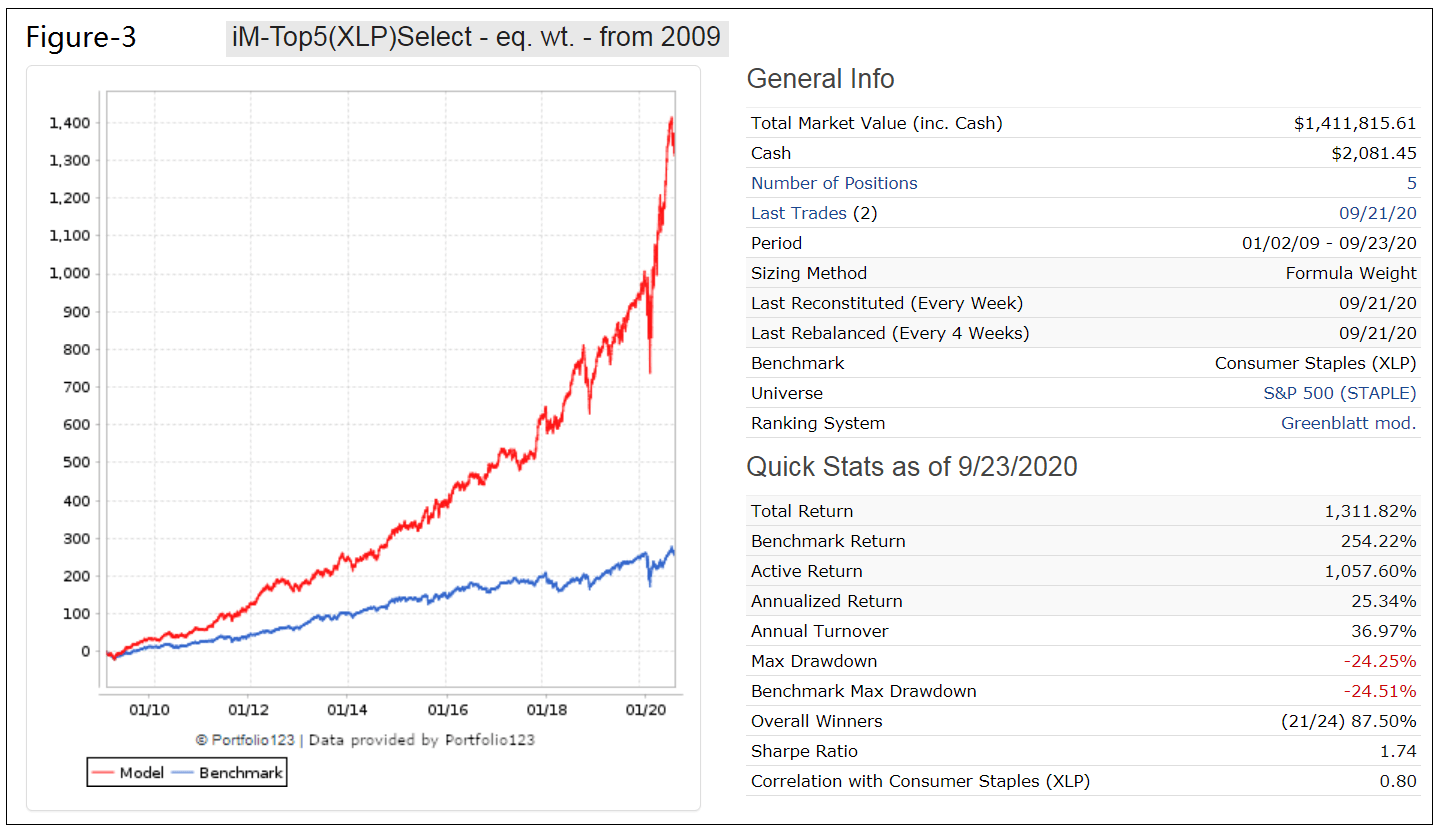
Consumer Staple stocks have performed reasonably well since 2009, with XLP showing an 11.4% annualized return for the period 1/2/2009 to 9/23/2020, not much worse than the 13.5% for the S&P 500 ETF (SPY). The simulated performance of the trading strategy for the same period is shown in Figure-3. The model outperformed XLP; the backtest shows an annualized return of over 25% and similar maximum drawdown of -25%. Annual turnover is very low, less than 40%.
Investment Risk
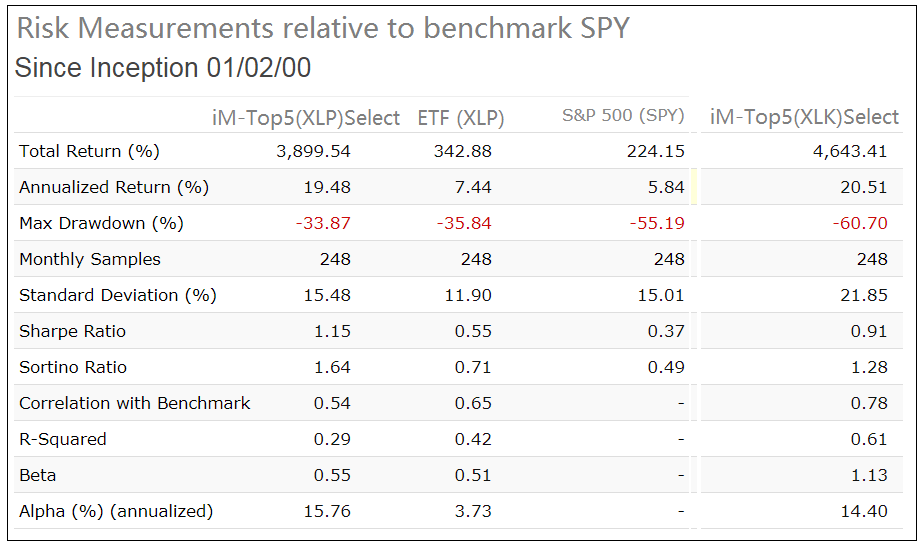
In the table below are the risk statistics from 2000 to 2020 for the model, XLP, and sister model iM-Top5(XLK)Select relative to the benchmark S&P 500 (SPY). It is evident from the risk measures that the trading strategy carries less risk than investing in SPY over the longer term. However, XLP has the lower Standard Deviation signifying lower volatility, but also much lower Sharpe and Sortino ratios than the iM-Top5(XLP)Select model indicating lower performance as adjusted by the associated risks.
It is also evident that trading the consumer staples stocks holds less risk than trading the technology sector stocks, with not much diminished performance.
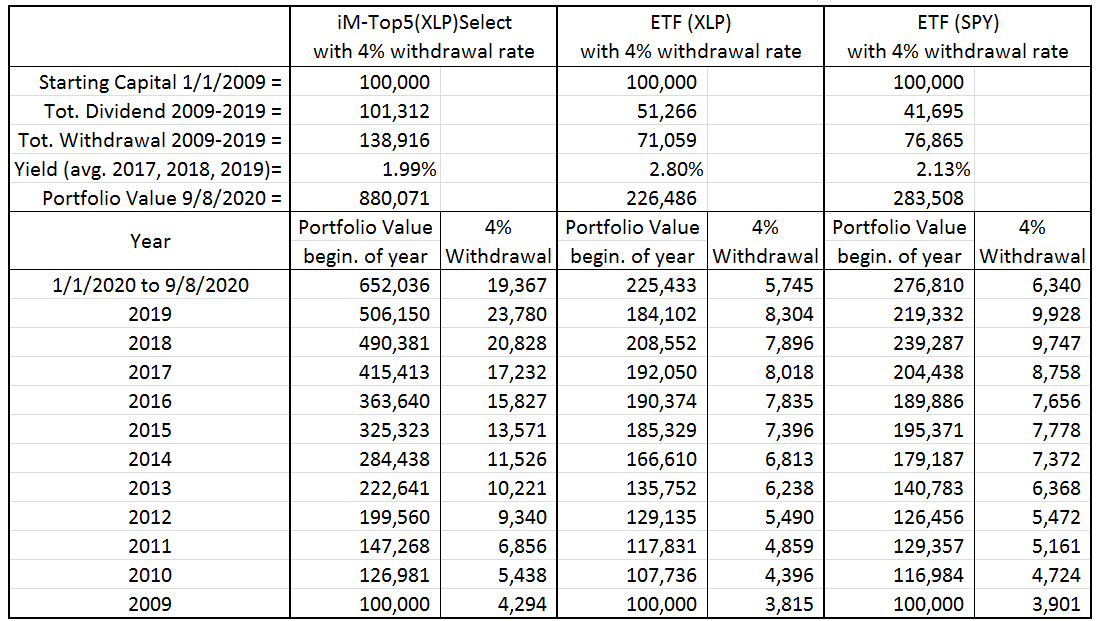
Performance comparison with 4% withdrawal rate
The table below compares the annual withdrawal amounts and portfolio values for the trading strategy, XLP and SPY assuming an initial investment of $100,000 at the beginning of 2009 and annual withdrawals of 4.0% of portfolio value.
For the model the average dividend yield over the preceding three calendar years is similar to that of SPY, but lower than that of XLP. Total withdrawals and end portfolio value for the trading strategy are about twice and four times, respectively, that of XLP.
Conclusion
The analysis shows that the iM-Top5(XLP)Select investment strategy would have produced excellent returns, much preferable to a buy-and-hold investment in stock index funds such as XLP or SPY. Reasonably high withdrawal rates should be possible without depleting the investment. Note, that the simulation results assume trading in a tax-deferred account.
Minimum trading is required. The model shows a low average annual turnover of about 50% with a position held on average for 29 months and not shorter than 13 weeks. The current holdings are listed in the appendix.
Also, at iMarketSignals one can follow this strategy where the performance will be updated weekly.
Appendix
Current Holdings (as of 9/15/2020)
Ticker |
Name |
MktCap |
Days Held |
Sector |
| CL | Colgate-Palmolive Co | 65 B | 478 | Consumer Non-Cyclicals |
| EBAY | eBay Inc. | 37 B | 2 | Consumer Non-Cyclicals |
| FBHS | Fortune Brands Home & Security Inc | 11 B | 184 | Consumer Non-Cyclicals |
| KMB | Kimberly-Clark Corp | 50 B | 226 | Consumer Non-Cyclicals |
| MAS | Masco Corp | 14 B | 590 | Consumer Non-Cyclicals |
Disclaimer:
All results shown are hypothetical and the result of backtesting over the period 2000 to 2020. No claim is made about future performance.
two questions:
1)Can you explain the “Greenblatt” ranking system a bit?
2)Can you explain the rationale behind the dividend minimum and maximum? 1%-6% seems pretty arbitrary. And would probably make no sense if the 10-year treasury note ever went much higher than today’s low rates.
You can see the Greenblatt ranking system at Portfolio 123:
https://www.portfolio123.com/app/ranking-system/90110
If you are not a subscriber to P123 you can get a trial membership for 4 weeks with the invitation code: IMARKETSIGNALS
Stocks must have a min dividend yield of 1%. The max of 6% is specified to eliminate weak companies. Over the backtest period 2000 to 2020 the 10-year Treasuries’ yield varied from 6.0% to 0.7%. So the model is not dependent on the current low yield of the 10-year note.