
  |
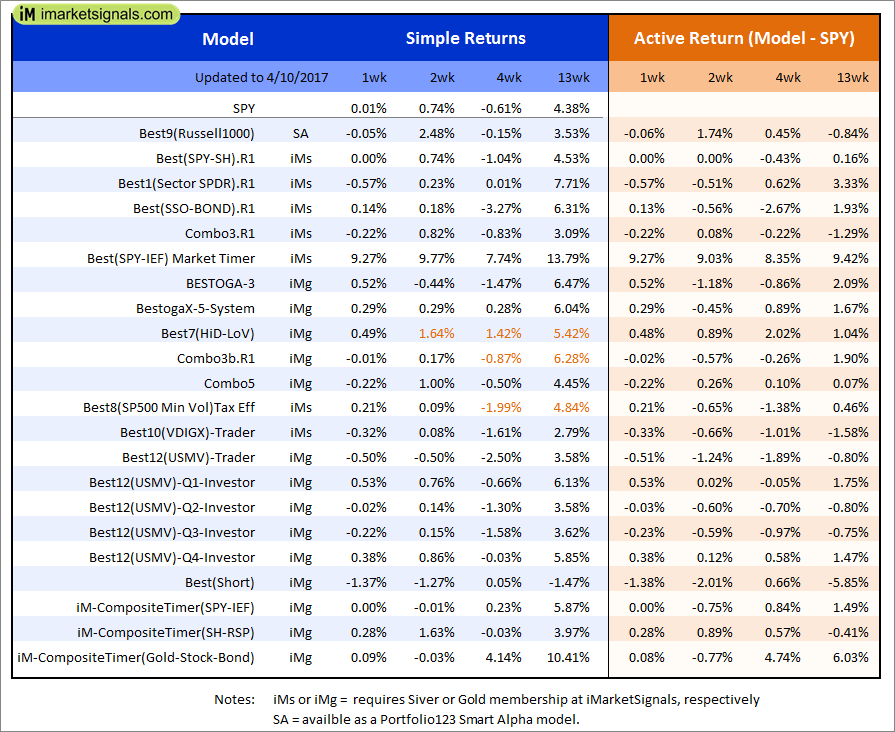
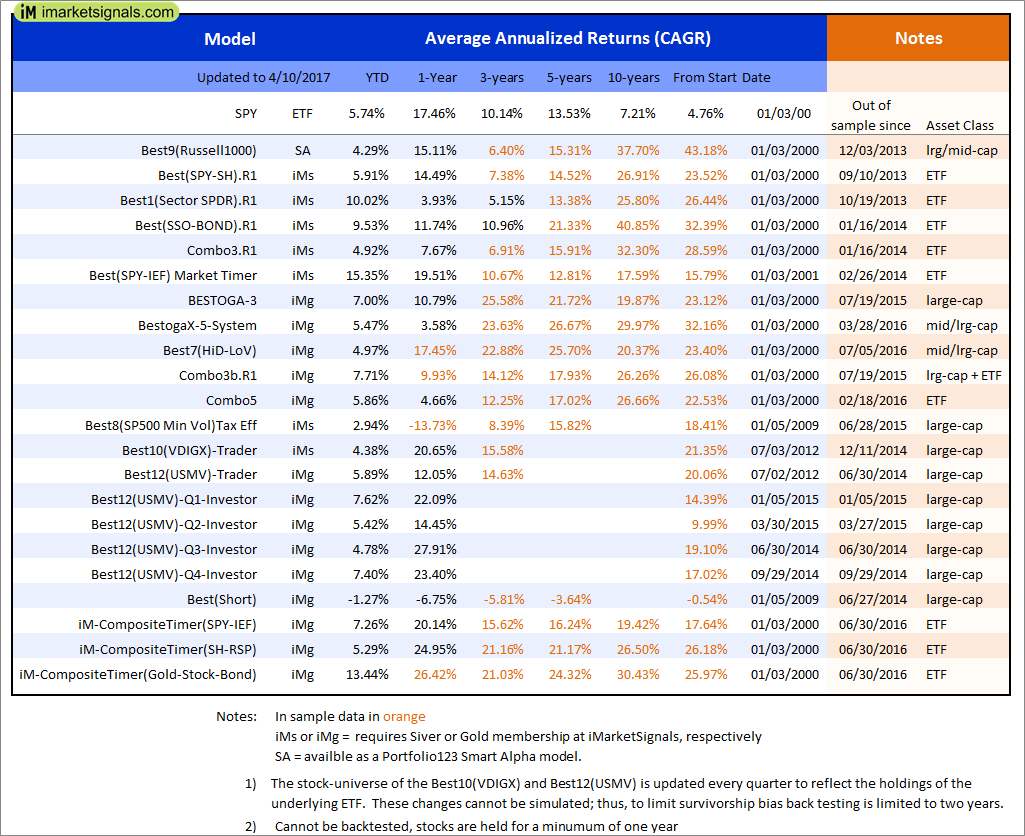
Out of sample performance summary of our models for the past 1, 2, 4 and 13 week periods. The active active return indicates how the models over- or underperformed the benchmark ETF SPY. Also the YTD, and the 1-, 3-, 5- and 10-year annualized returns are shown in the second table |
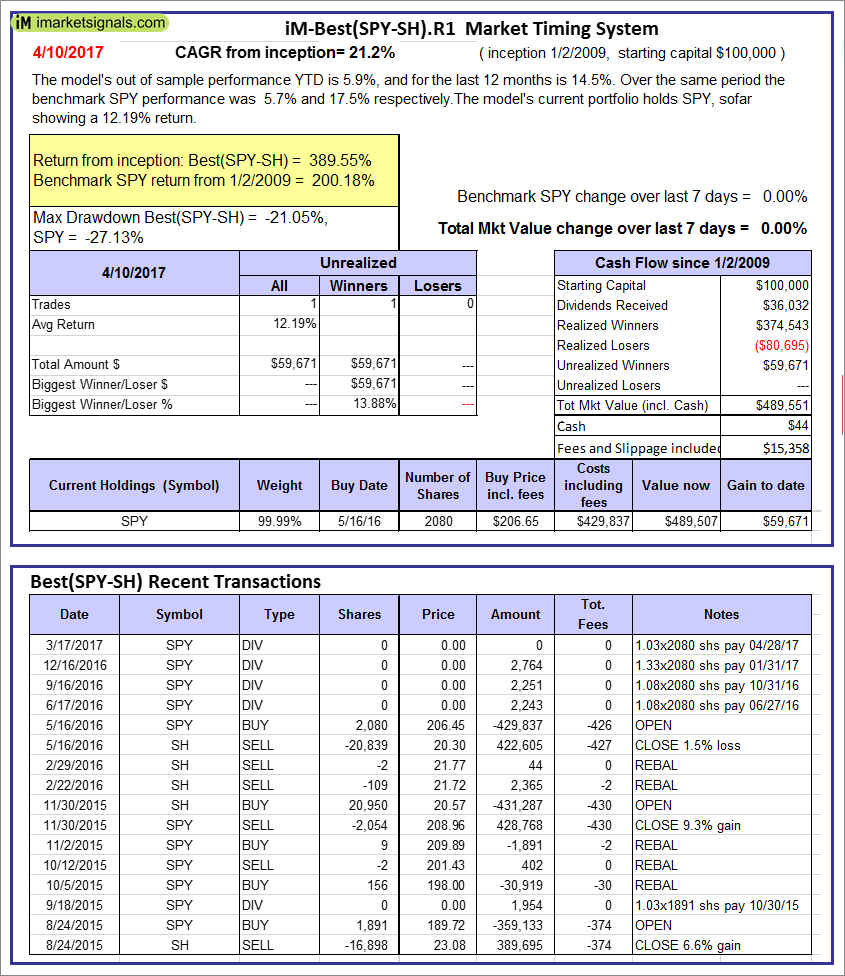 |
iM-Best(SPY-SH).R1: The model’s out of sample performance YTD is 5.9%, and for the last 12 months is 14.5%. Over the same period the benchmark SPY performance was 5.7% and 17.5% respectively. Over the previous week the market value of Best(SPY-SH) gained 0.00% at a time when SPY gained 0.00%. A starting capital of $100,000 at inception on 1/2/2009 would have grown to $489,551 which includes $44 cash and excludes $15,358 spent on fees and slippage. |
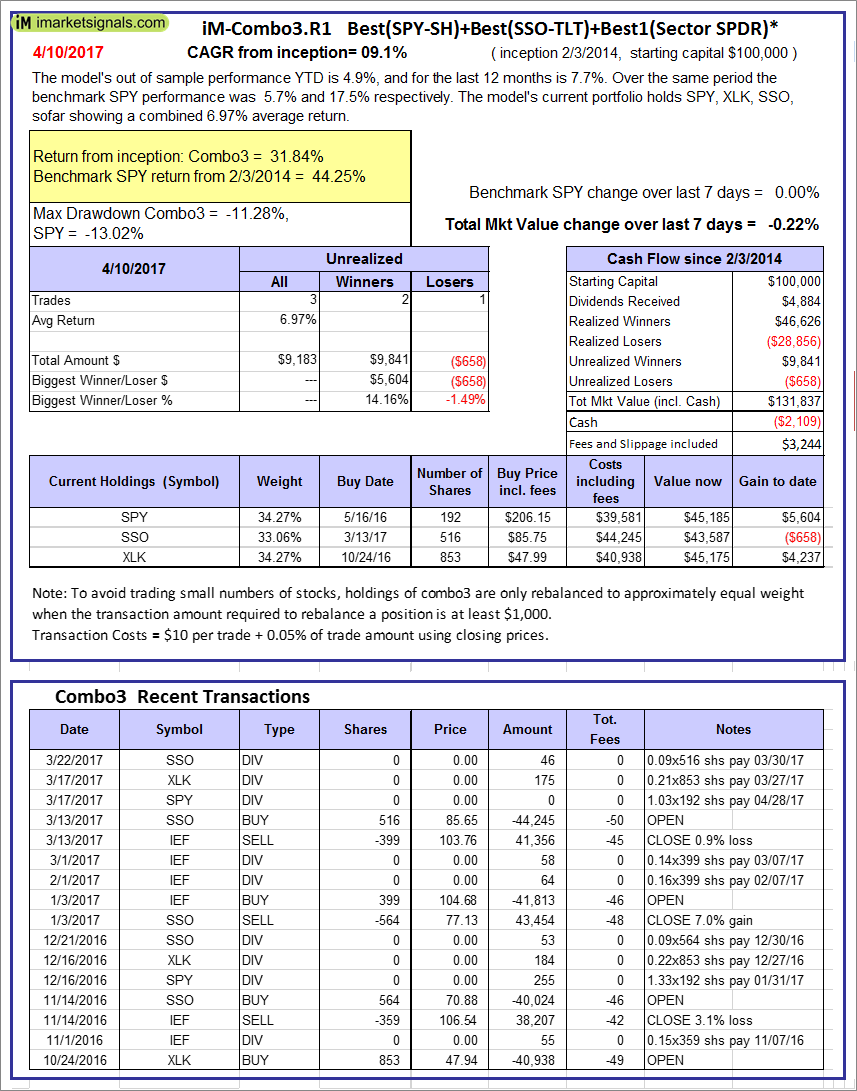 |
iM-Combo3.R1: The model’s out of sample performance YTD is 4.9%, and for the last 12 months is 7.7%. Over the same period the benchmark SPY performance was 5.7% and 17.5% respectively. Over the previous week the market value of iM-Combo3.R1 gained -0.22% at a time when SPY gained 0.00%. A starting capital of $100,000 at inception on 2/3/2014 would have grown to $131,837 which includes -$2,109 cash and excludes $3,244 spent on fees and slippage. |
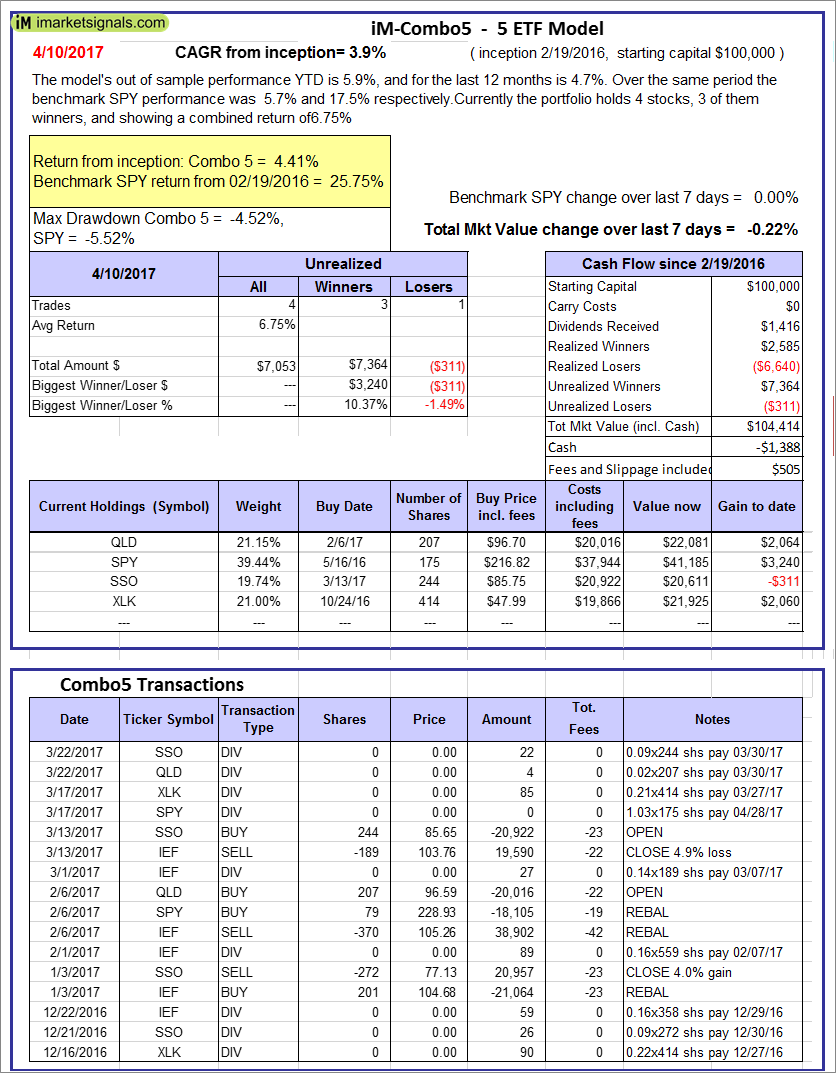 |
iM-Combo5: The model’s out of sample performance YTD is 5.9%, and for the last 12 months is 4.7%. Over the same period the benchmark SPY performance was 5.7% and 17.5% respectively. Over the previous week the market value of iM-Combo5 gained -0.22% at a time when SPY gained 0.00%. A starting capital of $100,000 at inception on 2/22/2016 would have grown to $104,414 which includes -$1,388 cash and excludes $505 spent on fees and slippage. |
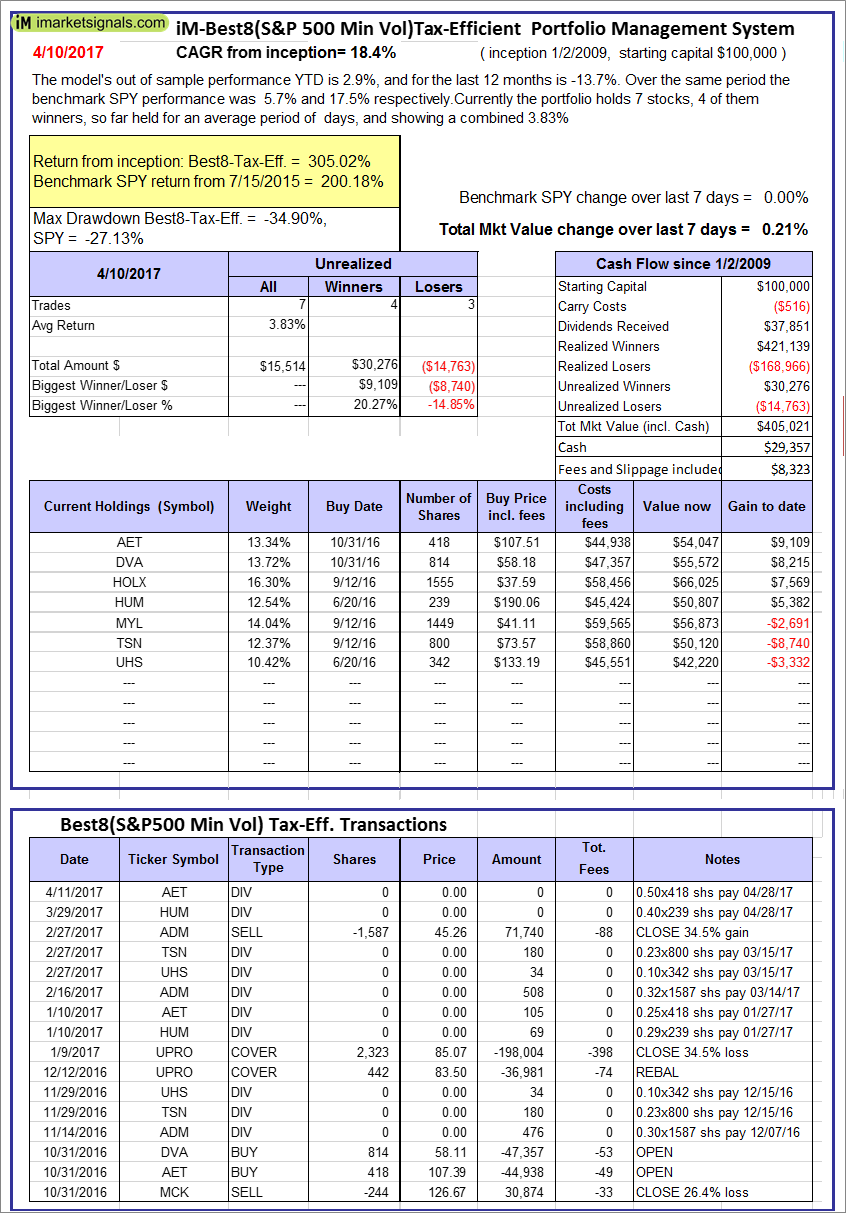 |
The iM-Best8(S&P500 Min Vol)Tax-Efficient The model’s out of sample performance YTD is 2.9%, and for the last 12 months is -13.7%. Over the same period the benchmark SPY performance was 5.7% and 17.5% respectively. Over the previous week the market value of iM-Best8(S&P 500)Tax-Eff. gained 0.21% at a time when SPY gained 0.00%. A starting capital of $100,000 at inception on 1/2/2009 would have grown to $405,021 which includes $29,357 cash and excludes $8,323 spent on fees and slippage. |
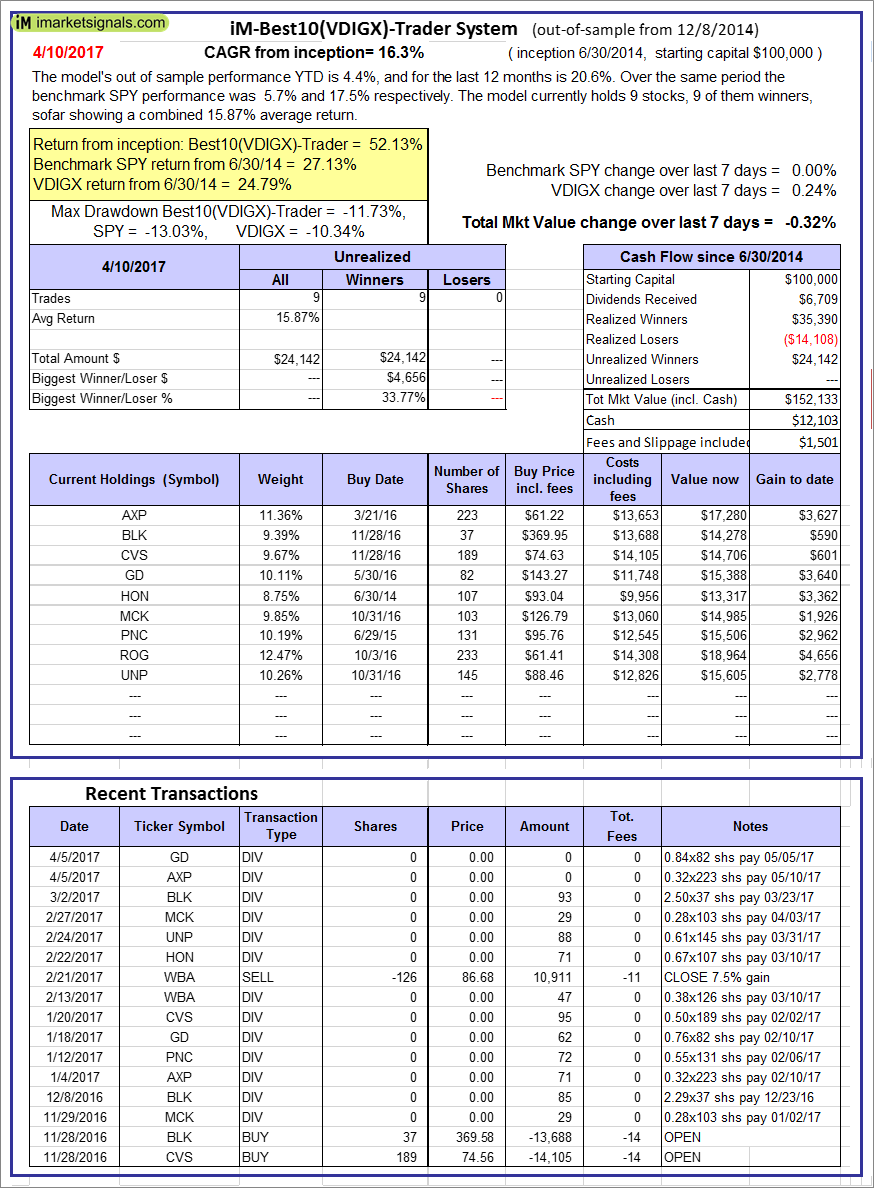 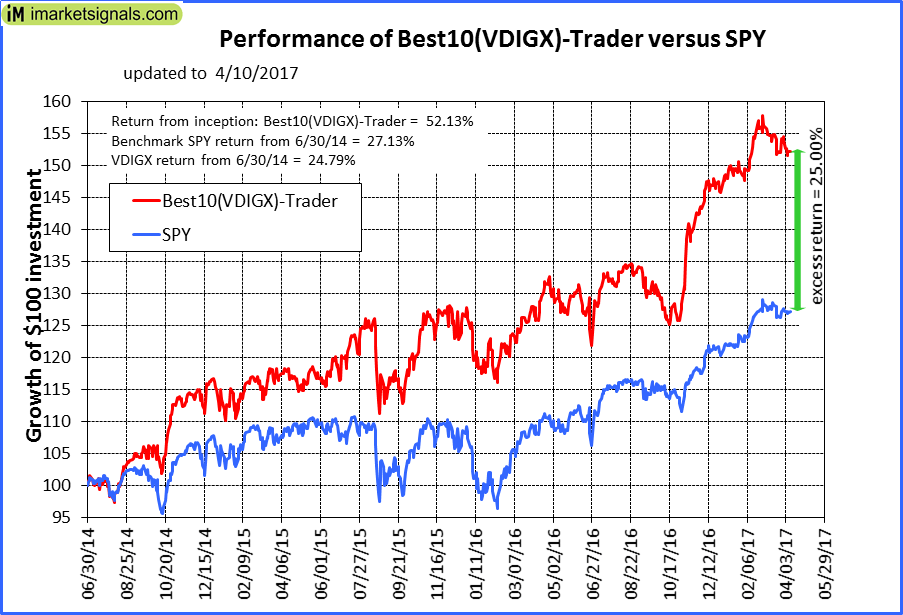 |
iM-Best10(VDIGX)-Trader: The model’s out of sample performance YTD is 4.4%, and for the last 12 months is 20.6%. Over the same period the benchmark SPY performance was 5.7% and 17.5% respectively. Since inception, on 7/1/2014, the model gained 52.13% while the benchmark SPY gained 27.13% and VDIGX gained 24.79% over the same period. Over the previous week the market value of iM-Best10(VDIGX) gained -0.32% at a time when SPY gained 0.00%. A starting capital of $100,000 at inception on 7/1/2014 would have grown to $152,133 which includes $12,103 cash and excludes $1,501 spent on fees and slippage. |
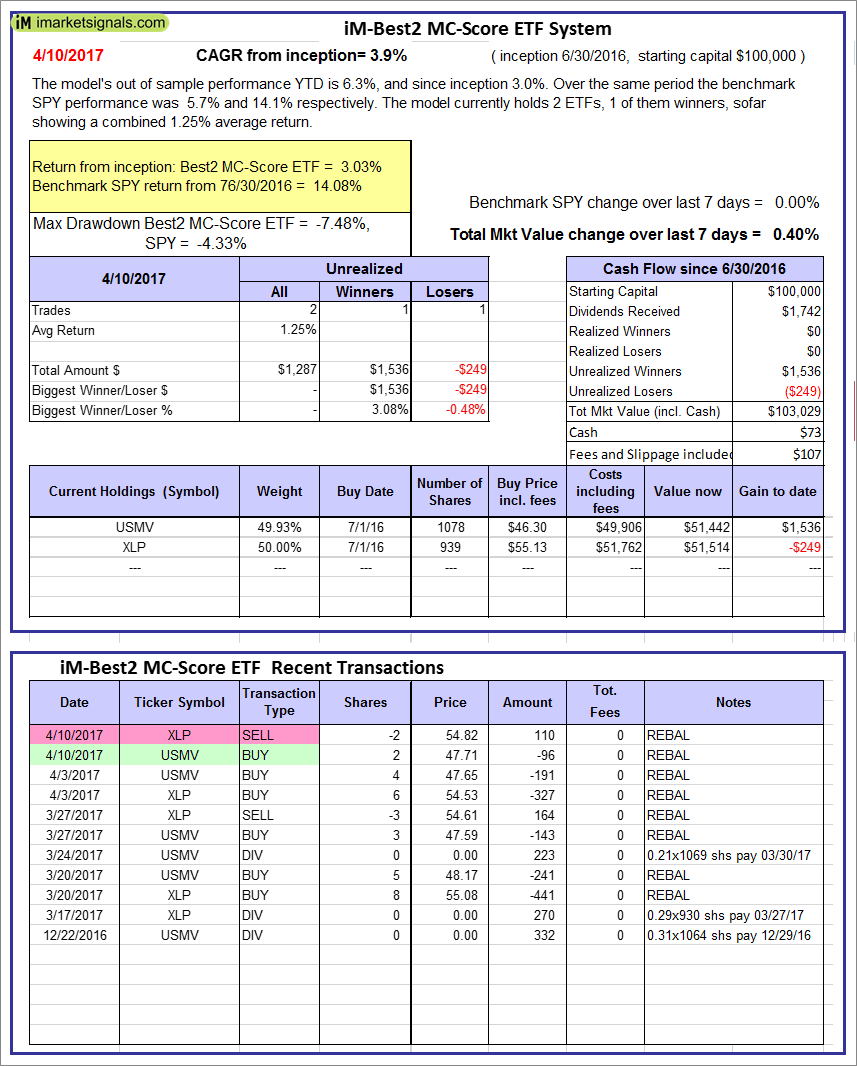 |
iM-Best2 MC-Score ETF System: The model’s out of sample performance YTD is 6.3%, and since inception 3.0%. Over the same period the benchmark SPY performance was 5.7% and 14.1% respectively. Over the previous week the market value of iM-BESTOGA-3 gained 0.40% at a time when SPY gained 0.00%. A starting capital of $100,000 at inception on 6/30/2016 would have grown to $73 which includes $107 cash and excludes Gain to date spent on fees and slippage. |
 |
iM-BESTOGA-3: The model’s out of sample performance YTD is 7.0%, and for the last 12 months is 10.8%. Over the same period the benchmark SPY performance was 5.7% and 17.5% respectively. Over the previous week the market value of iM-BESTOGA-3 gained 0.52% at a time when SPY gained 0.00%. A starting capital of $100,000 at inception on 2/3/2014 would have grown to $216,535 which includes $22,320 cash and excludes $767 spent on fees and slippage. |
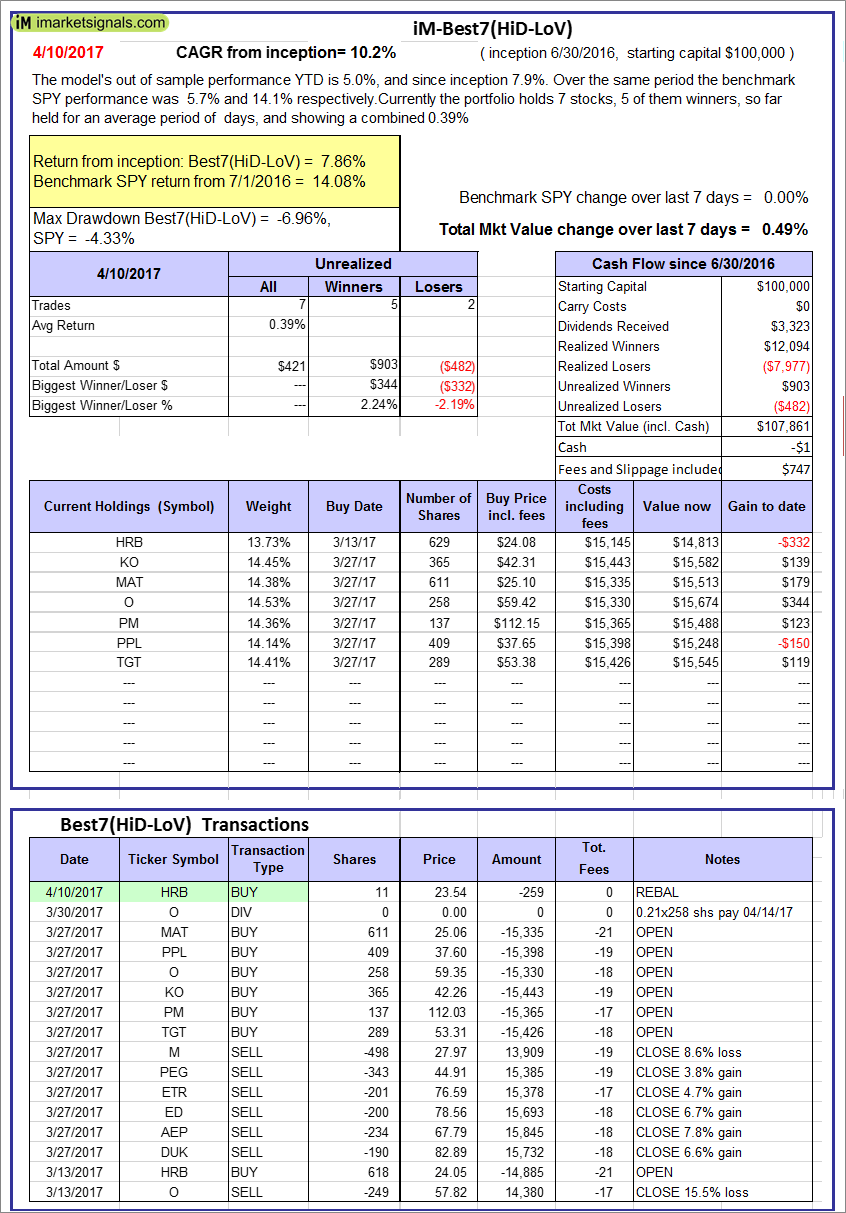 |
iM-Best7(HiD-LoV): The model’s out of sample performance YTD is 5.0%, and since inception 7.9%. Over the same period the benchmark SPY performance was 5.7% and 14.1% respectively. Over the previous week the market value of iM-BESTOGA-3 gained 0.49% at a time when SPY gained 0.00%. A starting capital of $100,000 at inception on 6/30/2016 would have grown to $107,861 which includes -$1 cash and excludes $747 spent on fees and slippage. |
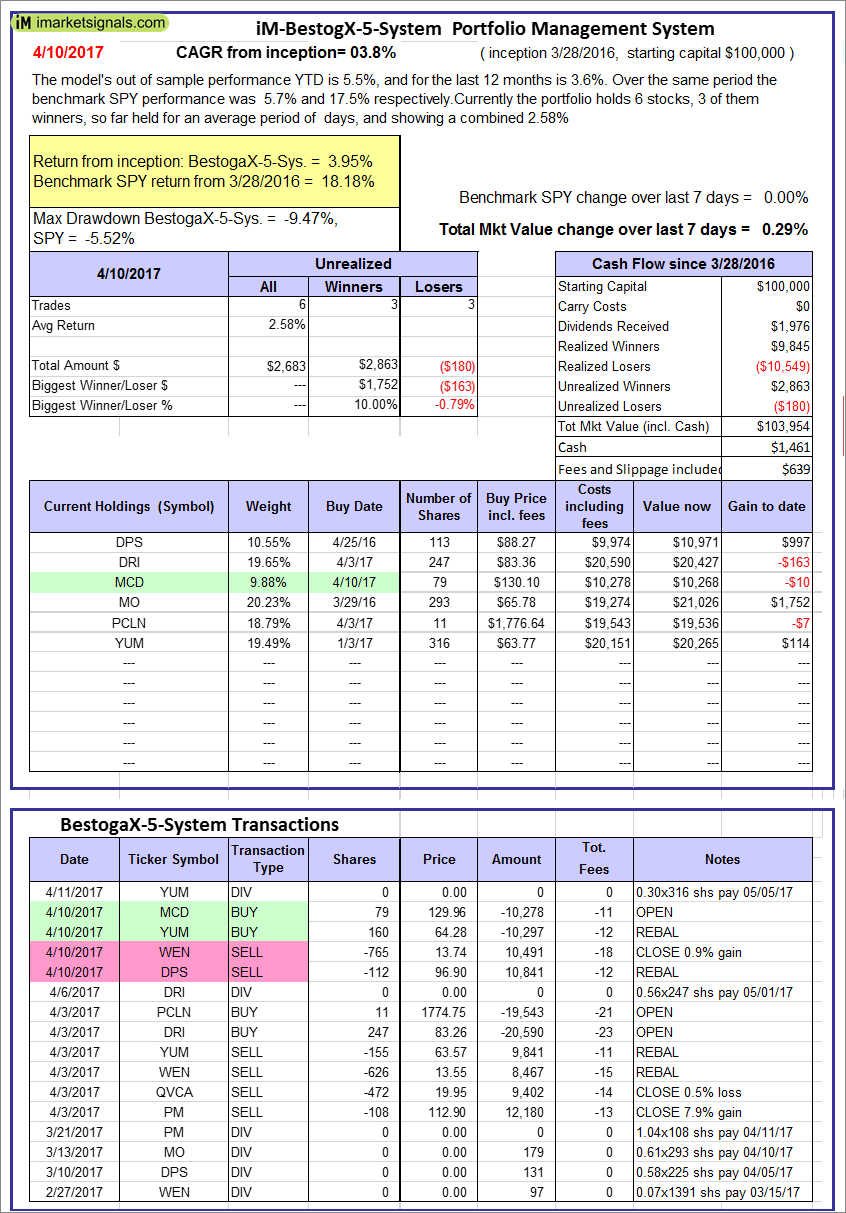 |
iM-BestogaX5-System: The model’s out of sample performance YTD is 5.5%, and for the last 12 months is 3.6%. Over the same period the benchmark SPY performance was 5.7% and 17.5% respectively. Over the previous week the market value of iM-Best8(S&P 500)Tax-Eff. gained 0.29% at a time when SPY gained 0.00%. A starting capital of $100,000 at inception on 3/28/2016 would have grown to $103,954 which includes $1,461 cash and excludes $639 spent on fees and slippage. |
 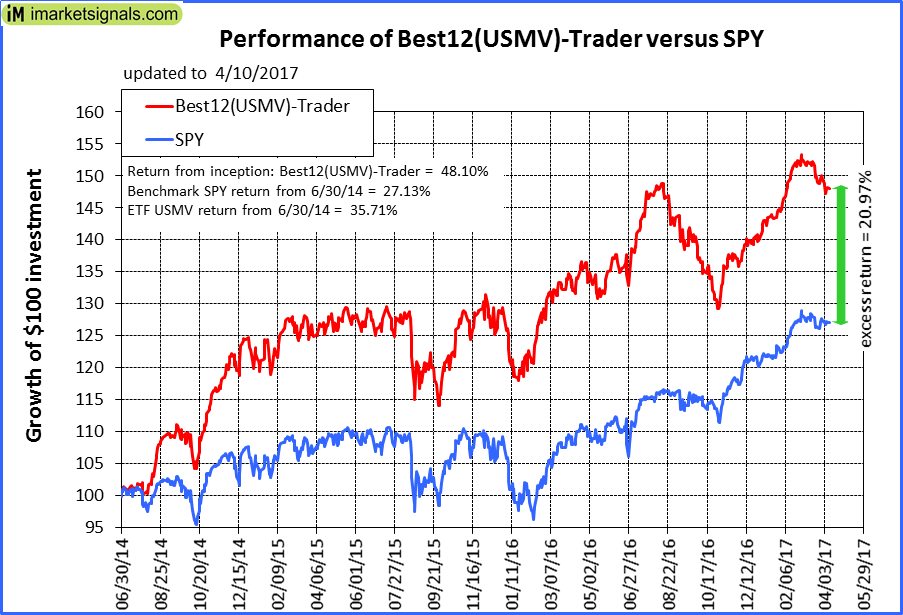 |
iM-Best12(USMV)-Trader: The model’s out of sample performance YTD is 5.9%, and for the last 12 months is 12.1%. Over the same period the benchmark SPY performance was 5.7% and 17.5% respectively. Since inception, on 7/1/2014, the model gained 48.10% while the benchmark SPY gained 27.13% and the ETF USMV gained 35.71% over the same period. Over the previous week the market value of iM-Best12(USMV)-Trader gained -0.50% at a time when SPY gained 0.00%. A starting capital of $100,000 at inception on 7/1/2014 would have grown to $148,096 which includes $108 cash and excludes $2,937 spent on fees and slippage. |
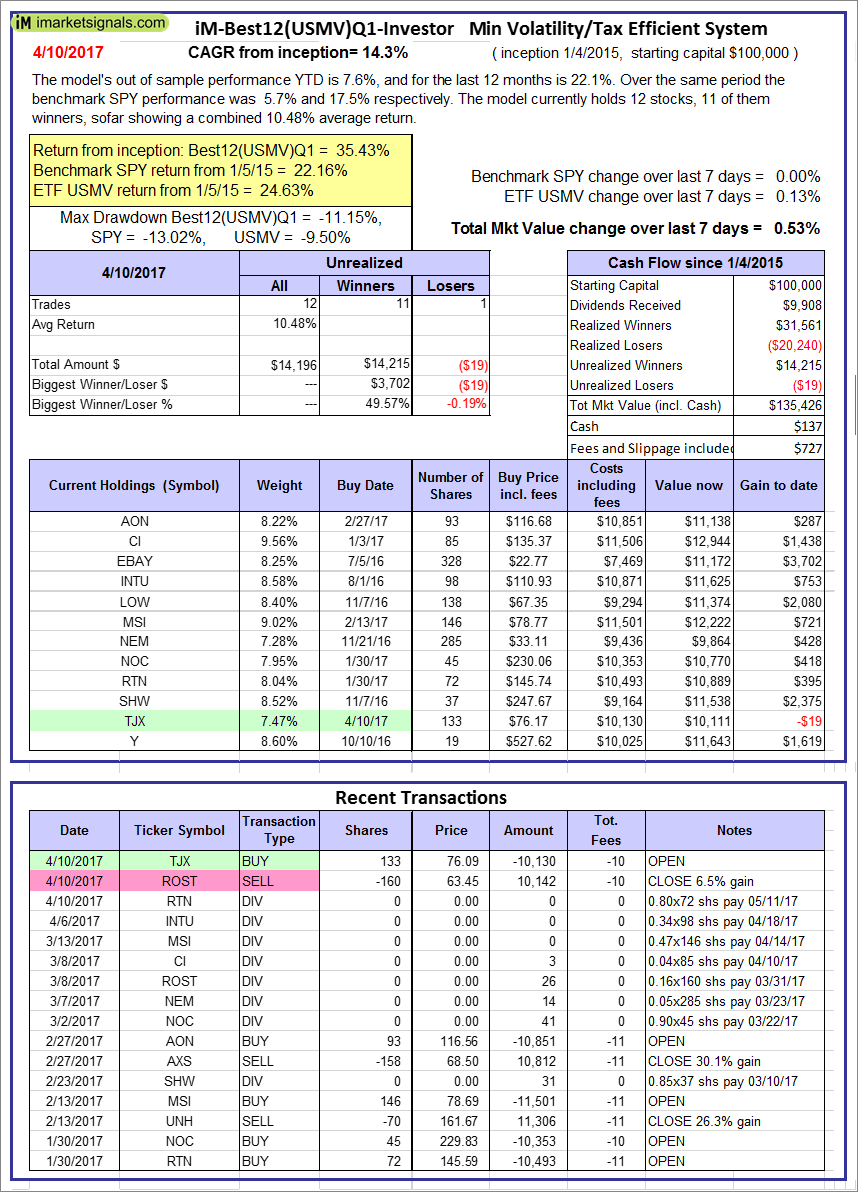 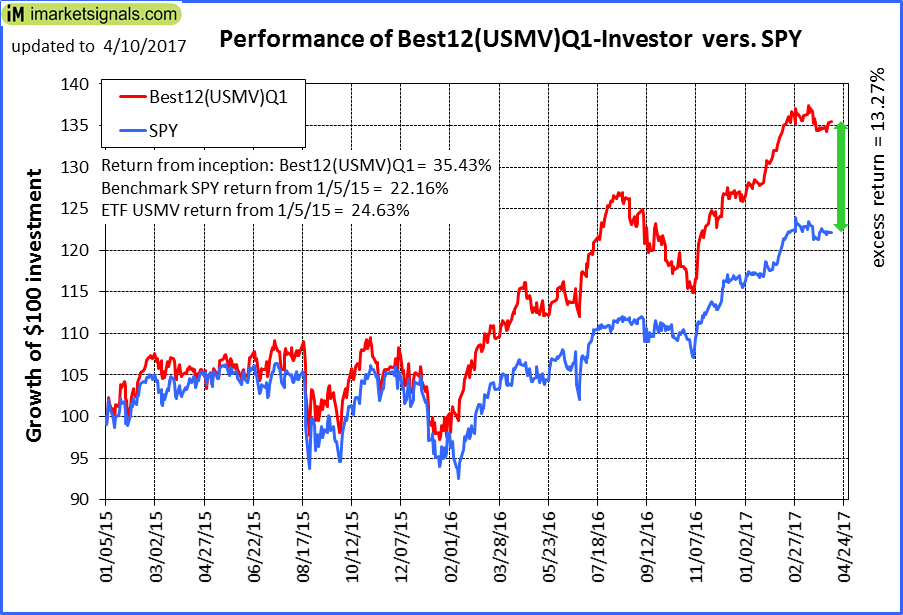 |
iM-Best12(USMV)Q1-Investor: The model’s out of sample performance YTD is 7.6%, and for the last 12 months is 22.1%. Over the same period the benchmark SPY performance was 5.7% and 17.5% respectively. Since inception, on 1/5/2015, the model gained 35.43% while the benchmark SPY gained 22.16% and the ETF USMV gained 24.63% over the same period. Over the previous week the market value of iM-Best12(USMV)Q1 gained 0.53% at a time when SPY gained 0.00%. A starting capital of $100,000 at inception on 1/5/2015 would have grown to $135,426 which includes $137 cash and excludes $727 spent on fees and slippage. |
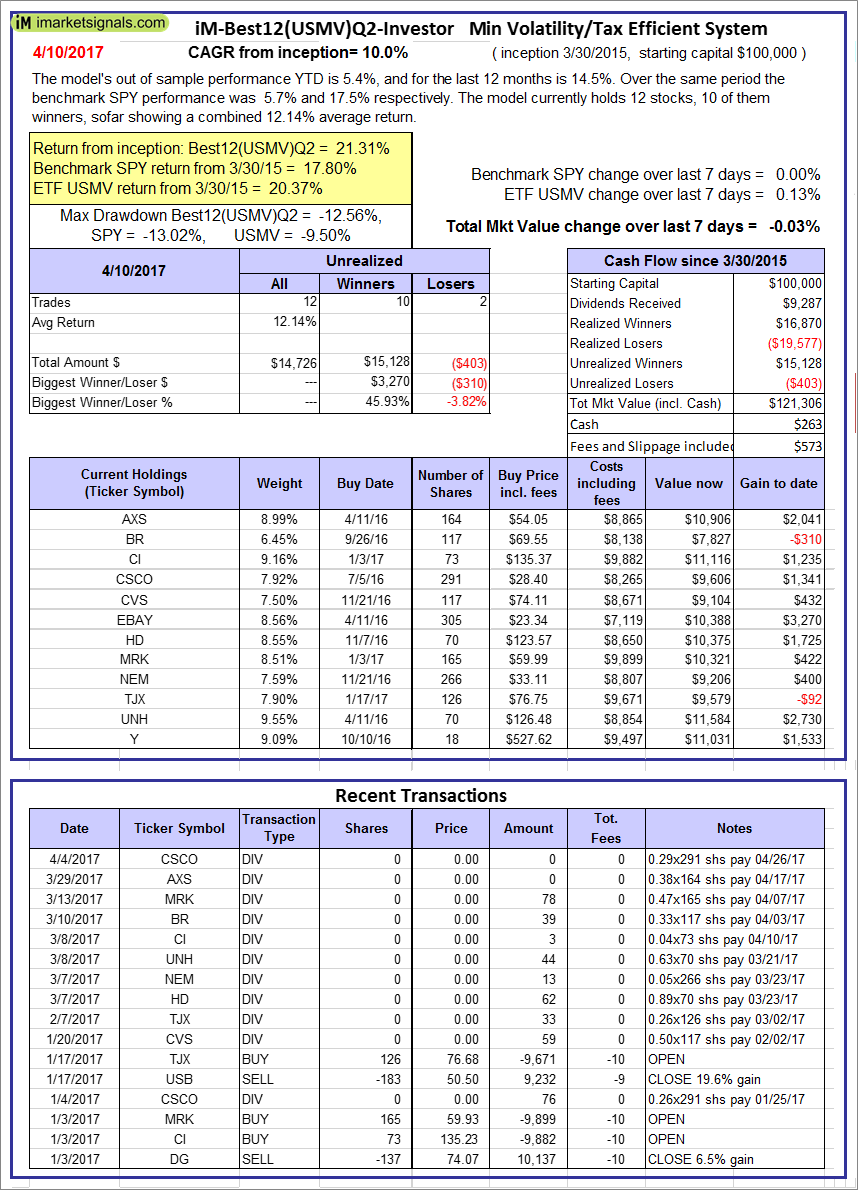 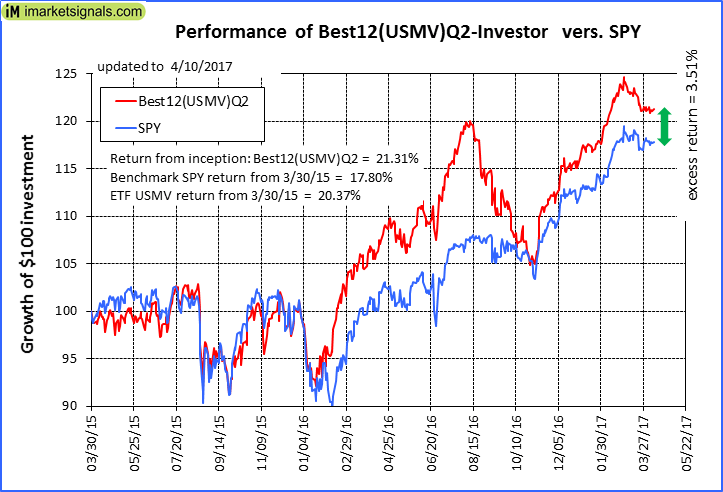 |
iM-Best12(USMV)Q2-Investor: The model’s out of sample performance YTD is 5.4%, and for the last 12 months is 14.5%. Over the same period the benchmark SPY performance was 5.7% and 17.5% respectively. Since inception, on 3/31/2015, the model gained 21.31% while the benchmark SPY gained 17.80% and the ETF USMV gained 20.37% over the same period. Over the previous week the market value of iM-Best12(USMV)Q2 gained -0.03% at a time when SPY gained 0.00%. A starting capital of $100,000 at inception on 3/31/2015 would have grown to $121,306 which includes $263 cash and excludes $573 spent on fees and slippage. |
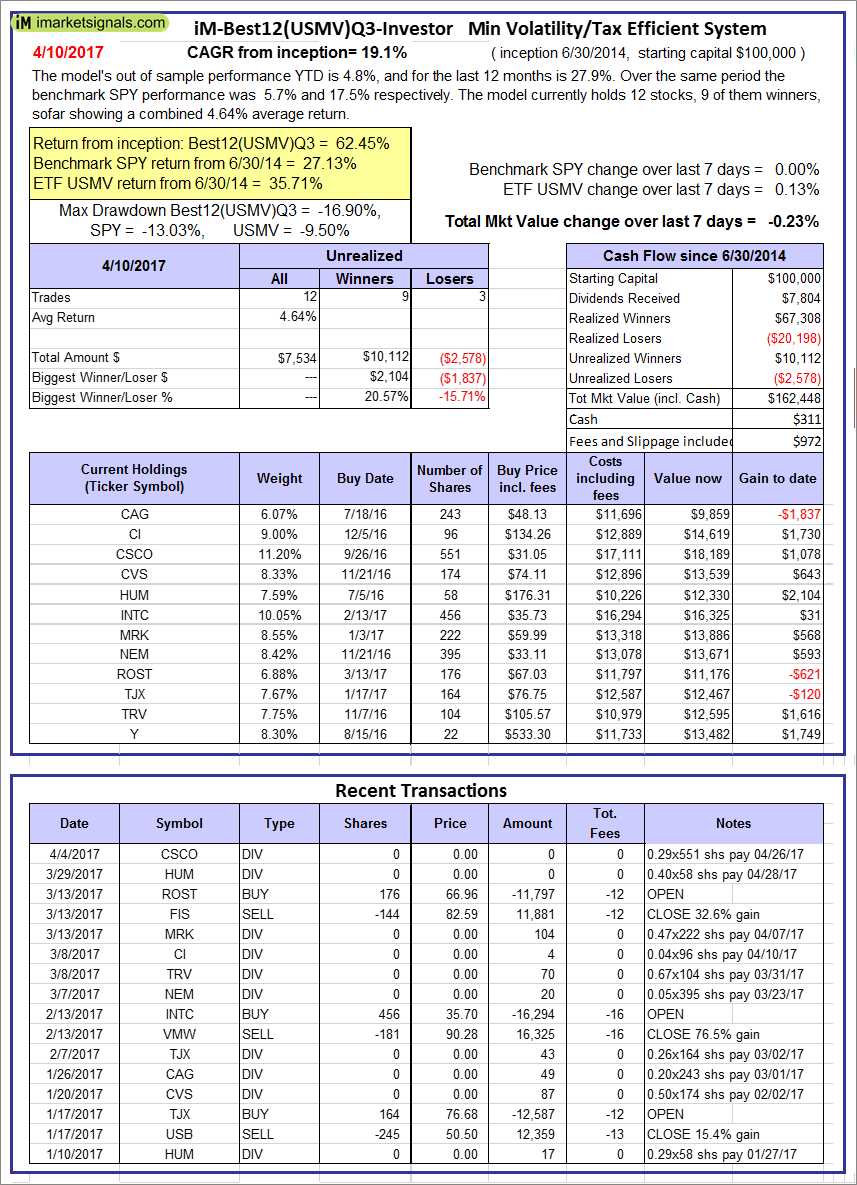 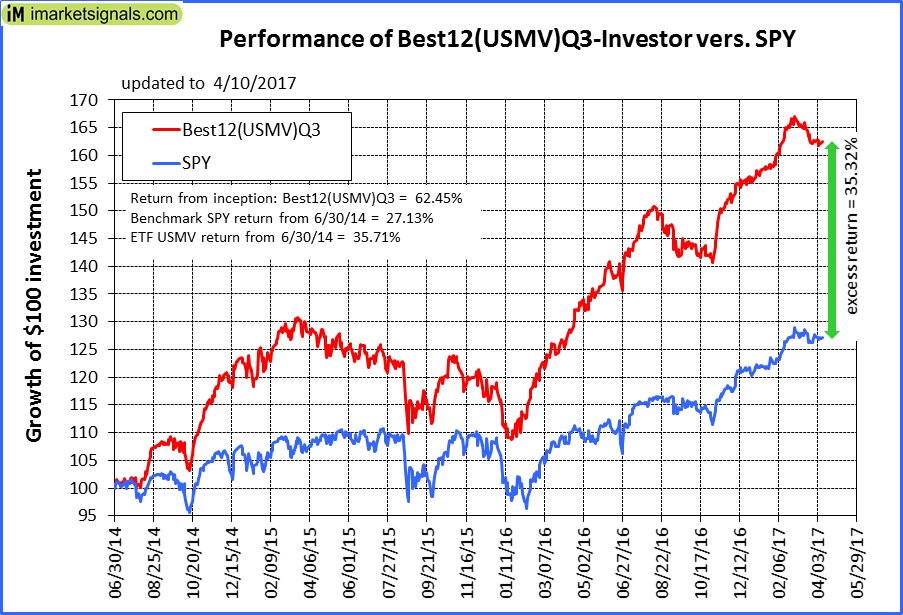 |
iM-Best12(USMV)Q3-Investor: The model’s out of sample performance YTD is 4.8%, and for the last 12 months is 27.9%. Over the same period the benchmark SPY performance was 5.7% and 17.5% respectively. Since inception, on 7/1/2014, the model gained 62.45% while the benchmark SPY gained 27.13% and the ETF USMV gained 35.71% over the same period. Over the previous week the market value of iM-Best12(USMV)Q3 gained -0.23% at a time when SPY gained 0.00%. A starting capital of $100,000 at inception on 7/1/2014 would have grown to $162,448 which includes $311 cash and excludes $972 spent on fees and slippage. |
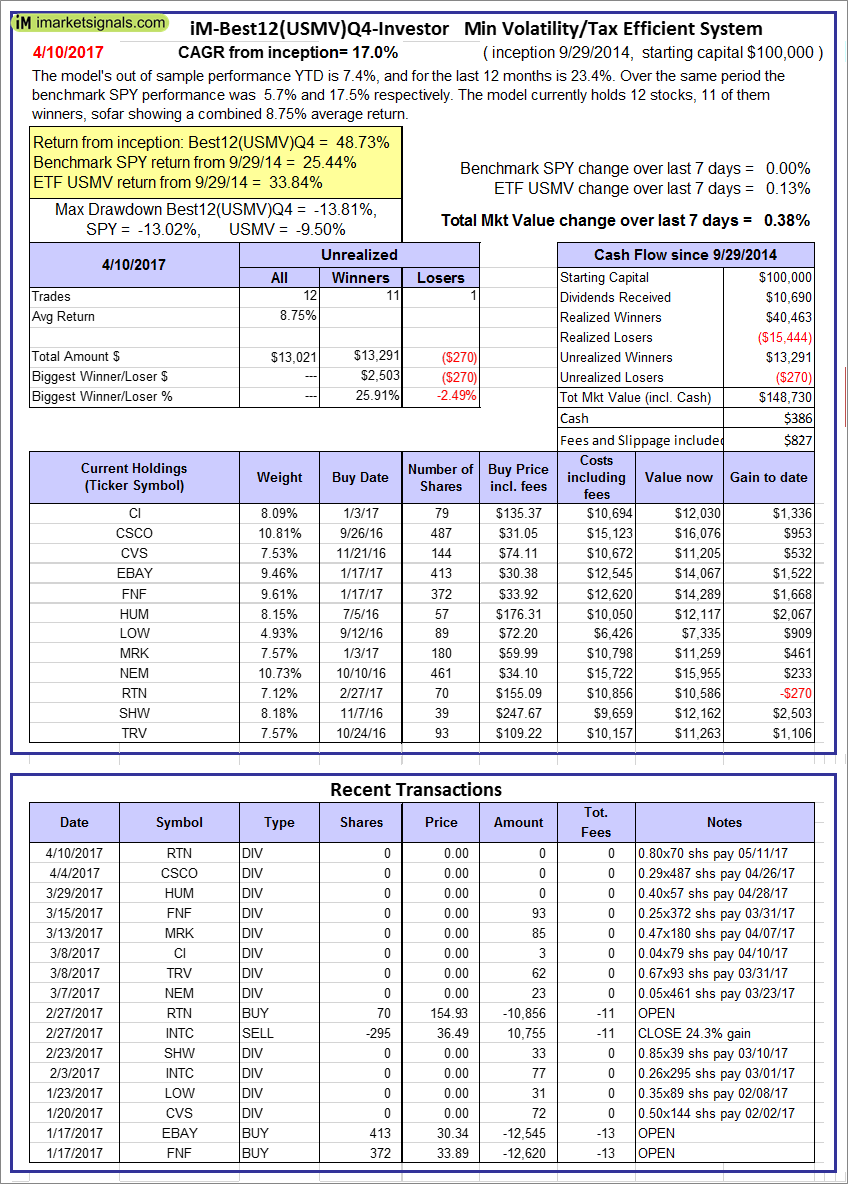 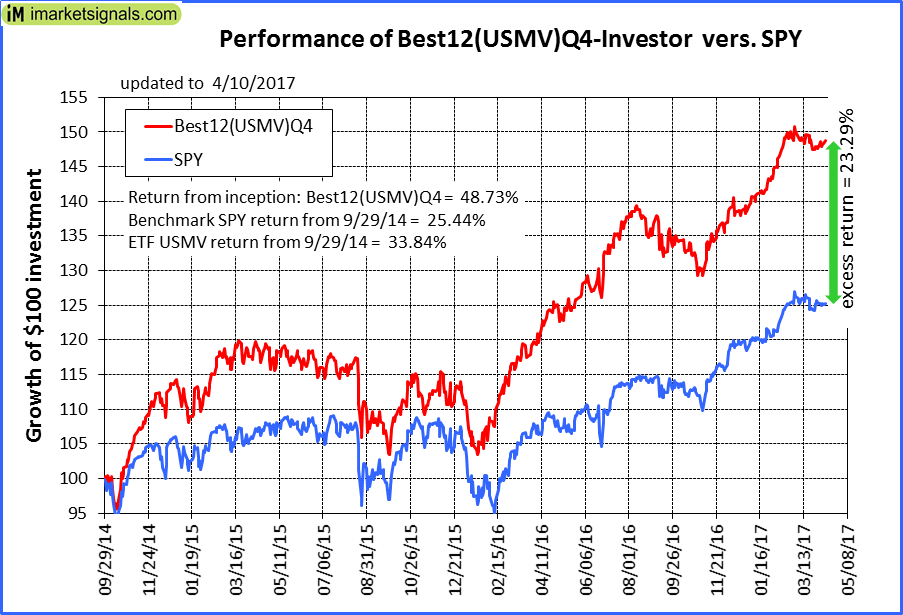 |
iM-Best12(USMV)Q4-Investor: Since inception, on 9/30/2014, the model gained 48.73% while the benchmark SPY gained 25.44% and the ETF USMV gained 33.84% over the same period. Over the previous week the market value of iM-Best12(USMV)Q4 gained 0.38% at a time when SPY gained 0.00%. A starting capital of $100,000 at inception on 9/30/2014 would have grown to $148,730 which includes $386 cash and excludes $827 spent on fees and slippage. |
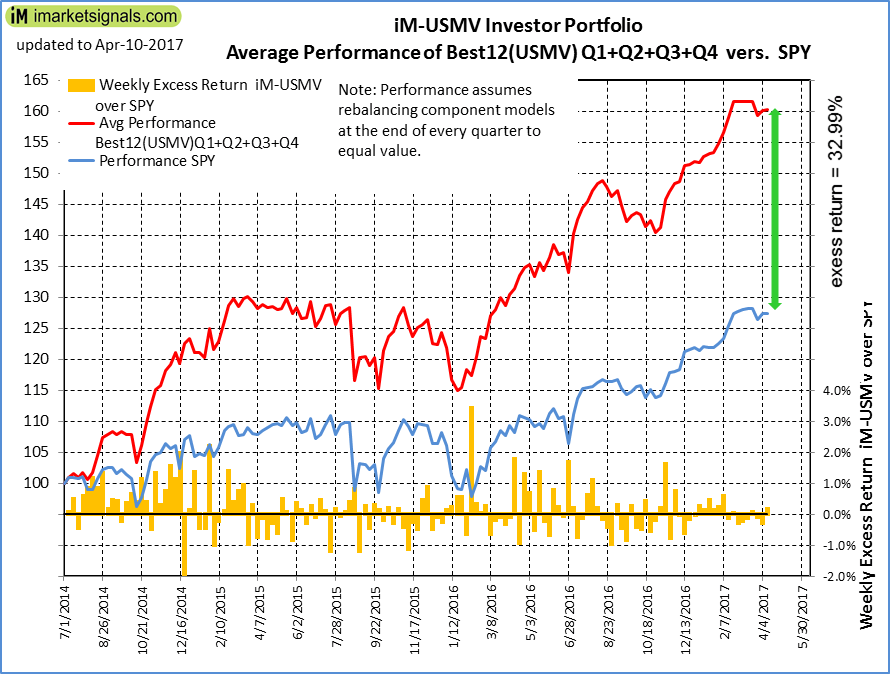 |
Average Performance of iM-Best12(USMV)Q1+Q2+Q3+Q4-Investor resulted in an excess return of 32.99% over SPY. (see iM-USMV Investor Portfolio) |
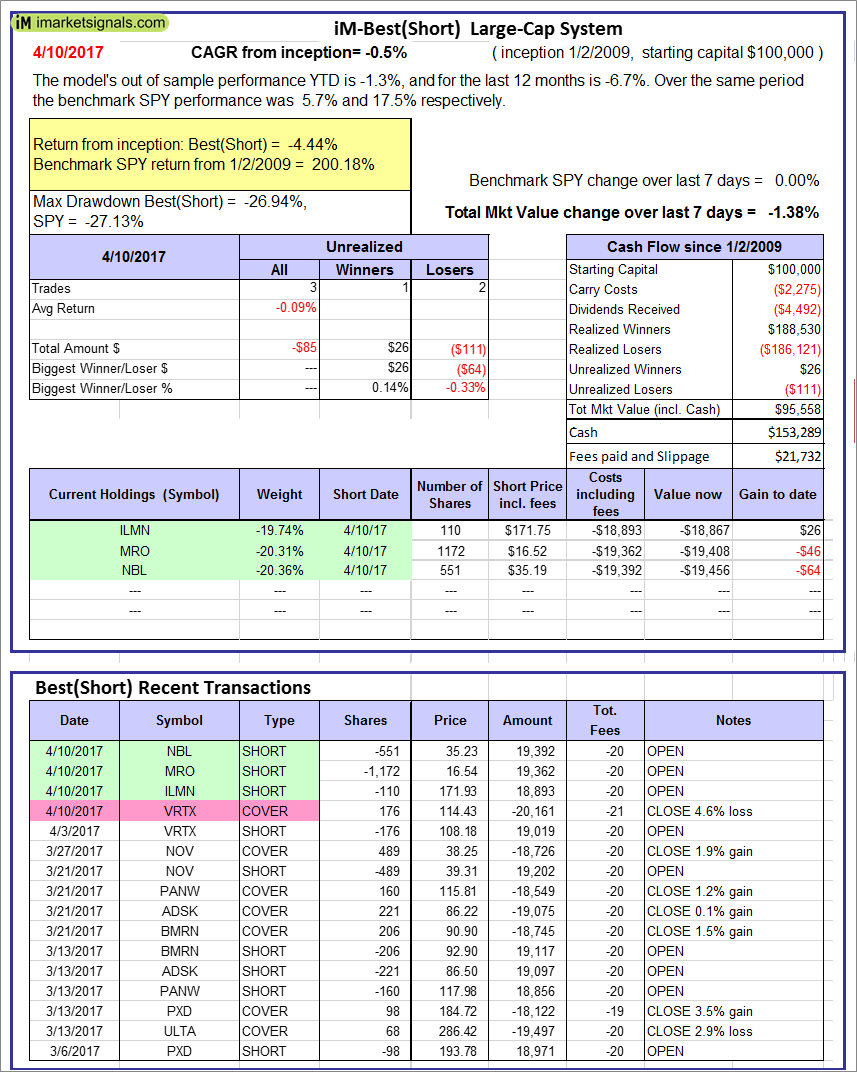 |
iM-Best(Short): The model’s out of sample performance YTD is -1.3%, and for the last 12 months is -6.7%. Over the same period the benchmark SPY performance was 5.7% and 17.5% respectively. Over the previous week the market value of iM-Best(Short) gained -1.38% at a time when SPY gained 0.00%. Over the period 1/2/2009 to 4/10/2017 the starting capital of $100,000 would have grown to $95,558 which includes $153,289 cash and excludes $21,732 spent on fees and slippage. |
iM-Best Reports – 4/10/2017
Posted in pmp SPY-SH
Leave a Reply
You must be logged in to post a comment.