
iM’s Business Cycle Index replaces ECRI’s WLI
Knowing when the U.S. Economy is heading for recession is paramount for successful investment decisions. We have designed the weekly iMarketSignals Business Cycle Index (BCI) so it would have provided early reliably warnings for the past seven recessions. We achieved recessions leads averaging 11 weeks, all with similar lengths. The absence of false positives, for the analyzed time period of 1967 to 2013, enhances the quality and reliability of the recession warnings.
The project to design a new leading index was initiated by the necessity to replace the Economic Cycle Research Institute’s Weekly Leading Index (WLI) with an indicator with good and reliable recession forecasting characteristics. Refer to Why is M2 Still a Component of ECRI’s WLI? and Does ECRI’s WLI Remain a Usable Indicator?
We developed BCI from the following basic economic data:
1. 10-year treasury yield (daily)
2. 3-month treasury bill yield (daily)
3. S&P500 (daily)
4. Continues Claims Seasonally Adjusted (weekly)
5. All Employees: Total Private Industries (monthly)
6. New houses for sale (monthly)
7. New houses sold (monthly)
The data-set is available from 1967 onwards, a timeframe that encompasses the last seven recessions. When combining the component for the index the “real time” aspect was considered, i.e. the data was only incorporated into the index at its publication date.
The BCI was not specifically designed to be a measure of the strength or weakness of the economy; it was designed to provide high probability recession forecasts (based on past performance). The various parameters of the BCI model, with which the input data are preconditioned and combined, were adjusted to provide the best recession capturing characteristics to the growth rate of BCI, with emphasis on getting the beginning of recessions right.
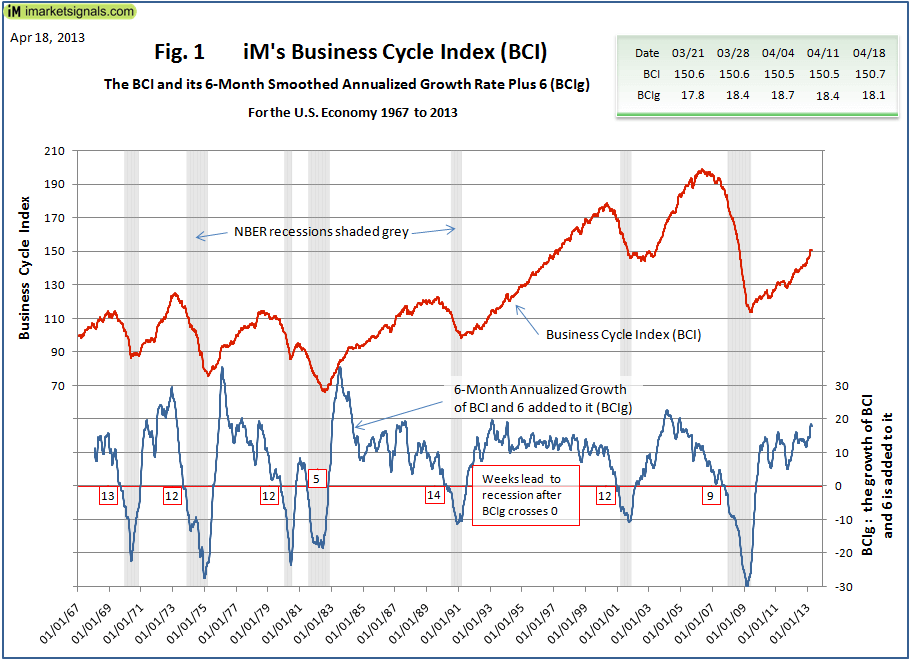
A superior measure for cyclical analysis is the 6-month smoothed annualized growth rate of an index. (See appendix A for the formula.) We used this method in our approach to obtain BCIg, the growth of BCI plus 6.0% to make zero the recession trigger. This provided recessions leads of 11 weeks on average with a standard deviation of 2.6, giving a Sharpe ratio of 4.2 (See Table 1). This high ratio indicates that all the leads are of similar length. Furthermore, using this method on the historical data we note that there are no false positives, which is also evident form Figure 1 that plots the BCI and BCIg from1967 onwards.
We note that the current configuration of BCI and BCIg (updated to April 18) are far removed from typical past recession configurations. The last five readings of BCI and BCIg are also shown in Figure 1.
The BCI will be maintained and updated every Thursday on the our dedicated page, accessible through the BCI menu item on the black menu bar in the heading section of every page.
click on image to enlarge
| Business Cycle Index from Jan 2013 | ||
| DATE | BCI | BCIg |
| 04/18/13 | 150.70 | 18.08 |
| 04/11/13 | 150.47 | 18.41 |
| 04/04/13 | 150.54 | 18.65 |
| 03/28/13 | 150.56 | 18.44 |
| 03/21/13 | 150.59 | 17.78 |
| 03/14/13 | 150.12 | 16.62 |
| 03/07/13 | 148.90 | 15.58 |
| 02/28/13 | 147.75 | 14.77 |
| 02/21/13 | 146.48 | 14.44 |
| 02/14/13 | 146.35 | 14.61 |
| 02/07/13 | 145.84 | 14.60 |
| 01/31/13 | 145.99 | 14.71 |
| 01/24/13 | 146.09 | 14.40 |
| 01/17/13 | 145.41 | 13.91 |
| 01/10/13 | 145.24 | 13.33 |
| 01/03/13 | 144.21 | 12.74 |
BCIp (or BCI in Off-Peak-Mode): 20 Weeks lead to Recessions
We report on a refined technique to analyze financial series based on the previous highest peak of the series in a business cycle, which we term the “off-peak-mode” of an index. We demonstrate this method by using our iMarketSignals Business Cycle Index (BCI) in off-peak-mode to achieve average leads to recessions of 20 weeks. Exiting the stock market at these early signals significantly improves investment performance. Furthermore, the current level of the BCI in off-peak-mode near 100 provides confirmation that a recession is not likely to occur within the next year.
The “Off-Peak-Mode” Method.
The inspiration for this method came from Doug Short’s web-pages. He uses the off-peak technique of presenting data as a percentage from the previous peak (example). Our refinement was simply to reset or break the curve at the beginning of a business cycle, which we defined as the end of a NBER recession (FRED series USREC).
The procedure to determine BCIp is as follows: the first reading of the BCI after a recession end would register as a peak at 100%, because there is no previous reading. Subsequent values, if they are lower, would register lower percentages, but a new weekly high would again register at 100%, however older values are never revised.
This “off-peak” curve is scaled by a simple formula to define the new indicator BCIp = 100 * (p – x) / (100 -x), where p is the “off-peak” value expressed as a percentage of the previous peak and x is the level such that BCIp is zero at x%. The calibration of x is done so that BCIp=0 gives an average lead to recession of 13 weeks.
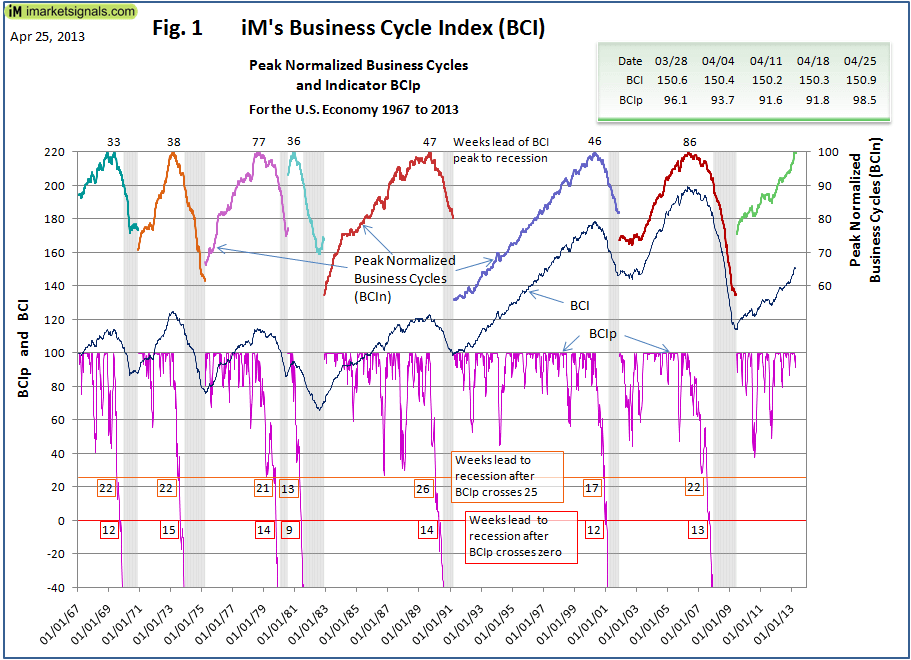
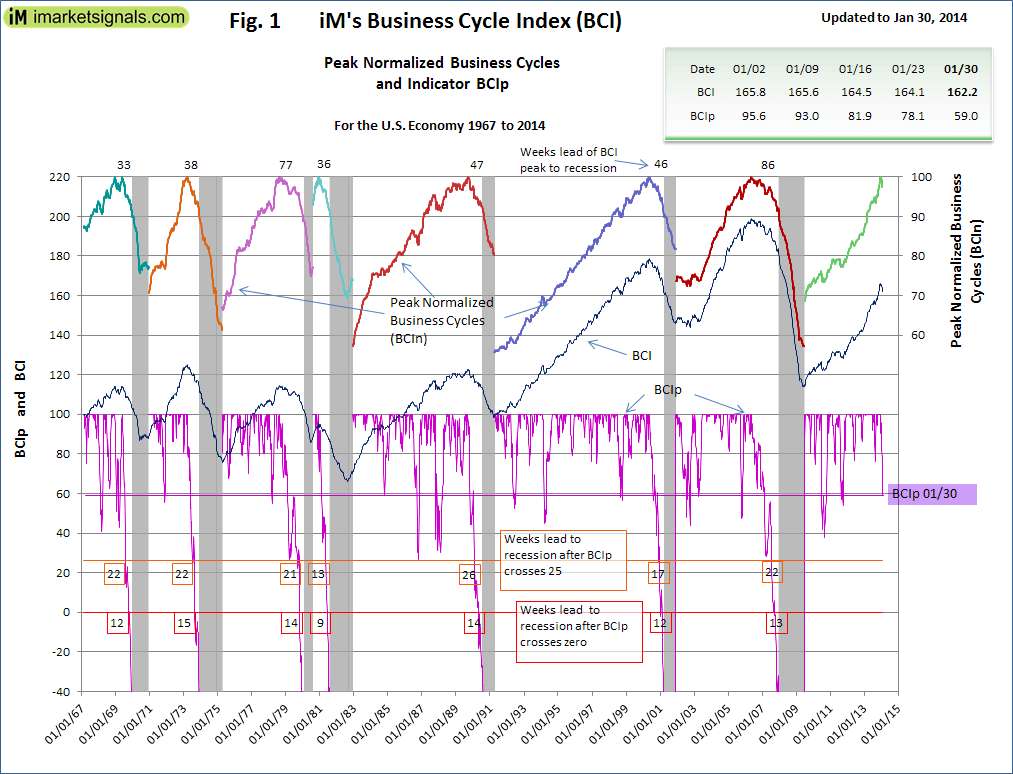
Figure-1 below helps in the understanding of the off-peak-mode method. The BCI is shown as a thin dark blue continuous graph. The series of multi-colored graphs on the top of the chart is the BCI sectioned into business cycles (from recession end to next recession end) and scaled such that the highest peak, of the respective cycle, registers 100, giving the Peak Normalized BCIn. The lower purple graph is the off-peak-mode indicator BCIp with the recession warning levels of 25 and zero indicated by the horizontal red lines. The number of weeks to recession at the two warning levels are shown in the red boxes for the seven recessions since 1967.
 Click image to enlarge
Table 1 below list the weeks to recession when BCIp reaches various levels and the losses avoided when exiting the stock-market at the time of the respective signals.
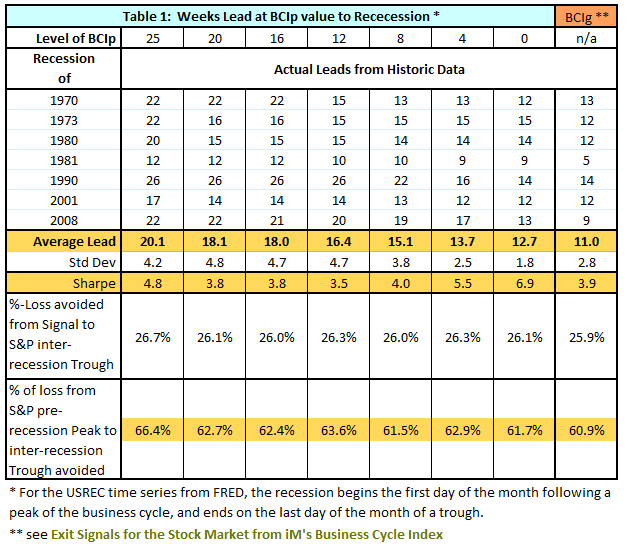
The maximum average lead of 20 weeks is nearly double the previous reported average of 11 weeks lead (last column in Table 1) derived from the growth method. In our article we showed that on average 60.9% of the loss from S&P pre-recession peaks to inter-recession troughs is avoided when exiting the stock-market at signals produced 11 weeks in advance. This percentage is now increased to 66.4% if one exits the market earlier using the BCI off-peak-mode signals at the BCIp level 25.
The Peak Normalized Business Cycle Index (BCIn)
Earlier, we introduced the BCIn as the BCI sectioned into business cycles (from recession end to next recession end) and scaled such that the highest peak, of the respective cycle, registers 100. (Series of multi-colored graphs on the top of Figure 1.)
These graphs are of interest as they allow an optical comparison of the current business cycle to the past cycles; however, we never know if we reached the peak. For example, the green last section graph depicts the current business cycle which had a level of 100 a few weeks ago. If the BCI were to decline from now onwards, this level would register as a peak. However, if the BCI were to gain in the future, then this level would not be a peak, and the entire green graph would be “pushed” lower.
Nevertheless, we can make an important observation from the previous peaks of BCIn which occurred 33 to 86 weeks before recessions, 52 weeks on average. Based on this we can state that when BCIn = 100, which implies per definition that BCIp=100, that the following one year period should be recession free, which is the current situation.
Conclusion
Our new off-peak-mode indicator BCIp provides an investor with a new analytical tool to judge the probability of an oncoming recession based on past performance; true positive signals to recessions were generated averaging 20 weeks prior to the past seven recessions.
The off-peak-mode method could equally be adapted to an off-floor-mode, i.e. we look at growth from the deepest troughs. These techniques are not only applicable to our Business Cycle Index, many others indices can be transformed into iM’s off-peak-mode to improve their forecasting or signaling prowess.
iM’s BCIw: A Weeks to Recession Indicator
Economic indices, each a combination of a different set of economic data, often signal contradictory states of the economy. Not surprisingly, many prominent analysts relying on these indices have made incorrect forecasts. To aid recession forecasting, we now introduce the BCIw, an index derived from our iMarketSignals’ Business Cycle Index (BCI), calibrated in weeks to recession. Yes, you read this correctly; for example, if the BCIw has a value of 19 it indicates that there is a high probability of a recession starting in 19 weeks.
The BCIp is derived from the BCI, is shown in Figure-1 and described in this article, and has consistently captured the last seven recessions. Although, BCIp currently at 59.0 is still far away from heralding a recession, it has however a downward trend now. A prudent investor may ask: “How does it compare to the past and how far are we away from a possible recession?”
In Figure-2 below we zoom in to the prior year of each NBER recession and plot the tracks of BCIp for 50 weeks to the recession start, for each business cycle overlaid in time. We averaged the tracks of six recessions (the double dip 81 recessions was excluded from the average as its track proved to be statistically outside the normal population of the remaining six) and we calculated a best fit second order curve to fit the average, the dark pink convex curve. Finally, a statistical upper and lower envelope was also calculated as second order curves; these are shown dotted.
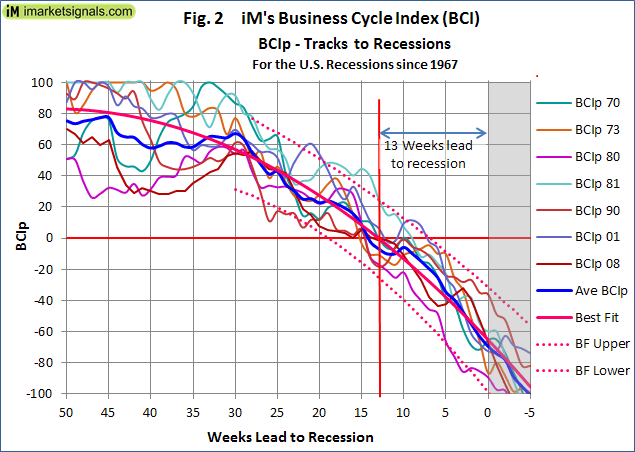
The closely matched and tightly bunched graphs form the basis for the development of the new and unique indicator BCIw. Knowing the formula for the best fit curve allows us to substitute the actual value of the BCIp into that formula to obtain a value in weeks which we define as the indicator BCIw; BCIw = F(BCIp) where F is the function that represents the best fit average curve. The relevancy of this method is that the BCIw value is not a number referenced to an arbitrary benchmark, but its value is expressed in weeks to recession, which is easy to understand. Our new indicator BCIw is shown in Figure 3 below (Note: This is for the situation of October 6 in 2011). The horizontal scale is calendar weeks prior to the NBER recession start and the vertical scale is the BCIw, or estimated weeks to the recession.)
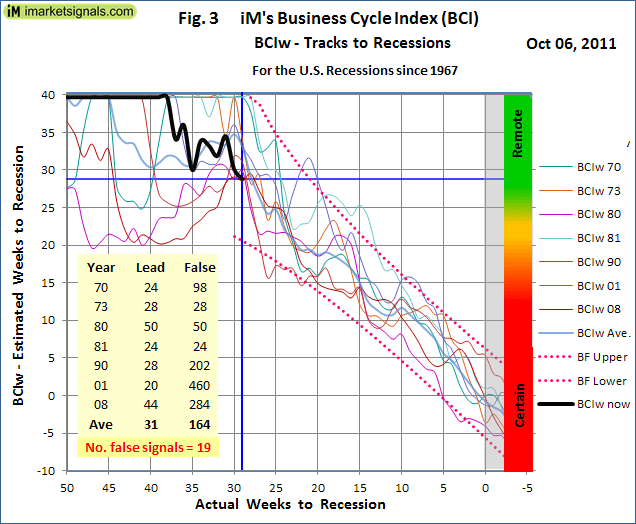
This figure needs some explaining; all the previous BCIw tracks to recession are shown, including the average track in a bolder light blue color. The calculated best fit average track is not shown as it would be a straight 45 degree line because BCIw equals actual weeks to recession, however the upper and lower envelope limits are shown. The bold black line is the BCIw, and its endpoint by definition is where the horizontal and vertical axis values are equal, as shown by the blue cross-hairs. From this chart we can read following data:
- There was a possibility that on Oct-06-2011 a recession was about 28 weeks away, with lower limit 21 weeks and upper limit 40+ weeks, as read from the intersection of the vertical blue cross-hair line and the dotted upper and lower limits.
- Indeed, this state of the BCIw has lead to a recession with an average lead time of 31 weeks (column labeled Lead), however in the business cycles for 1970, 1980, 1990, 2001, and 2008 this level was a false alarm first recorded 98, 50, 202, 460 and 284 weeks before the respective recession as listed under the column labeled “False”
- The last line in the table indicates that the level was recorded on 19 other occasions with the economy recovering thereafter.
- The horizontal cross-hair points to a recession probability indicator, green being remote and red being near certain. Once BCIw reached 19 weeks, a recession always followed in the past.
We chose the Oct 6, 2011 situation as that is one week after ECRI’s public recession call which may have caused many unsuspecting investors to reduce their stock market exposure. However, with supporting data from Figure-1 and Figure-3, it immediately would become apparent that ECRI’s call was premature, a cautious “maybe let’s see what the next month brings” would have been a more prudent approach. As it turned out, the black line of Figure-3 had bottomed that week and rose thereafter, the market gained as well from then onward, more than 60% to date.
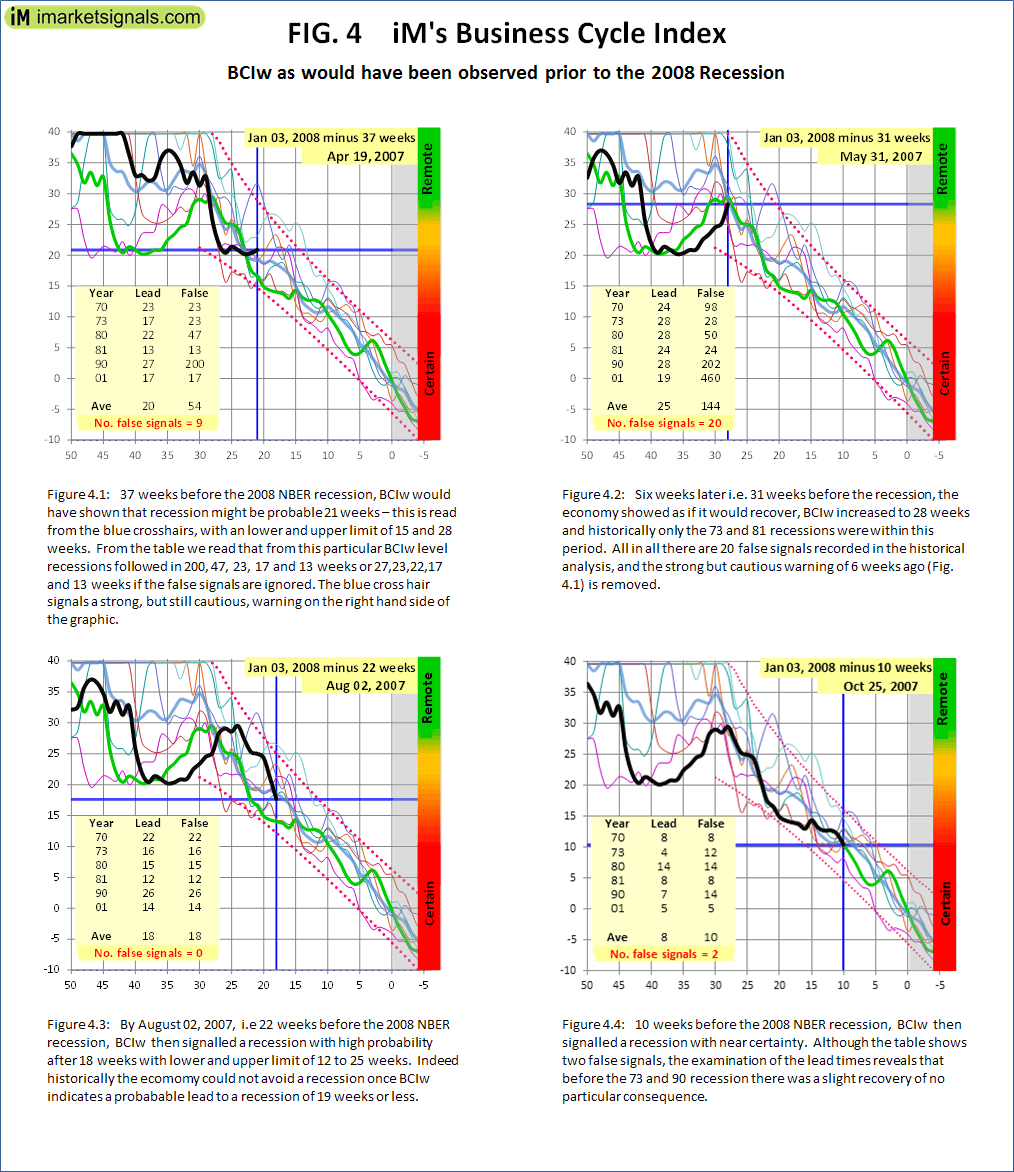
To see this indicator work, we have prepared a series of charts tracking the slide into the 2008 recession at various intervals before January 2008 and compiled into Figure 4. The bold black track indicates what would have been observed on the date shown at the top right corner of each chart. The bold green line is the actual track, determined later when the start date of the 2008 recession was known.
iM’s Business Cycle Index is updated every Thursday and the series, with weekly values starting January 1967, can be downloaded here.
Is there a timer based on the BCI? Or is all this data incorporated into the composite timer?
Great intuitive model. My only question is, is it POSSIBLE for there to be a recession driven bear market without this model signaling peak sometime early in the downturn?
Hello! Where is “appendix A for the formula”?
Do you have a current BCI-W ? Oct 2022
Do you have a current BCI-W ? Oct 19, 2022