
- Stock market timing models usually provide discreet signals indicating whether to be in or out of the market.
- A better approach with potentially less risk is to stage investments over time when entering or exiting the market.
- Three market timing models with low correlation to each other are used in combination to provide staged signals, indicating stock market investment in 25% increments from 0% to 100%.
The Market Timing Models
The three timing models switch between SPY (the ETF tracking the S&P 500 index) and IEF (the ETF tracking intermediate-term U.S. Treasury bonds) and were derived from previously developed ETF trading systems modified to seek investment in SPY during up-market periods and otherwise in IEF. These models have all been published having out-of-sample (OOS) periods as indicated.
- SPY-IEF 50/220 MAC: A moving average cross-over system which uses the spread between the 50 and 220 trading day moving averages of SPY. This is similar to the 50/200 Golden Cross System for the S&P500 index and to our MAC-US model, with a weight of 25%. (OOS from Jul-2012)
- SPY-IEF with Best(SSO-TLT) algorithm, with a weight of 50%. (OOS from Jan-2014)
- SPY-IEF with Best(SPY-SH) algorithm, with a weight of 25%. (OOS from Sep-2013)
Component model Nr.1 is a straight forward moving average crossover system. The algorithms for component models Nrs.2 and 3 are based on subscription models at a web-based simulation platform developed by the author.
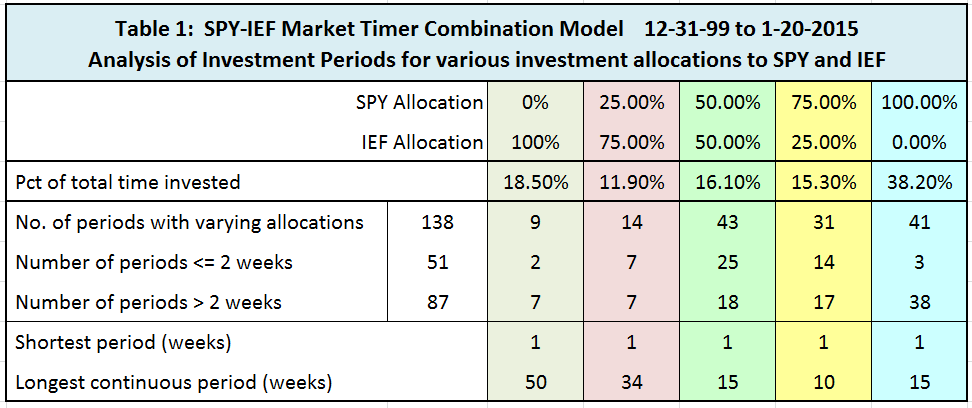
The combination model provided allocation signals for SPY and IEF as shown in Table 1. On average there were 9 different allocations per year, requiring adjustments to investment mix.
Performance of SPY-IEF Market Timer Combo
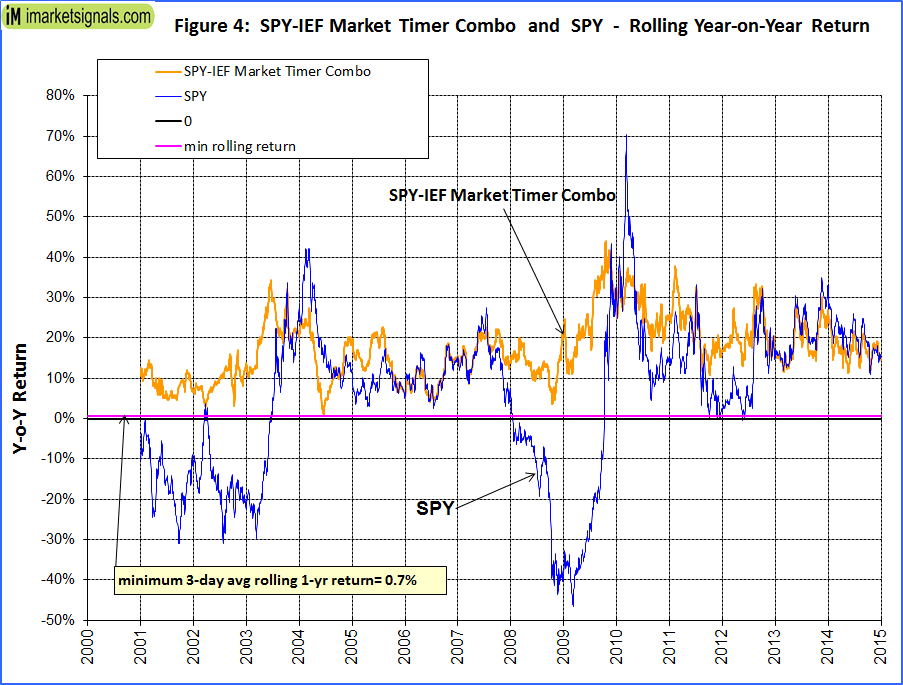
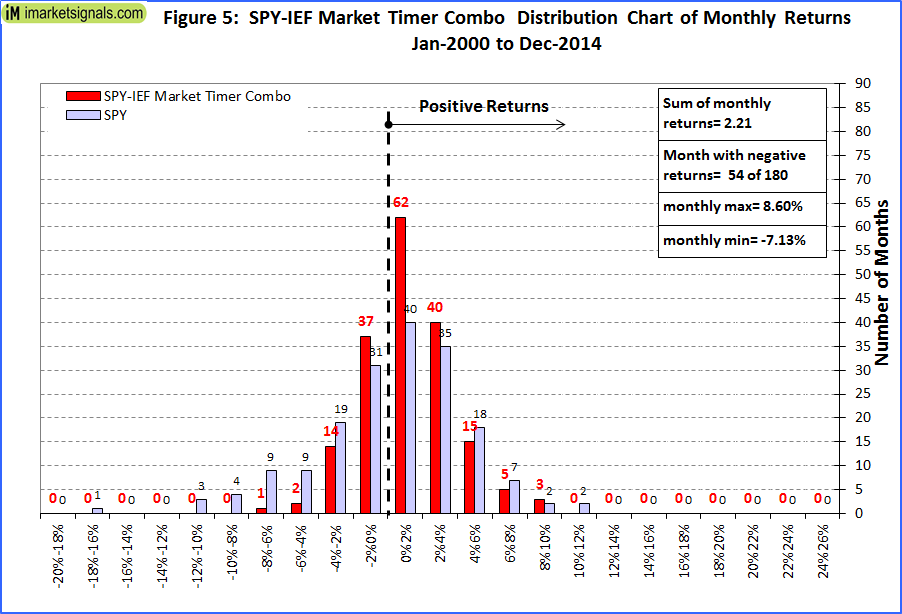
In the figures below the red graph represents the model and the blue graph shows the performance of benchmark SPY.
Performance is shown in Figure 1. The backtest period was more than 15 years, from January 2000 to February 2015. Dividends are accounted for in the backtest. The annualized return (CAGR) would have been 16.9% with a maximum drawdown during the backtest period of -10.7% as shown in Figure 1 below.
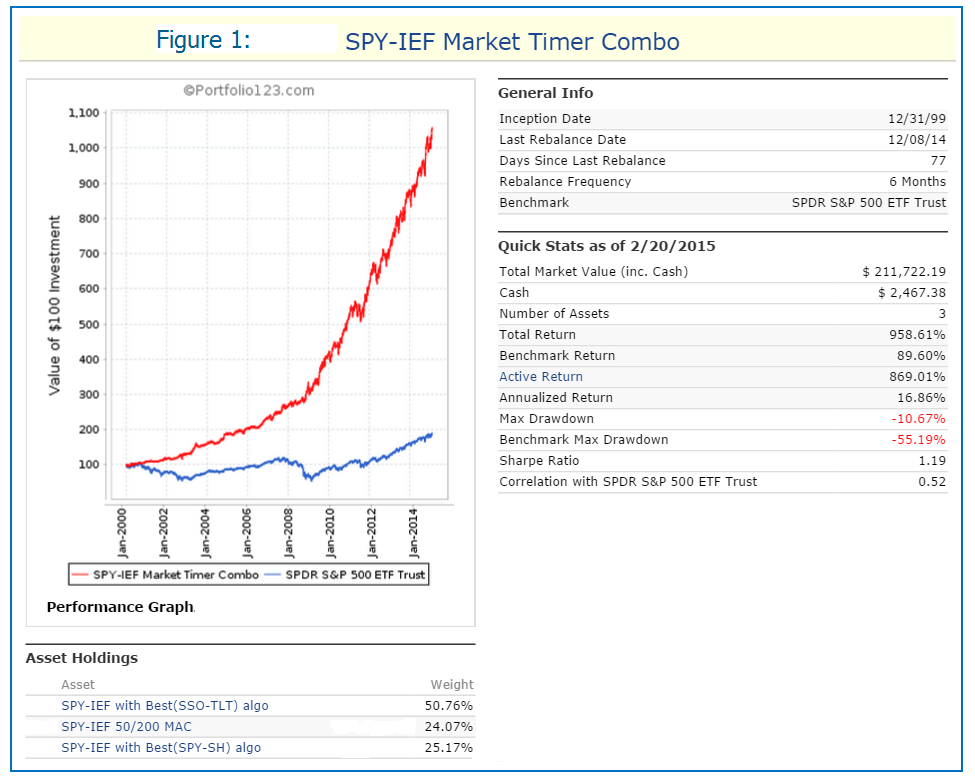
Figures 2 to 5 show performance details:
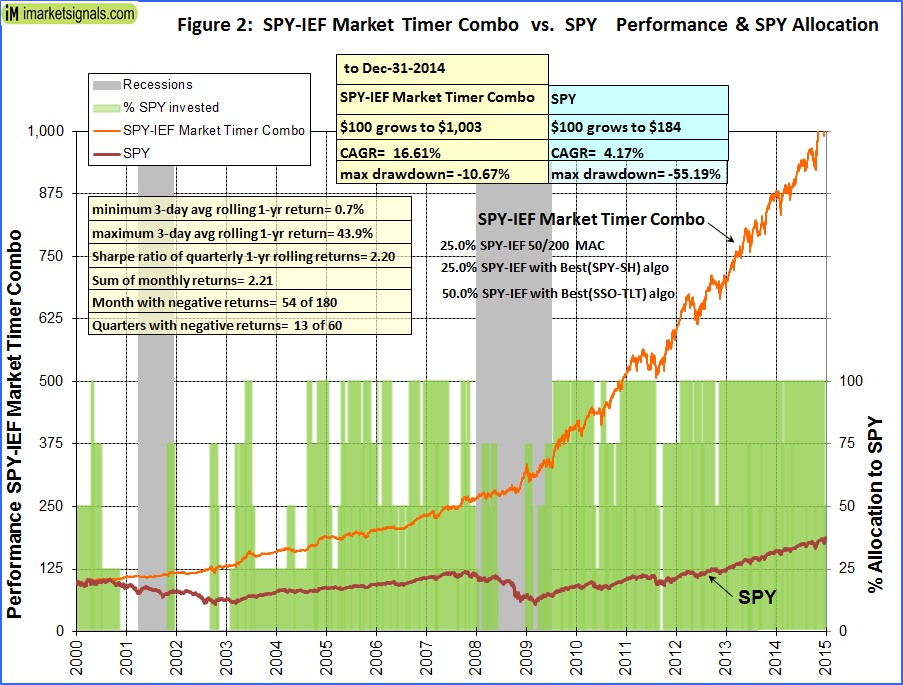
- Figure 2: Performance 2000-2014 versus SPY. Over the 15-year period $100 invested at inception would have grown to $1,003. The green bar graph depicts the percentage allocation to SPY (short periods are not visible). Allocation on 2/26/2015 is 100% to SPY, and the prior historic allocations can be downloaded here as an Excel file.
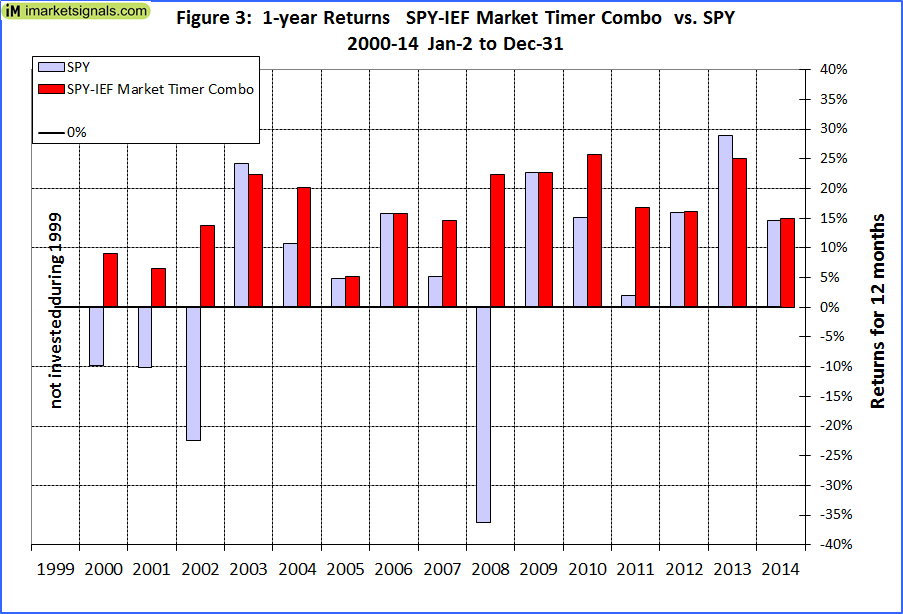
- Figure 3: 1-year returns. There was never a negative return over one calendar year.
- Figure 4: 1-year rolling returns. The minimum 1-year rolling return of the 3-day moving average was 0.7% in 2004, indicating that there was never a negative return over any 12 months period.
- Figure 5: Distribution of monthly returns. One can see that the monthly returns follow a normal distribution, with only 54 months showing a negative return.
Following the Model
This model is updated weekly and allocation percentages to SPY will be posted on our website.
Appendix
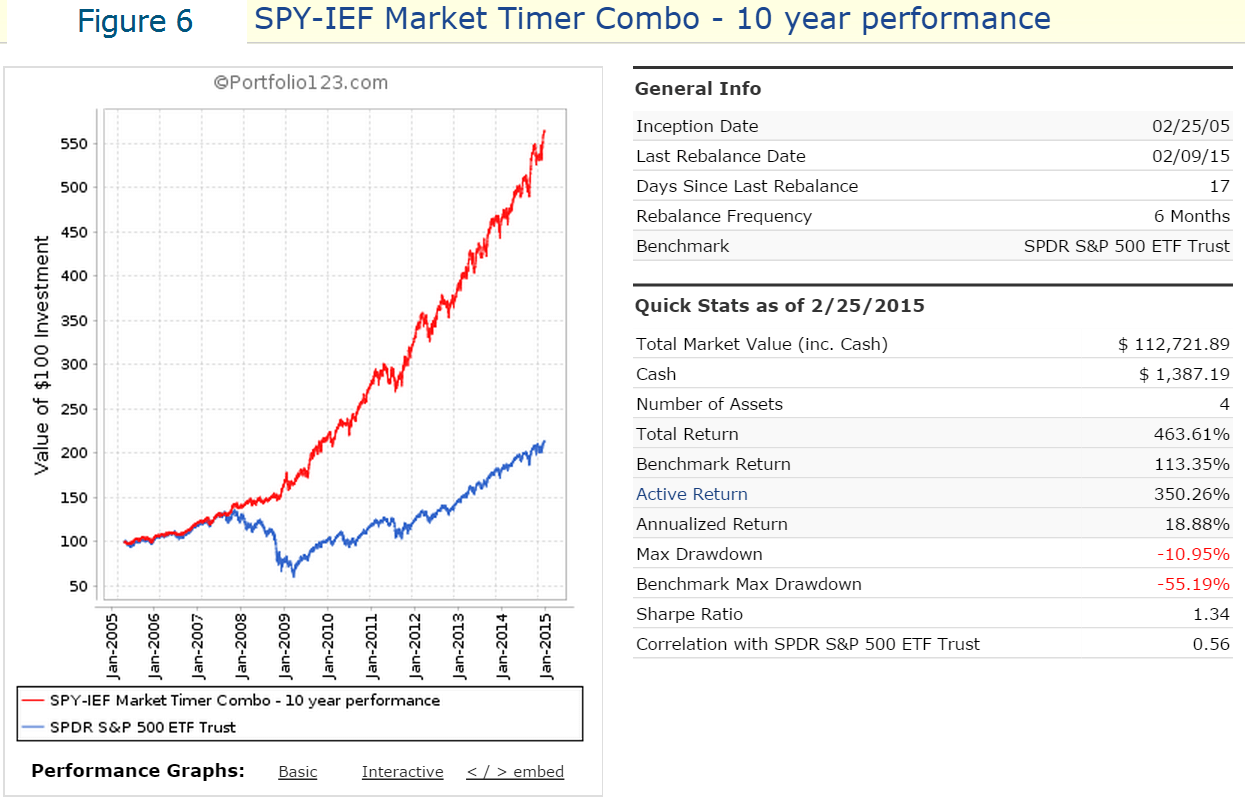
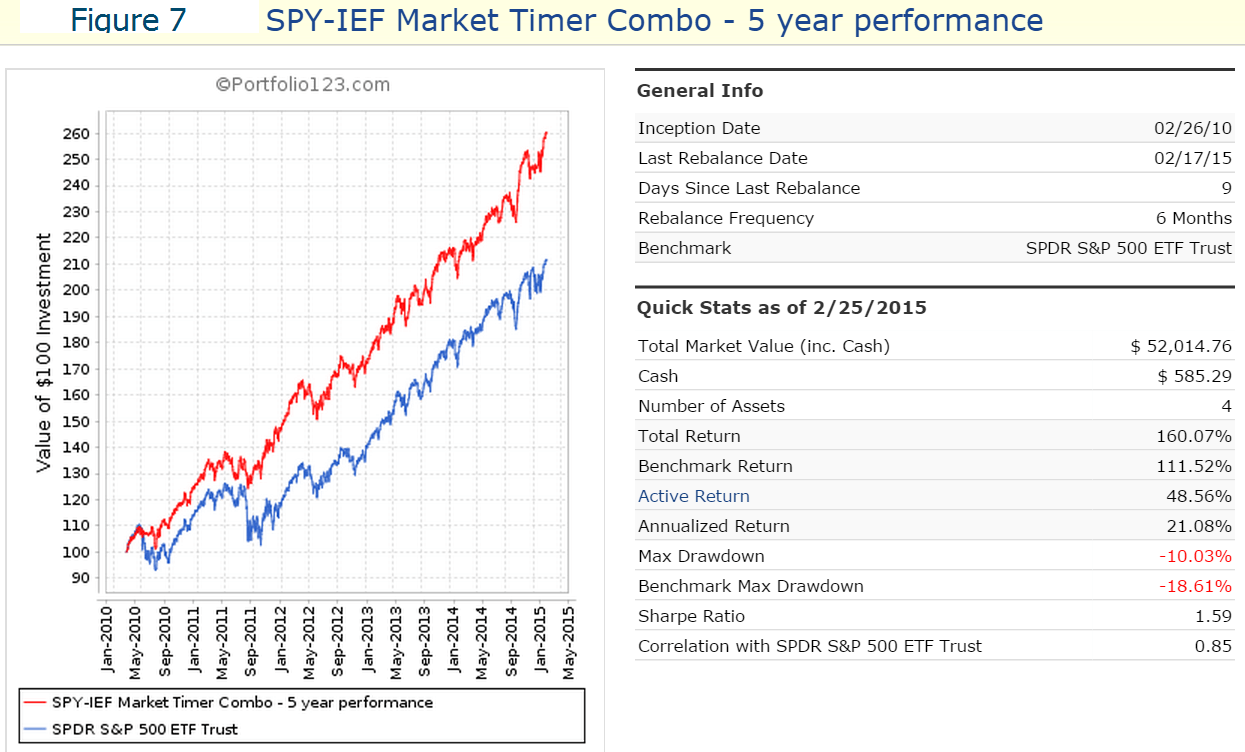
Performance over the last 10 years and 5 years is shown in Figure 6 and 7, respectively.
Disclaimer
One should be aware that most of the results shown are from a simulation and not from actual trading. Out-of-sample performance of the three component models is relatively short. This timing model is presented for informational and educational purposes only and shall not be construed as advice to invest in any assets. Out-of-sample performance may be much different. Backtesting results should be interpreted in light of differences between simulated performance and actual trading, and an understanding that past performance is no guarantee of future results. All investors should make investment choices based upon their own analysis of the asset, its expected returns and risks, or consult a financial adviser.
When will you start posting the weekly updates? Thanks.
We will post them every week from beginning of March.
Can you provide a table of historic investment moves as you have done in the past on other models? Thanks.
We now have added a downloadable excel file with dates and percentage invested in SPY.
Thanks. The spreadsheet is helpful.
So, does that mean when the spreadsheet shows SPY at 100%, it means:
Investment #1 – SPY – 25% of portfolio
Investment #2 – SSO – 50% of portfolio
Investment #3 – SPY – 25% of portfolio?
and when SPY is 0%, it means:
Investment #1 – IEF – 25% of portfolio
Investment #2 – TLT – 50% of portfolio
Investment #3 – SH – 25% of portfolio?
Thanks.
When the spreadsheet shows SPY at 100%, it means:
model #1 – SPY – 25% of portfolio
model #2 – SPY – 50% of portfolio
model #3 – SPY – 25% of portfolio
When the spreadsheet shows SPY at 0%, it means:
IEF – 100% of portfolio
I think I understand. You’re using 3 different models to trigger a trade, but the trade is always either SPY or IEF…
Hi Georg,
Does this model have a high degree of correlation to the iM BestCombo 3
given that you are using 2 of it’s algorithms? Of all the models you have, which would you say have the least correlation with the Combo 3?
Thanks
The correlation between the SPY-IEF Market Timer and Combo3 is quite high, about 0.70 correlation. The idea of the Timer is to provide staged investment signals for the stock market.
The least correlation to Combo3 from our R2G models are from Best8(Min Volatility), Best8+ and Best10, all about the same value.
George,
Looks like another great piece of work. My question is could you comment about the use of recession indicators with this model?
We have the BCI and COMP recession indicators. They would have provided exit signals before the last two recessions at the following dates (see relevant articles):
BCI
01/11/2001 SPY=101.38 reduced holdings from 100% to 0% SPY
11/01/2007 SPY=129.54 reduced holdings from 100% to 0% SPY
COMP
11/10/2000 SPY=104.41 reduced holdings from 100% to 0% SPY
10/26/2007 SPY=131.76 reduced holdings from 100% to 0% SPY
The SPY-IEF Market Timer would have reduced holdings of SPY:
05/02/2000 SPY=109.61 reduced holdings from 100% to 75% SPY
06/07/2000 SPY=110.65 reduced holdings from 75% to 25% SPY
11/07/2000 SPY=109.86 reduced holdings from 25% to 0% SPY
11/06/2007 SPY=130.43 reduced holdings from 100% to 50% SPY
12/26/2007 SPY=128.95 reduced holdings from 50% to 25% SPY
01/15/2008 SPY=119.14 reduced holdings from 25% to 0% SPY
One can see that prior to the 2001 recession the Timer would have sold earlier at a higher values of SPY, while the exit prices of SPY and time of sales prior to the 2008 recession were about the same for the Timer and recession indicator models.
It is interesting that the Timer, BCI and COMP are totally unrelated to each other, yet they would have produced similar signals.
Hi Georg,
Thanks for another great model for us to consider. I’ve reviewed the excel spreadsheet, and am wondering if you would share just the actual trade events (with IEF prices), rather than the daily events?
I want to do the analysis for a taxable account and understand what impact it would have on the returns. One hypothesis I want to explore is whether to hold at 50% even when the model recommends 25%, to maximize the number of opportunities for long term capital gains, as in the backtest there are very few events going from 25%->0%, but comparatively more for 25%->50%.
Regards
Greg
Greg,
One can’t extract the individual trades for a combo model. I suggest that you download from YahooFinance into a spreadsheet the values of IEF adjusted for dividends. You can then paste them into our spreadsheet and do the requisite calculation.
Ok I’ll do that. What data did you use prior to Jun 2002 when IEF was started?
The downloadable excel file now includes the IEF data we used in the simulation. Prior to 2002 the data is synthetic, derived from the underlying Treasuries of IEF.
Georg, thx for the data.
For the % returns shown in the charts above what trade timing is assumed:
a) Trades are executed the same day the signal is generated?
b) Trades are executed the next trading day after the signal is generated?
c) Trades are executed on the next Mon (Tue if holiday) after the signal is generated as we would receive in the newsletter?
1. All three component models are rebalanced every weekend.
2. Signals are emailed usually on Sunday afternoon for trading on Monday.
3. If you look at the dates of allocation changes and apply the excel formula =weekday(cell reference)you will notice that allocation changes are always recorded on Tuesdays, day#3.
Hi Georg,
I’m having trouble rationalizing the allocation changes in the excel file with your note above:
1. There are 144 allocation changes in the testing period, but recorded on different days:
– 62 on Monday
– 74 on Tuesday
– 8 on Wednesday
2. There are five occasions where two allocation changes are recorded in the same week:
– Sep 6th & 7th 2005
– Jan 3rd & 4th, 2006
– Mar 12th & 13th, 2007
– Aug 16 & 17th, 2010
– Apr 23 & 24th, 2012
Could you comment on whether IEF is likely to perform as well in this model going forward as it as in the past? I can see an argument either way: (a) interest rates cannot fall much farther, so all bond funds will lose their tailwind and will likely face a headwind over the next 10 years, or (b) while all that may be true, it doesn’t matter for this model, because IEF is used in the model only as a safe haven when the S&P is likely to decline, and in such periods, volatility typically rises and money moves to bonds, which benefits bond prices even in the middle of a long-term rising interest rate environment. I would be very interested in your thoughts on this.
Thanks, Curt
We have the BVR model to give an indication on the direction of bonds. For the Timer Combo it was not the intention to provide a simulation for maximum returns, but rather to indicate periods when one should decrease stock asset allocation. The choice of the Treasury ETF in Timer Combo does not affect the investment periods for stocks.
The same model using the short-term Treasury ETF SHY would have produced a CAGR= 14.5% with a max DD= -11.3%. Using TLT would have provided the highest return, CAGR= 20.4% with a max DD= -11.6%.
i got an email today saying this is available to both silver and gold members, Is the email correct.
I onot see it being available to silver members here.
Arnav, the signals for the Timer are emailed on Sunday, not Friday.
Greg,
re: allocation changes.
1. For some unknown reason P123 reports Buys on Monday dates and Sells on Tuesday dates. Also if Monday is a public holiday it would report one day later, Buys on Tuesday dates and Sells on Wednesday dates.
2. On five occasions allocation changes are only one day apart. This happens when one component model exits the market while another component model simultaneously enters the market. Although the buy and sell signals are generated on the weekend, the buy is recorded on Monday and the sell on Tuesday, which results in the Combo showing the wrong allocation for 1 day. However in real life one would actually do all the switching on Monday, so there would not be any problem.
Actually there are only 144 – 5 = 139 allocation changes.
Thanks for the explanation Georg, I can work with that.
Greg
The downloadable excel spreadsheet has been amended so buy and sell occurs at the same day.
Georg,
When back testing, what price do you use as the execution price for SPY and IEF? I want to simulate the performance for a 401K. Knowing that the signals are e-mailed out on Sunday, I would only be able to execute trades at the closing price of the following trading day (Monday or Tuesday if there is a holiday). I ran a back test using the following days closing prices for trade execution and could not replicate the back testing results. Are you using opening prices or average prices?
Thanks!
I assume that you are referring to the listing in the downloadable excel spreadsheet. The prices of SPY and IEF are adjusted for dividends, and are the adjusted closing prices as of 3/3/2015.
If one downloads this data now from Yahoo Finance one will find different values, because all the prices get adjusted every time a dividend gets paid.
We report trades on Sundays assumed to be executed on the first trading day of the week, usually Monday (or Tuesday).
Georg,
Thank you for the response. I guess what I was trying to ask, in your back-test, if a trade signal is e-mailed out on Sunday and assumed to be executed on Monday, does the back test assume that the trade is executed at the closing price on Monday (4:00 PM EST)? If this is true, and I am trying to follow the signals exactly as they were backtested, I should be executing my trades as near the close as possible. Correct?
The adjusted closing prices are what I was using in my back test model to try and replicate your results. I just want to make sure I am on the same page and using the correct information in my own back test.
Thank you very much for the help!
Yes, we used closing prices for the simulation. However, once the model is a live portfolio, P123 uses trade prices as calculated from this formula: (Hi+Lo+2xClose)/4.
Georg, is the iM-Best SPY IEF updates available to bronze members?
Thanks,
Fred
It is available for silver and gold members only.
georg, After rereading I noticed the 1st component of model described as SPY/IEF 50/220. How is this different from MAC US or is it?
The MAC-US uses moving average cross-over systems of the S&P 500. SPY/IEF uses moving average cross-over systems of SPY adjusted for dividends and runs in P123. The signal dates for the two models are not identical, but not far apart.
I appreciate the work you’ve done on your model and your willingness to share your results, and…
I question your reliance on only 15 years of market data to calibrate your method. I’ve done a lot of these models and calibrated them with up to 65 years of data which is freely available on the Net. My finding has been that all trend-following models approach the ‘buy-and-hold is best’ theorem as the study period is prolonged. The problem then becomes a matter of how much long-term gain you’re willing to sacrifice to avoid some short-term pain.
The past 15 years have been extraordinary in US market history because of the two huge draw-downs. Look at a chart of US equity prices over the past 65 years, preferably a semi-log chart, and you’ll easily see how unusual the past few decades have been.
Do you have a theory that something has fundamentally changed in the nature of market dynamics that justifies ignoring the earlier data? If so, I’d be interested in learning what has changed, how soon it might change back and how we’ll know when that happens.
We have no theory that anything has fundamentally changed in the market’s dynamic, on the contrary we believe that the market movements repeat themselves.
We use 3 component models for the SPY-IEF Market Timer Combo.
The SPY-IEF 50/220 MAC is moving average cross-over system similar to the 50/200 Golden Cross System for the S&P500 index and to our MAC-US model which we have backtested for about 65 years. The 50/220 MAC shows only 11 transactions over the last 15 years.
The SPY-IEF with Best(SSO-TLT) algorithm shows 79 transactions and the
SPY-IEF with Best(SPY-SH) algorithm has 70 transactions over this period.
Thus the huge drawdown during the financial crisis is not the only period which the Timer has partly avoided. However, one should be aware that backtests do not necessarily provide information for the future. Out-of-sample performance may be much different.
Also I don’t agree with you that the past two decades have been so unusual. Look at Figure-1 in https://imarketsignals.com/2015/is-the-stock-market-overvalued-estimating-returns-to-2020-and-beyond/ which tracks the stock market from 1880 onward. This is a semi-log chart exactly as you recommend. One can see that the the upper and lower 95% prediction bands encompass the variations of the market and one can see many periods where variation were similar to the period from 2000 onward.
I’m wondering why you give the SPY/SH signal 25% of the allocation, but give SSO/TLT 50% – even though the general descriptions of how each system arrives at a signal seems identical. Why not give each one 33%? Why is SSO/TLT given such a greater share (double)?
Looking at Figure 1 on the page you cited, I was at first baffled by the appearance of a tight channel that I never saw on the data I had been looking at. Then I read the fine print: REAL PRICES make a huge difference! Thanks for publishing this.
If SPY/SH reversed today to SPY why is this model still at 25%?
The SPY-IEF system follows the algorithm of our Best(SPY-SH) model. There is a basic ranking system in the models which also affect the signals. Currently the SPY-IEF system is still in IEF, while the Best(SPY-SH) switches to SPY today.
The previous signal was on 03/09/15 when both models sold SPY and switched to SH and IEF, respectively.
Looking at “Most Recent updates” from the Home Page for data current to today,
9-14-15, I see this :
September 13, 2015
iM-Best Holdings
9/13/2015 Best(SPY-IEF) switches to 75% SPY and 25% IEF .
(The BVR-model avoids high beta bonds (long-bonds) and also intermediate duration bonds.)
iM-Best(SPY-IEF) Market Timer
Date Percent allocation of SPY and IEF
09/14/15 25% SPY 25% IEF
09/08/15 100% SPY
08/31/15 25% SPY 75% IEF
08/24/15 25% SPY 75% IEF
08/17/15 25% SPY 75% IEF
08/10/15 25% SPY 75% IEF
08/03/15 25% SPY 75% IEF
07/27/15 25% SPY 75% IEF
07/20/15 25% SPY 75% IEF
07/13/15 25% SPY 75% IEF
07/06/15 25% SPY 75% IEF
06/29/15 25% SPY 75% IEF
06/22/15 25% SPY 75% IEF
06/15/15 25% SPY 75% IEF
06/08/15 25% SPY 75% IEF
06/01/15 25% SPY 75% IEF
05/26/15 25% SPY 75% IEF
05/18/15 25% SPY 75% IEF
05/11/15 25% SPY 75% IEF
05/04/15 25% SPY 75% IEF
04/27/15 25% SPY 75% IEF
04/20/15 25% SPY 75% IEF
04/13/15 25% SPY 75% IEF
04/06/15 25% SPY 75% IEF
03/30/15 25% SPY 75% IEF
03/23/15 25% SPY 75% IEF
03/16/15 25% SPY 75% IEF
03/09/15 75% SPY 25% IEF
03/02/15 100% SPY
My question is this, the statement says “9/13/2015 Best(SPY-IEF) switches to 75% SPY and 25% IEF but the chart right below shows “09/14/15 25% SPY 25% IEF. Is this a typo…should it not say 75% SPY instead of 25% SPY.
Thank You
Yes, this is a typo. You can see that the graphical display shows 75% SPY and 25% IEF.
Thank You
Variation on using i-Best (SPY-IEF) Market Timer:
Georg and Anton, I’m sure you have looked at this angle before, but here goes anyway. I’ve done some testing using your iM-Best (SPY-IEF) Market Timer model in the following way: Hold 100% SPY if percent allocation of SPY is 75% or greater Hold 100% XLU if percent allocation of SPY is at 50% Hold 100% VFITX if percent allocation of SPY is 25% or lower My son coded this into Amibroker with the following results: Annual % Return from 1/4/2000 thru 10/16/2015 = 19.39% Max system drawdown = -15.92% Substituting IEF for VFITX: Annual % Return = 18.06% Max system drawdown = -15.92% There has not been a down year during the whole back test period. I would appreciate your thoughts.
Respectfully yours, Paul
Paul, your model provides higher returns than the SPY-IEF Timer, but D/D is also a bit higher.
For the same backtest period the Timer gives Annual % Return = 16.2%. Max drawdown = -10.3%. Also only positive calendar year returns.
Also you will get higher returns with MDY instead of SPY.
I wonder what the DD would be using MDY vs SPY as you noted above for the SPY-IEF timer?
Thanks Steve
Hi,
I noticed some price discrepancies on the downloadable Excel spreadsheet compared to the stock quotes from Google and Yahoo for some of the earlier dates. For example, in the spreadsheet, SPY is listed with prices of 67.19 and 97.21 for 1/27/2003 and 1/10/2005, respectively. Google/Yahoo shows prices of 85.20 and 119 for the same dates. This seems to be more than just slippage. The most recent dates seem to be more accurate. Can you explain why there is such a difference?
You have to use values adjusted for dividends. The higher values you mention are the actual closing prices.
Thanks for this system. However, SPY-SH has been in SH, but the SPY-IEF model is 100% SPY (instead of 75%). Did I misunderstand the system? Thanks.
Apart from the buy- and sell rules which are the same, there is also a ranking system in the models. Thus when the SPY-SH model is in SH it does not automatically indicate that the SPY-IEF model will be in IEF at the same time.
Very helpful. Thanks.
Can you tell me why you do not have this model in the performance sheet like the other strat’s? Thanks.
Many have asked this question, you can see the weekly and yearly performance in our performance tables, which head the performance reports. The individual performance sheets on a weekly basis will not add value nor more information.
Where can I find the link to the article about improving the use of the SPY-IEF model? Could not find it on the Featured or Recent Posts.
Thanks.
Here is the link, it can also be found on the home page in the table that reports the Best(SPY-IEF) Model holdings
Hmmm, that link didn’t work.
Above link is corrected
The link on the home page goes to the original explanation of the model. I am looking for the subsequent piece where you talked about alternative ways to use that model.
It is the link in the middle of the table just above the holdings
The link in the middle went here… iM-Best(SPY-IEF) Market Timer: A Combination of Three Market Timing Models
The link above went to… Better Returns from Exchange Traded Funds with iM’s Market Climate Grader
I was looking for a piece you did on getting the most from the SPY-IEF system.
Bill, your memory is better than mine. https://imarketsignals.com/2015/getting-the-most-from-the-im-bestspy-ief-market-timer/ is what I think you want
Thanks Anton, that’s it.
George/Anton
Given the possibility of erroneous data with Spy/SH and SSO/TLT. What can be said about the signals being produced by this model?
There are three models in this combo, two of which use partially the algorithm from the SPY-SH and SSO-TLT models. Switching signals do not necessarily occur on the same date for the SPY-IEF models as for the underlying models. Where applicable, the issue with SPEPSCY has been resolved.
Similar question as Gasman above. Going forward is this model, SPY-IEF, based on the revised (due to issues with CYEPS) SSO-Bond and SPY-SH models?
Hope so. Otherwise it would seem that it is not as accurate as it could be.
Thanks,
Bill
Please see our comment above.
What would returns/drawdowns be like if you combined this model with other models? For instance, 33% SPY-IEF timer, 33% aggressive market grade model, and 33% Bestoga?
Thanks! The reason I ask is, it would seem a structure like that would have less turnover than the new Combo 5/6.
The Market Timer and Grader models are not intended to be trading models on their own, and are also not in intended for a combo.
Georg & Anton,
In following up on Buddy94’s post above, I would think we will all benefit if you decided to create a Master Excel of sorts. All your fans, subscribers, users could come up with various combinations from which other subscribers could benefit as well.
You could do this on a subscriber only area. Truly would lessen the burden on you to keep back-testing various combinations and would allow users to participate in helping you create “future” Combos.
I am sure I am not the first one to suggest this to you.
You have already shared Annual return & drawdown info on Combo 5 & 6. If you would publish to subscribers, an Excel containing just the monthly return & drawdown info from 2000-current & then periodic updates of all the strategies, this could then be used to experiment with and play around to come up with many more Combos. I guess this is the software model, where users participate to improve the original product and a community of fans gets involved to create even more buzz. I will market to friends & on social media if I am an active user of this community and am involved.
Please think about it and see if there are any risks or downside for you.
RV
Hello there,
I apologize in advance if I am missing something obvious about the SPY-IEF model, but why is it in cash as of 1/9/2017?
Thanks.
The SPY-IEF combo as of 1/8/2017 holds 50% SPY and 50% Cash. The component model based on the SSO-TLT algo went from IEF to Cash. This model has a 50% weight in the combination.
Is there a spreadsheet available that shows trades for SPY-IEF Market Timer for years 2015 and 2016?
Thank you
The listing of holdings from the home page is:
iM-Best(SPY-IEF) Market Timer
7/30/2018 100% SPY
7/2/2018 100% SPY
6/25/2018 50% SPY 50% IEF
6/18/2018 100% SPY
5/21/2018 100% SPY
5/14/2018 75% SPY 25% IEF
5/7/2018 100% SPY
4/9/2018 50% SPY 50% IEF
2/26/2018 100% SPY
2/20/2018 75% SPY 25% IEF
2/12/2018 100% SPY
2/5/2018 50% SPY 50% IEF
1/22/2018 100% SPY
7/24/2017 100% SPY
7/17/2017 75% SPY 25% IEF
7/10/2017 75% SPY 25% IEF
7/3/2017 50% SPY 50% IEF
6/26/2017 100% SPY
6/19/2017 100% SPY
6/12/2017 100% SPY
6/5/2017 100% SPY
5/30/2017 100% SPY
5/22/2017 100% SPY
5/15/2017 100% SPY
5/8/2017 75% SPY 25% IEF
5/1/2017 75% SPY 25% IEF
4/24/2017 75% SPY 25% IEF
4/17/2017 100% SPY
4/10/2015 100% SPY
4/3/2017 100% SPY
3/27/2017 50% SPY 50% IEF
3/20/2017 100% SPY
3/13/2017 100% SPY
3/6/2017 100% SPY
2/27/2017 100% SPY
2/21/2017 100% SPY
2/13/2017 100% SPY
2/6/2017 100% SPY
1/30/2017 100% SPY
1/23/2017 100% SPY
1/17/2017 100% SPY
1/9/2017 50% SPY 50% CASH
1/3/2017 50% SPY 50% IEF
This is beginning of 2017 onward, but still can’t find trades for between march 2015 and january 2017. I assume Jan 2017 was the beginning of the out of sample period, but is there no in sample trades for most of 2015 and all of 2016?
There are no in-sample trades for a combo. All you get is the combined performance of the three models.
What would be the results if you change IEF to cash?
Results if one changed IEF to cash (SHV)
Number of Assets 3
Period 12/31/99 – 08/03/18
Benchmark S&P 500 (SPY)
Quick Stats as of 8/3/2018
Total Return 779.90%
Benchmark Return 172.84%
Active Return 607.06%
Annualized Return 12.41%
Max Drawdown -11.61%
Benchmark Max Drawdown -55.19%
Sharpe Ratio 1.20
Correlation with S&P 500 (SPY) 0.71
Hi,
Could you give us an update on the results (quick stats) as of today?
Thank you!
G
I noticed this model went to 50% SPY / 50% IEF today. Which algorithm or algorithms of the three went out of stocks and into bonds?
Thanks
Tom C
SPY-IEF with Best(SSO-TLT) algo is moving from SPY to IEF.
Georg,
When you talk about the SPY-IEF 50/220 MAC you use EMA, correct? Are you using EMA instead of SMA in ALL your strategies unless stated otherwise?
Tnx…
drftr
To answer that myself: You use EMA vs MA (instead of SMA).
drftr
I noticed this model has been 25% SPY 75% IEF for over a month now. Which of the algorithms signal IEF at this point?
Thanks.
Tom C
Still trying to figure this out. How could this model not be at least 50% SPY at this point?
Tom C
SPY-SH is in SPY (25%)
50/220 MAC is in SPY (25%)
SSO-TLT (50%)
Thank you again for providing such a profitable service. In general terms, do you guess that using strategies that switch into IEF (such as this one but there are others such as Flip Saver and Super Timer), could improve returns slightly using your BVR Model for guidance when switching to bonds is mandated? Should a switch to bonds be asked for, just use the BVR for short, mid, or long term maturities at that point in time rather than always using IEF? I understand this is just a guess and not something that has been analyzed. Thanks.
The weekly email for March 1 clearly shows no change for the Best(SPY-IEF) Market Timer Combo model. But I just checked the website and it says that on March 1 the model switched to 75% SPY 25% IEF. Please explain what happened.
Thank you for pointing out this discrepancy.
The email was correct, the site was wrongly updated. The person who updated the site was confused by the Market Climate Grader (a component of the iM-Stock Market Confidence Level) that reduced its holding to 75% and erroneously updated the Best(SPY-IEF) Market Timer Combo to that value as well.