
  |
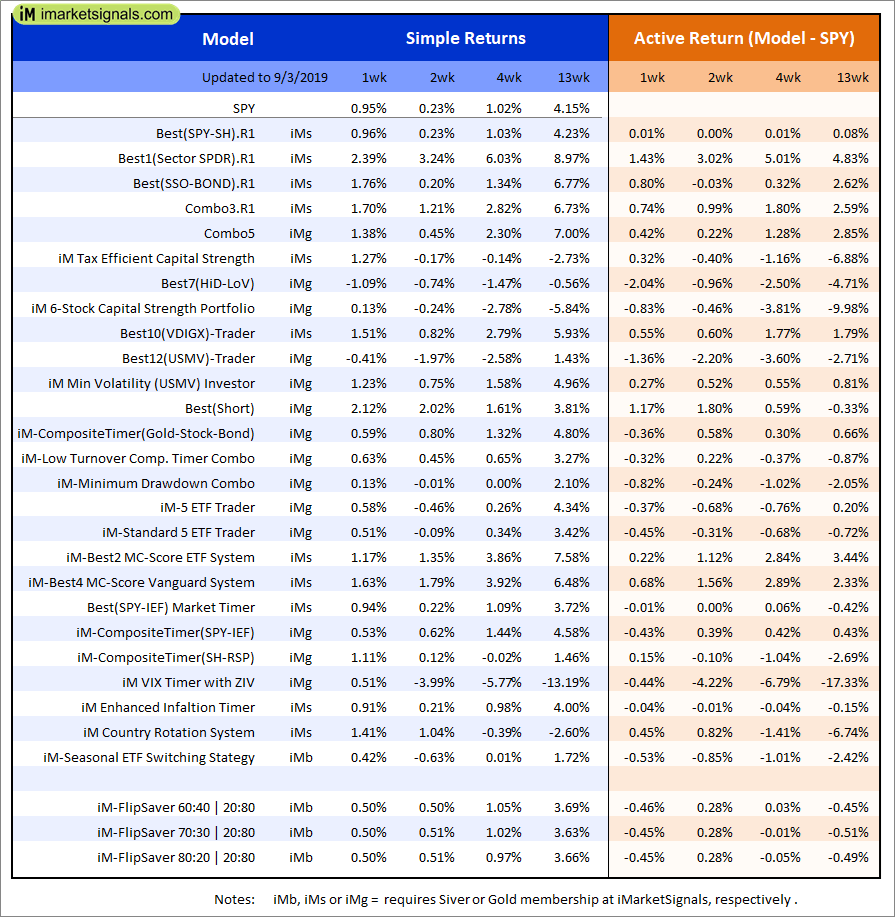
Out of sample performance summary of our models for the past 1, 2, 4 and 13 week periods. The active active return indicates how the models over- or underperformed the benchmark ETF SPY. Also the YTD, and the 1-, 3-, 5- and 10-year annualized returns are shown in the second table |
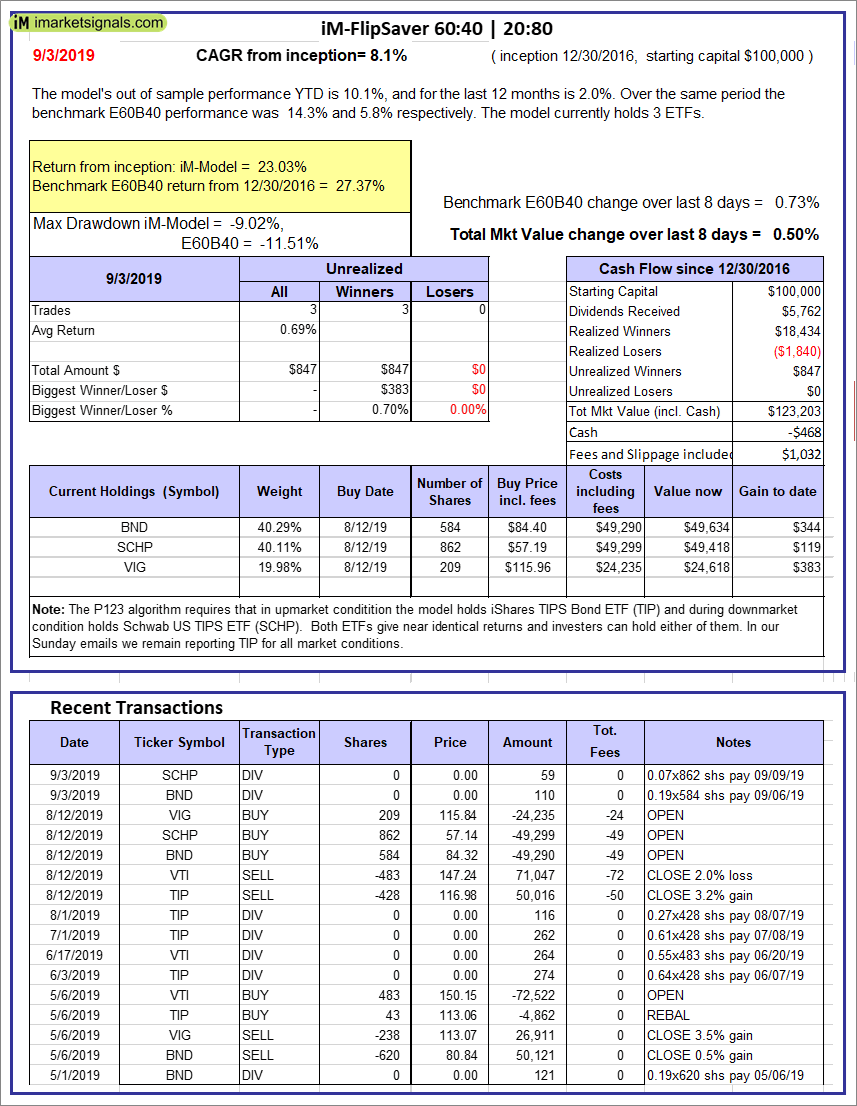 |
iM-FlipSaver 60:40 | 20:80 – 2017: The model’s out of sample performance YTD is 10.1%, and for the last 12 months is 2.0%. Over the same period the benchmark E60B40 performance was 14.3% and 5.8% respectively. Over the previous week the market value of iM-FlipSaver 80:20 | 20:80 gained 0.50% at a time when SPY gained 0.73%. A starting capital of $100,000 at inception on 7/16/2015 would have grown to $123,203 which includes -$468 cash and excludes $1,032 spent on fees and slippage. |
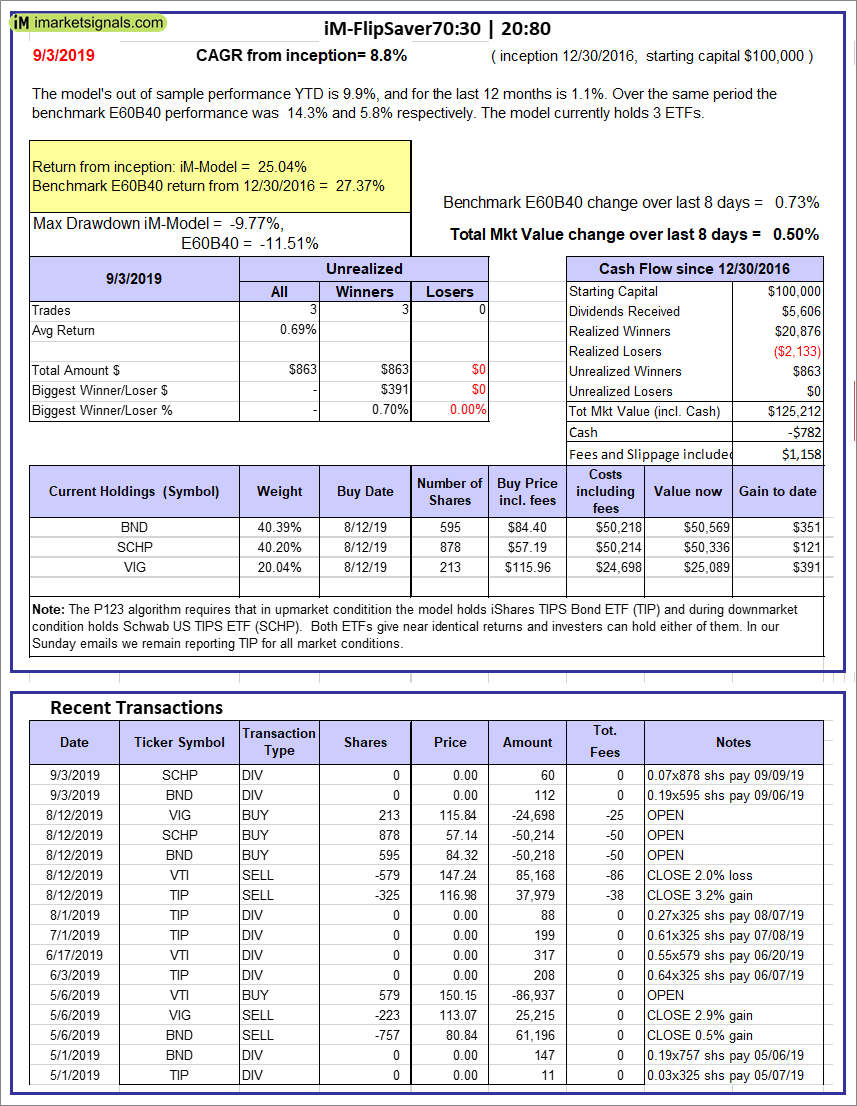 |
iM-FlipSaver 70:30 | 20:80 – 2017: The model’s out of sample performance YTD is 9.9%, and for the last 12 months is 1.1%. Over the same period the benchmark E60B40 performance was 14.3% and 5.8% respectively. Over the previous week the market value of iM-FlipSaver 70:30 | 20:80 gained 0.50% at a time when SPY gained 0.73%. A starting capital of $100,000 at inception on 7/15/2015 would have grown to $125,212 which includes -$782 cash and excludes $1,158 spent on fees and slippage. |
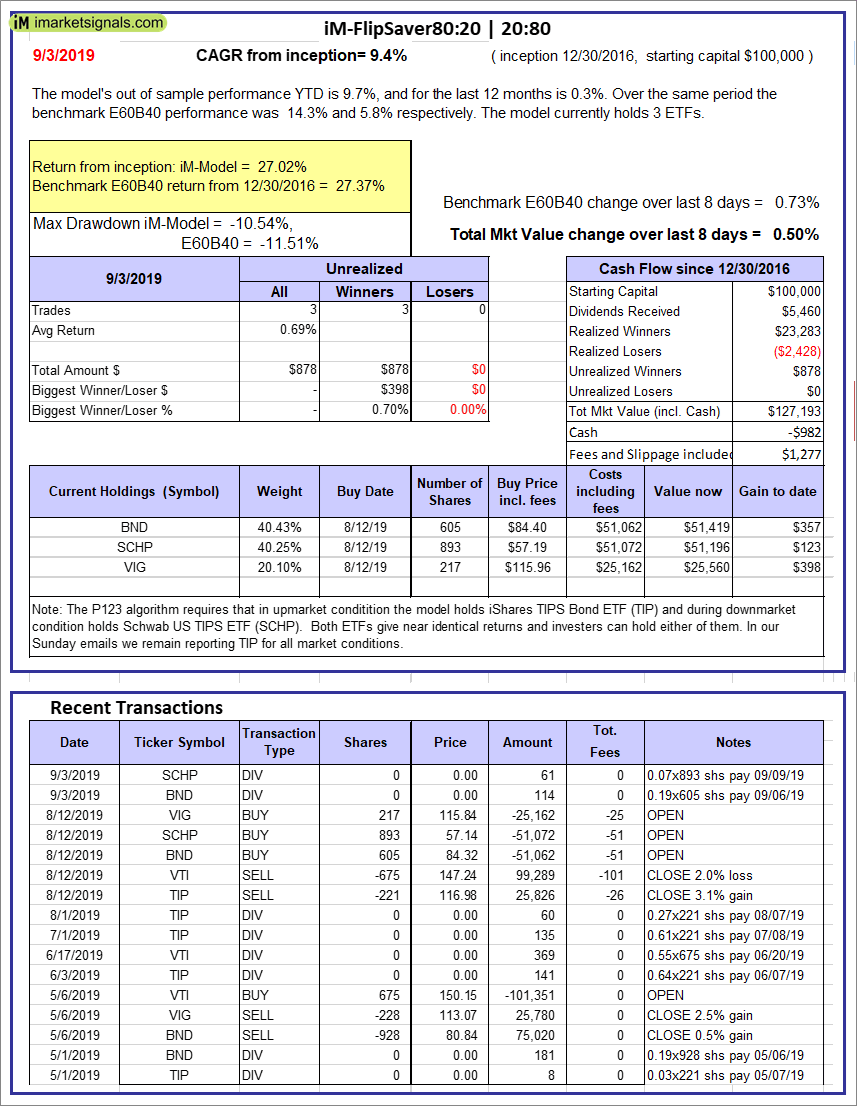 |
iM-FlipSaver 80:20 | 20:80 – 2017: The model’s out of sample performance YTD is 9.7%, and for the last 12 months is 0.3%. Over the same period the benchmark E60B40 performance was 14.3% and 5.8% respectively. Over the previous week the market value of iM-FlipSaver 80:20 | 20:80 gained 0.50% at a time when SPY gained 0.73%. A starting capital of $100,000 at inception on 1/2/2017 would have grown to $127,193 which includes -$982 cash and excludes $1,277 spent on fees and slippage. |
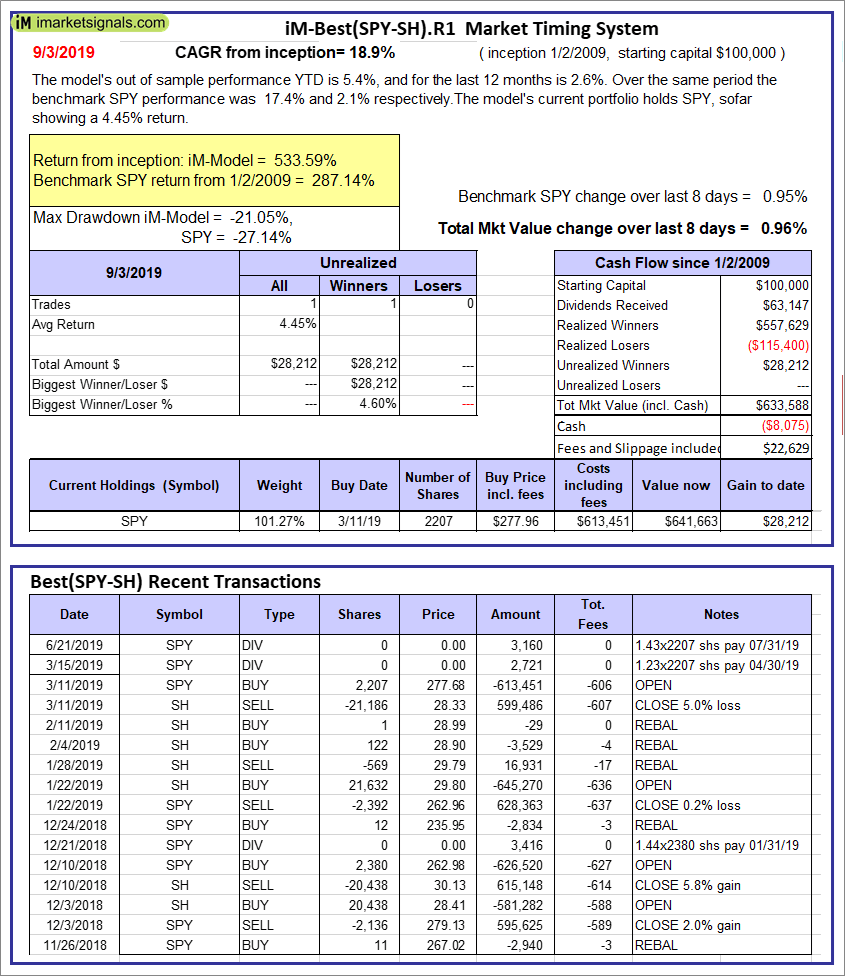 |
iM-Best(SPY-SH).R1: The model’s out of sample performance YTD is 5.4%, and for the last 12 months is 2.6%. Over the same period the benchmark SPY performance was 17.4% and 2.1% respectively. Over the previous week the market value of Best(SPY-SH) gained 0.96% at a time when SPY gained 0.95%. A starting capital of $100,000 at inception on 1/2/2009 would have grown to $633,588 which includes -$8,075 cash and excludes $22,629 spent on fees and slippage. |
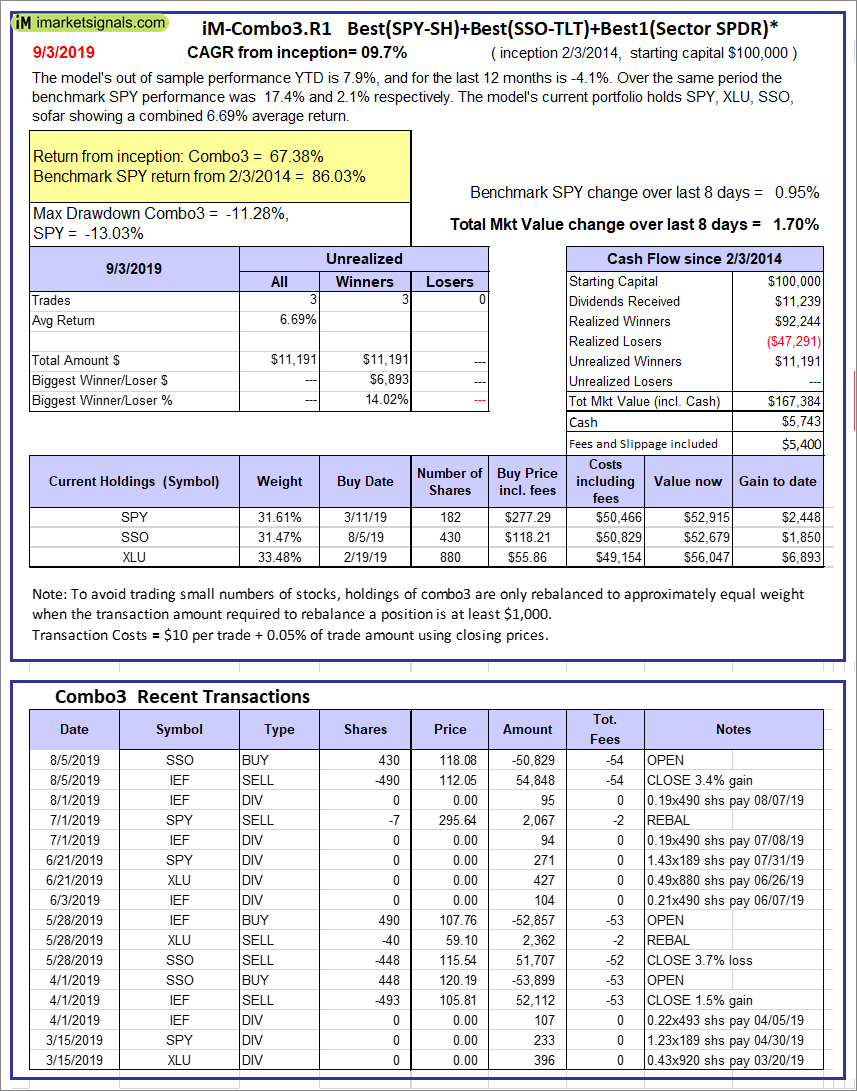 |
iM-Combo3.R1: The model’s out of sample performance YTD is 7.9%, and for the last 12 months is -4.1%. Over the same period the benchmark SPY performance was 17.4% and 2.1% respectively. Over the previous week the market value of iM-Combo3.R1 gained 1.70% at a time when SPY gained 0.95%. A starting capital of $100,000 at inception on 2/3/2014 would have grown to $167,384 which includes $5,743 cash and excludes $5,400 spent on fees and slippage. |
 |
iM-Combo5: The model’s out of sample performance YTD is 10.9%, and for the last 12 months is -2.8%. Over the same period the benchmark SPY performance was 17.4% and 2.1% respectively. Over the previous week the market value of iM-Combo5 gained 1.38% at a time when SPY gained 0.95%. A starting capital of $100,000 at inception on 2/22/2016 would have grown to $141,232 which includes $1,563 cash and excludes $0 spent on fees and slippage. |
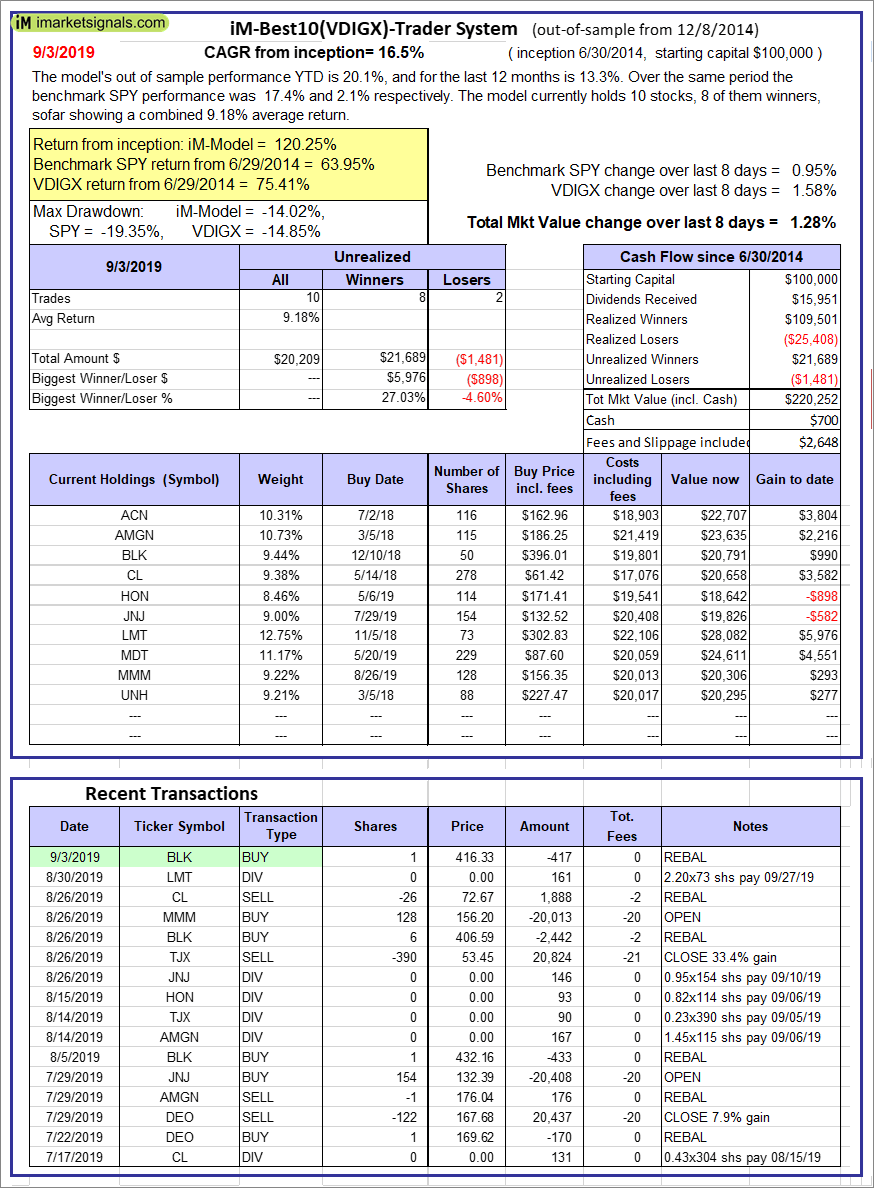 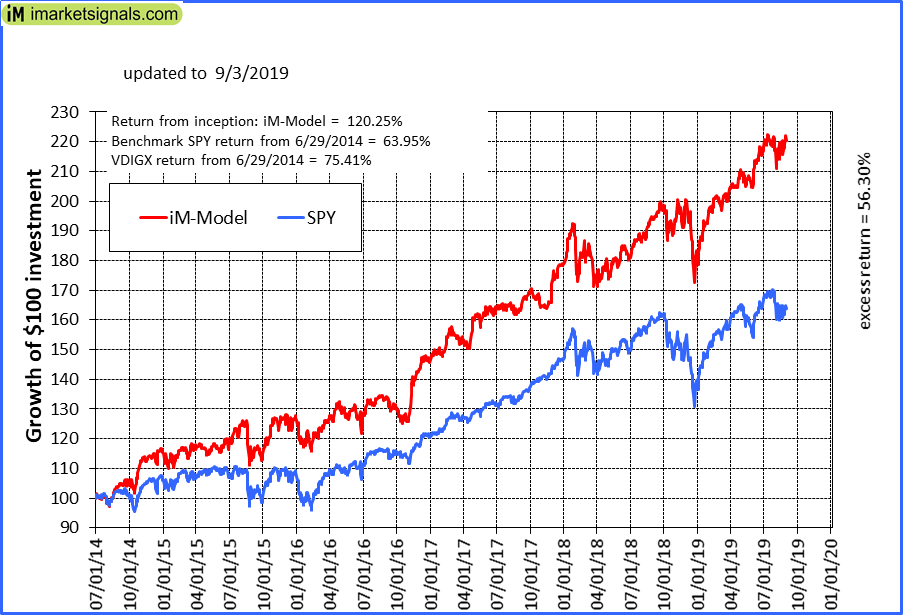 |
iM-Best10(VDIGX)-Trader: The model’s out of sample performance YTD is 20.1%, and for the last 12 months is 13.3%. Over the same period the benchmark SPY performance was 17.4% and 2.1% respectively. Since inception, on 7/1/2014, the model gained 120.25% while the benchmark SPY gained 63.95% and VDIGX gained 75.41% over the same period. Over the previous week the market value of iM-Best10(VDIGX) gained 1.28% at a time when SPY gained 0.95%. A starting capital of $100,000 at inception on 7/1/2014 would have grown to $220,252 which includes $700 cash and excludes $2,648 spent on fees and slippage. |
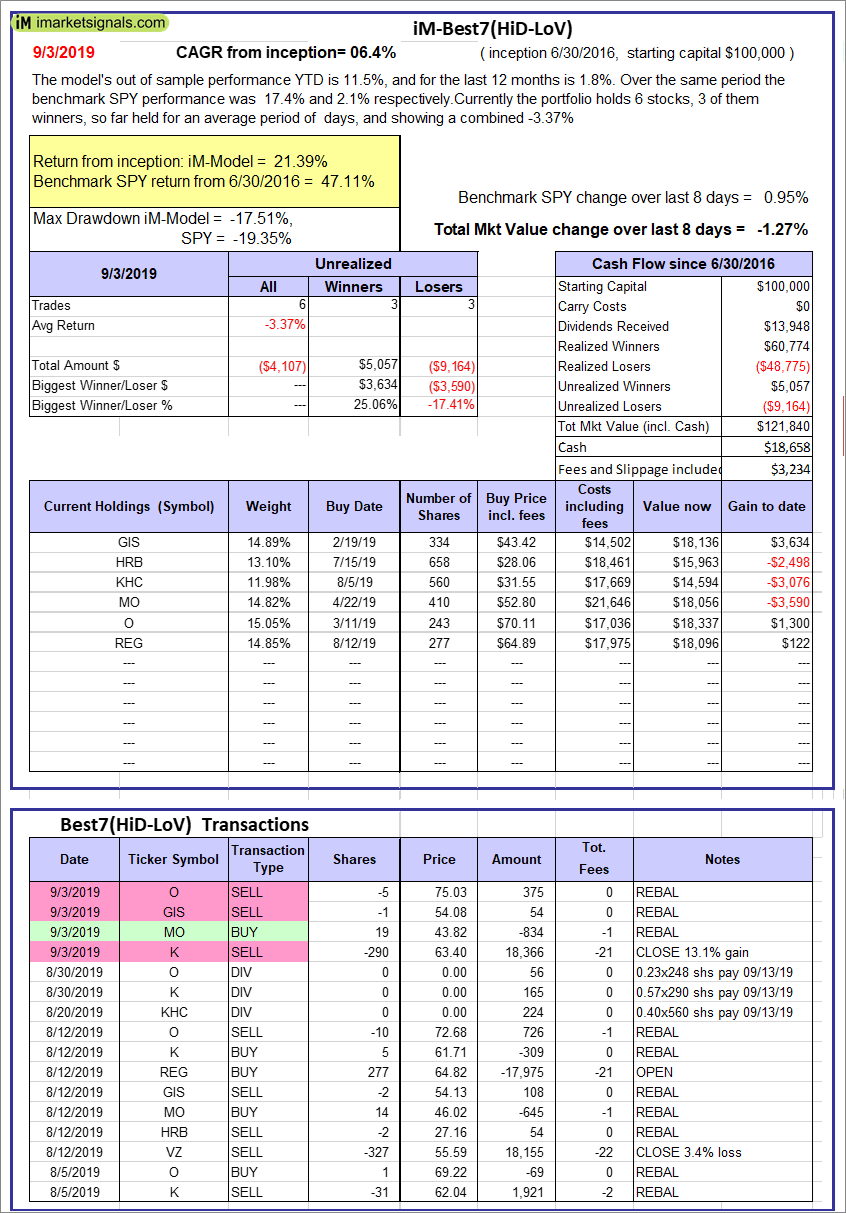 |
iM-Best7(HiD-LoV): The model’s out of sample performance YTD is 11.5%, and for the last 12 months is 1.8%. Over the same period the benchmark SPY performance was 17.4% and 2.1% respectively. Over the previous week the market value of iM-Best7(HiD-LoV) gained -1.27% at a time when SPY gained 0.95%. A starting capital of $100,000 at inception on 6/30/2016 would have grown to $121,840 which includes $18,658 cash and excludes $3,234 spent on fees and slippage. |
 |
iM 6-Stock Capital Strength Portfolio: The model’s out of sample performance YTD is 0.7%, and for the last 12 months is -6.0%. Over the same period the benchmark SPY performance was 17.4% and 2.1% respectively. Over the previous week the market value of the iM 6-Stock Capital Strength Portfolio gained -0.19% at a time when SPY gained 0.95%. A starting capital of $100,000 at inception on 10/28/2016 would have grown to $151,747 which includes $1,337 cash and excludes $1,037 spent on fees and slippage. |
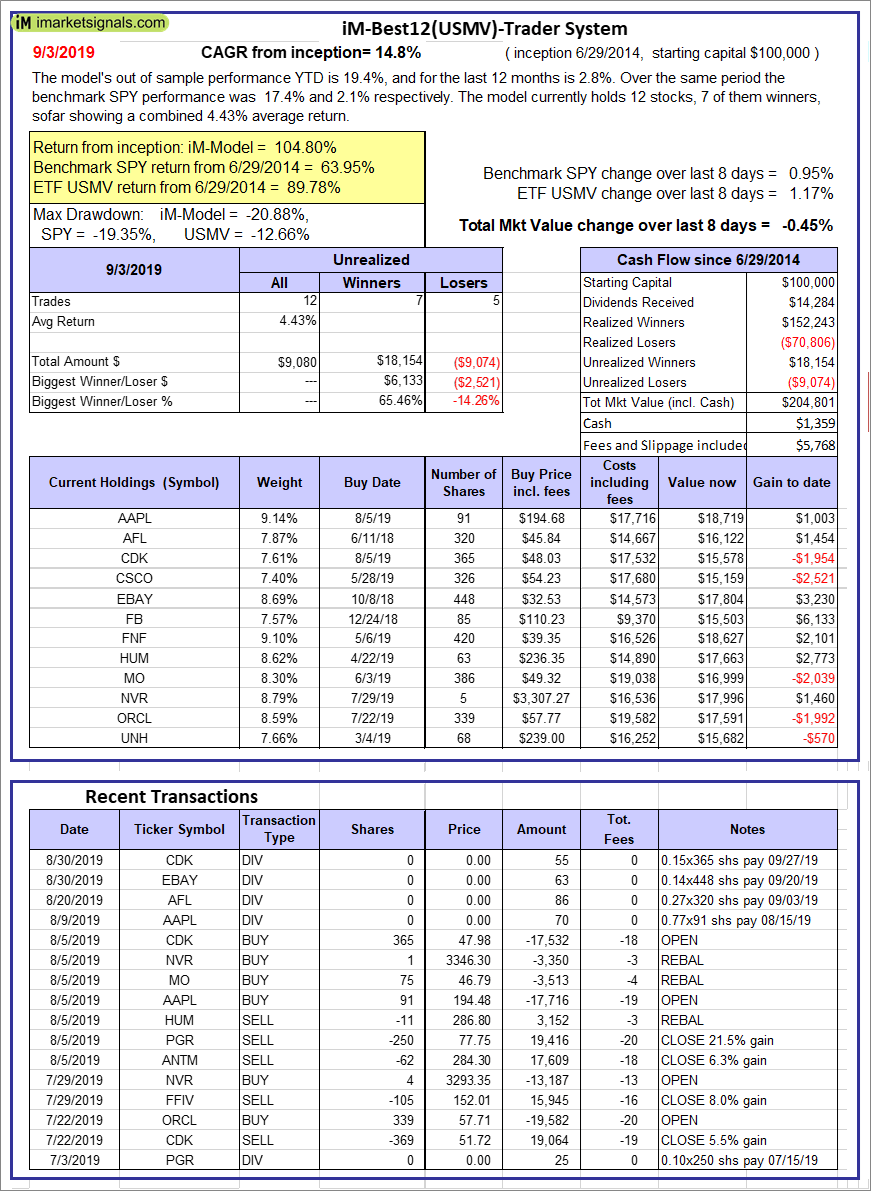 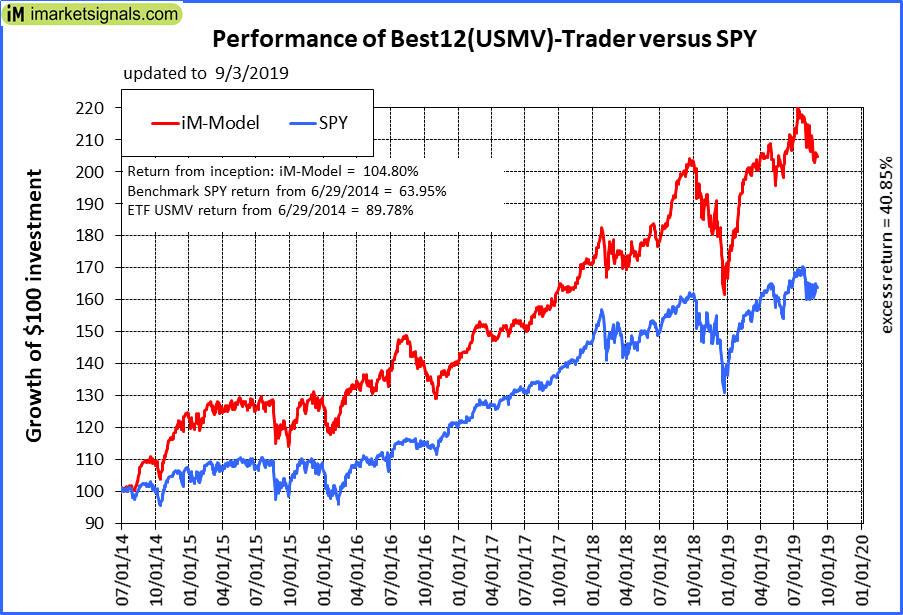 |
iM-Best12(USMV)-Trader: The model’s out of sample performance YTD is 19.4%, and for the last 12 months is 2.8%. Over the same period the benchmark SPY performance was 17.4% and 2.1% respectively. Since inception, on 6/30/2014, the model gained 104.80% while the benchmark SPY gained 63.95% and the ETF USMV gained 89.78% over the same period. Over the previous week the market value of iM-Best12(USMV)-Trader gained -0.45% at a time when SPY gained 0.95%. A starting capital of $100,000 at inception on 6/30/2014 would have grown to $204,801 which includes $1,359 cash and excludes $5,768 spent on fees and slippage. |
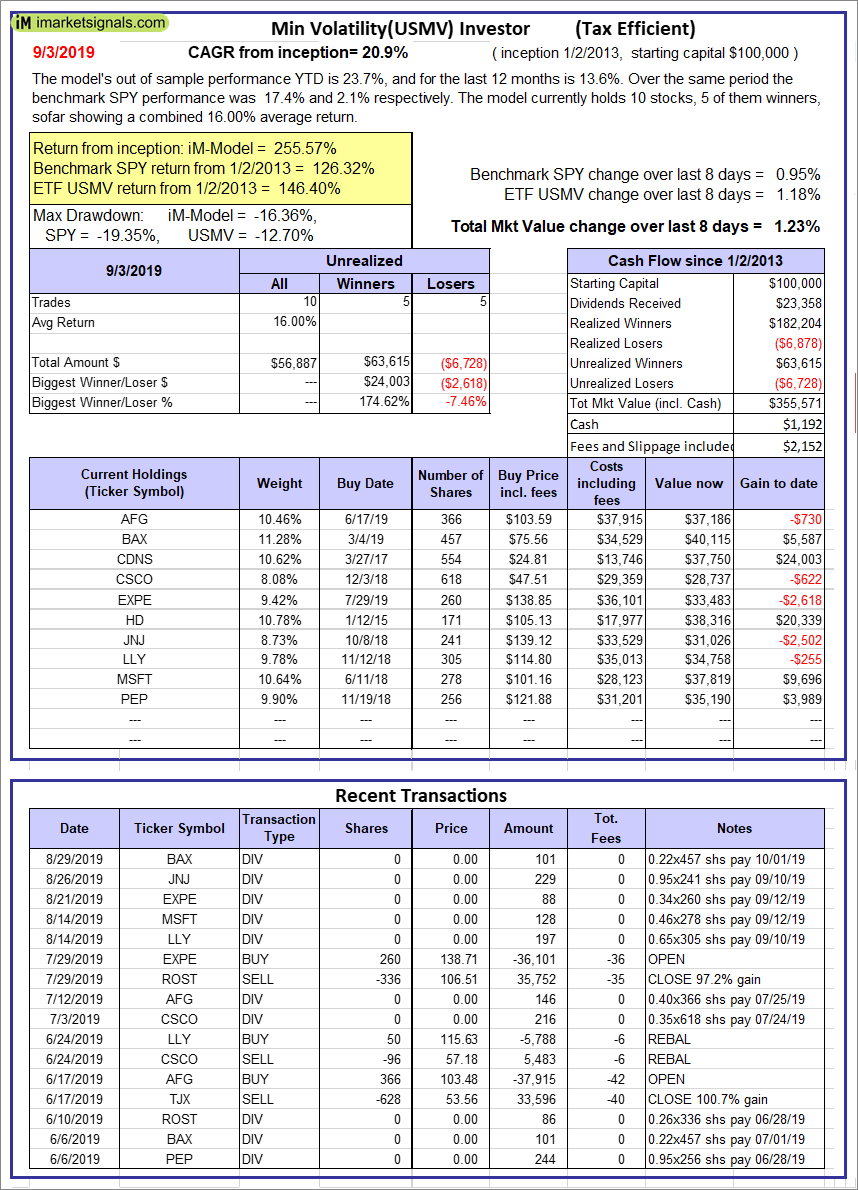 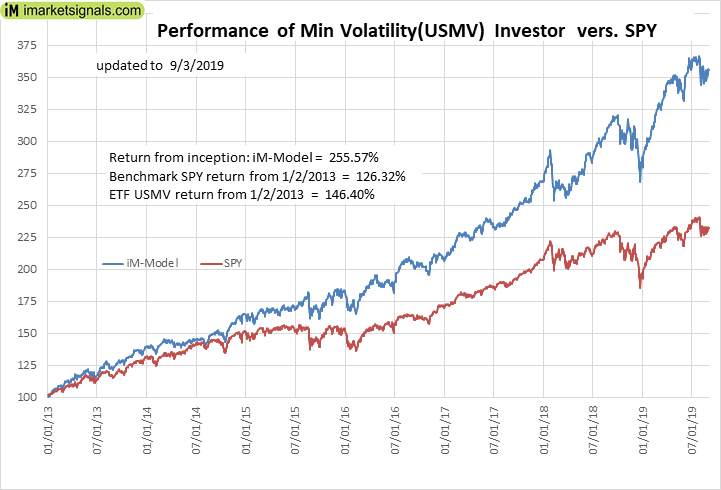 |
iM Min Volatility (USMV) Investor: The model’s out of sample performance YTD is 23.7%, and for the last 12 months is 13.6%. Over the same period the benchmark SPY performance was 17.4% and 2.1% respectively. Since inception, on 1/3/2013, the model gained 255.57% while the benchmark SPY gained 126.32% and the ETF USMV gained 146.40% over the same period. Over the previous week the market value of iM Min Volatility (USMV) Investor gained 1.23% at a time when SPY gained 0.95%. A starting capital of $100,000 at inception on 1/3/2013 would have grown to $355,571 which includes $1,192 cash and excludes $2,152 spent on fees and slippage. |
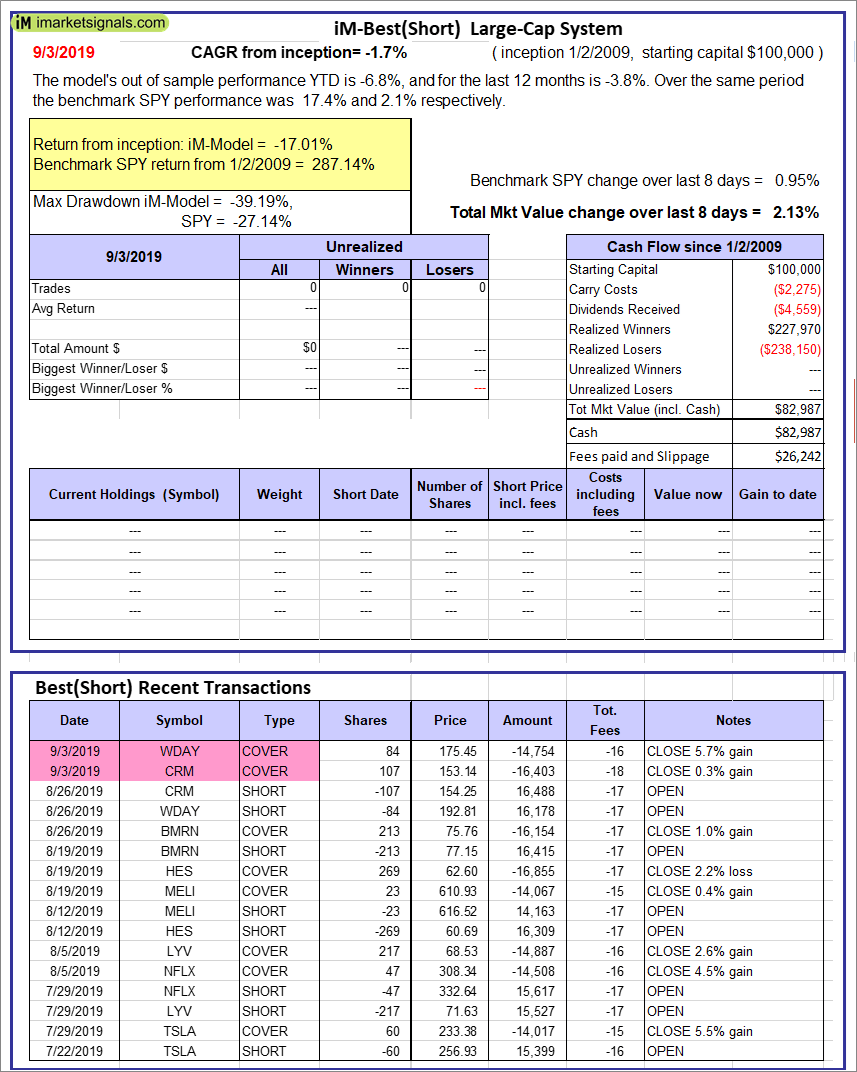 |
iM-Best(Short): The model’s out of sample performance YTD is -6.8%, and for the last 12 months is -3.8%. Over the same period the benchmark SPY performance was 17.4% and 2.1% respectively. Over the previous week the market value of iM-Best(Short) gained 2.13% at a time when SPY gained 0.95%. Over the period 1/2/2009 to 9/3/2019 the starting capital of $100,000 would have grown to $82,987 which includes $82,987 cash and excludes $26,242 spent on fees and slippage. |
 |
iM-Best2 MC-Score ETF System: The model’s out of sample performance YTD is 13.8%, and for the last 12 months is 5.4%. Over the same period the benchmark SPY performance was 17.4% and 2.1% respectively. Over the previous week the market value of the iM-Best2 MC-Score ETF System gained 1.17% at a time when SPY gained 0.95%. A starting capital of $100,000 at inception on 6/30/2016 would have grown to $120,667 which includes $70 cash and excludes $673 spent on fees and slippage. |
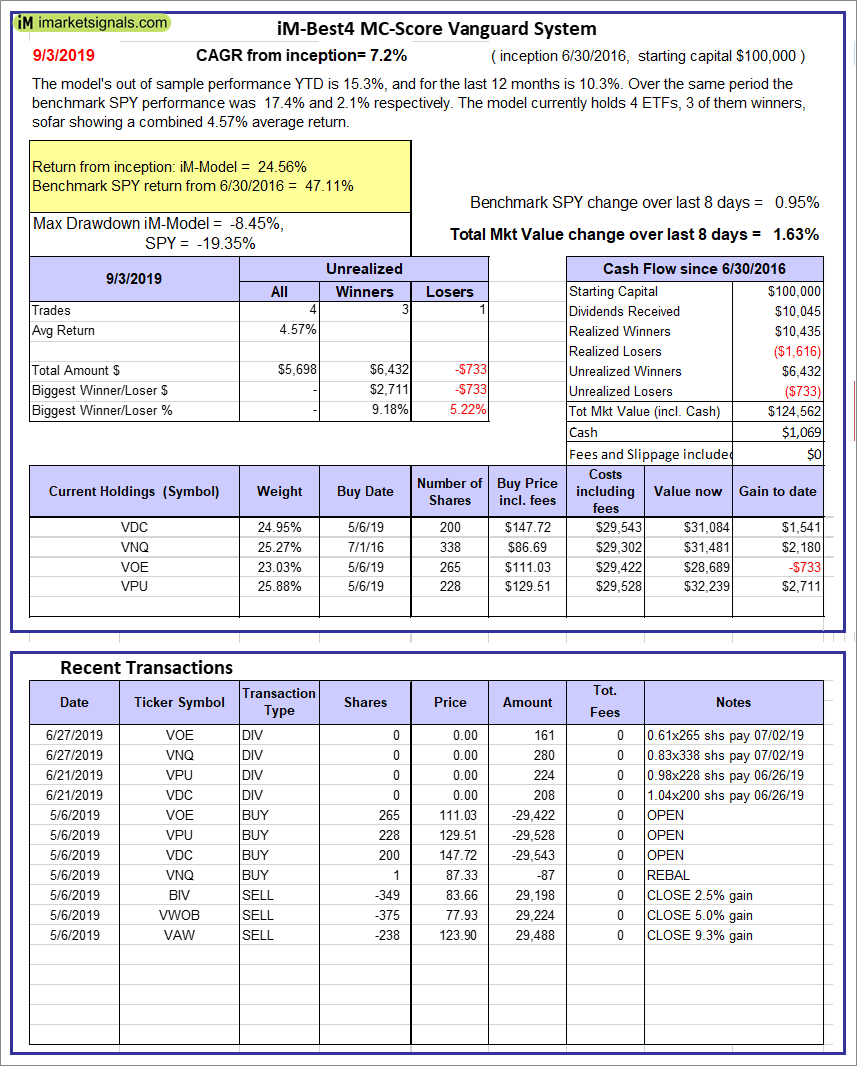 |
iM-Best4 MC-Score Vanguard System: The model’s out of sample performance YTD is 15.3%, and for the last 12 months is 10.3%. Over the same period the benchmark SPY performance was 17.4% and 2.1% respectively. Over the previous week the market value of the iM-Best4 MC-Score Vanguard System gained 1.63% at a time when SPY gained 0.95%. A starting capital of $100,000 at inception on 6/30/2016 would have grown to $124,562 which includes $1,069 cash and excludes $00 spent on fees and slippage. |
 |
iM-Composite (SH-RSP) Timer: The model’s out of sample performance YTD is 14.9%, and for the last 12 months is -0.5%. Over the same period the benchmark SPY performance was 17.4% and 2.1% respectively. Over the previous week the market value of the iM-Composite (SH-RSP) Timer gained 1.07% at a time when SPY gained 0.95%. A starting capital of $100,000 at inception on 6/30/2016 would have grown to $138,018 which includes $5,737 cash and excludes $513 spent on fees and slippage. |
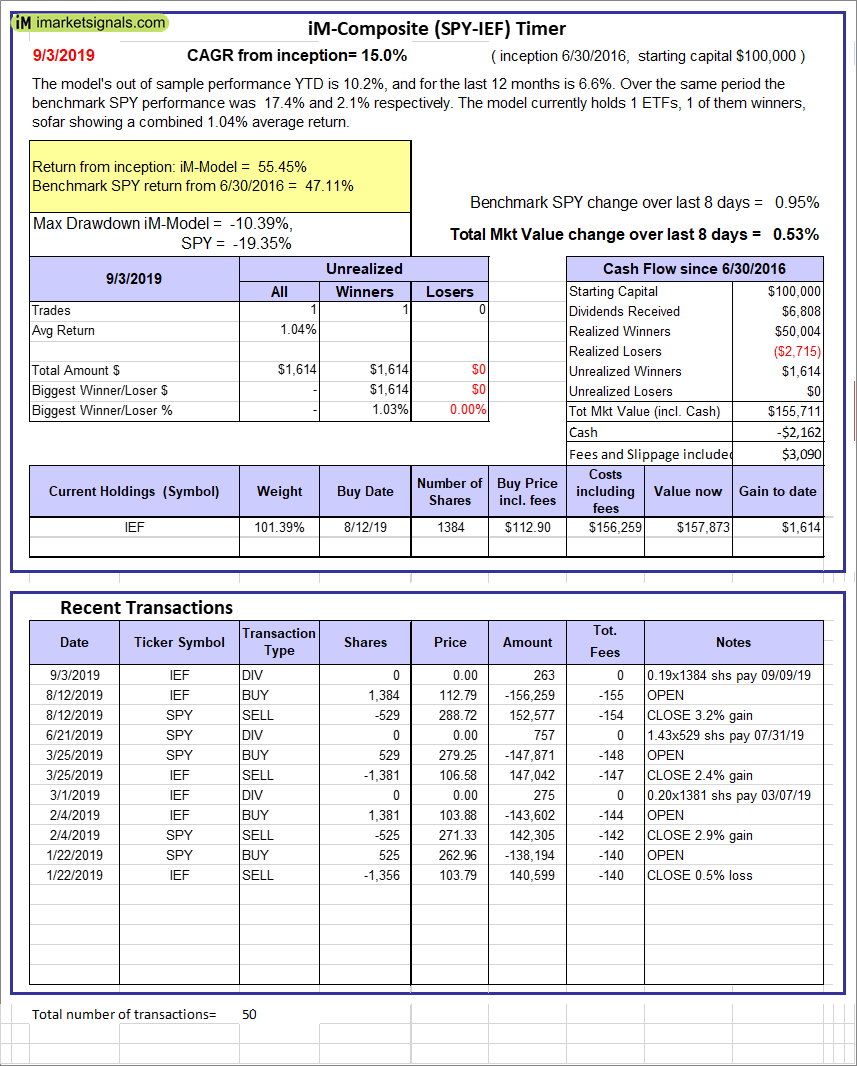 |
iM-Composite (SPY-IEF) Timer: The model’s out of sample performance YTD is 10.2%, and for the last 12 months is 6.6%. Over the same period the benchmark SPY performance was 17.4% and 2.1% respectively. Over the previous week the market value of the iM-Composite (SPY-IEF) Timer gained 0.53% at a time when SPY gained 0.95%. A starting capital of $100,000 at inception on 6/30/2016 would have grown to $155,711 which includes -$2,162 cash and excludes $3,090 spent on fees and slippage. |
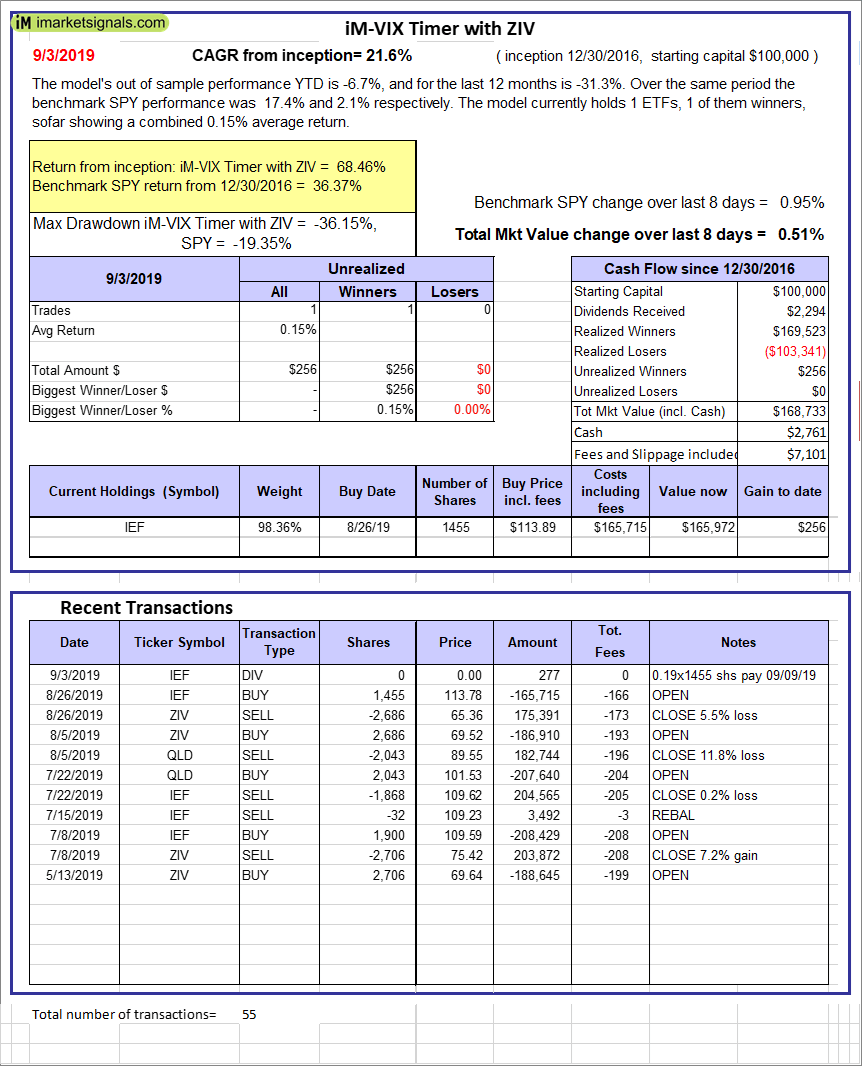 |
iM-VIX Timer with ZIV: The model’s out of sample performance YTD is -6.7%, and for the last 12 months is -31.3%. Over the same period the benchmark SPY performance was 17.4% and 2.1% respectively. Over the previous week the market value of the iM-VIX Timer with ZIV gained 0.51% at a time when SPY gained 0.95%. A starting capital of $100,000 at inception on 6/30/2016 would have grown to $168,733 which includes $2,761 cash and excludes $7,101 spent on fees and slippage. |
 |
iM-Composite(Gold-Stocks-Bond) Timer: The model’s out of sample performance YTD is 14.4%, and for the last 12 months is 6.2%. Over the same period the benchmark SPY performance was 17.4% and 2.1% respectively. Over the previous week the market value of the iM-Composite(Gold-Stocks-Bond) Timer gained 0.59% at a time when SPY gained 0.95%. A starting capital of $100,000 at inception on 6/30/2016 would have grown to $125,543 which includes -$1,119 cash and excludes $3,140 spent on fees and slippage. |
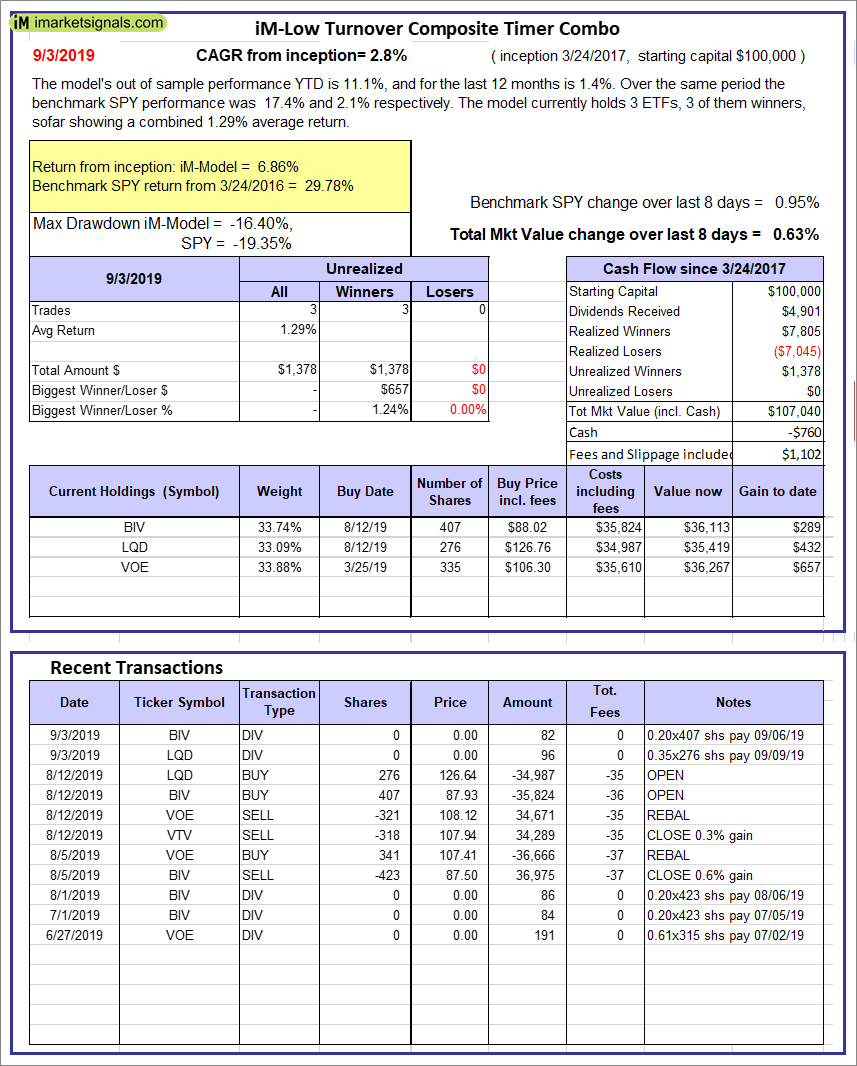 |
iM-Low Turnover Composite Timer Combo: The model’s out of sample performance YTD is 11.1%, and for the last 12 months is 1.4%. Over the same period the benchmark SPY performance was 17.4% and 2.1% respectively. Over the previous week the market value of the iM-Low Turnover Composite Timer Combo gained 0.63% at a time when SPY gained 0.95%. A starting capital of $100,000 at inception on 3/24/27 would have grown to $107,040 which includes -$760 cash and excludes $1,102 spent on fees and slippage. |
 |
iM-Min Drawdown Combo: The model’s out of sample performance YTD is 12.7%, and for the last 12 months is 3.2%. Over the same period the benchmark SPY performance was 17.4% and 2.1% respectively. Over the previous week the market value of the iM-Min Drawdown Combo gained 0.13% at a time when SPY gained 0.95%. A starting capital of $100,000 at inception on 4/5/2017 would have grown to $114,975 which includes $6,636 cash and excludes $1,214 spent on fees and slippage. |
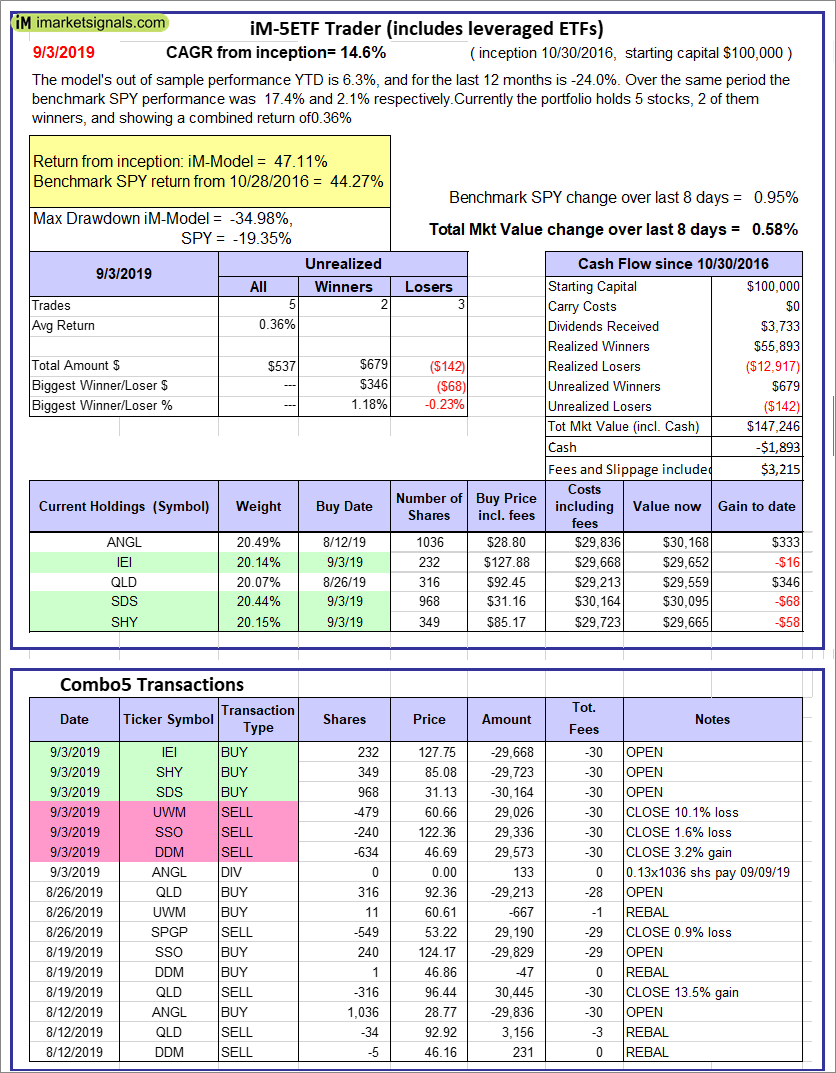 |
iM-5ETF Trader (includes leveraged ETFs): The model’s out of sample performance YTD is 6.3%, and for the last 12 months is -24.0%. Over the same period the benchmark SPY performance was 17.4% and 2.1% respectively. Over the previous week the market value of the iM-5ETF Trader (includes leveraged ETFs) gained 0.58% at a time when SPY gained 0.95%. A starting capital of $100,000 at inception on 10/30/2016 would have grown to $147,246 which includes -$1,893 cash and excludes $3,215 spent on fees and slippage. |
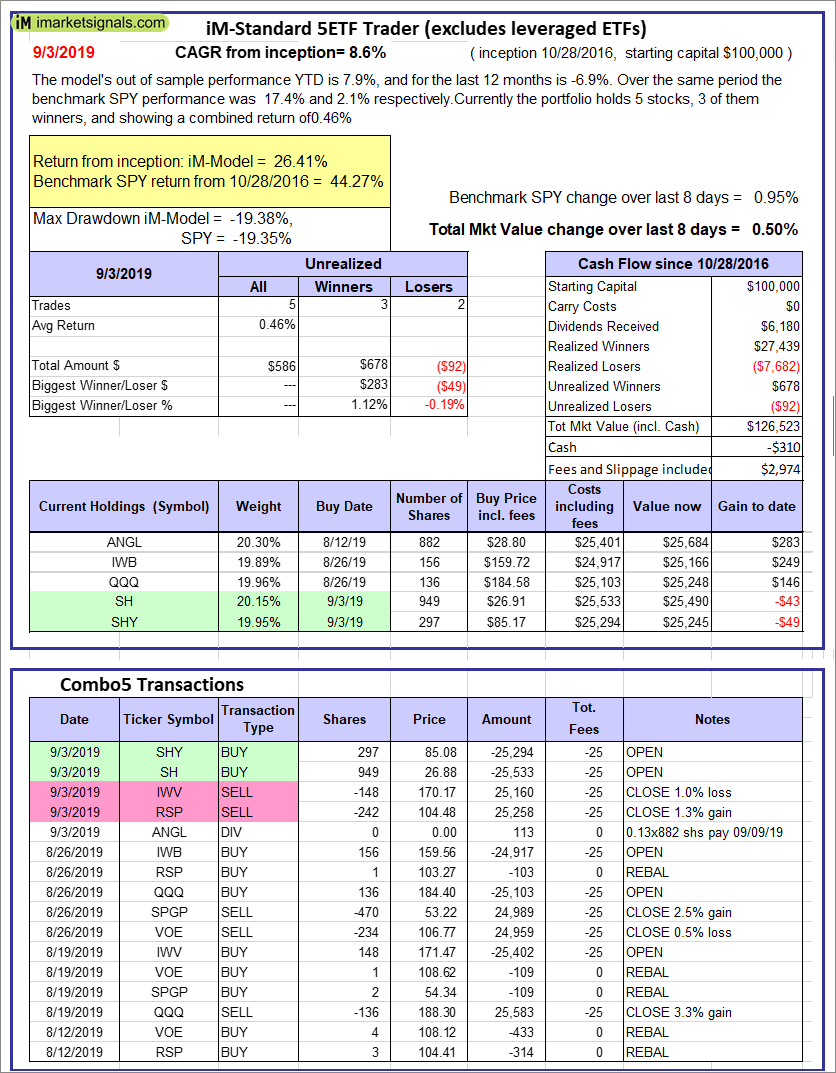 |
iM-Standard 5ETF Trader (excludes leveraged ETFs): The model’s out of sample performance YTD is 7.9%, and for the last 12 months is -6.9%. Over the same period the benchmark SPY performance was 17.4% and 2.1% respectively. Over the previous week the market value of the iM-Standard 5ETF Trader (excludes leveraged ETFs) gained 0.50% at a time when SPY gained 0.95%. A starting capital of $100,000 at inception on 10/30/2016 would have grown to $126,523 which includes -$310 cash and excludes $2,974 spent on fees and slippage. |
iM-Best Reports – 9/3/2019
Posted in pmp SPY-SH
Leave a Reply
You must be logged in to post a comment.