
- Based on its historic trend, the stock market appears to be overvalued.
- The Shiller Cyclically Adjusted Price to Earnings Ratio P/E10 is at high level of 33.5 (and P/E5 of 28.0), and a market correction is possible.
- Similar conditions for the P/E5, and S&P-real’s position relative to the long-time trend, were observed only 3-times in the past: in 1937, 1998 and 2006.
- The historic trend suggests a total probable real loss of about 15% over the next two years.
- Analysts’ long-term forecasts of stock returns made 7 years ago appear to have been unrealistically low.
About five and a half years ago it was fairly obvious that a major bull market had commenced in 2009 (Appendix A). Also a statistical analysis of the inflation adjusted historic data of the S&P-Composite from 1871 to 2012 indicated the same then. Since August 2012 the S&P500 with dividends has gained a real 107%. So what further gains can we expect, if any?
Will the bull market continue?
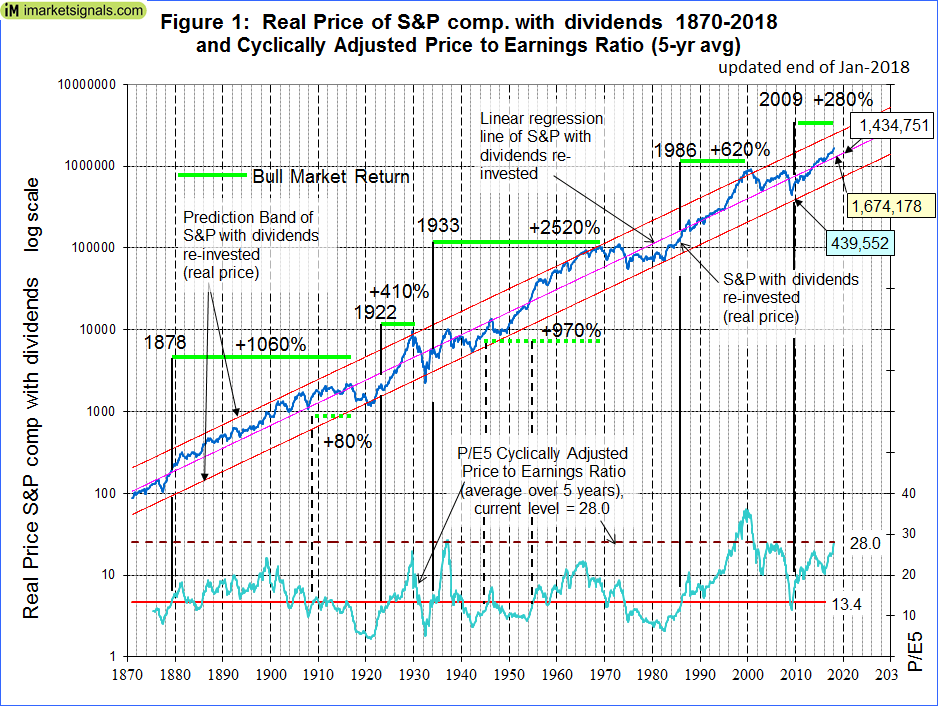
Nobody knows, and the best we can do is to use the historic data (which is from Shiller’s S&P series) to guide us to make estimates for the future. From the real price of the S&P-Composite with dividends re-invested (S&P-real) one finds that the best-fit line from 1871 onward is a straight line when plotted to a semi-log scale. There is no reason to believe that this long-term trend of S&P-real will be interrupted. S&P-real and the best fit line together with its 95% prediction bands are shown in Figure-1, updated to end of January 2018. (See appendix B for the equations.)
Also shown is the Cyclically Adjusted Price to Earnings Ratio P/E5 (which is the S&P-real divided by the average of the real earnings over the preceding 5 years). P/E5 is currently at a high level of 28.0.
One observes that whenever S&P-real “bounced-off” the lower extreme of the prediction band, and subsequently P/E5 moved from below to above 13.4 a bull market always followed. The last time this occurred was in March 2009. Since then S&P-real has gained about 280%. Comparing this to previous post-bounce-off-gains (which ranged from 410% to 2520%) then the possibility may exist of further gains to come.
What losses (if any) can we expect?
When extending the best fit line and the prediction bands to 2020 it enables us to estimate the change of S&P-real from the current level of about 1,674,000. In 2020, the value of S&P-real as indicated by the best fit line should be about 1,435,000, while the highest and lowest values shown by the prediction band would be 2,771,000 and 743,000, respectively.
Thus the historic trend forecasts a probable loss of about 15% for S&P-real to Jan-2020. (As of writing Feb. 9 the market has already given up about 6% from January’s average value.) The worst scenario would be a possible loss of about 55%, and the best outcome would be a 65% gain from the January level.
What other analysts expected
Widely followed commentators, such as Butler Philbrick & Associates (B|P) and Hussman warned us at the end of 2011 that the markets then were expensive and overbought, and that one could only expect very low returns going forward over periods as long as 20 years. Their statistical analyses asserted a very high probability of low returns to stocks in the future. Figure-2 shows the current situation in more detail and also includes the levels of the S&P-real as per( B|P ) forecast from 7 years ago, indicated by the red markers connected by the dashed red line.
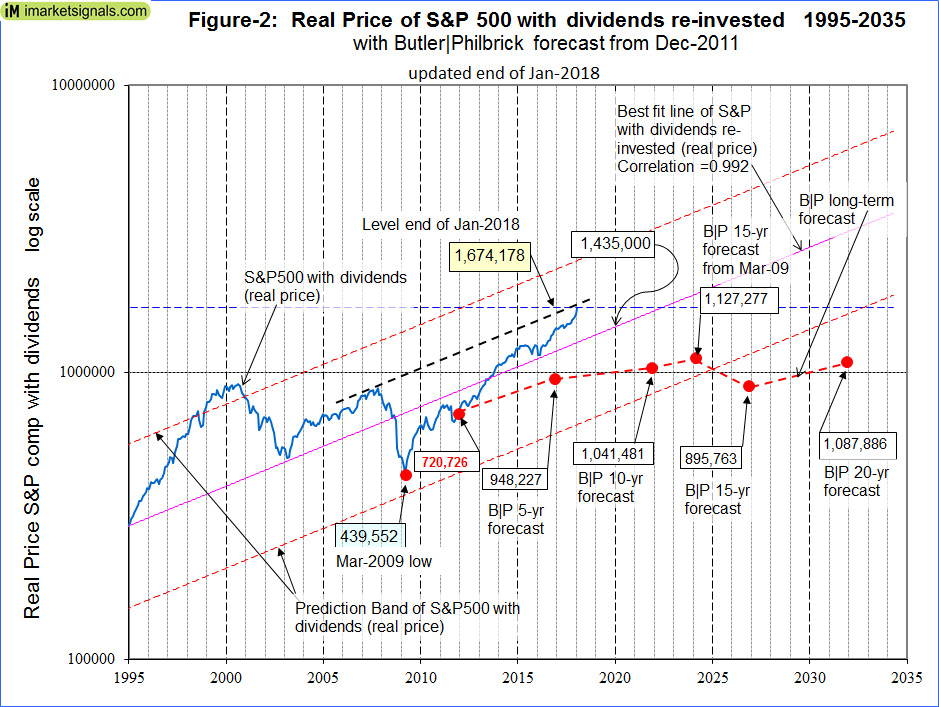
One can see from Figure-2 that the current level of SP-real is significantly higher than all the forecast levels from B|P.
From December 2011 onward B|P predicted a real annual return for the stock market of only 1.46% for 15 years, and 2.08% for 20 years (Table-1 in their article and Appendix C below). Also they forecasted a 6.48% annual return from Mar-2009 to Mar-2024 (Table 2 in their article). One can see that the March 2024 level is quite possible as it is just above the lower extreme of the prediction band, but it would appear that the December 2026 and 2031 forecasts are overly pessimistic.
One will only know at the end of the various forecast periods whether the analyst’s predictions hold up. We now know that B|P’s 5-year forecast was too low.
For the December 2031 forecast value to be correct the S&P-real would have to decline by 35% over the next 14 years. There was never a period since 1871 when S&P-real lost 35% over 14 years. There were only two 14-year periods from 1906 to 1920 and from 1968 to 1982 when S&P-real had a negative return of about -30%. During those periods the Consumer Price Index increased by 140% and 180%, respectively. However, without inflation adjustment the S&P with dividends actually increased by about 70% and 90% over the same two periods, respectively. So unless we experience very high inflation over the next 14 years it is unlikely that this forecast will be realized.
Is the market overvalued?
One observes from Figure-1 and -2 that presently S&P-real is above the long-time trend line and the P/E5 is at a high level of 28.0, indicating an overvalued market.
Similar conditions of P/E5 >=28.0 and S&P-real’s position relative to the long-time trend were observed only 3-times in the past: in 1937, 1998 and 2006. At all three occasions the S&P-real was located above the long-time trend line, and the market declined for several years thereafter.
Conclusion
The current relatively high P/E5 of 28.0 and P/E10 of 33.5 levels suggest poor longer-term returns. One should consider low frequency market-timing models to protect one’s investments. Also during down-market periods low volatility stocks should decline less than the broader market, and therefore could provide exposure to the stock market with potentially less risk. It is also important to know when a recession is looming, as stocks usually decline during recession periods. Recession Indicators such as the Business Cycle Index, or the Conference Board LEI, should provide early recession warning.
Appendix A
Previous articles in support of a bull market:
Estimating Stock Market Returns to 2020 and Beyond (Advisor Perspectives, 8-20-2012),
Is the Next Great Bull Market Already Here?(Advisor Perspectives, 8-14-2012),
Get Ready for the Next Great Bull Market(Advisor Perspectives, 8-9-2012),
Anticipating the Ultimate Death Cross(Advisor Perspectives, 7-24-2012),
The Ultimate Death Cross – False Harbinger of Doom(Advisor Perspectives, 7-24-2012).
Appendix B
The best fit line and prediction band were calculated using statistical software from PSI-Plot. There were 1699 data points from Jan-1871 to July-2012. The SP-real values for the period after July-2012 are “out of sample” and were not included in the regression analysis.
The equation of the best fit line is y = 10(ax+b) .
y = is the dependent variable of the best fit line.
x = are the number of months from January 1871 onwards.
a = 0.0023112648
b = 2.02423522
The Pearson correlation coefficient is 0.992. This number is most appropriately applied to linear regression as an indication of how closely the two variables approximate a linear relationship to each other. A perfect fit would have a correlation coefficient of 1.000.
The equation of the upper and lower extremes of the prediction band is y = 10(ax+b)
with parameters ‘y’, ‘x’, and ‘a’ as before, but with
b = 2.31005634 for the upper extreme line, and
b = 1.73841411 for the lower extreme line of the prediction band.
Appendix C
Butler|Philbrick real returns forecast for the stock market from December 2011.
 (Advisor Perspectives, December 14, 2011)
Good work again, thx for the update. Which of your timing model(s) would you classify as “low frequency market-timing models”?
Here are some of them, in no particular order.
iM Enhanced Inflation Timer
https://imarketsignals.com/2017/im-enhanced-inflation-timer/
MAC US
https://imarketsignals.com/2017/mac-us-timer-moving-average-crossover-system-sp-500/
CAPE Cycle-ID
https://imarketsignals.com/2016/timing-stock-market-shiller-cape/
BCI
https://imarketsignals.com/2013/exit-signals-for-the-stock-market-from-ims-business-cycle-index/
COMP Recession Indicator
https://web.archive.org/web/20130222053636/http://advisorperspectives.com/dshort/guest/Georg-Vrba-Recession-Indicators-in-Market-Timing.php
Hi,
I am a Gold Member, and was wondering which of your market timing strategies trade the least frequently?
Have a look at
iM Enhanced Inflation Timer
https://imarketsignals.com/2017/im-enhanced-inflation-timer/
Symbol …. Open …. Close …. Days …. Pct
IEF …. 02/06/2017 …. 06/05/2017 …. 119 …. 2.00%
SPY …. 01/30/2012 …. 02/06/2017 …. 1834 …. 74.30%
IEF …. 04/04/2011 …. 01/30/2012 …. 301 …. 13.90%
SPY …. 06/07/2010 …. 04/04/2011 …. 301 …. 26.30%
IEF …. 01/04/2010 …. 06/07/2010 …. 154 …. 5.80%
SPY …. 03/23/2009 …. 01/04/2010 …. 287 …. 37.80%
IEF …. 11/05/2007 …. 03/23/2009 …. 504 …. 13.60%
SPY …. 12/05/2005 …. 11/05/2007 …. 700 …. 18.50%
IEF …. 10/03/2005 …. 12/05/2005 …. 63 …. -1.40%
SPY …. 07/18/2005 …. 10/03/2005 …. 77 …. 0.20%
IEF …. 06/07/2004 …. 07/18/2005 …. 406 …. 3.90%
SPY …. 05/05/2003 …. 06/07/2004 …. 399 …. 23.30%
IEF …. 04/03/2000 …. 05/05/2003 …. 1127 …. 32.10%