  |
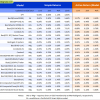
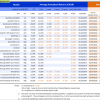
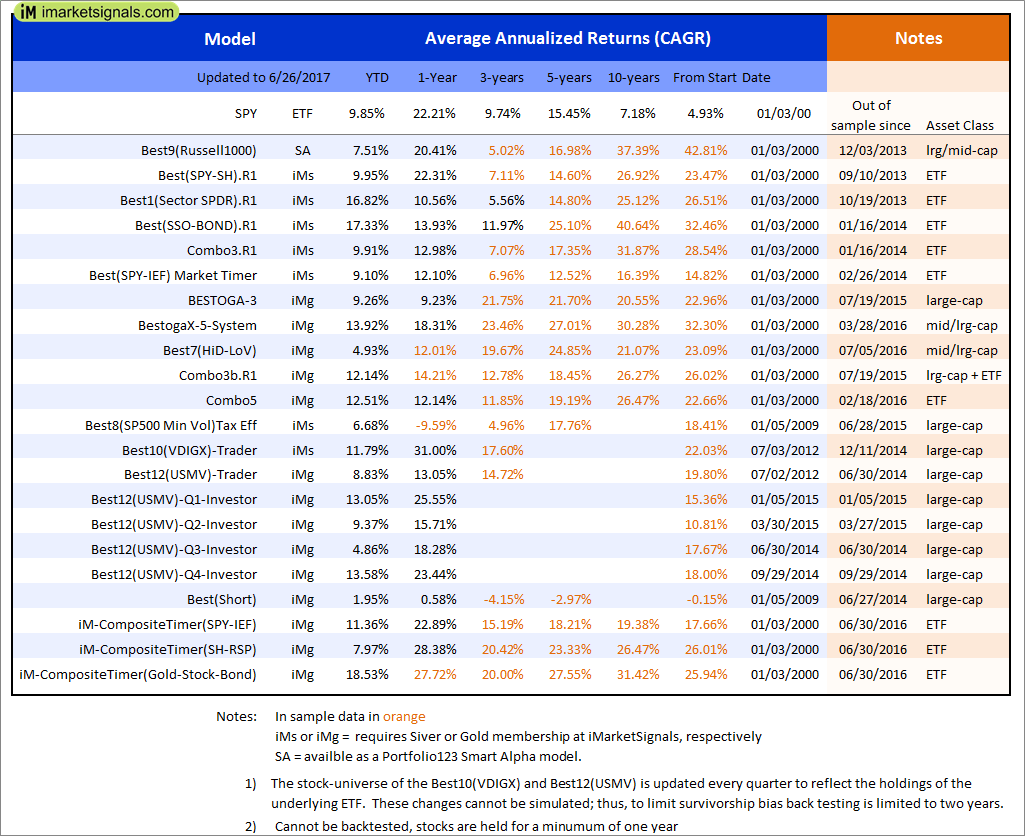
Out of sample performance summary of our models for the past 1, 2, 4 and 13 week periods. The active active return indicates how the models over- or underperformed the benchmark ETF SPY. Also the YTD, and the 1-, 3-, 5- and 10-year annualized returns are shown in the second table |
|
|
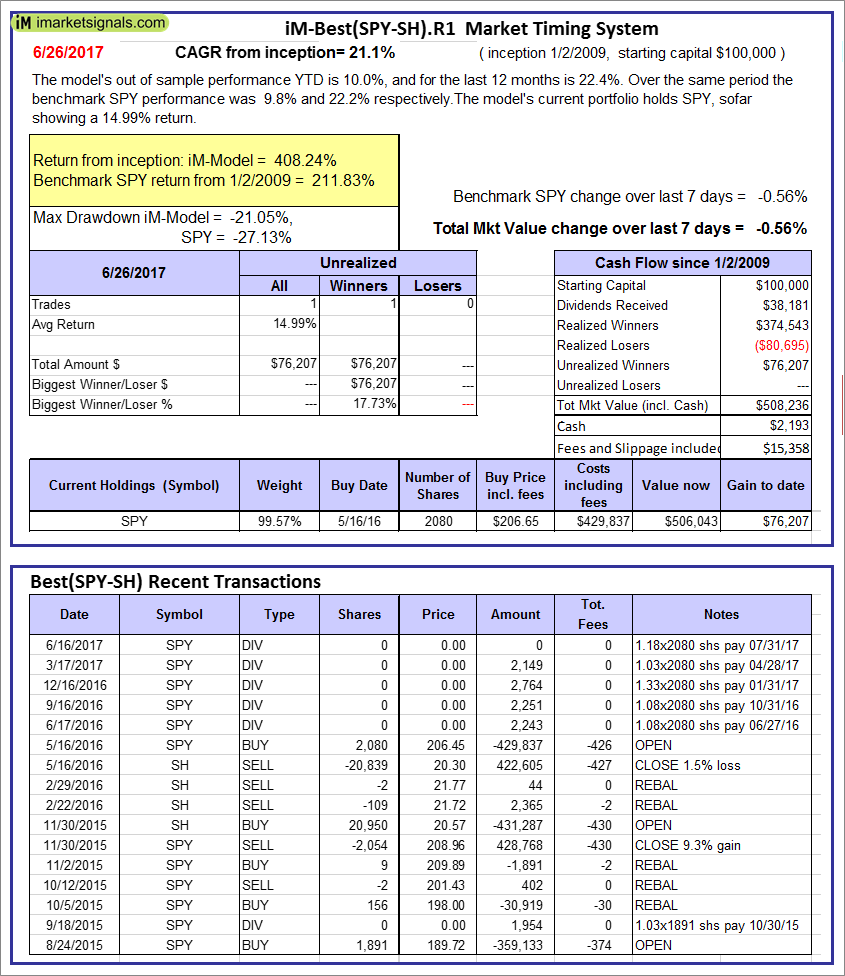
iM-Best(SPY-SH).R1: The model’s out of sample performance YTD is 10.0%, and for the last 12 months is 22.4%. Over the same period the benchmark SPY performance was 9.8% and 22.2% respectively. Over the previous week the market value of Best(SPY-SH) gained -0.56% at a time when SPY gained -0.56%. A starting capital of $100,000 at inception on 1/2/2009 would have grown to $508,236 which includes $2,193 cash and excludes $15,358 spent on fees and slippage. |
|
|
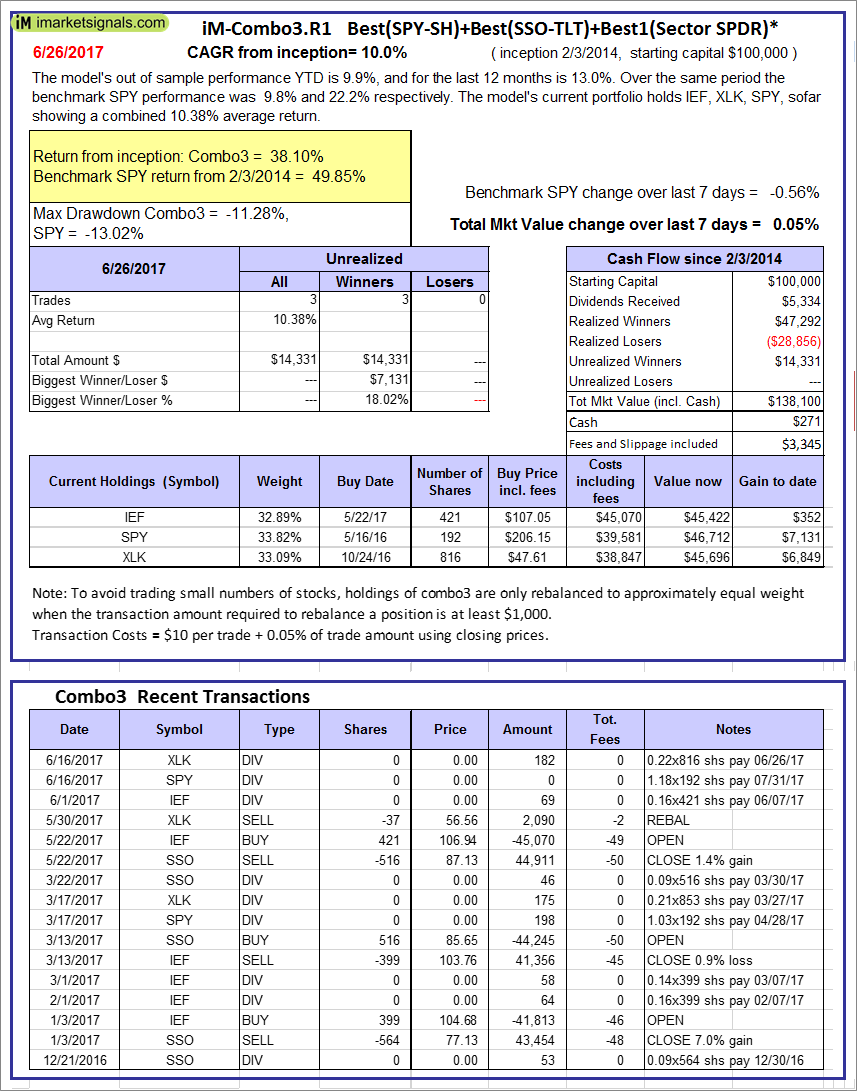
iM-Combo3.R1: The model’s out of sample performance YTD is 9.9%, and for the last 12 months is 13.0%. Over the same period the benchmark SPY performance was 9.8% and 22.2% respectively. Over the previous week the market value of iM-Combo3.R1 gained 0.05% at a time when SPY gained -0.56%. A starting capital of $100,000 at inception on 2/3/2014 would have grown to $138,100 which includes $271 cash and excludes $3,345 spent on fees and slippage. |
|
|
iM-Combo5: The model’s out of sample performance YTD is 12.5%, and for the last 12 months is 12.1%. Over the same period the benchmark SPY performance was 9.8% and 22.2% respectively. Over the previous week the market value of iM-Combo5 gained -0.04% at a time when SPY gained -0.56%. A starting capital of $100,000 at inception on 2/22/2016 would have grown to $110,975 which includes $728 cash and excludes $555 spent on fees and slippage. |
|
|
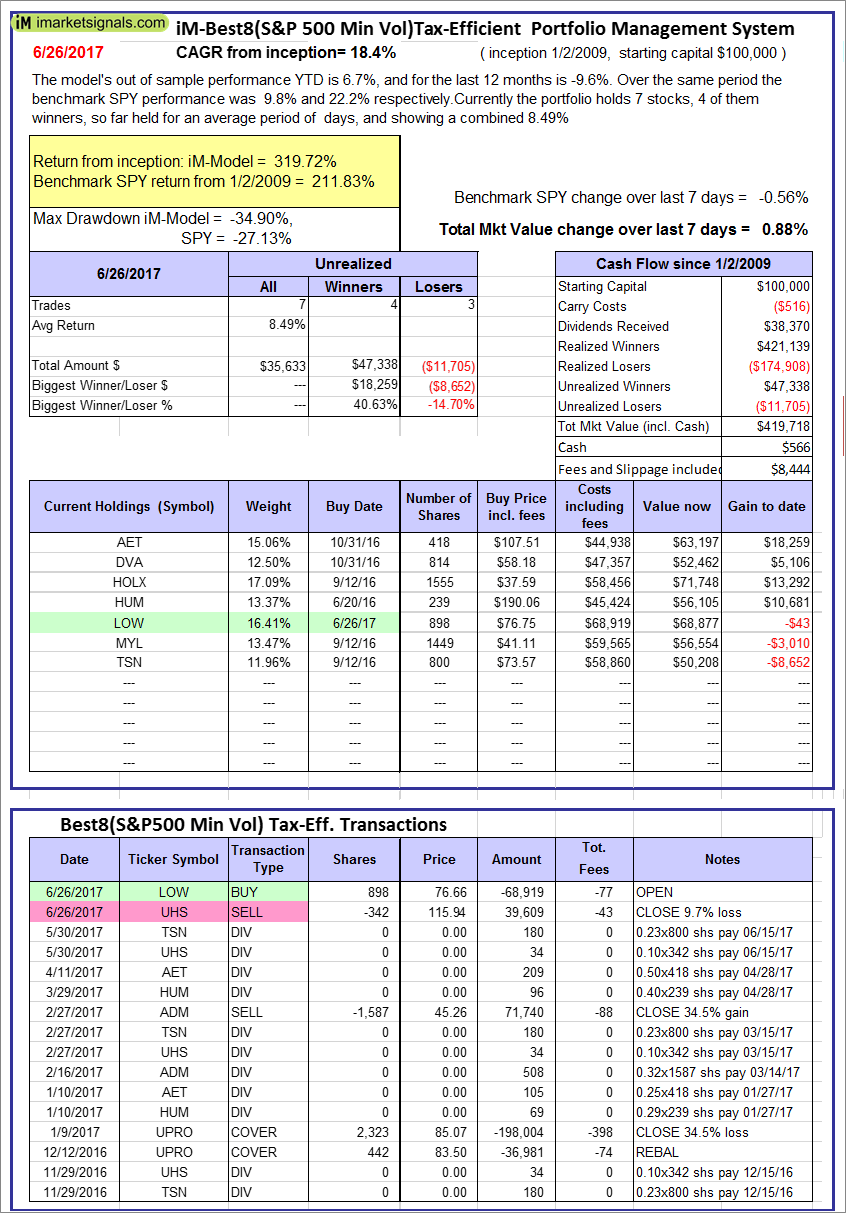
The iM-Best8(S&P500 Min Vol)Tax-Efficient The model’s out of sample performance YTD is 6.7%, and for the last 12 months is -9.6%. Over the same period the benchmark SPY performance was 9.8% and 22.2% respectively. Over the previous week the market value of iM-Best8(S&P 500)Tax-Eff. gained 0.88% at a time when SPY gained -0.56%. A starting capital of $100,000 at inception on 1/2/2009 would have grown to $419,718 which includes $566 cash and excludes $8,444 spent on fees and slippage. |
|
|
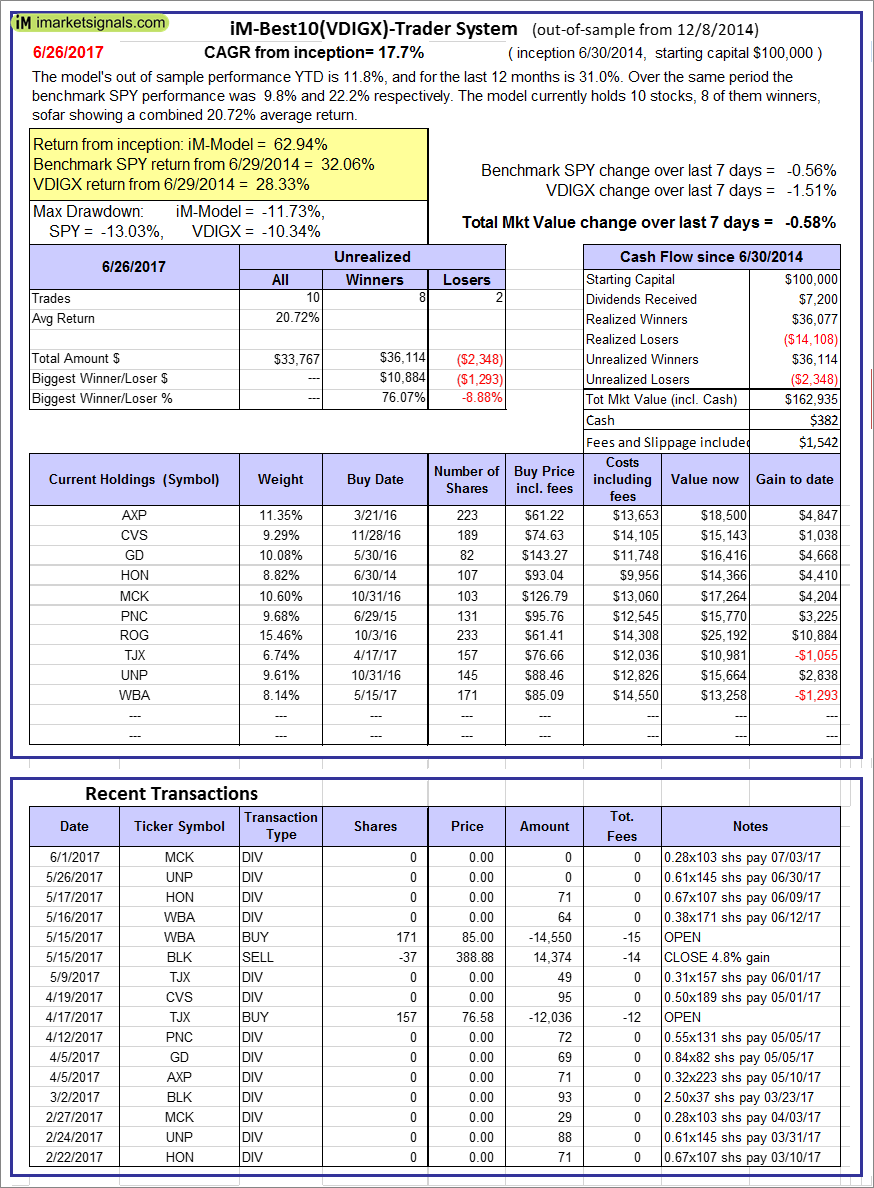
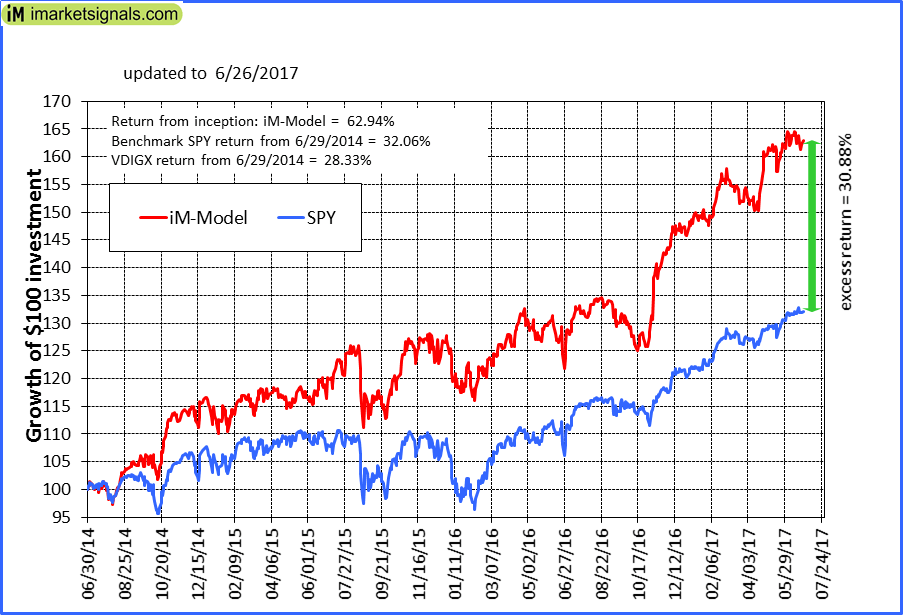
iM-Best10(VDIGX)-Trader: The model’s out of sample performance YTD is 11.8%, and for the last 12 months is 31.0%. Over the same period the benchmark SPY performance was 9.8% and 22.2% respectively. Since inception, on 7/1/2014, the model gained 62.94% while the benchmark SPY gained 32.06% and VDIGX gained 28.33% over the same period. Over the previous week the market value of iM-Best10(VDIGX) gained -0.58% at a time when SPY gained -0.56%. A starting capital of $100,000 at inception on 7/1/2014 would have grown to $162,935 which includes $382 cash and excludes $1,542 spent on fees and slippage. |
|
|
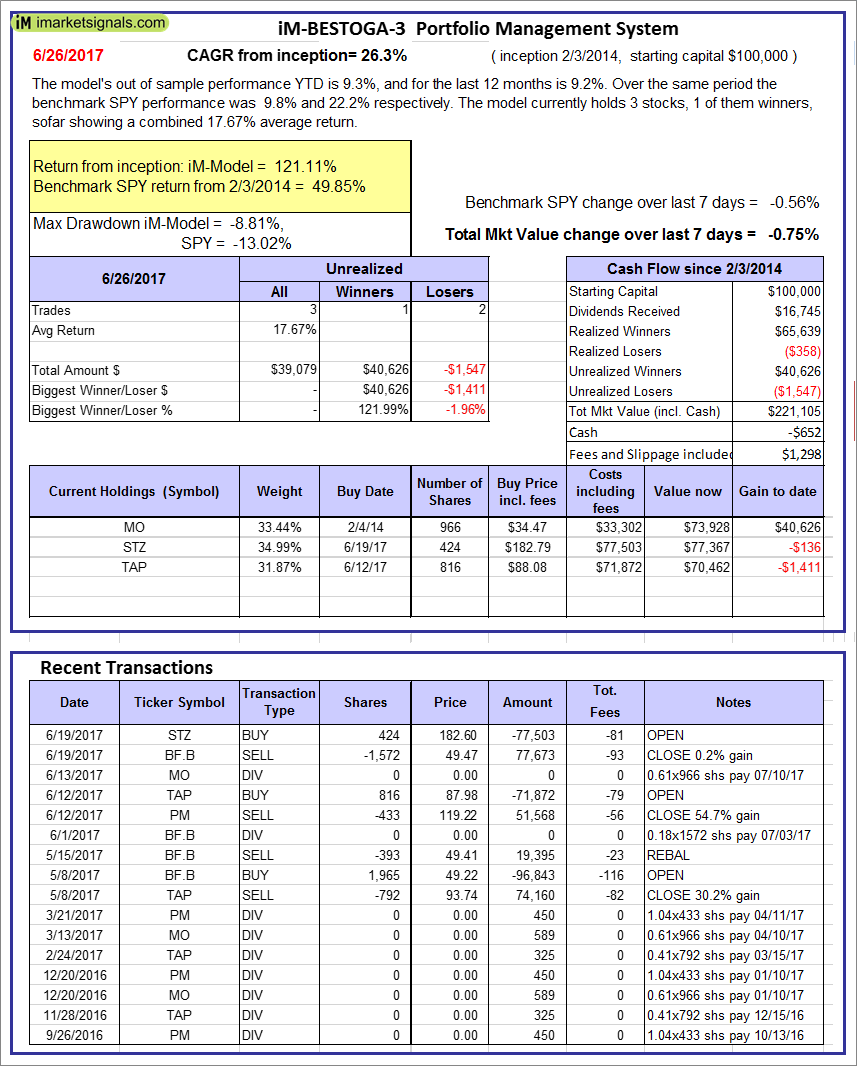
iM-BESTOGA-3: The model’s out of sample performance YTD is 9.3%, and for the last 12 months is 9.2%. Over the same period the benchmark SPY performance was 9.8% and 22.2% respectively. Over the previous week the market value of iM-BESTOGA-3 gained -0.75% at a time when SPY gained -0.56%. A starting capital of $100,000 at inception on 2/3/2014 would have grown to $221,105 which includes -$652 cash and excludes $1,298 spent on fees and slippage. |
|
|
iM-Best7(HiD-LoV): The model’s out of sample performance YTD is 4.9%, and since inception 7.8%. Over the same period the benchmark SPY performance was 9.8% and 18.5% respectively. Over the previous week the market value of iM-BESTOGA-3 gained -1.05% at a time when SPY gained -0.56%. A starting capital of $100,000 at inception on 6/30/2016 would have grown to $107,822 which includes -$429 cash and excludes $942 spent on fees and slippage. |
|
|
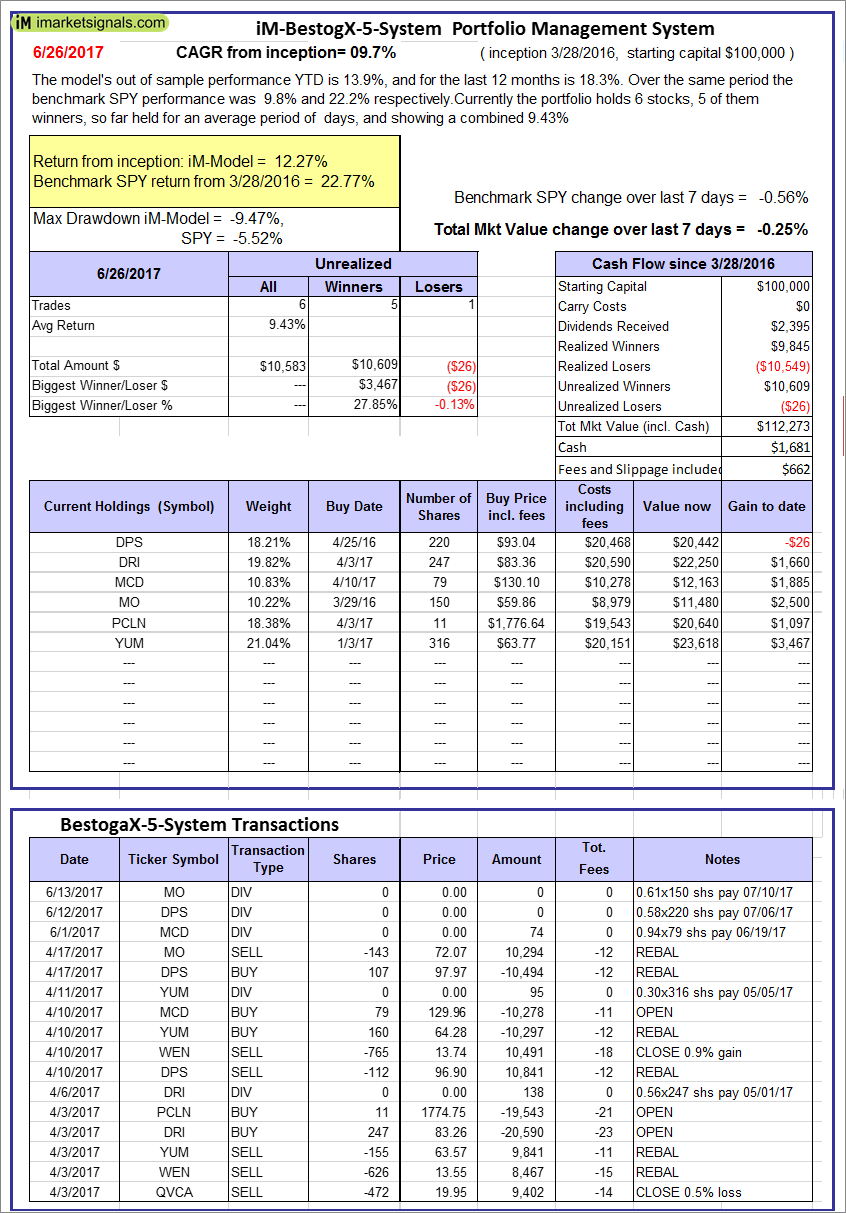
iM-BestogaX5-System: The model’s out of sample performance YTD is 13.9%, and for the last 12 months is 18.3%. Over the same period the benchmark SPY performance was 9.8% and 22.2% respectively. Over the previous week the market value of iM-Best8(S&P 500)Tax-Eff. gained -0.25% at a time when SPY gained -0.56%. A starting capital of $100,000 at inception on 3/28/2016 would have grown to $112,273 which includes $1,681 cash and excludes $662 spent on fees and slippage. |
|
|
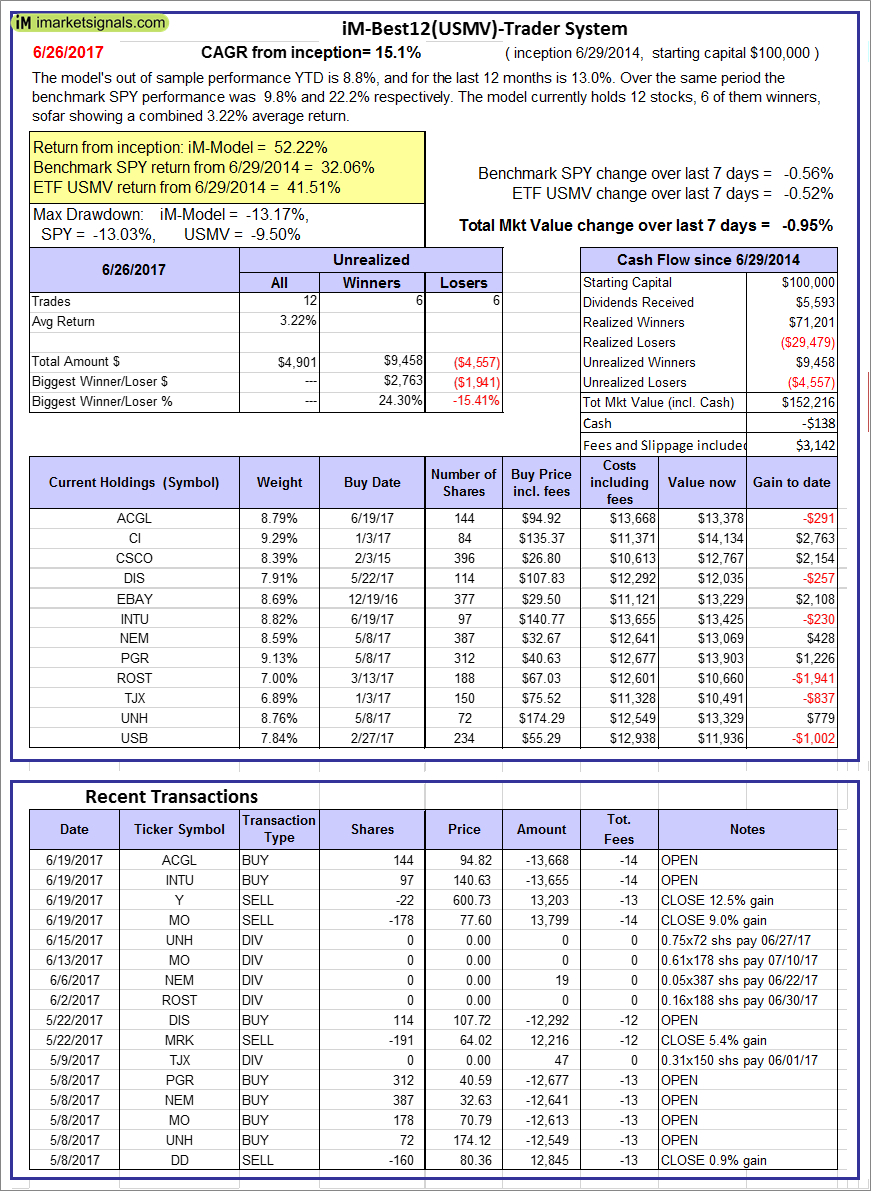
iM-Best12(USMV)-Trader: The model’s out of sample performance YTD is 8.8%, and for the last 12 months is 13.0%. Over the same period the benchmark SPY performance was 9.8% and 22.2% respectively. Since inception, on 6/30/2014, the model gained 52.22% while the benchmark SPY gained 32.06% and the ETF USMV gained 41.51% over the same period. Over the previous week the market value of iM-Best12(USMV)-Trader gained -0.95% at a time when SPY gained -0.56%. A starting capital of $100,000 at inception on 6/30/2014 would have grown to $152,216 which includes -$138 cash and excludes $3,142 spent on fees and slippage. |
|
|
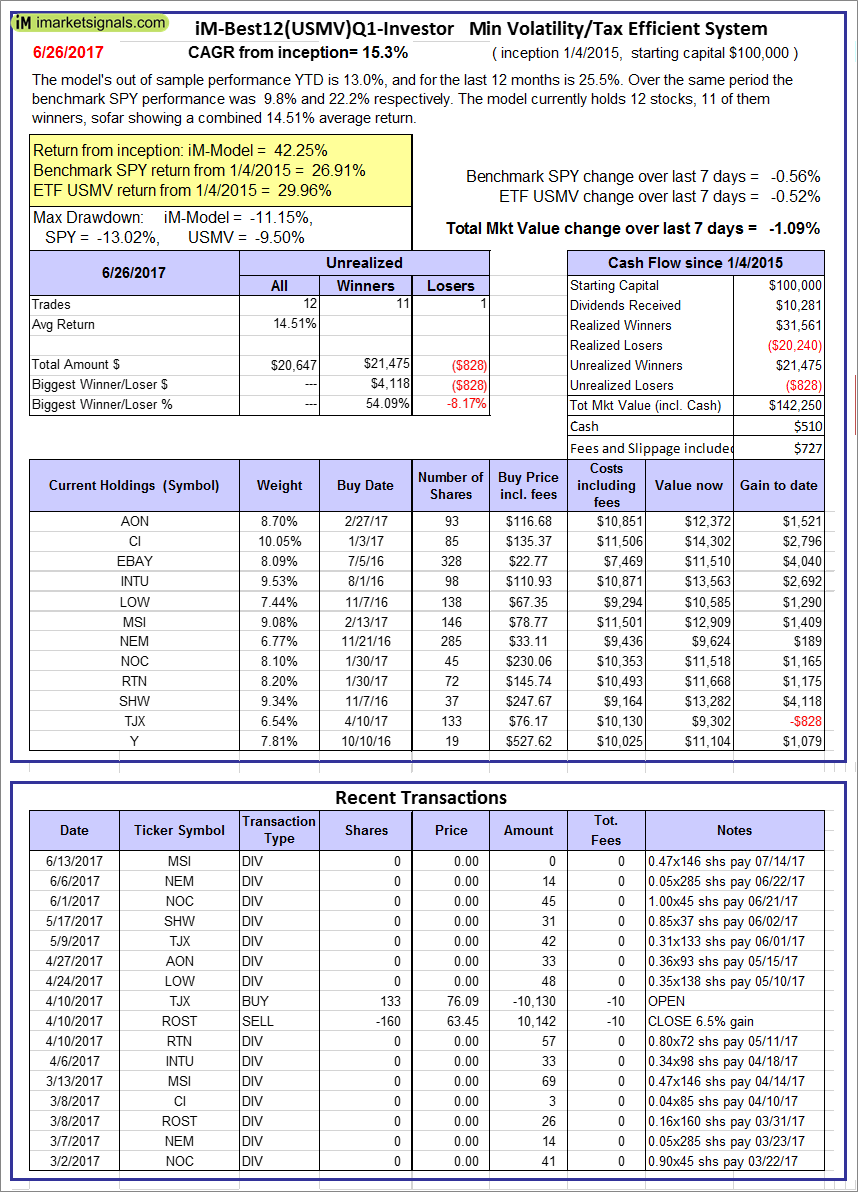
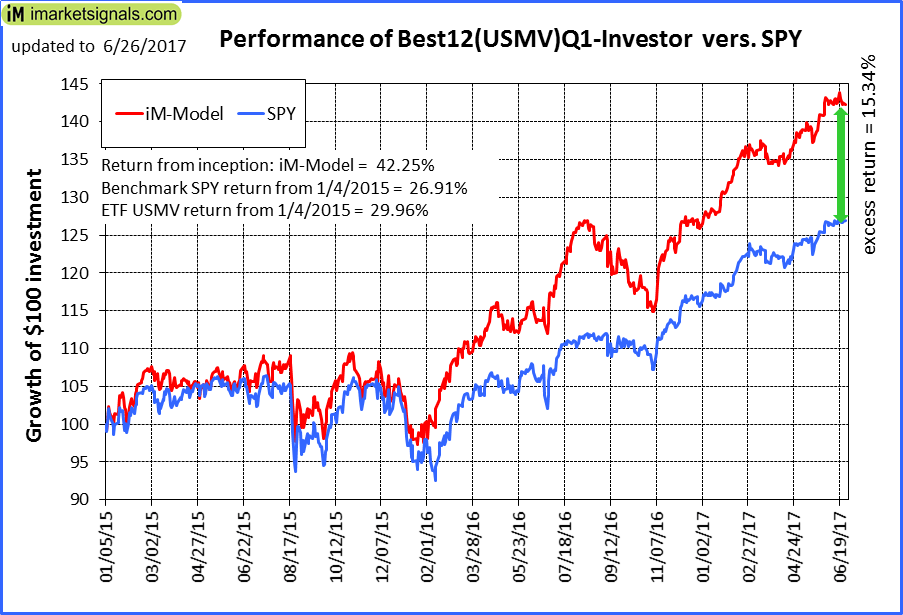
iM-Best12(USMV)Q1-Investor: The model’s out of sample performance YTD is 13.0%, and for the last 12 months is 25.5%. Over the same period the benchmark SPY performance was 9.8% and 22.2% respectively. Since inception, on 1/5/2015, the model gained 42.25% while the benchmark SPY gained 26.91% and the ETF USMV gained 29.96% over the same period. Over the previous week the market value of iM-Best12(USMV)Q1 gained -1.09% at a time when SPY gained -0.56%. A starting capital of $100,000 at inception on 1/5/2015 would have grown to $142,250 which includes $510 cash and excludes $727 spent on fees and slippage. |
|
|
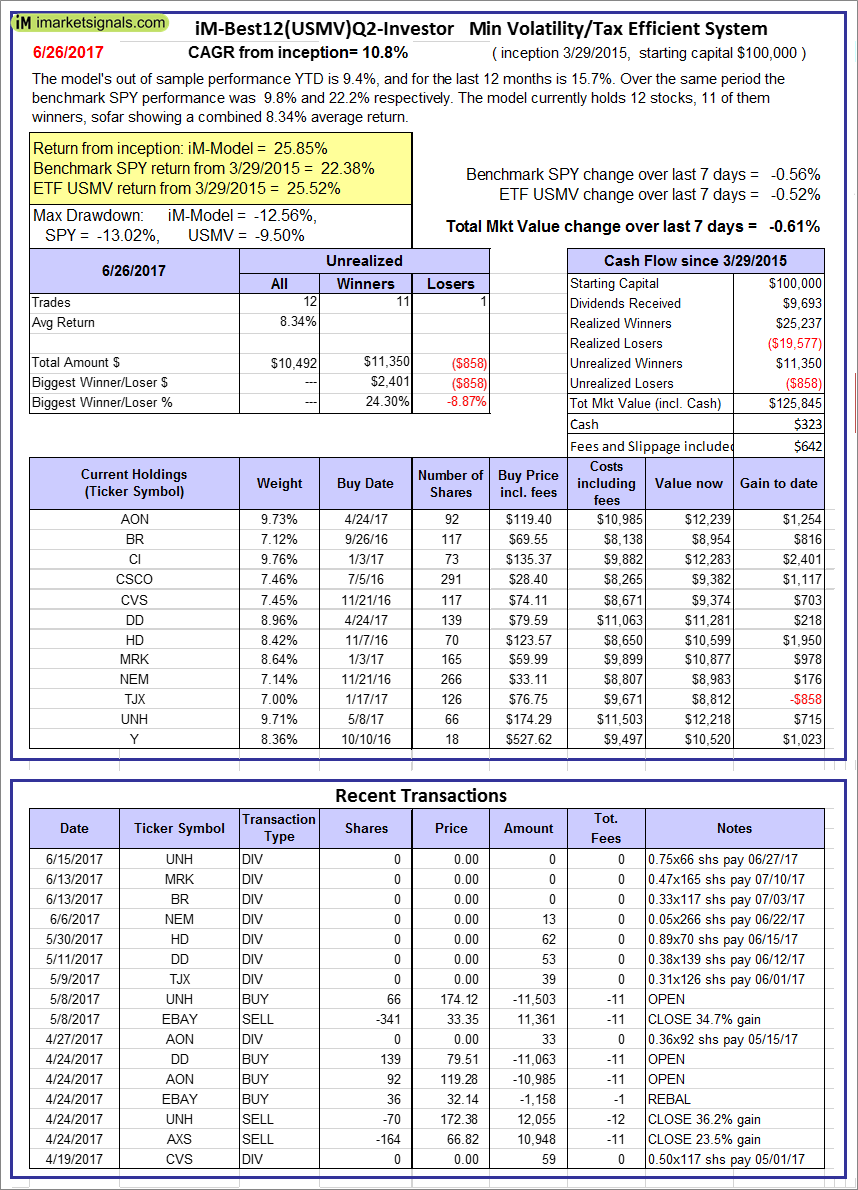
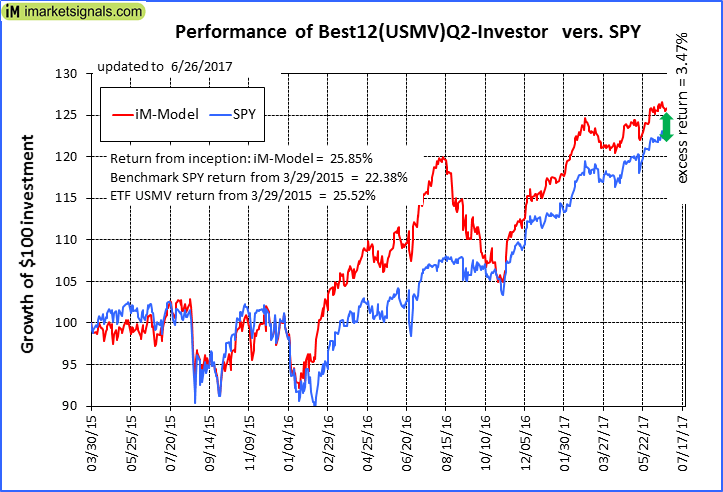
iM-Best12(USMV)Q2-Investor: The model’s out of sample performance YTD is 9.4%, and for the last 12 months is 15.7%. Over the same period the benchmark SPY performance was 9.8% and 22.2% respectively. Since inception, on 3/30/2015, the model gained 25.85% while the benchmark SPY gained 22.38% and the ETF USMV gained 25.52% over the same period. Over the previous week the market value of iM-Best12(USMV)Q2 gained -0.61% at a time when SPY gained -0.56%. A starting capital of $100,000 at inception on 3/30/2015 would have grown to $125,845 which includes $323 cash and excludes $642 spent on fees and slippage. |
|
|
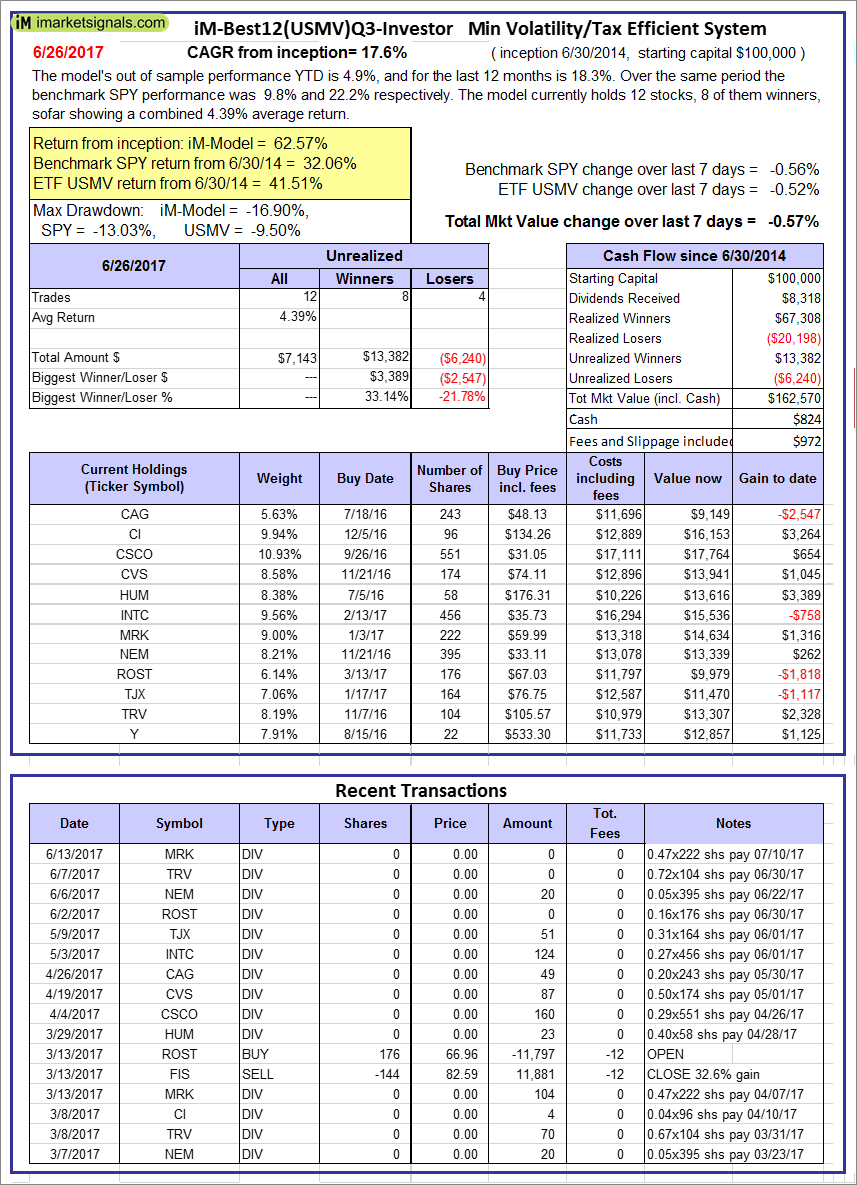
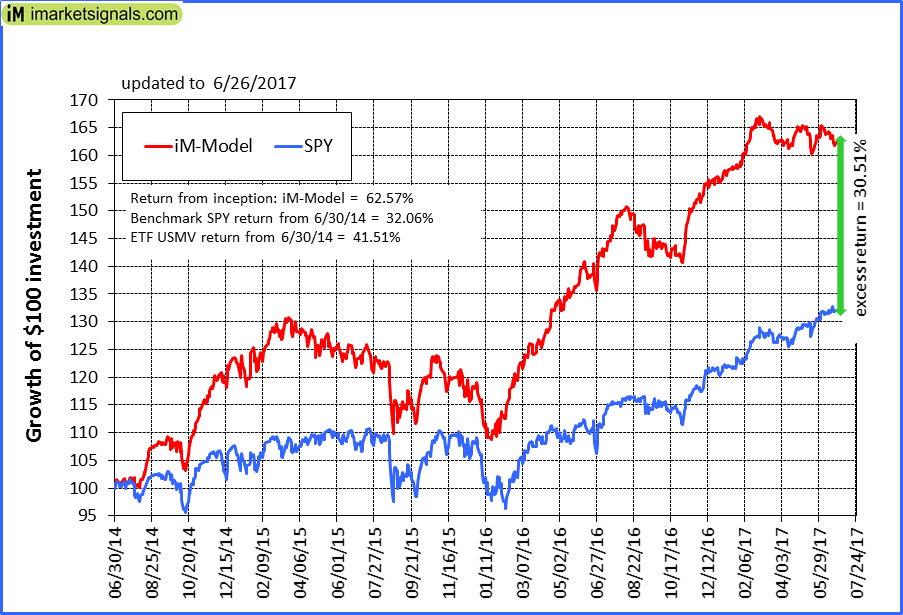
iM-Best12(USMV)Q3-Investor: The model’s out of sample performance YTD is 4.9%, and for the last 12 months is 18.3%. Over the same period the benchmark SPY performance was 9.8% and 22.2% respectively. Since inception, on 7/1/2014, the model gained 62.57% while the benchmark SPY gained 32.06% and the ETF USMV gained 41.51% over the same period. Over the previous week the market value of iM-Best12(USMV)Q3 gained -0.57% at a time when SPY gained -0.56%. A starting capital of $100,000 at inception on 7/1/2014 would have grown to $162,570 which includes $824 cash and excludes $972 spent on fees and slippage. |
|
|
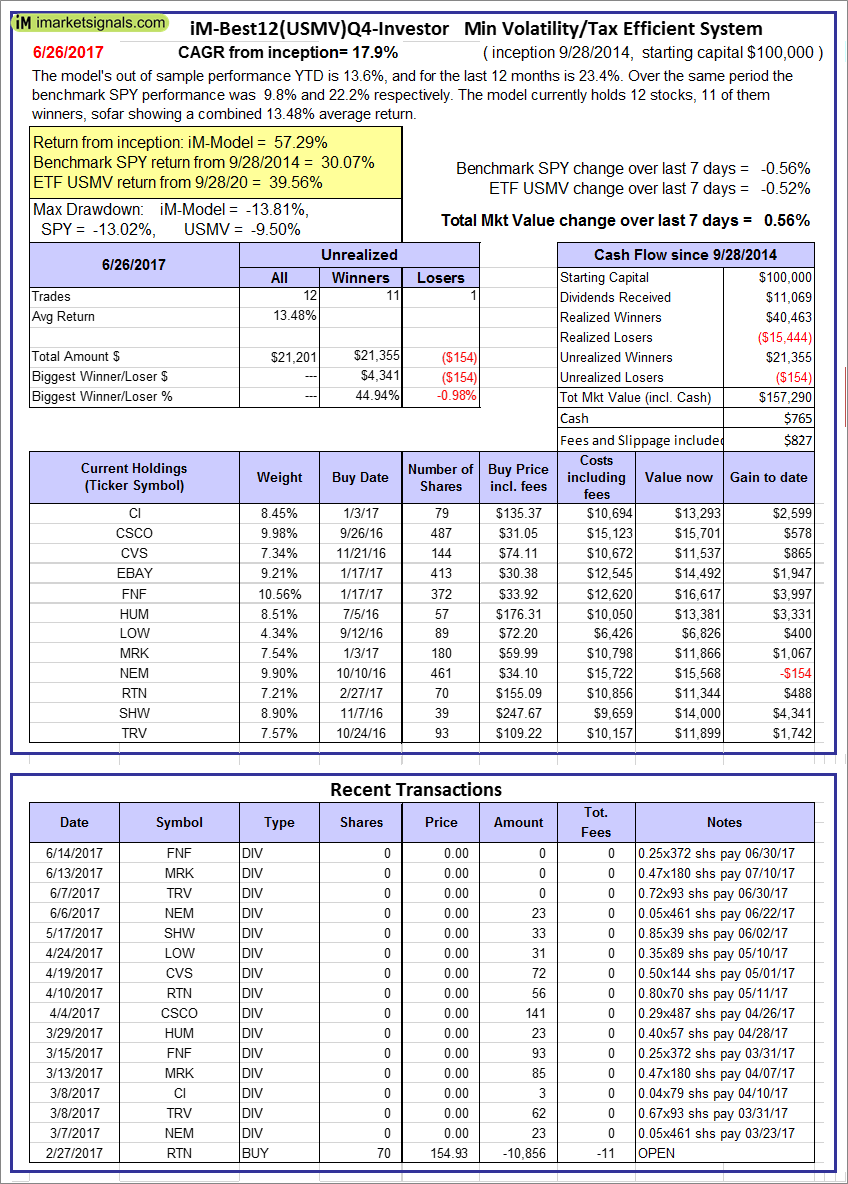
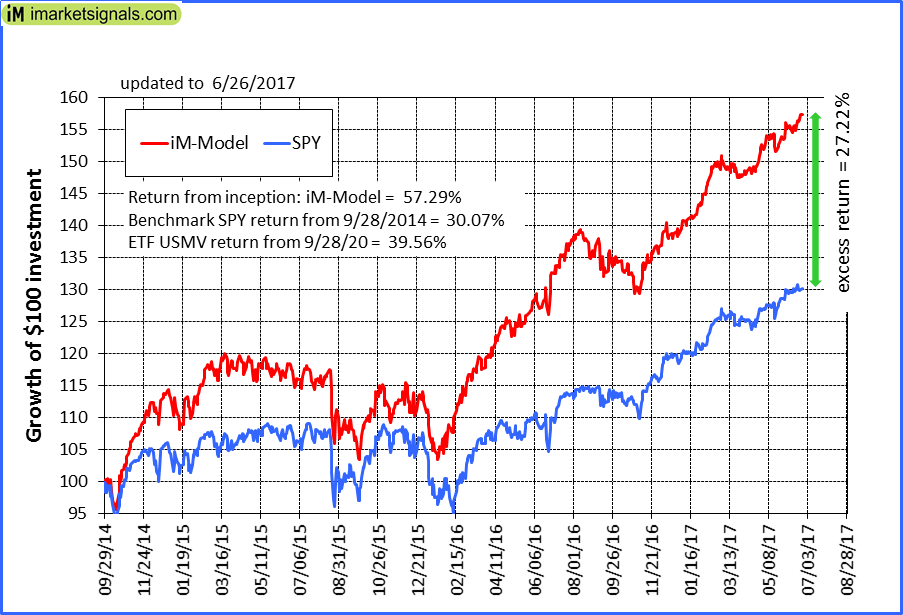
iM-Best12(USMV)Q4-Investor: Since inception, on 9/29/2014, the model gained 57.29% while the benchmark SPY gained 30.07% and the ETF USMV gained 39.56% over the same period. Over the previous week the market value of iM-Best12(USMV)Q4 gained 0.56% at a time when SPY gained -0.56%. A starting capital of $100,000 at inception on 9/29/2014 would have grown to $157,290 which includes $765 cash and excludes $827 spent on fees and slippage. |
|
|
Average Performance of iM-Best12(USMV)Q1+Q2+Q3+Q4-Investor resulted in an excess return of 33.94% over SPY. (see iM-USMV Investor Portfolio) |
|
|
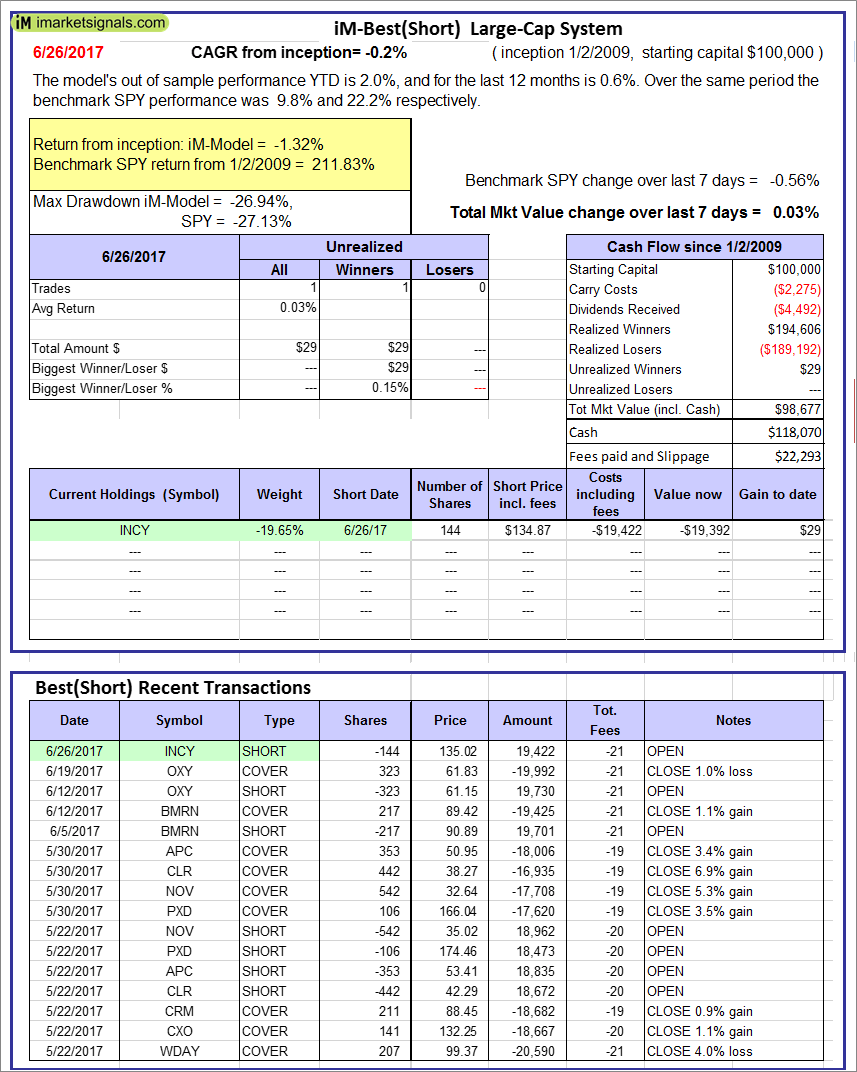
iM-Best(Short): The model’s out of sample performance YTD is 2.0%, and for the last 12 months is 0.6%. Over the same period the benchmark SPY performance was 9.8% and 22.2% respectively. Over the previous week the market value of iM-Best(Short) gained 0.03% at a time when SPY gained -0.56%. Over the period 1/2/2009 to 6/26/2017 the starting capital of $100,000 would have grown to $98,677 which includes $118,070 cash and excludes $22,293 spent on fees and slippage. |
|
|
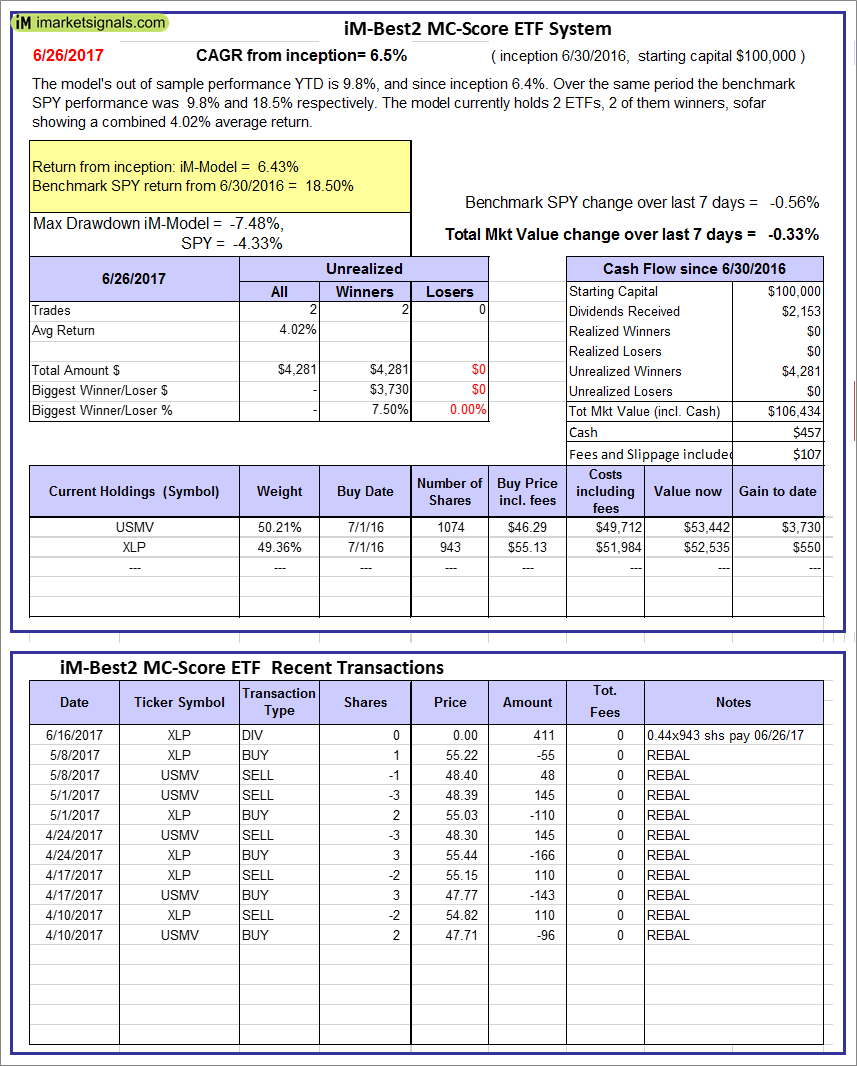
iM-Best2 MC-Score ETF System: The model’s out of sample performance YTD is 9.8%, and since inception 6.4%. Over the same period the benchmark SPY performance was 9.8% and 18.5% respectively. Over the previous week the market value of the iM-Best2 MC-Score ETF System gained -0.33% at a time when SPY gained -0.56%. A starting capital of $100,000 at inception on 6/30/2016 would have grown to $106,434 which includes $457 cash and excludes $107 spent on fees and slippage. |
|
|
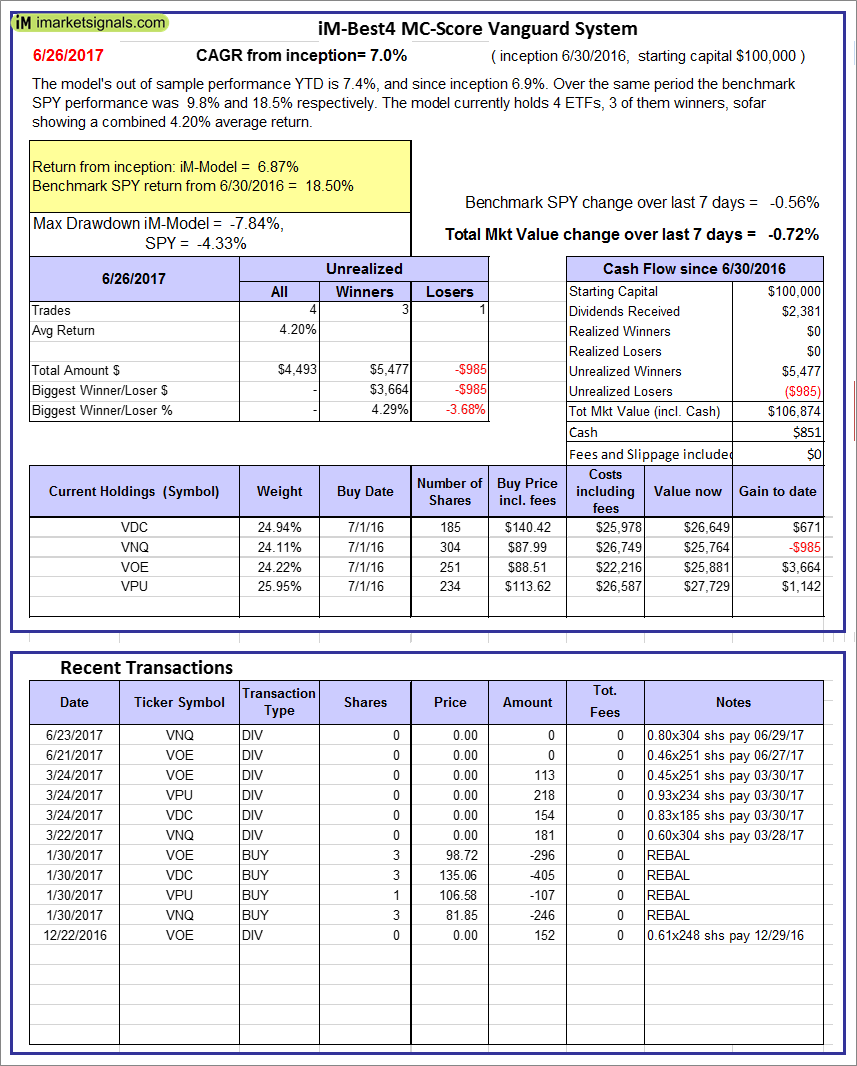
iM-Best4 MC-Score Vanguard System: The model’s out of sample performance YTD is 7.4%, and since inception 6.9%. Over the same period the benchmark SPY performance was 9.8% and 18.5% respectively. Over the previous week the market value of the iM-Best4 MC-Score Vanguard System gained -0.72% at a time when SPY gained -0.56%. A starting capital of $100,000 at inception on 6/30/2016 would have grown to $106,874 which includes $851 cash and excludes $00 spent on fees and slippage. |
|
|
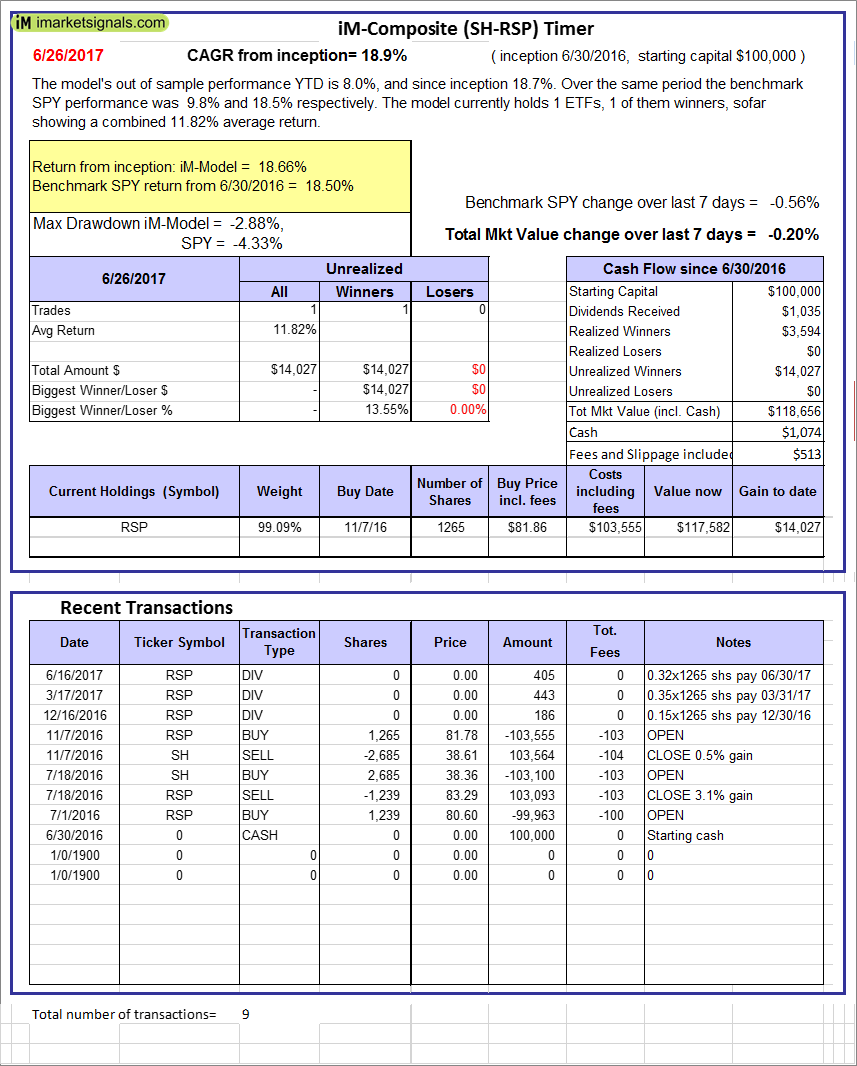
iM-Composite (SH-RSP) Timer: The model’s out of sample performance YTD is 8.0%, and since inception 18.7%. Over the same period the benchmark SPY performance was 9.8% and 18.5% respectively. Over the previous week the market value of the iM-Composite (SH-RSP) Timer gained -0.20% at a time when SPY gained -0.56%. A starting capital of $100,000 at inception on 6/30/2016 would have grown to $118,656 which includes $1,074 cash and excludes $513 spent on fees and slippage. |
|
|
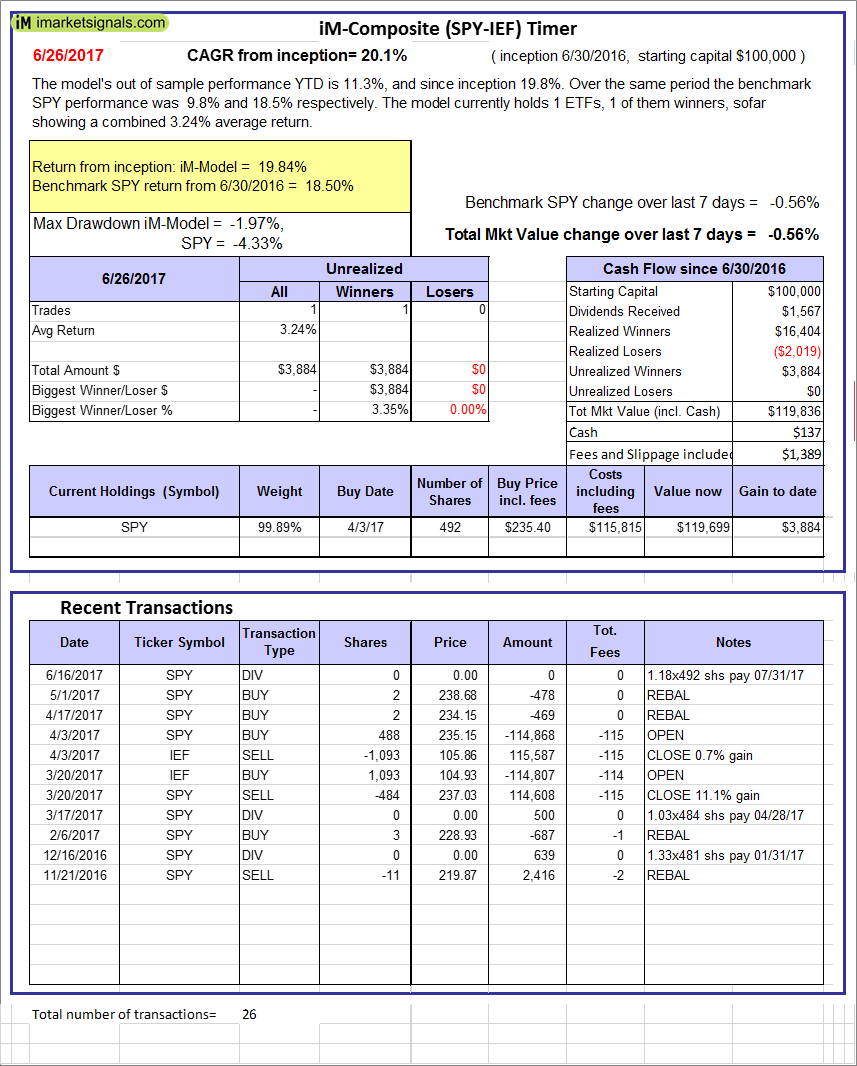
iM-Composite (SPY-IEF) Timer: The model’s out of sample performance YTD is 11.3%, and since inception 19.8%. Over the same period the benchmark SPY performance was 9.8% and 18.5% respectively. Over the previous week the market value of the iM-Composite (SPY-IEF) Timer gained -0.56% at a time when SPY gained -0.56%. A starting capital of $100,000 at inception on 6/30/2016 would have grown to $119,836 which includes $137 cash and excludes $1,389 spent on fees and slippage. |
|
|
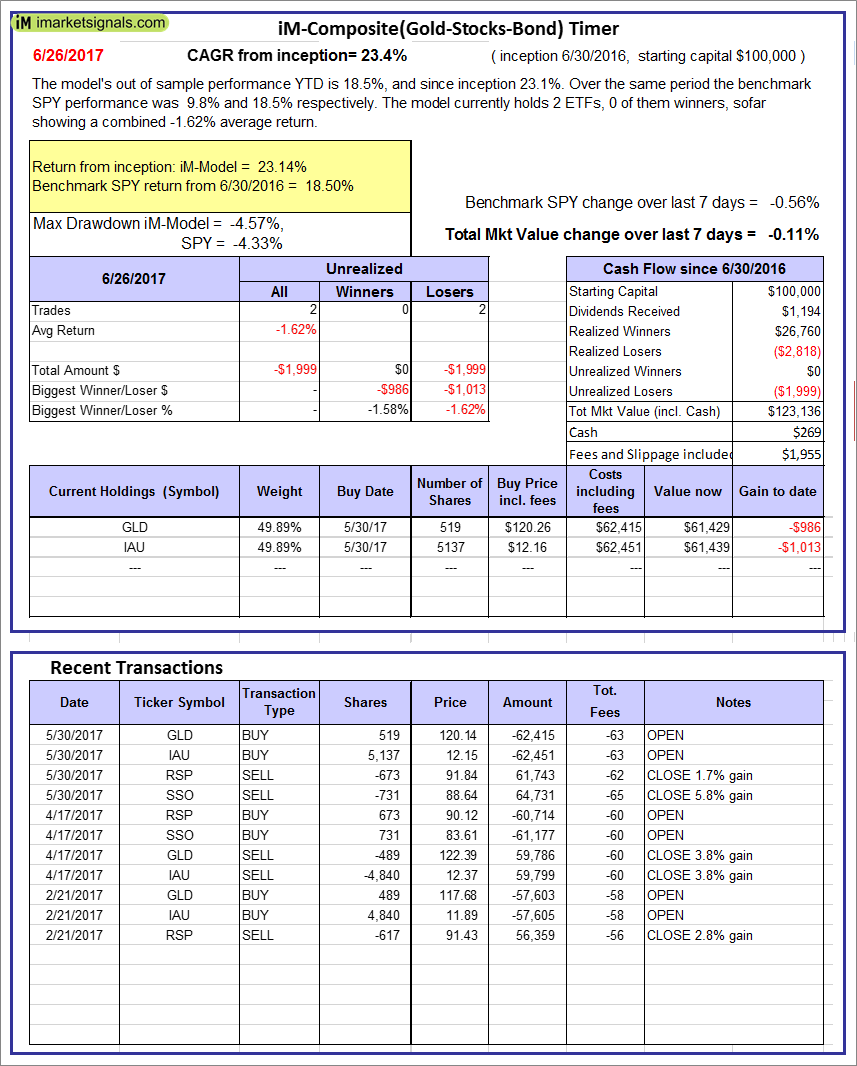
iM-Composite(Gold-Stocks-Bond) Timer: The model’s out of sample performance YTD is 18.5%, and since inception 23.1%. Over the same period the benchmark SPY performance was 9.8% and 18.5% respectively. Over the previous week the market value of the iM-Composite(Gold-Stocks-Bond) Timer gained -0.11% at a time when SPY gained -0.56%. A starting capital of $100,000 at inception on 6/30/2016 would have grown to $123,136 which includes $269 cash and excludes $1,955 spent on fees and slippage. |
|
|
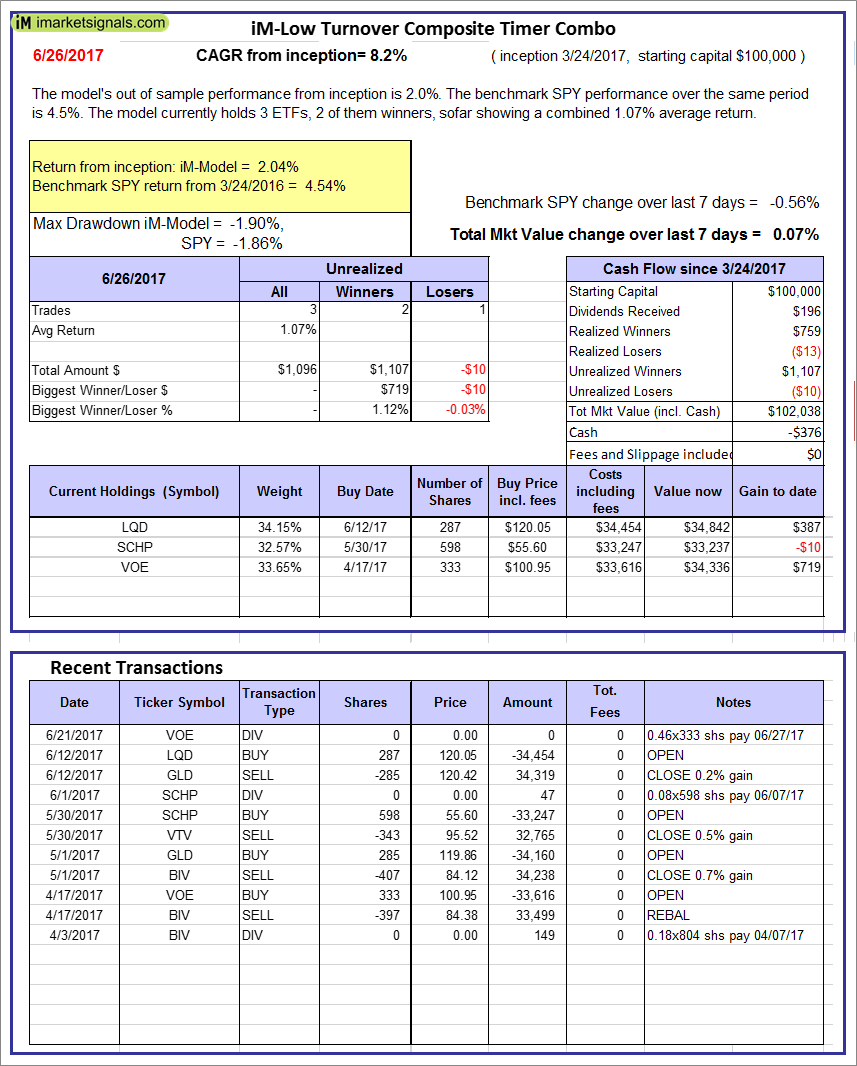
iM-Low Turnover Composite Timer Combo: The model’s out of sample performance from inception is 2.0%. The benchmark SPY performance over the same period is 4.5%. Over the previous week the market value of the iM-Low Turnover Composite Timer Combo gained 0.07% at a time when SPY gained -0.56%. A starting capital of $100,000 at inception on 6/30/2016 would have grown to $102,038 which includes -$376 cash and excludes $00 spent on fees and slippage. |
|
|
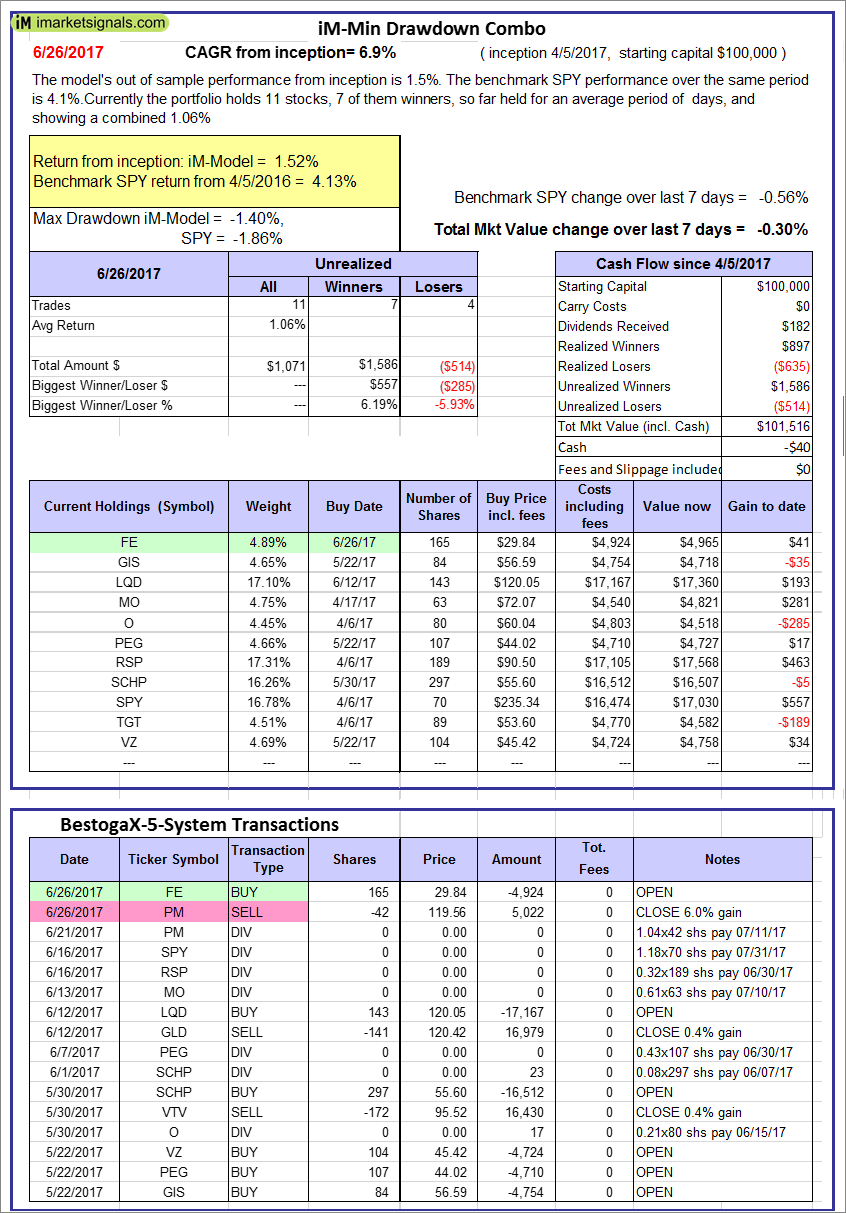
iM-Min Drawdown Combo: The model’s out of sample performance from inception is 1.5%. The benchmark SPY performance over the same period is 4.1%. Over the previous week the market value of the iM-Min Drawdown Combo gained -0.30% at a time when SPY gained -0.56%. A starting capital of $100,000 at inception on 6/30/2016 would have grown to $101,516 which includes -$40 cash and excludes $00 spent on fees and slippage. |
|
|
iM-5ETF Trader (includes leveraged ETFs): The model’s out of sample performance YTD is 19.3%, and since inception 34.7%. Over the same period the benchmark SPY performance was 9.8% and 16.2% respectively. Over the previous week the market value of the iM-5ETF Trader (includes leveraged ETFs) gained -0.71% at a time when SPY gained -0.56%. A starting capital of $100,000 at inception on 6/30/2016 would have grown to $134,695 which includes $359 cash and excludes $1,030 spent on fees and slippage. |


Leave a Reply
You must be logged in to post a comment.