
- This model is similar to Combo3, but replaces Best(SSO-TLT) with BESTOGA3 which invests periodically in three of the so called “Vice” stocks of the S&P500.
- It combines equal weighted the two ETF models, Best(SPY-SH) and Best1(Select SPDR), with BESTOGA3.
- We demonstrate that this combination would have produced high annualized returns of about 28% with low drawdowns of about -12%. Also over any one year period it showed a minimum return of 10.9%.
- Additionally, due to the very high liquidity of its component ETFs and stocks, this combo can support a large dollar portfolio value.
- It has five positions, holding two ETFs, one from each ETF component model, and the three stocks from BESTOGA3.
Performance
The model assumes an initial investment on Jan-3, 2000. The simulated trading performance of the system is shown in Figure 1 below. The annualized return from Jan-2000 to Dec-2014 was 28.2%; $100 grew to $4,174 over this period. The maximum drawdown was -12.5% in August 2011. All values are with dividends reinvested.
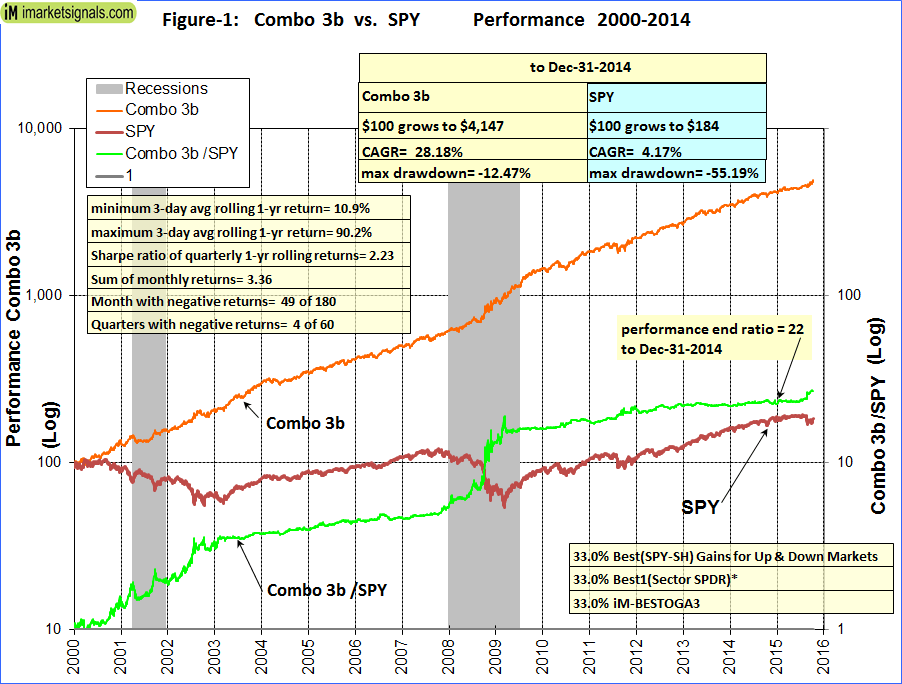
In above chart, the green graph is the performance ratio of the Combo3b to SPY. A rising slope of that graph indicates when Combo3b outperformed SPY; Combo3b produced about 22 times the value to December 2014 which one would have had from a buy-and-hold investment in SPY over the same period.
Annual Returns
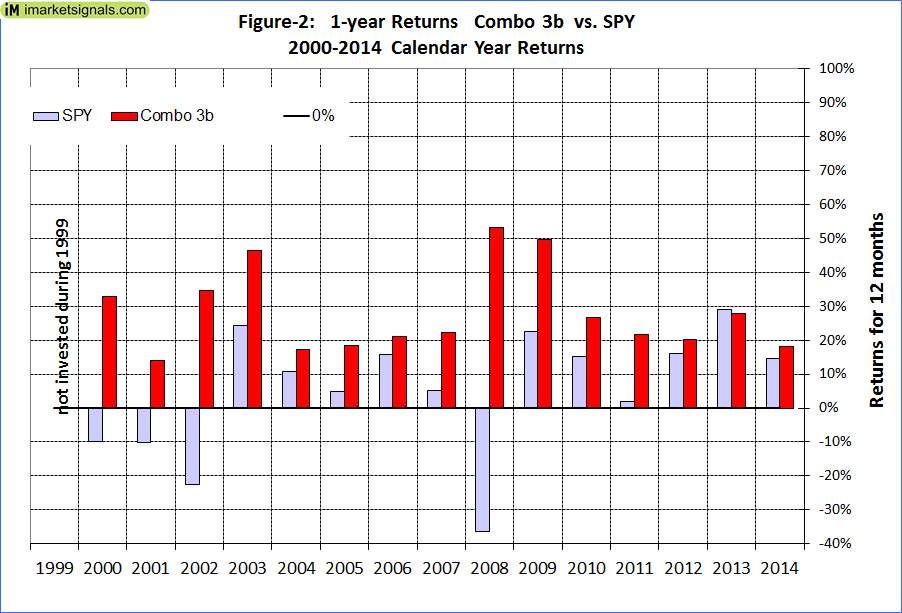
Calendar year performance ranged from a maximum of 53% for 2008 to a minimum of 14% for 2001, as can be seen in Figure 2. There would never have been a loss over any calendar year.
Rolling 1-year returns
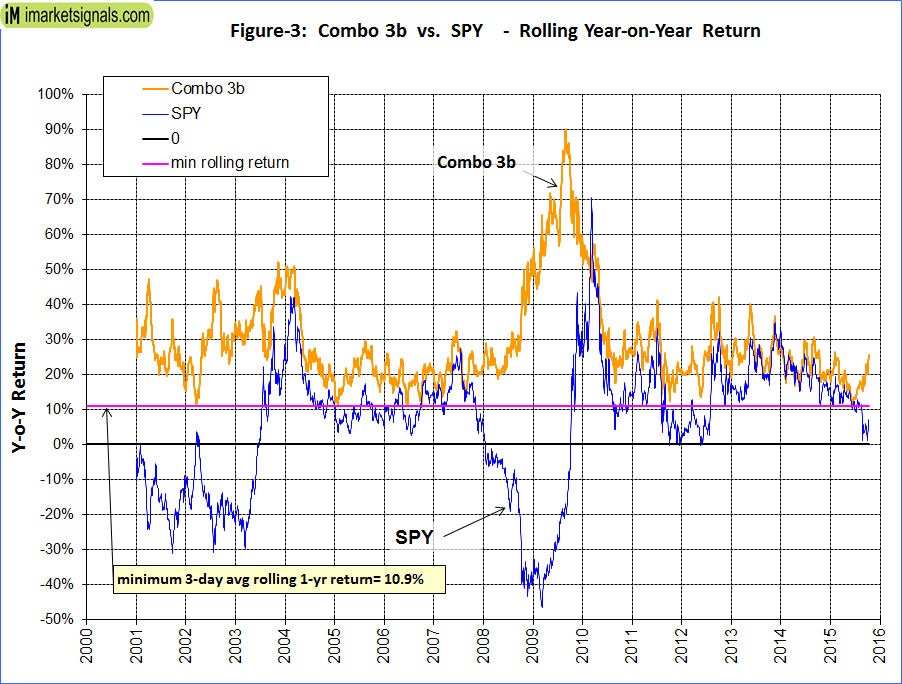
Figure 3 shows the rolling 1-year returns starting each trading day from 2000 to 2014. The minimum return over 12 months was 10.9% and the maximum was about 90%.
Distribution of Monthly Returns
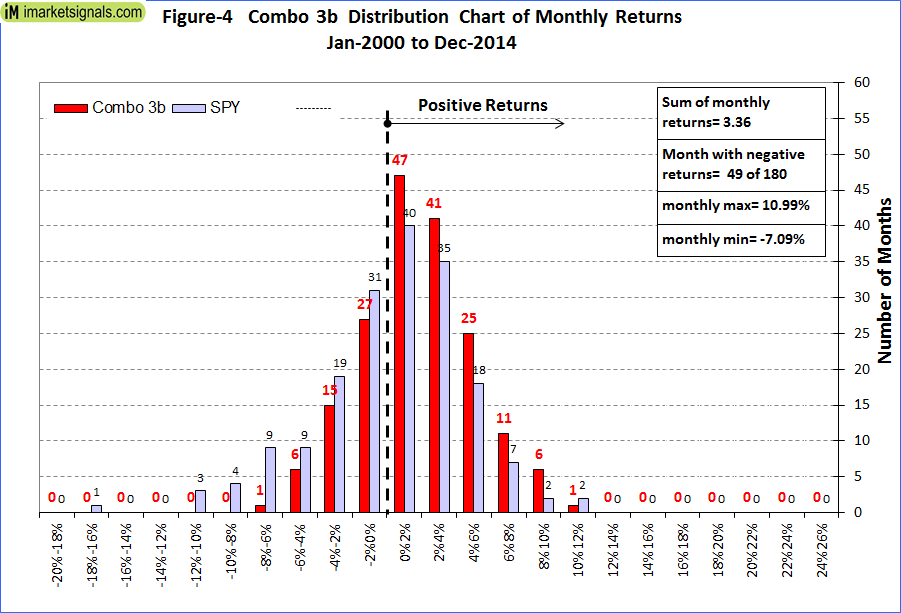
Figure 4 shows the distribution of monthly returns. There were a total of 180 months in the period under consideration. Combo3b produced positive returns during 131 months and only 49 months had negative returns, as is evident from the chart above. SPY had 76 months of negative returns.
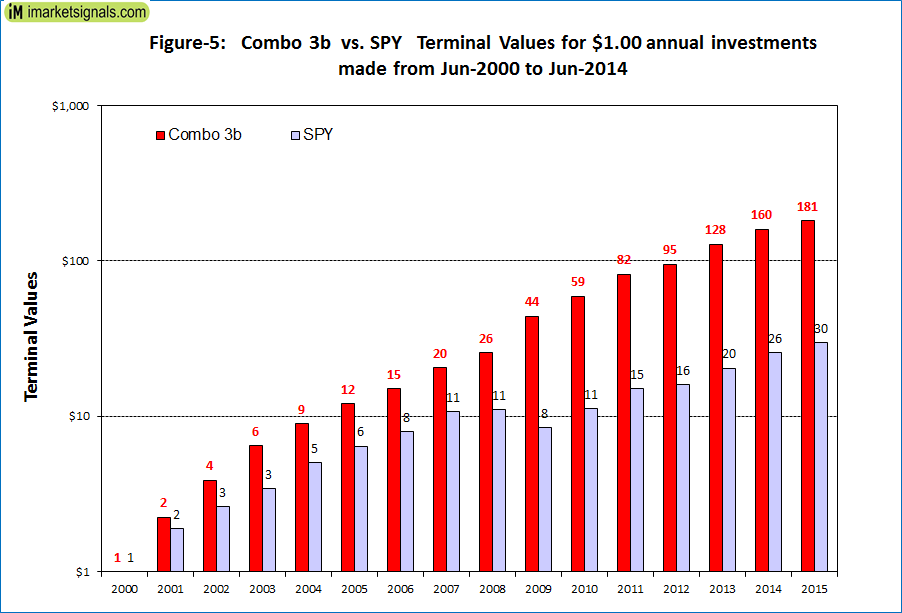
Terminal Values
To simulate savings over time, terminal values were calculated to June 2015 for hypothetical investments of $1 made at the first day of June each year. Starting with one dollar during each of the 15 years from 2000 to 2014, one would have invested a total of $15 cumulatively by the end. Summing the 15 terminal values, this strategy would have netted this dollar-per-year investor $181 at the end.
The same savings strategy with investments in SPY would have only delivered $30 at the end, about 17% of what Combo3b would have provided.
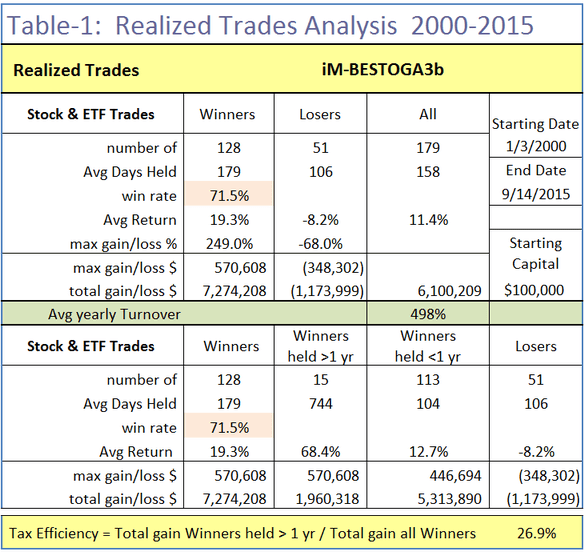
Realized Trades Analysis
To From Jan-3-2014 to Oct-14-2015 there were 179 trades completed, 128 of these were winners and 51 were losers, as listed in Table 1.
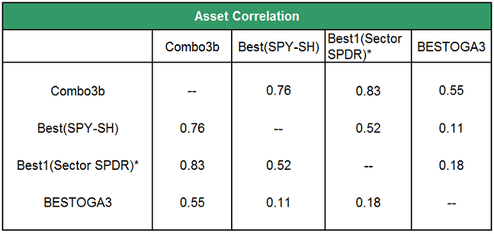
Correlation between component models
The correlation between the component models is fairly low, with 1.0 signifying 100% correlation.
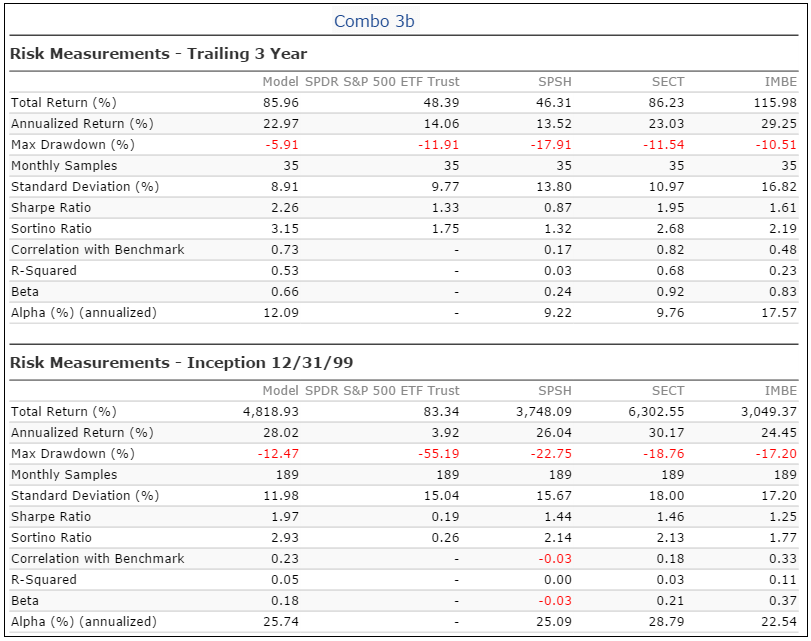
Risk Measurements
All risk measurements for Combo3b are better than for the individual component models.
Following the Model
This model can be followed live at iMarketSignals, where it will be updated weekly together with our other trading- and macro models.
Disclaimer
One should be aware that all results for the BESTOGA-3 system are from a simulation and not from actual trading. For the two ETF component models there is only two-year out-of-sample performance available and prior to that all performance is from backtest simulations.
All results are presented for informational and educational purposes only and shall not be construed as advice to invest in any assets. Out-of-sample performance may be much different. Backtesting results should be interpreted in light of differences between simulated performance and actual trading, and an understanding that past performance is no guarantee of future results. We can make no claims about future performance of this combination model, which may include significant potential for losses. All investors should make investment choices based upon their own analysis of the asset, its expected returns and risks, or consult a financial adviser. The designer of this model is not a registered investment adviser.
Great Model !! Low Std Dev, Good Shape e& Low MaxDD
Good stuff. I like the correlation matrix. Question: if you replaced 33% SPY-SH with the aggressive version of the market climate grader (SSO/SPY/XLU/SH), how would that impact the results?
Combo3b is a combination of three models running on P123. The Market Climate Grader model is not a model running on P123, and thus cannot be combined directly with P123 models.
is BESTOGA3 going to be on portfolio 123
Have you re-run this model with the “R1” changes you made to the Combo 3 model? Are those changes reflected here? Thanks!