
The four Recession Indicator models on iMarketSignals should provide early warnings of oncoming recessions. Historically, the prospect of an economic downturn (recession) has corresponded to declining stock prices. It is therefore prudent to reduce stock market allocations or exit the stock market prior to recessions.
Weekly Updates relevant to Recession Signals
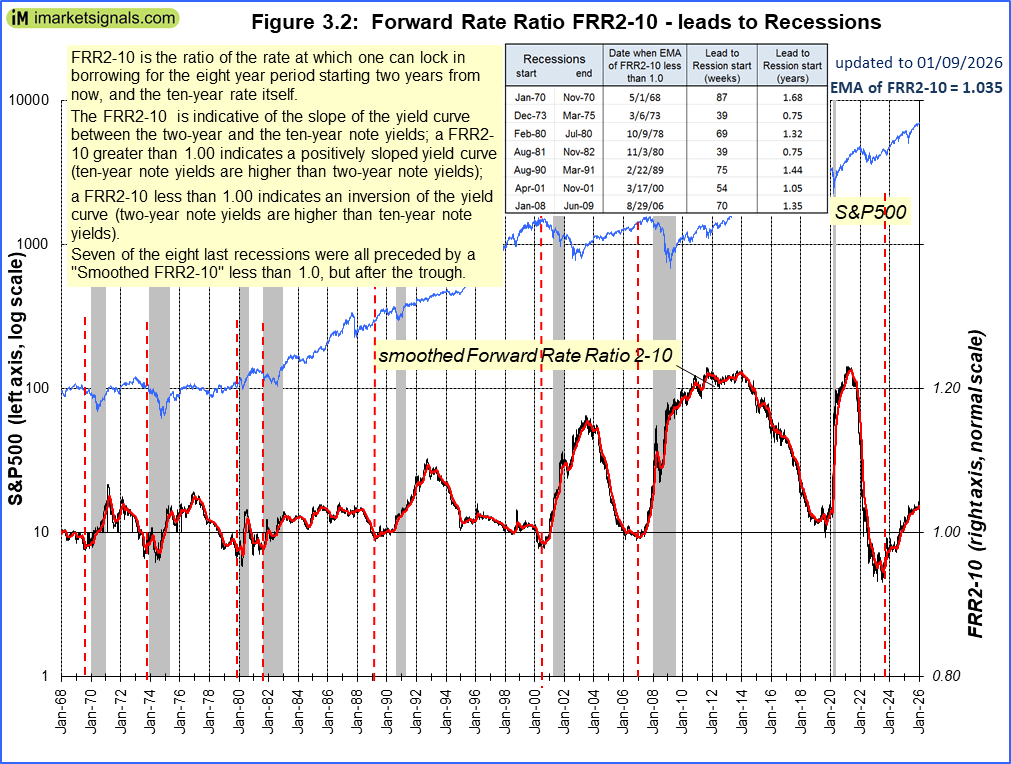
(i) The Recession Indicator FRR2-10: This indicator is a long leading indicator, 14 month average before the recession starts, and the markets may still rise after this indicator falls below 1.0.
|
2/20/2026: Latest update only available to Bronze members 1/9/2026: The Forward Rate Ratio between the 2-year and 10-year U.S. Treasury yields (FRR2-10) is no longer inverted and the curve is steepening. A description of this indicator can be found here. |
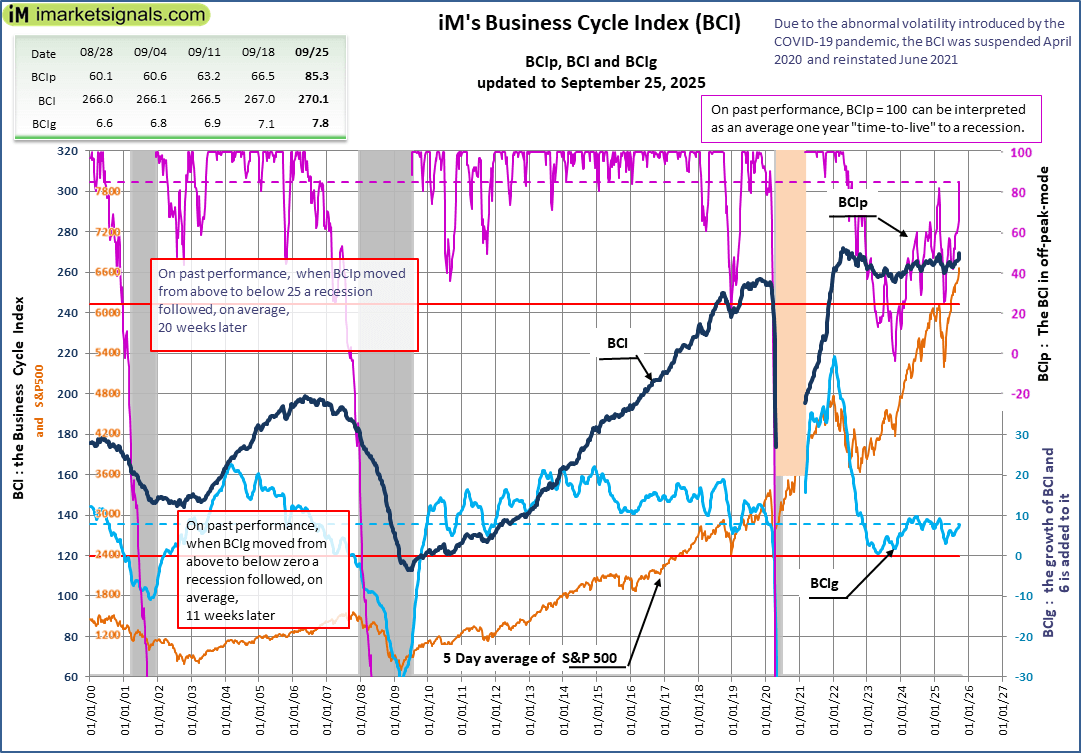
(ii) The Recession Indicators BCI : On past performance, if BCIp falls below 25 a recession may begin about 20 weeks later, markets may have peaked or are about to peak. If BCIg falls below zero a recession followed historically on average 11 weeks later, markets have peaked.
|
3/5/2026: Latest update only available to Bronze members 9/25/2025: |

(iii) The Recession Indicators COMP : Similar to BCIg, if this indicator falls below zero a recession starting a few weeks ahead is signaled by the model.

|
2/20/2026: Latest update only available to Bronze members 9/26/2025: show=0]
Market Signals Summary:The 3-month Hi-Lo Index and the iM-Google Trend are disinvested from the markets, whereas the MAC-US, S&P 500 Coppock Indicator, and CAPE-Cycle-ID are invested The BCIg does not signal a recession as does the growth of the Conference Board’s Leading Economic Indicator. The Forward Rate Ratio between the 2 and 10 is no longer inverted and the curve is steepening. The iM-Gold Coppock and the iM-Gold Timer are invested in gold. The iM-Silver Coppock is invested in silver.
Stock-markets: The MAC-US model is invested since mid June 2025, The MAC-US model is invested since mid June 2025,
.
|
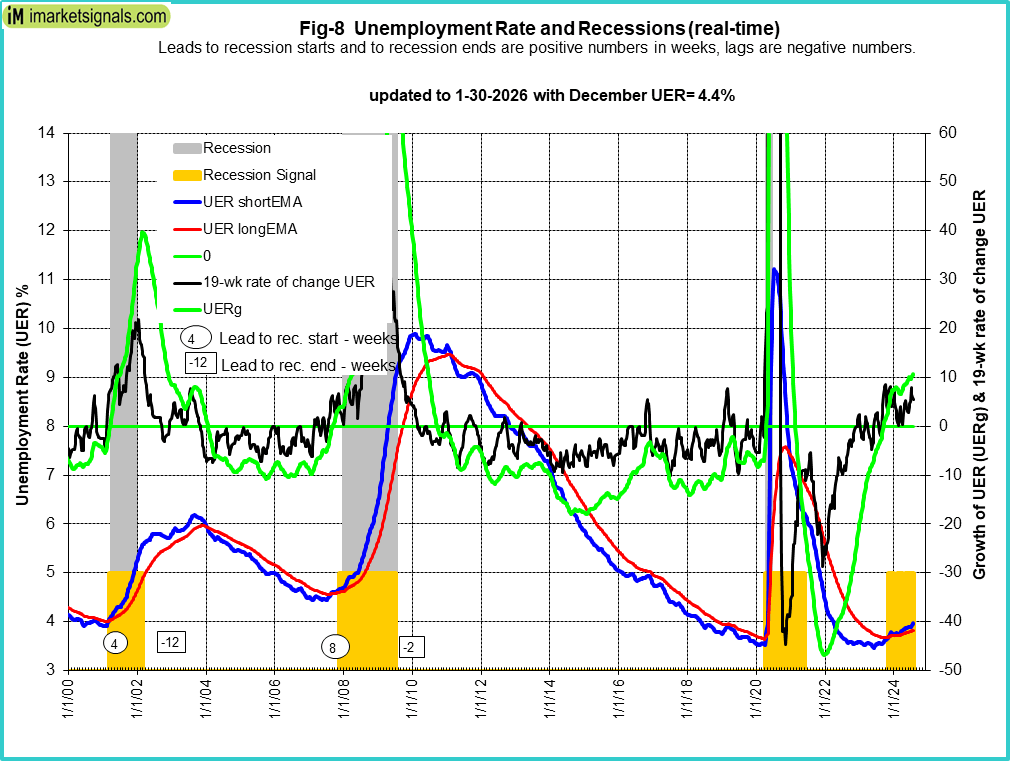
(iv) The Unemployment Rate Recession Model:
The model signals the start of a recession when any one of the following three conditions occurs:
- The short exponential moving average (EMA) of the unemployment rate (UER) rises and crosses the long EMA to the upside, and the difference between the two EMAs is at least 0.07.
- The unemployment rate growth rate (UERg) rises above zero, while the long EMA of the unemployment rate has a positive slope, and the difference between the long EMA at that time and the long EMA 10 weeks before is greater than 0.025.
- The 19-week rate of change of the UER is greater than 8.0%, while simultaneously the long EMA of the UER has a positive slope and the difference between the long EMA at the time and the long EMA 10 weeks earlier is greater than 0.015.
|
3/6/2026: To view latest update please log in 1/9/2026: 
The 3/6/2025 BLS Employment Situation Report reports that the February 2026 unemployment rate increased by 0.1% to 4.4%. Our UER model does signal a recession with a recession probability of 30% (see graph).
CAPE-Cycle-ID Fig 9a depicts the CAPE-Cycle-ID and the year-on-year rate-of-change of the Shiller CAPE; the level switched from -2 to 0 end of June 2023 generating a buy signal. This indicator now invested in the markets. This indicator is described here. Fig 9a depicts the CAPE-Cycle-ID and the year-on-year rate-of-change of the Shiller CAPE; the level switched from -2 to 0 end of June 2023 generating a buy signal. This indicator now invested in the markets. This indicator is described here.
To avoid the bear market, exit stocks when the spread between the 5-month and 25-month moving averages of S&P-real becomes negative and simultaneously the CAPE-Cycle-ID score is 0 or -2. (read more)
Estimated Forward 10-Year Returns The estimated forward 10‐year annualized real return is 4.5% (previous month 4.4%) with a 95% confidence interval 3.0% to 5.9% (2.9% to 5.9%). Also refer to the Realized Forward 10-Year Returns vs. Inflation Rate The estimated forward 10‐year annualized real return is 4.5% (previous month 4.4%) with a 95% confidence interval 3.0% to 5.9% (2.9% to 5.9%). Also refer to the Realized Forward 10-Year Returns vs. Inflation Rate  We may be in a rising inflation period with a falling CAPE-MA35 ratio similar to 1964-1973. This implies very low or negative 10 year forward annualized real returns, much lower than the returns indicated by regression analysis shown in the Estimated Forward 10-Year Returns. We may be in a rising inflation period with a falling CAPE-MA35 ratio similar to 1964-1973. This implies very low or negative 10 year forward annualized real returns, much lower than the returns indicated by regression analysis shown in the Estimated Forward 10-Year Returns.
.
iM-GT Timer The iM-GT Timer, based on Google Search Trends volume indicator is not invested in the stock markets since beginning November 2025. This indicator is described here. The iM-GT Timer, based on Google Search Trends volume indicator is not invested in the stock markets since beginning November 2025. This indicator is described here.
|
is there an update to the DAGS chart available somewhere?
Was there no BCI posted for the week of Jan 11 2024?