The March 2020 Unemployment Rate Is Signaling A Recession
- For what is considered to be a lagging indicator of the economy, the unemployment rate provides surprisingly good signals for the beginning and end of recessions.
- This model, backtested to 1948, reliably provided recession signals.
- The model, updated with the March 2020 rate of 4.4%, does now signal a recession.
A reliable source for recession forecasting is the unemployment rate, which can provide signals for the beginning and end of recessions (Appendix B charts the UER recession indicator for the period 1948 to 2015).
As anticipated (article link), the unemployment rate model (article link) updated with the March 2020 rate of 4.4% does now signal a recession.
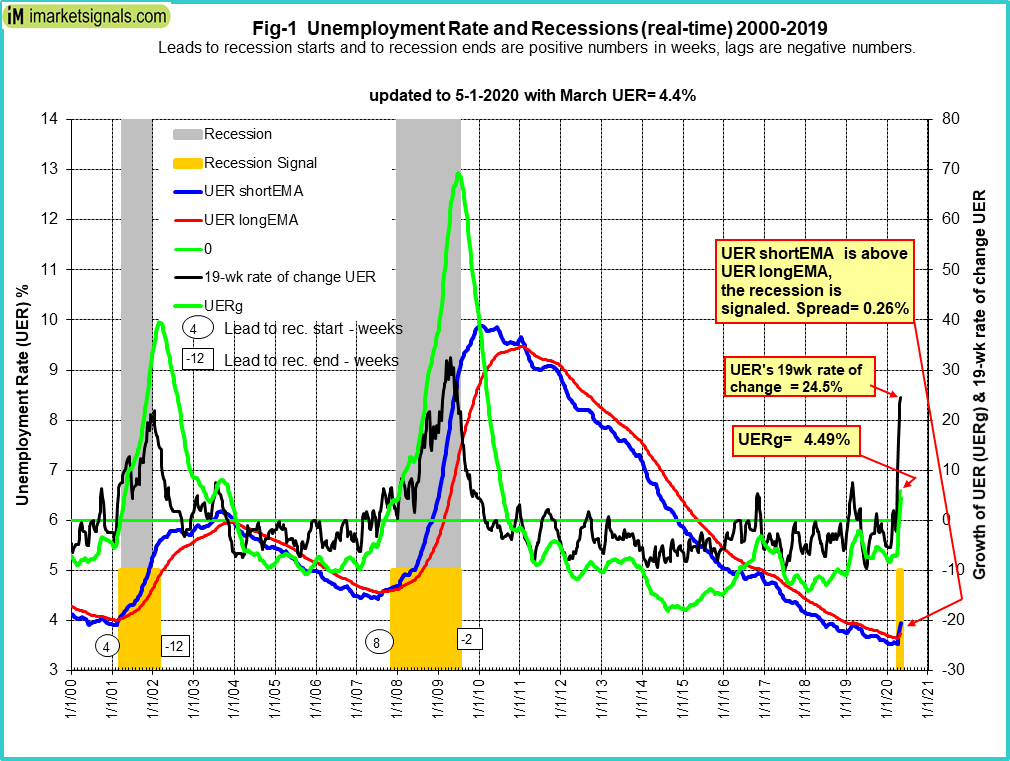
The model relies on four indicators to signal recessions:
- The short 12-period and a long 60-period exponential moving average (EMA) of the unemployment rate (UER).
- The eight-month smoothed annualized growth rate of the UER (UERg).
- The 19-week rate of change of the UER.
The criteria for the model to signal the start of recessions are given in the original article and repeated in the Appendix.
Referring to the chart below and looking at the end portion of it, one can see that all three of the conditions for the start of a recession have been met.
- The UER at 4.4% is up from last month. The short EMA is above its long EMA, the blue and red graphs, respectively, and the spread, now at plus 0.26%, last month’s minus 0.11%.
- UERg rose from minus 7.01% to plus 4.49%, far above zero – the green graph.
- Also, the 19-week rate of change of the UER increased to plus 24.5%, also far above the 8% critical level – the black graph.
Based on the historic patterns of the unemployment rate indicators prior to recessions, one can reasonably conclude that the U.S. economy has enetered a recession.
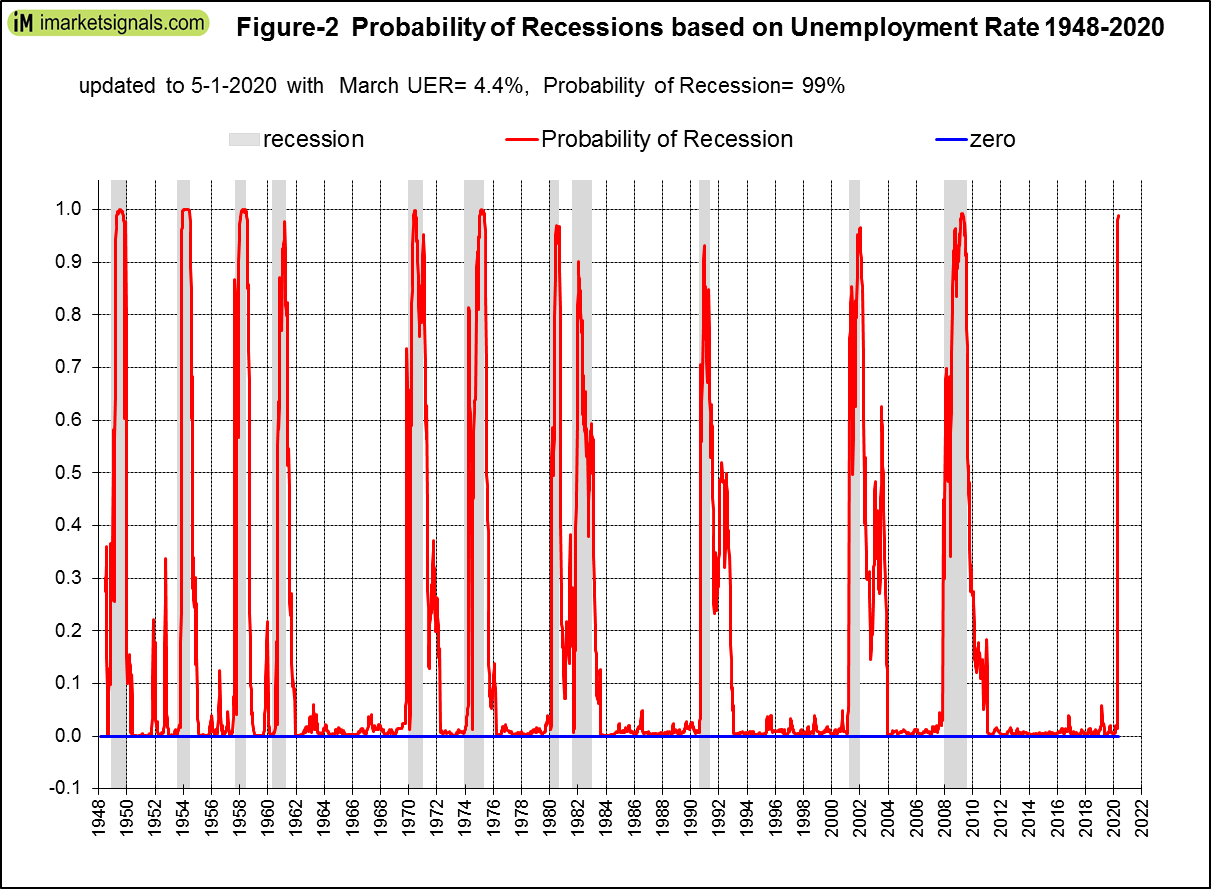
Recession Probability
The probability of an imminent recession is 99%, as shown in the Figure below. The probability plot spans the period 1948 to 2020, encompassing eleven recessions.
Leads to recession starts
Leads to recession start from the UER model for the last eleven recessions:
- Maximum lead time = 21 weeks (out of seven early signals)
- Minimum lead time = -14 weeks (out of four late signals)
- Average lead time = 2 weeks
Appendix
The model signals the start of a recession when any one of the following three conditions occurs:
- The short exponential moving average (EMA) of the unemployment rate (UER) rises and crosses the long EMA to the upside, and the difference between the two EMAs is at least 0.07.
- The unemployment rate growth rate (UERg) rises above zero, while the long EMA of the unemployment rate has a positive slope, and the difference between the long EMA at that time and the long EMA 10 weeks before is greater than 0.025.
- The 19-week rate of change of the UER is greater than 8.0%, while simultaneously the long EMA of the UER has a positive slope and the difference between the long EMA at the time and the long EMA 10 weeks earlier is greater than 0.015.
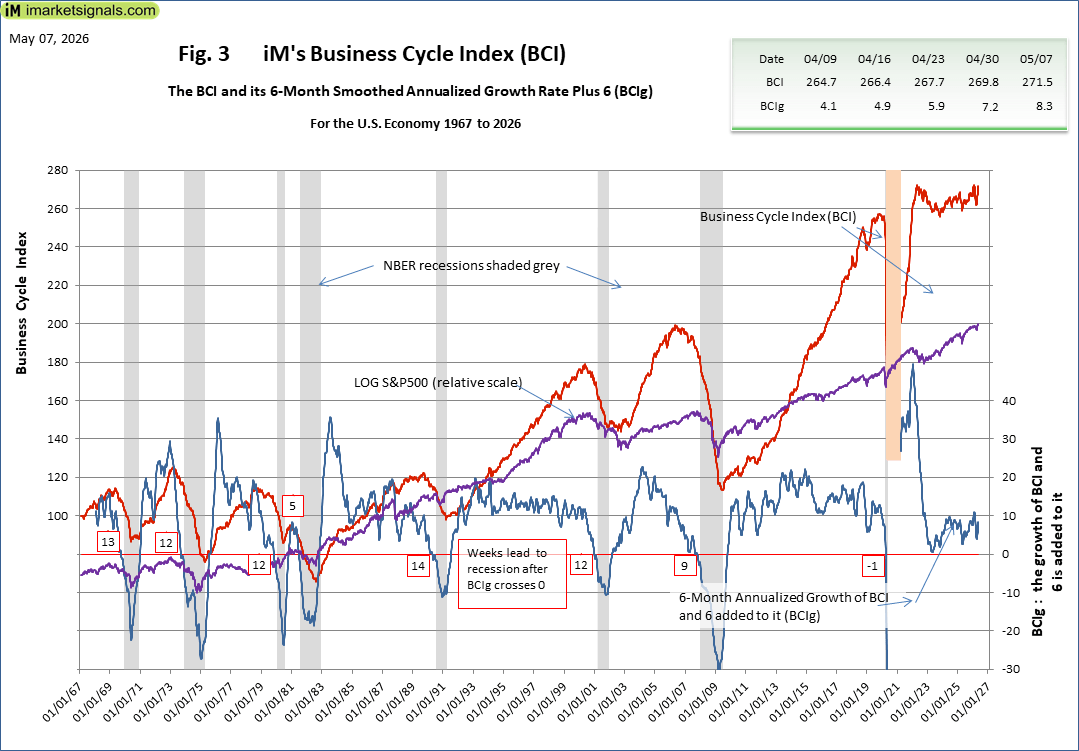
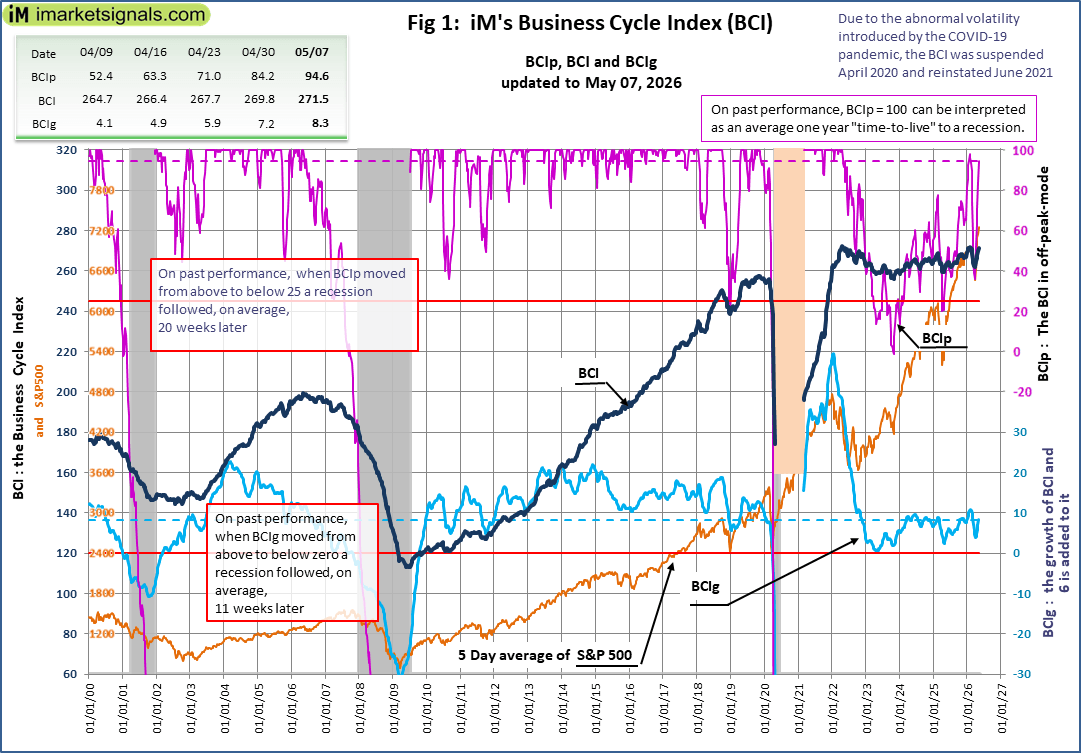
BCI is not Signaling a Recession — BCI Update 5/7/2026
Is your investment strategy protecting your assets from the next recession? Our Business Cycle Index is a tool to help you gauge recession risk.
Back testing the BCI (short for Business Cycle Index) shows that it would have provided, on average, a 20-week leading signal for the seven recessions in the period 1969 to 2020. Because of the nature of black swan events that have no economic precedent, the COVID-19 recession of 2020 was signaled late but well before the NBER announced it.
Figure 1 plots BCIp, BCI, BCIg, the S&P500, and the thresholds (red lines) that need to be crossed from above to below to signal a looming recession.
The Business Cycle Index
Nobody can predict the arrival date of the next recession. However, using freely available economic data we derive a reliable signal that warns of an oncoming recession. We designed the Business Cycle Index to signal well in advance the beginning of a NBER-recession. The BCI uses the below listed economic data, downloaded from FRED.
- 10-year treasury yield (daily)
- 3-month treasury bill yield (daily)
- S&P500 (daily)
- Continues Claims Seasonally Adjusted (weekly)
- All Employees: Total Private Industries (monthly)
- New houses for sale (monthly)
- New houses sold (monthly)
The 6-month smoothed annualized growth rate of a series is a well-established method to extract an indicator from it. We use this method to obtain BCIg, i.e. the calculated growth rate with 6.0 added to it. The BCIg generates on past performance an average 11-week leading recession signal when it falls below zero.
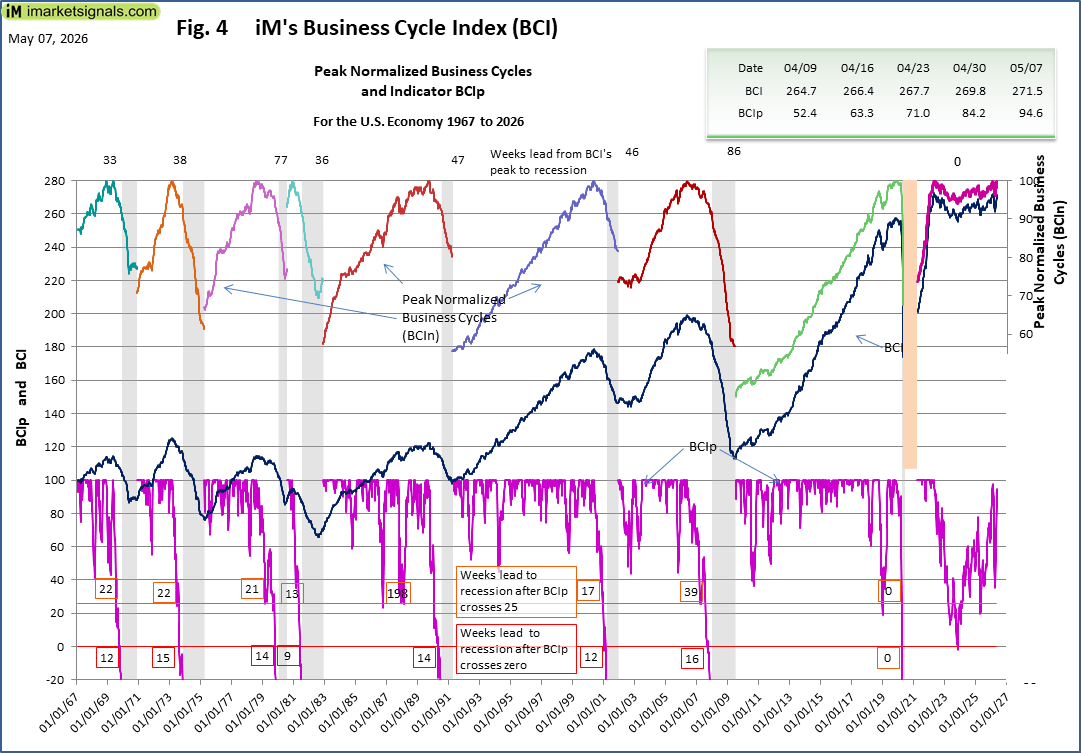
Also, the index BCI retreats from its cyclic peak before a recession in a well-defined manner. This is the basis for the alternative indicator BCIp (and its variant BCIw) which gives an average 20-week leading signal to the next recession when BCIp falls below 25.
A more detailed description of the BCI can be found here.
Investment Strategy
As a guide on how to use the BCI refer to Exit Signals for the Stock Market from iM’s Business Cycle Index and to Table 1 in this post.
Figure 2 graphs the history of BCI, BCIg, and the LOG(S&P500) since July 1967, and Figure 3 plots the history of BCIp. Overall 46 years of history that includes the seven last recessions each of which the BCIg, and BCIp, managed to signal. These graphics also include the weeks lead signaled to the then next recession.