
Unemployment
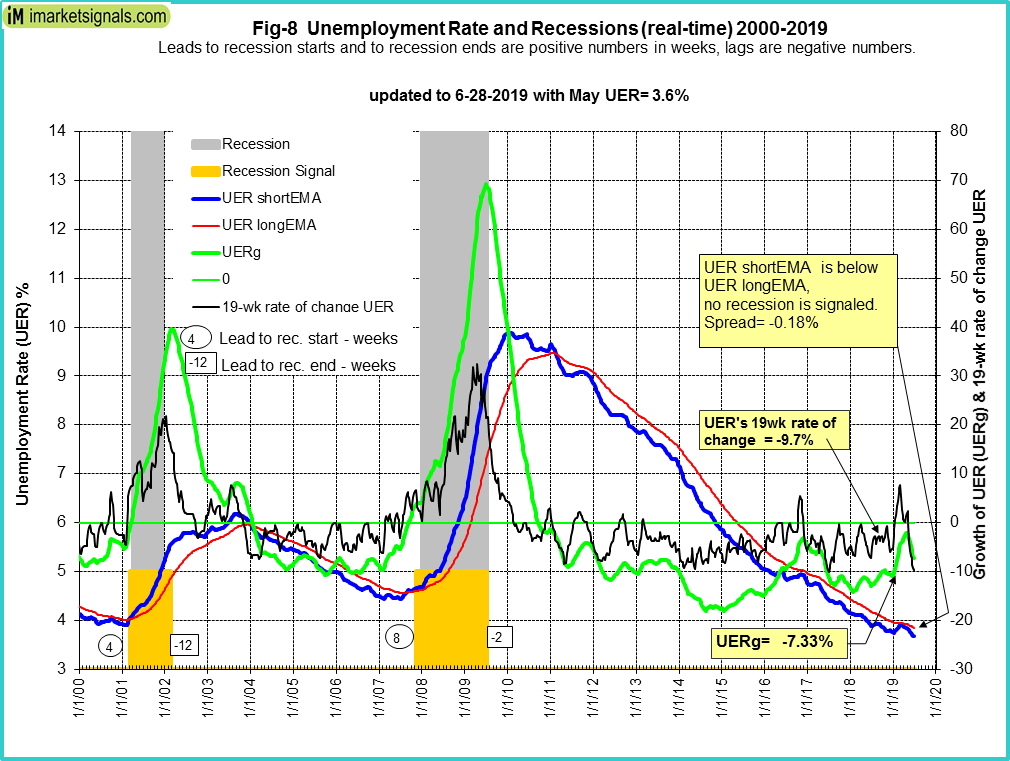 The unemployment rate recession model (article link), has been updated with the May UER of 3.6%. The model does not signal a recession.
Here is the link to the full update.
The Dynamic Linearly Detrended Enhanced Aggregate Spread:
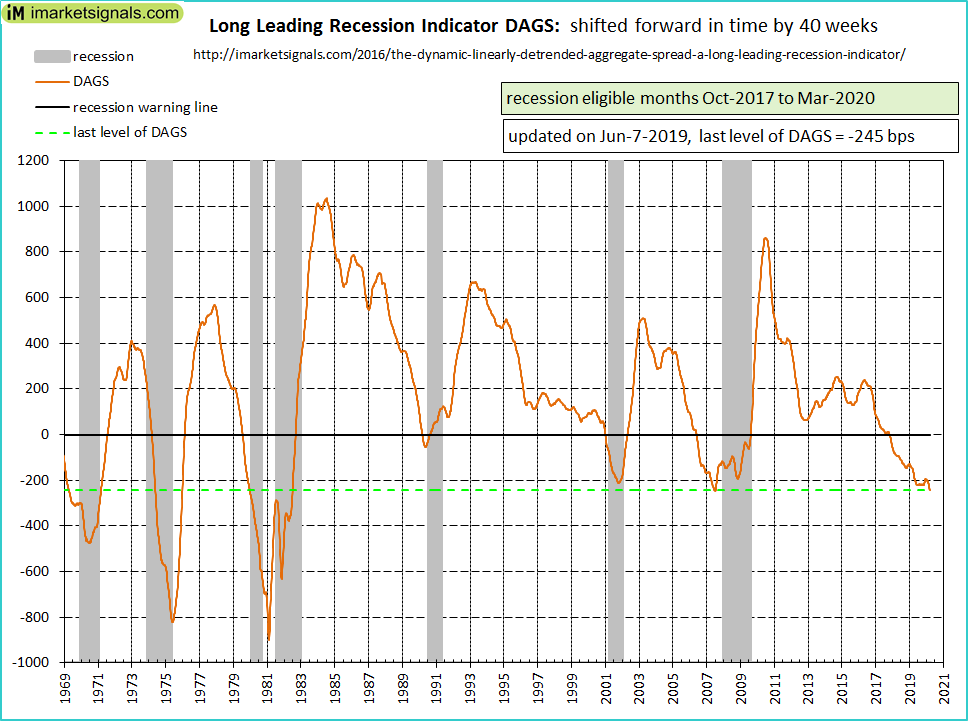
The updated level of this indicator, -245bps, below last months -212bps, confirms the January 20, 2017 signal. The recession eligible months are from October 2017 to March 2020. (Note: All our other recession indicators are far from signal a recession.)
CAPE-Cycle-ID
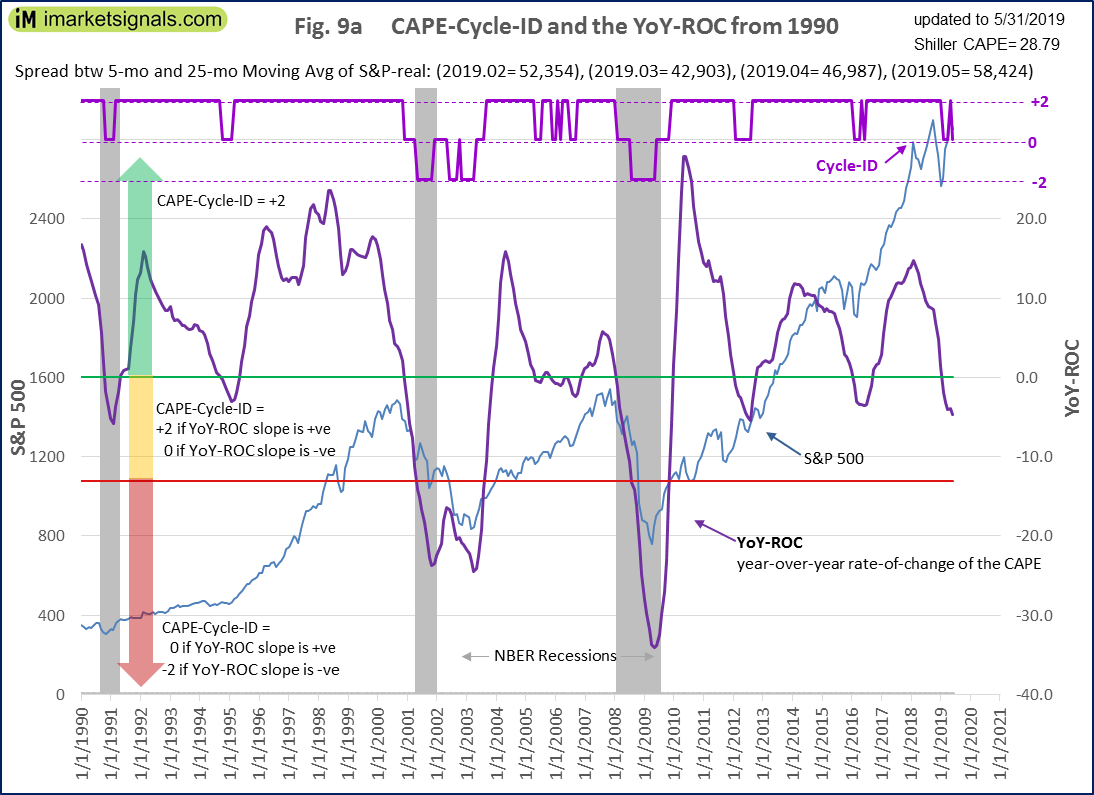 Fig 9a depicts the CAPE-Cycle-ID and the year-on-year rate-of-change of the Shiller CAPE; the level moved from +2 to +0 end of May-2019. This indicator is described here.
To avoid the bear market, exit stocks when the spread between the 5-month and 25-month moving averages of S&P-real becomes negative and simultaneously the CAPE-Cycle-ID score is 0 or -2. (read more)
Estimated Forward 10-Year Returns
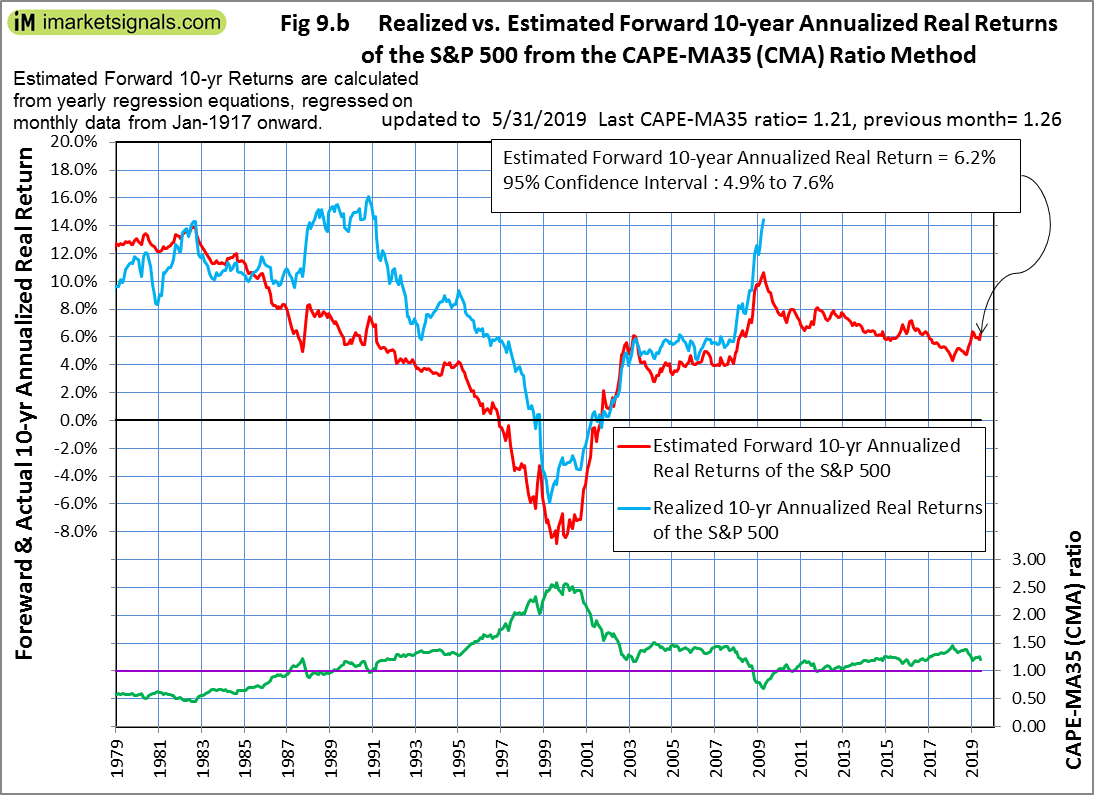 The estimated forward 10‐year annualized real return are estimated at 62% with a 95% confidence interval : 4.9% to 7.6%, which are down 0.1% from last month.
iM-GT Timer
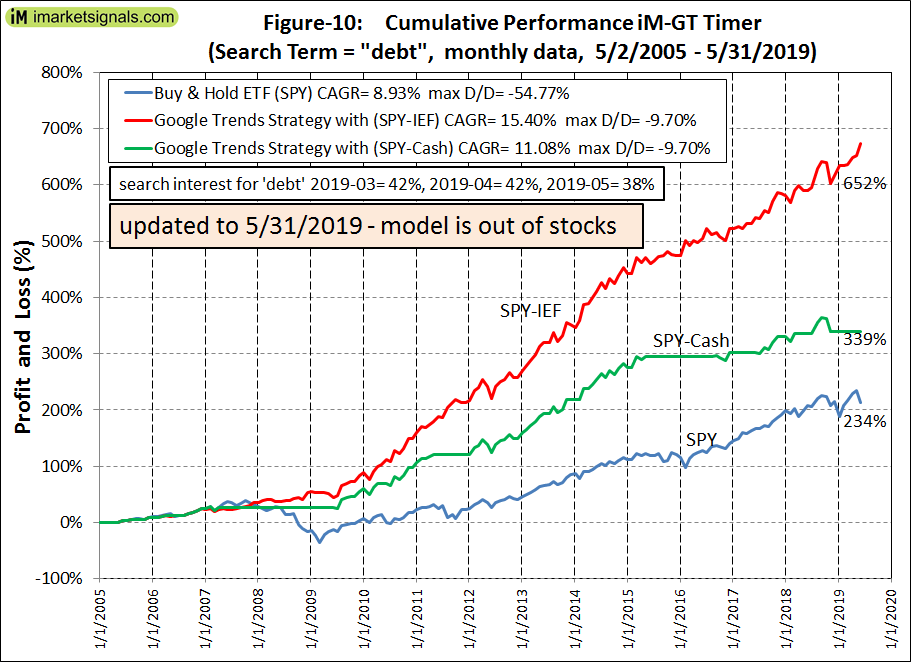 The iM-GT Timer, based on Google Search Trends volume switched to cash on 11/1/2018 and remains out of the market. This indicator is described here.
Trade Weighted USD
 The Trade Weighted $ value is on a moderate rising trend.
TIAA Real Estate Account
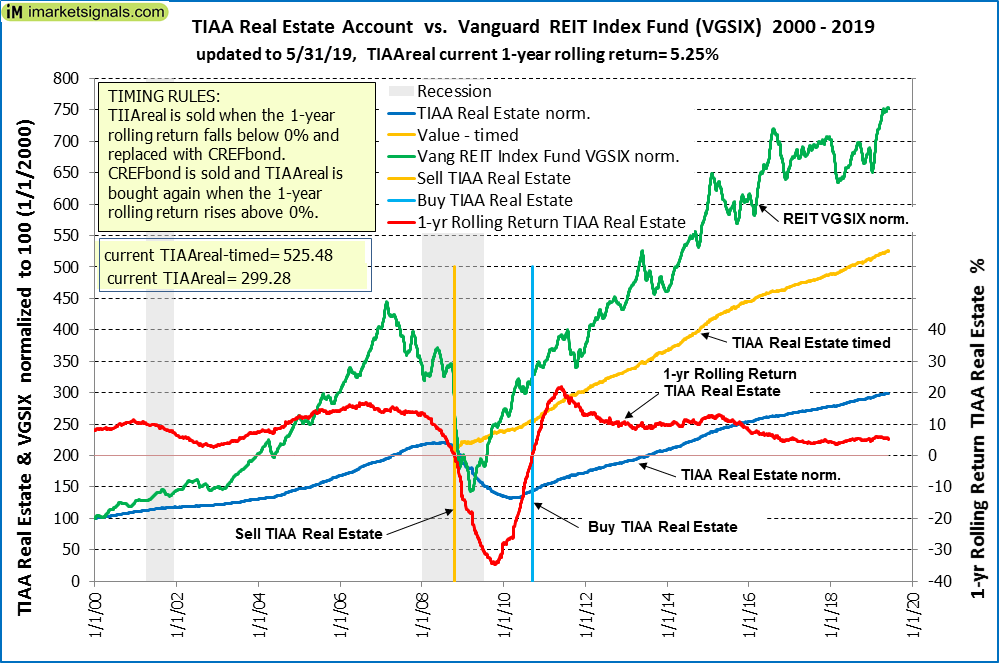 The 1-year rolling return for the end of last month is 5.25%. A sell signal is not imminent.
Leave a Reply
You must be logged in to post a comment.