
- The Dec-2018 Shiller Cyclically Adjusted Price to Earnings Ratio (CAPE-ratio) stands at 27.9, which is 11.0 above its long-term mean of 16.9, signifying overvaluation of stocks and low forward returns.
- The CAPE-MA35 methodology references stock market valuation to a 35-year moving-average of the Shiller CAPE-ratio (MA35) instead of the 1881-2018 long-term mean which the standard forecasting method is based on.
- The CAPE-MA35 method should be superior to the standard CAPE-ratio method as only the percentage difference between the CAPE-ratio and its MA35 is considered, and not the absolute difference.
- The CAPE-MA35 method and the falling trend of the CAPE-ratio currently signal a forward 10-year annualized real return for stocks of about 5.8%, while the historic long-term trend forecasts 5.0%.
- Only the ratio between the prevailing CAPE-ratio and its 35-year moving average (CAPE-ratio / MA35) is needed to easily obtain the expected 10-year forward returns from the charts in this article.
This is an update to our series of assessing market valuation and estimating forward stock market returns. (previous article)
The historic Long-Term Stock Market Trend
The historic data from Shiller’s S&P series is used to estimate future returns. The best-fit line for the real price of the S&P-Composite with dividends re-invested (S&P-real) from 1871 onward is a straight line when plotted to a semi-log scale. There is no evidence to suggest that this long-term trend, which shows an average compound annual real return of 6.7%, will be interrupted. S&P-real and the best-fit line together with its 95% prediction bands are shown in Figure-1. (For the equation of the trend-line see Appendix A in this article from Aug-2012.)
The Shiller CAPE ratio and the CAPE-MA35 Method
Also shown in Figure-1 is the Cyclically Adjusted Price to Earnings Ratio, which is the real price of the S&P 500 Index, divided by the arithmetic average of the last 10 years of real reported 12 months earnings per share of the Index. Currently the graph of the CAPE-ratio shows a falling trend and the Dec-2018 level is at 27.9. This is 11.0 higher than CAPE-ratio’s 1881-2018 long-term average of 16.9.
An alternative approach to the standard use of the Shiller CAPE-ratio is to assess stock market valuation using a moving average of the CAPE-ratio, rather than referencing the valuation to the a fixed long-term average of the CAPE-ratio, as the standard method does. This should to some degree smooth or eliminate effects from changes to accounting practices, dividend policies, and other reporting parameters over time.
In this analysis a 35-year moving average of the CAPE-ratio is used, currently having a level of 23.6, which is significantly higher than the long-term average of the CAPE-ratio of 16.9. The moving average over 35 years was chosen so that it would cover at least three business cycles based on the length of the longest recent business cycle expansion and contraction period of 128 months, from Mar-1991 to Nov-2001.
The percentage difference between the CAPE-ratio and its 35-year moving-average is termed “delta_MA35” and is currently equal to (27.9 – 23.6) /23.6 × 100 = 18.4%. This is down from the Sep-2017 value of 32.4% (article link) when the CAPE-ratio was still rising and stocks appeared overvalued.
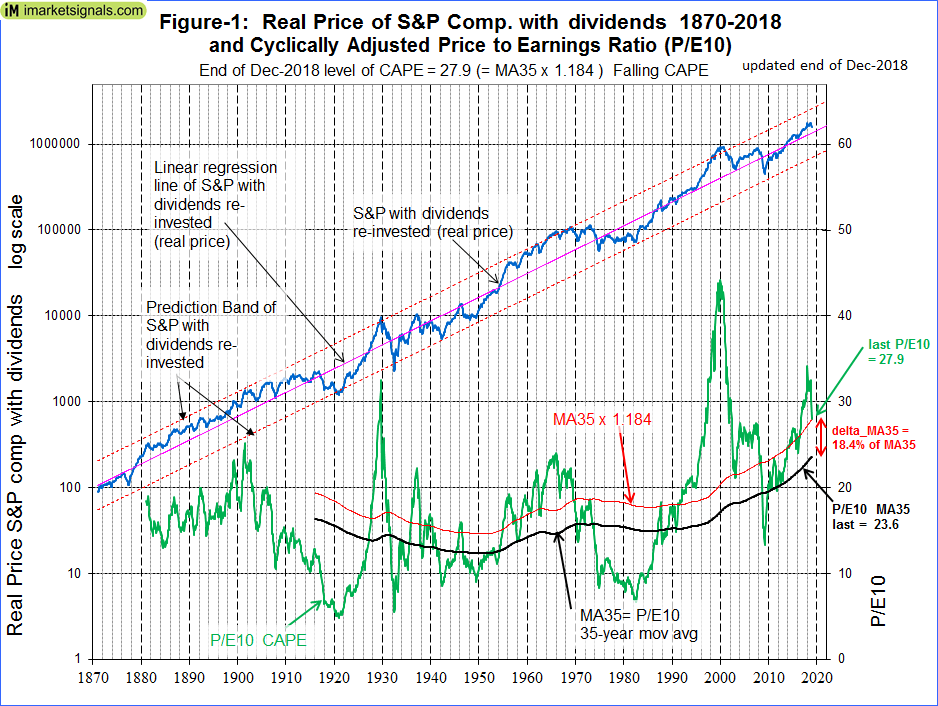
The CAPE-ratio is now 18.4% above its current 35-year moving average of 23.6. In Figure-1 the red graph is offset by 18.4% from the black 35-year moving average graph (MA35) and its ordinates have a value of MA35 x (1+delta_MA35), or MA35 x 1.184. The intersections of the red graph with the green CAPE-ratio graph show when the historic CAPE-ratios had the same percentage offsets from the 35-year moving average as it has now.
Forecasting long-term stock returns with the CAPE-MA35 methodology
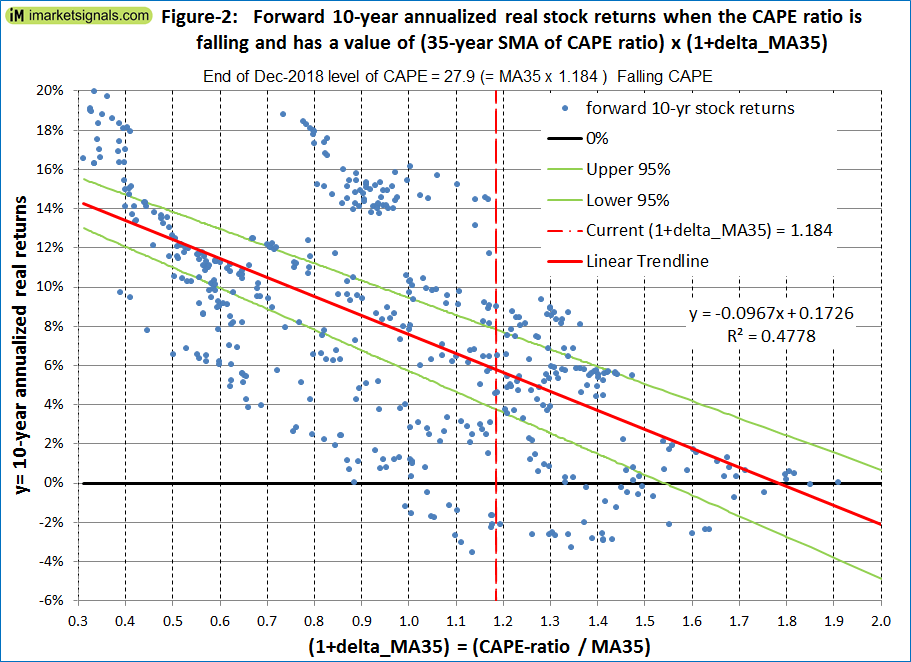
Figure-2 shows the historic 10-year annualized real returns which followed for various levels of (1+delta_MA35) when the CAPE-ratio was falling, as it is now. The trend shows that the 10-year annualized returns become smaller as (1+delta_MA35) increases.
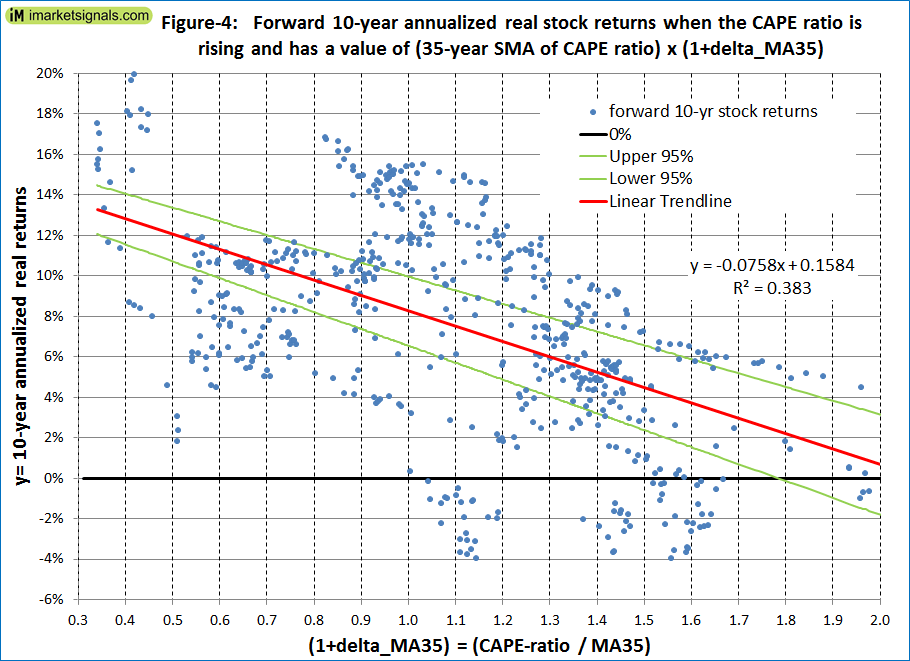
Also it is of interest that for the same (1+delta_MA35) value a rising CAPE-ratio forecasts higher 10-year annualized real returns than a falling CAPE-ratio; see Figure-4 in the Appendix.
Currently (1+delta_MA35) is at 1.184 and the CAPE-ratio is falling, therefore Figure-2 applies. From the trend line equation the forward 10-year annualized real return is 5.8%, as shown by the intersection of the red trend line and the red vertical line in the figure. This reasonably good expected return indicates that stock market valuation is currently not that excessive, contrary to what Shiller observed in September 2017.
From Figure-2 (falling CAPE ratio) one can conclude that it is safe to be in stocks when (1+delta_MA35) is at 1.0 or lower, that is when the value of the CAPE-ratio is equal to or less than its 35-year moving average.
Forecasting stock returns with the historic long-term market trend
In Figure-3 we plot the S&P-real for the period beginning 1995 and extending the trend-lines to 2030. Furthermore, we scale the graph to the Dec-2018 dollar value so that the end-value of the S&P-real is that of the Dec-2018 value of the S&P 500, this allows us to judge future values using today’s references.
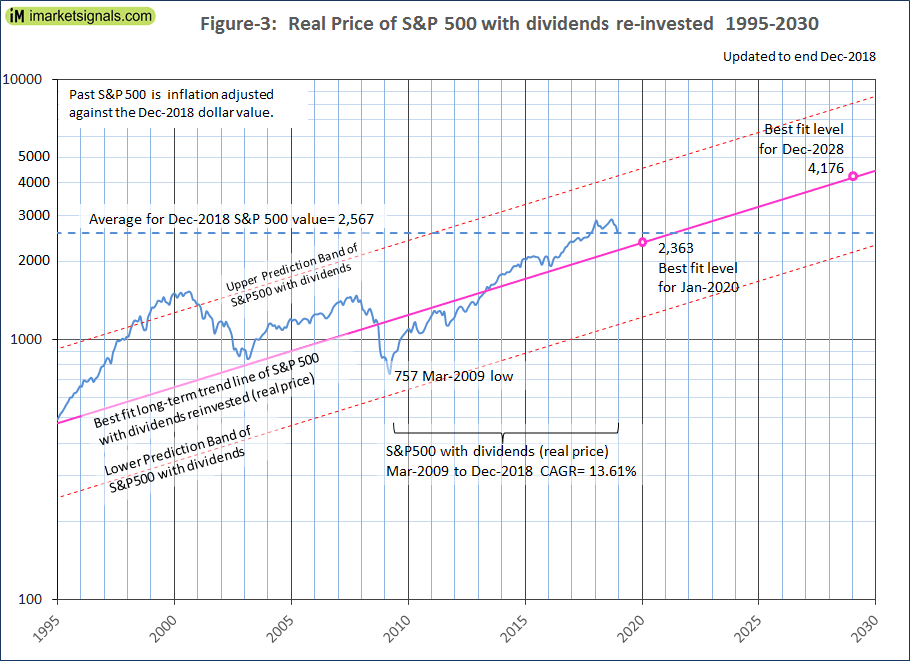
As shown in Figure-3, the average of the Dec-2018 values of the S&P 500 is 2,567 and located somewhat above the long-term best fit trend line. The historic trend forecast obtained by extending the best fit trend line shows a Dec-2028 value for S&P-real of 4,176. This would indicate an annualized real return of 5.0% over the next ten years if the actual value of S&P-real matches the best fit forecast level then.
Were the actual S&P-real to reach the trend line in three years, then the 3-year annualized return would amount to only 1.3%. Even worse, if the actual S&P-real reaches the trend line by Dec-2019, then the S&P 500 would have to suffer a loss of 8% over the next year, something that is quite possible.
How to use the CAPE-MA35 method
Investors can easily determine the 35-year moving average of Shiller’s CAPE-ratio by downloading the periodically updated Shiller spreadsheet from the Yale University website and calculate (1+delta_MA35), which is simply the most recent value of the CAPE-ratio divided by the most recent value of the 35-year moving average of the CAPE-ratio. Thereafter, depending on whether the CAPE-ratio is falling or rising, the expected 10-year forward returns can easily be obtained respectively, from Figure-2 or Figure-4 in this article.
Alternatively, for those not wanting to do this exercise themselves, the (1+delta_MA35) value and expected 10-year forward annualized real return of the S&P 500 index can also be found on our website iMarketSignals, where it will be updated monthly.
Conclusion
The current level of the CAPE-ratio relative to its 35-year moving average suggests that stocks are moderately overvalued. The CAPE-MA35 method and the historic long-term market trend forecast similar 10-year annualized real returns of 5.8% and 5.0%, respectively. Using the average of the two forecasts, then the most likely forward 10-year annualized real return would be about 5.4%.
However, this should not be interpreted to mean that stocks will actually produce a 5.4% annualized return over the next 10 years. From the CAPE-MA35 method and the historic long-term market trend’s prediction band limits, the minimum & maximum 10-year forecast returns are -2% & 14% and -2.5% & 12.1%, respectively, which are similar forecasts obtained from two different methodologies. Thus it is possible, but not very likely, that the market could show a small loss or a large gain over the next 10 years.
Large drawdowns are always possible during a 10-year look-ahead period. Investments can be protected by following signals from various market-timing models at iMarketSignals. It is also important to know when a recession is looming, because stocks usually do poorly during recession periods. Our Business Cycle Index should provide early warning of an oncoming recession.
Appendix
Figure-4 shows the historic 10-year real annualized returns which followed for various levels of (1+delta_MA35) when the CAPE-ratio was rising.
Leave a Reply
You must be logged in to post a comment.