
  |
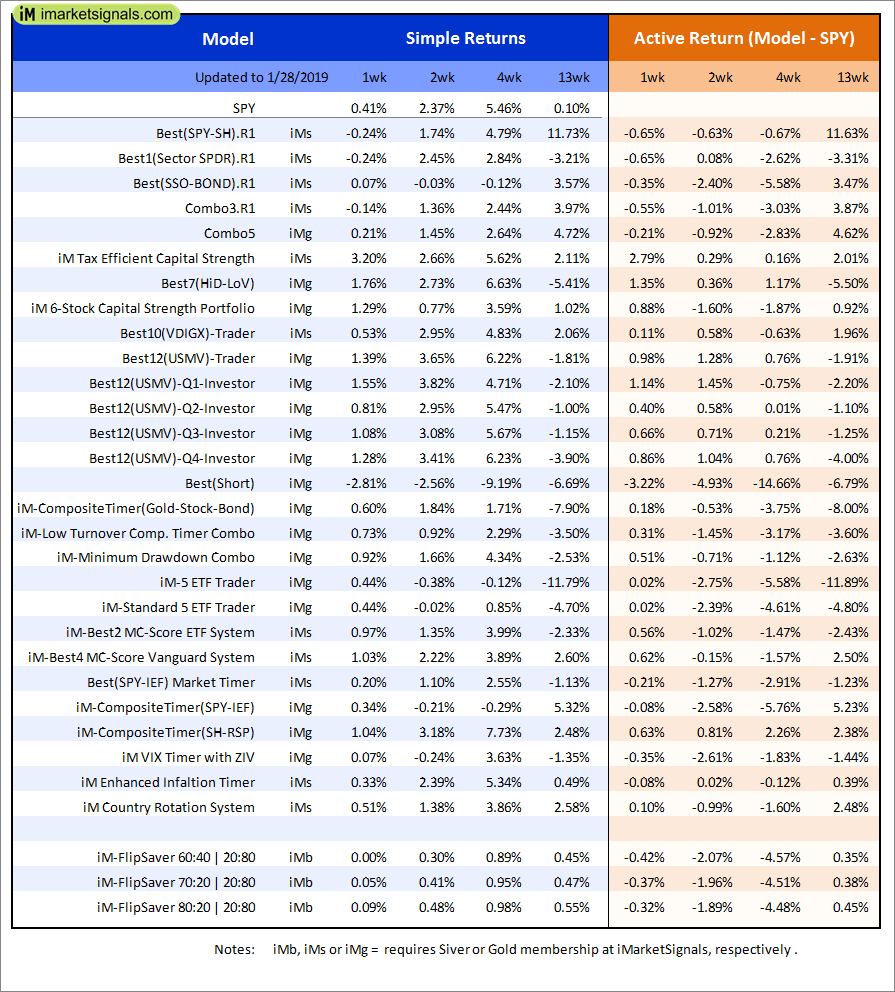
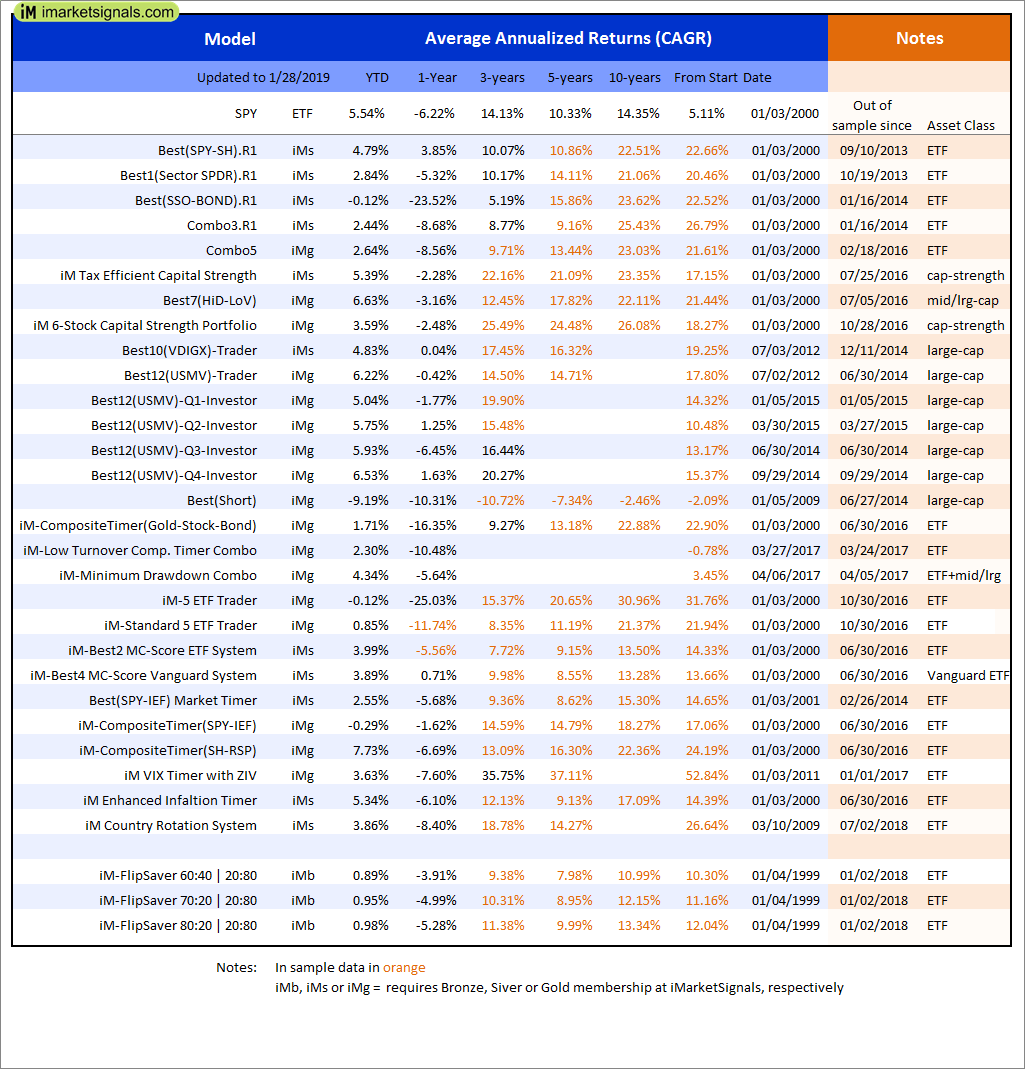
Out of sample performance summary of our models for the past 1, 2, 4 and 13 week periods. The active active return indicates how the models over- or underperformed the benchmark ETF SPY. Also the YTD, and the 1-, 3-, 5- and 10-year annualized returns are shown in the second table |
 |
iM-FlipSaver 60:40 | 20:80 – 2017: The model’s out of sample performance YTD is 1.0%, and for the last 12 months is -4.4%. Over the same period the benchmark SPY performance was 3.5% and -2.9% respectively. Over the previous week the market value of iM-FlipSaver 80:20 | 20:80 gained 0.02% at a time when SPY gained 0.30%. A starting capital of $100,000 at inception on 7/16/2015 would have grown to $112,994 which includes $516 cash and excludes $639 spent on fees and slippage. |
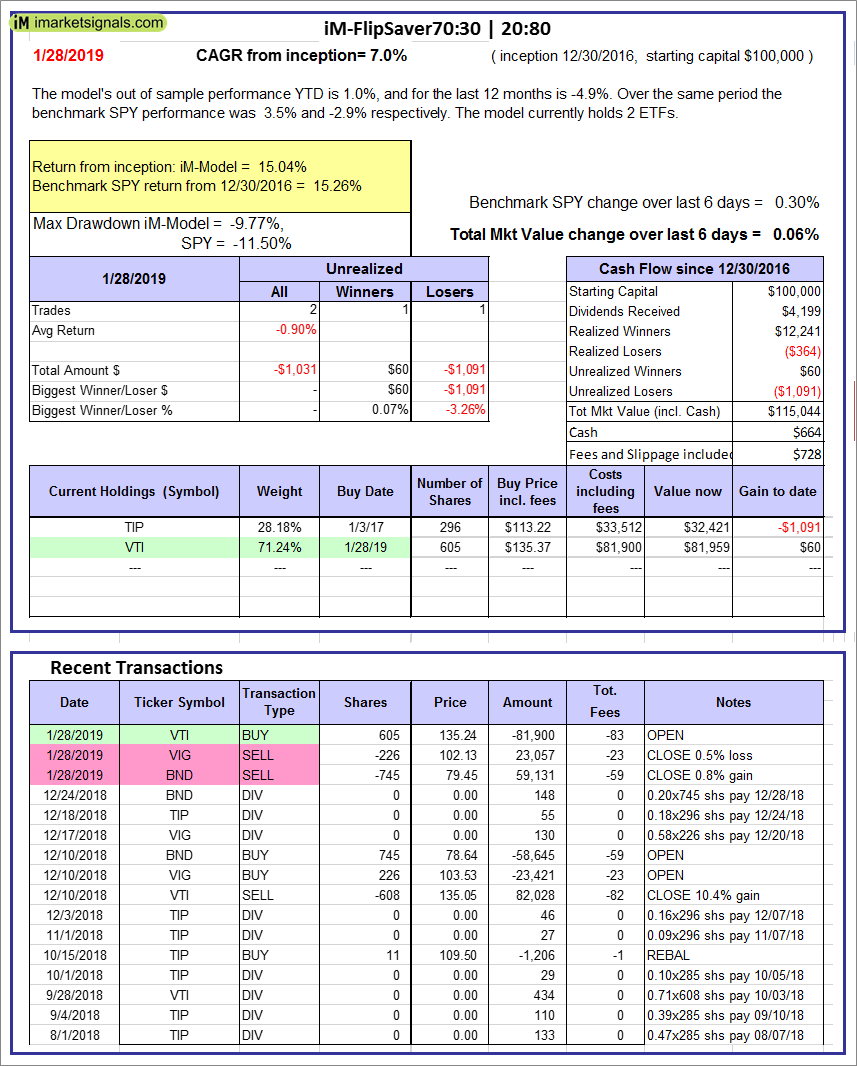 |
iM-FlipSaver 70:30 | 20:80 – 2017: The model’s out of sample performance YTD is 1.0%, and for the last 12 months is -4.9%. Over the same period the benchmark SPY performance was 3.5% and -2.9% respectively. Over the previous week the market value of iM-FlipSaver 70:30 | 20:80 gained 0.06% at a time when SPY gained 0.30%. A starting capital of $100,000 at inception on 7/15/2015 would have grown to $115,044 which includes $664 cash and excludes $728 spent on fees and slippage. |
 |
iM-FlipSaver 80:20 | 20:80 – 2017: The model’s out of sample performance YTD is 1.0%, and for the last 12 months is -5.3%. Over the same period the benchmark SPY performance was 3.5% and -2.9% respectively. Over the previous week the market value of iM-FlipSaver 80:20 | 20:80 gained 0.10% at a time when SPY gained 0.30%. A starting capital of $100,000 at inception on 1/2/2017 would have grown to $117,093 which includes $681 cash and excludes $818 spent on fees and slippage. |
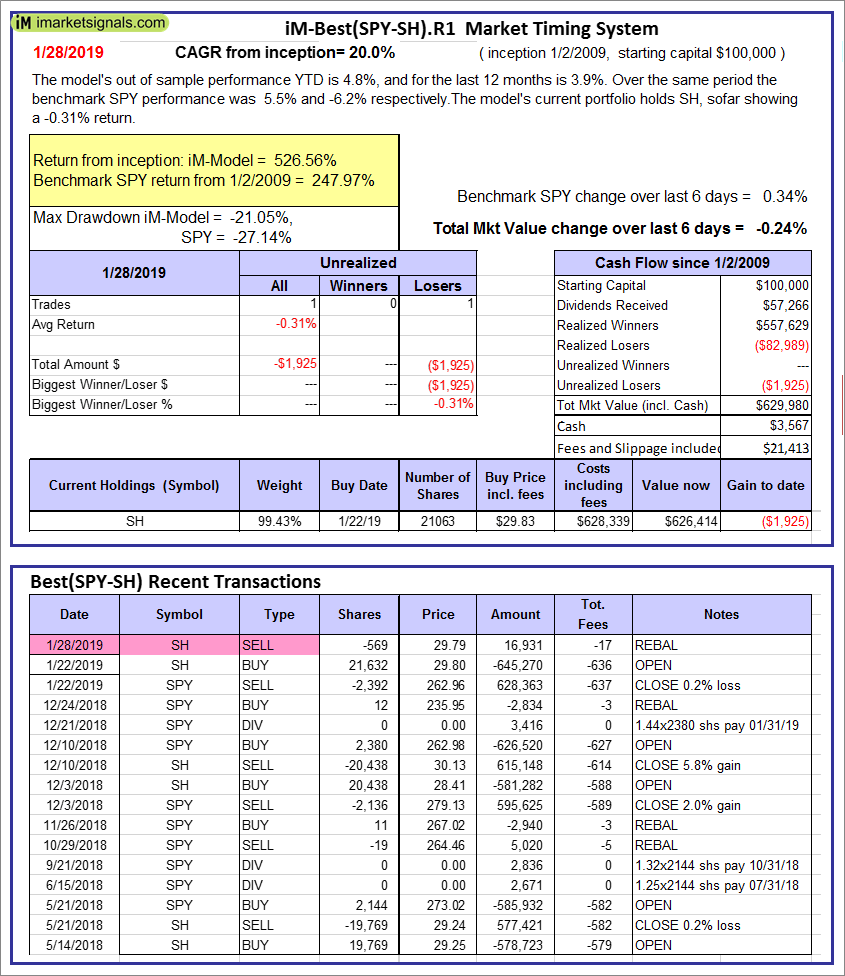 |
iM-Best(SPY-SH).R1: The model’s out of sample performance YTD is 4.8%, and for the last 12 months is 3.9%. Over the same period the benchmark SPY performance was 5.5% and -6.2% respectively. Over the previous week the market value of Best(SPY-SH) gained -0.24% at a time when SPY gained 0.34%. A starting capital of $100,000 at inception on 1/2/2009 would have grown to $629,980 which includes $3,567 cash and excludes $21,413 spent on fees and slippage. |
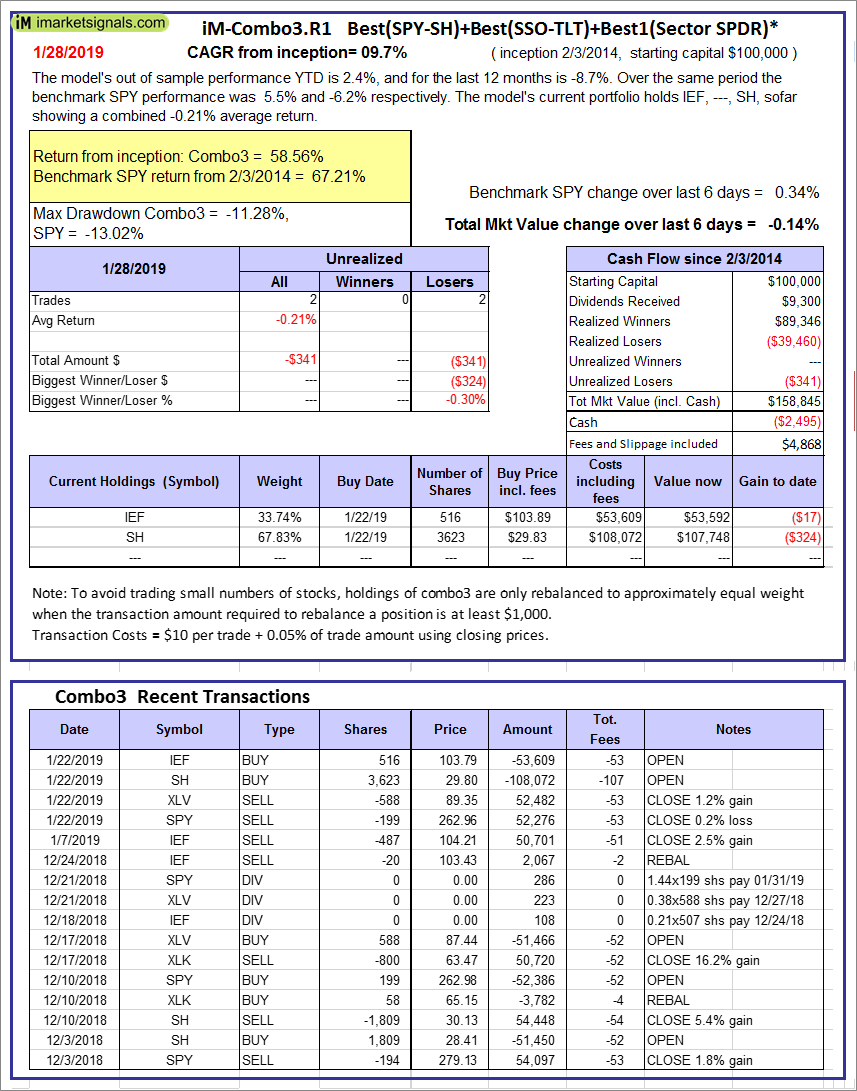 |
iM-Combo3.R1: The model’s out of sample performance YTD is 2.4%, and for the last 12 months is -8.7%. Over the same period the benchmark SPY performance was 5.5% and -6.2% respectively. Over the previous week the market value of iM-Combo3.R1 gained -0.14% at a time when SPY gained 0.34%. A starting capital of $100,000 at inception on 2/3/2014 would have grown to $158,845 which includes -$2,495 cash and excludes $4,868 spent on fees and slippage. |
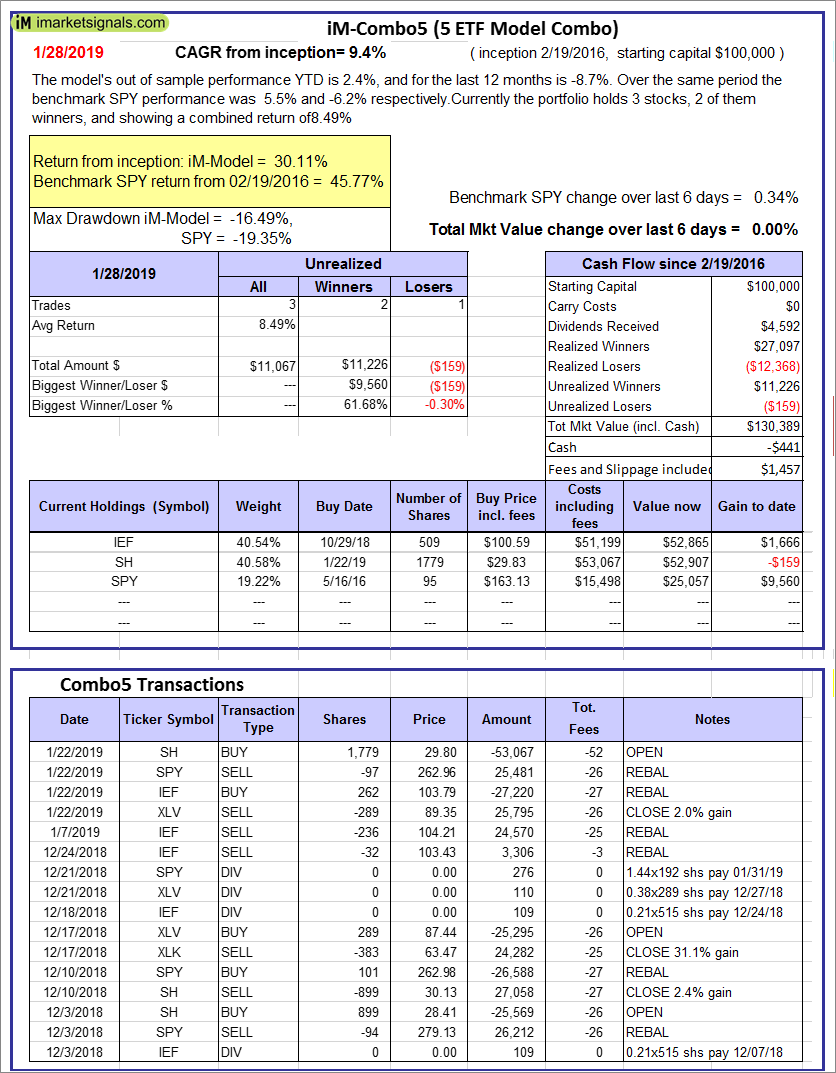 |
iM-Combo5: The model’s out of sample performance YTD is 2.4%, and for the last 12 months is -8.7%. Over the same period the benchmark SPY performance was 5.5% and -6.2% respectively. Over the previous week the market value of iM-Combo5 gained 0.00% at a time when SPY gained 0.34%. A starting capital of $100,000 at inception on 2/22/2016 would have grown to $130,389 which includes -$441 cash and excludes $1,457 spent on fees and slippage. |
 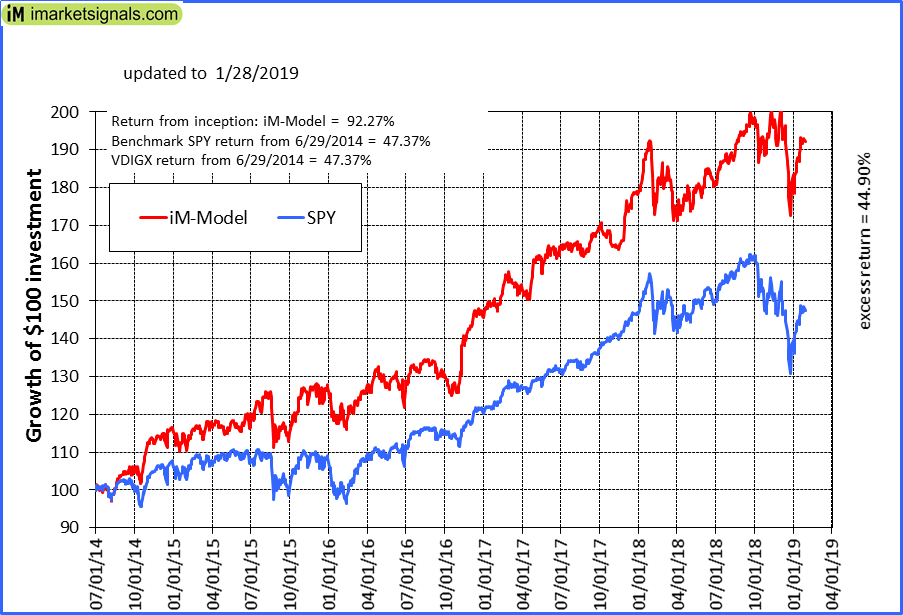 |
iM-Best10(VDIGX)-Trader: The model’s out of sample performance YTD is 4.8%, and for the last 12 months is -0.1%. Over the same period the benchmark SPY performance was 5.5% and -6.2% respectively. Since inception, on 7/1/2014, the model gained 92.27% while the benchmark SPY gained 47.37% and VDIGX gained 47.37% over the same period. Over the previous week the market value of iM-Best10(VDIGX) gained 0.38% at a time when SPY gained 0.34%. A starting capital of $100,000 at inception on 7/1/2014 would have grown to $192,273 which includes $564 cash and excludes $2,423 spent on fees and slippage. |
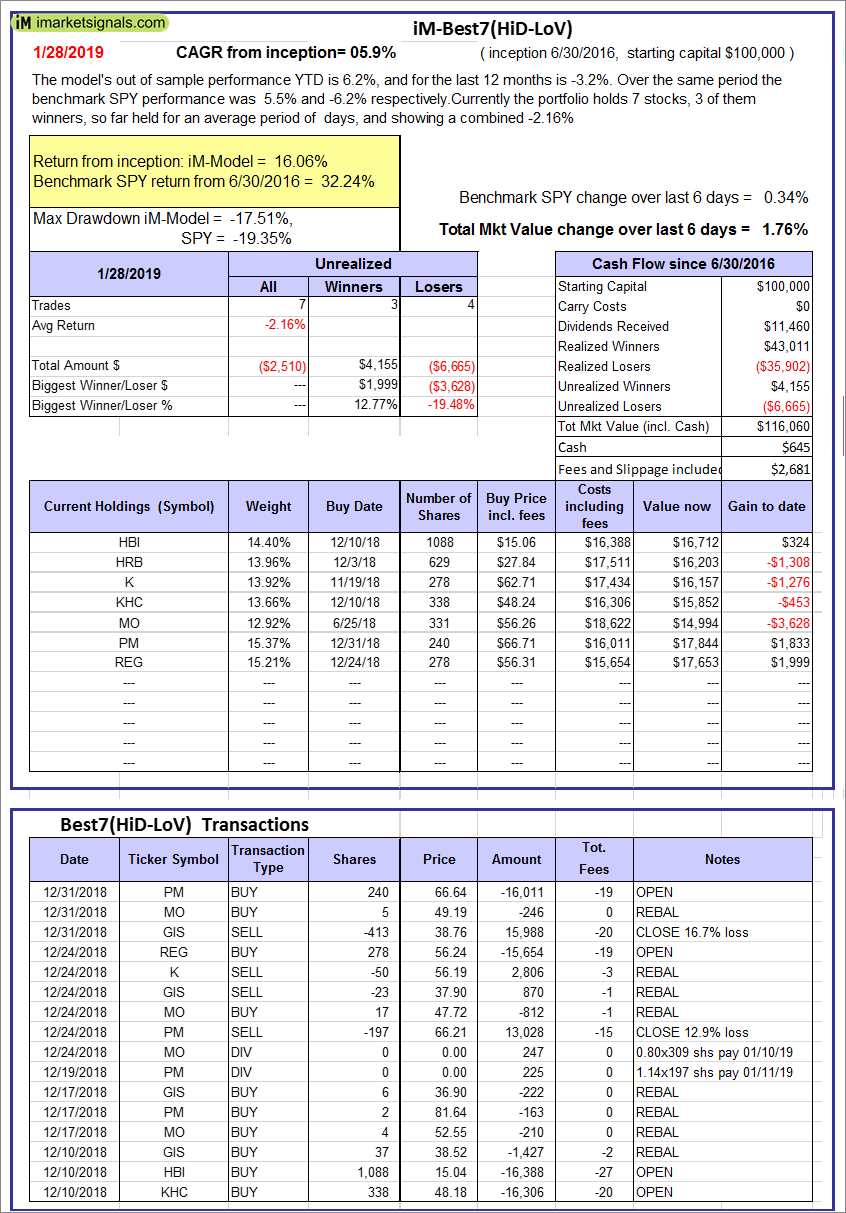 |
iM-Best7(HiD-LoV): The model’s out of sample performance YTD is 6.2%, and for the last 12 months is -3.2%. Over the same period the benchmark SPY performance was 5.5% and -6.2% respectively. Over the previous week the market value of iM-BESTOGA-3 gained 1.76% at a time when SPY gained 0.34%. A starting capital of $100,000 at inception on 6/30/2016 would have grown to $116,060 which includes $645 cash and excludes $2,681 spent on fees and slippage. |
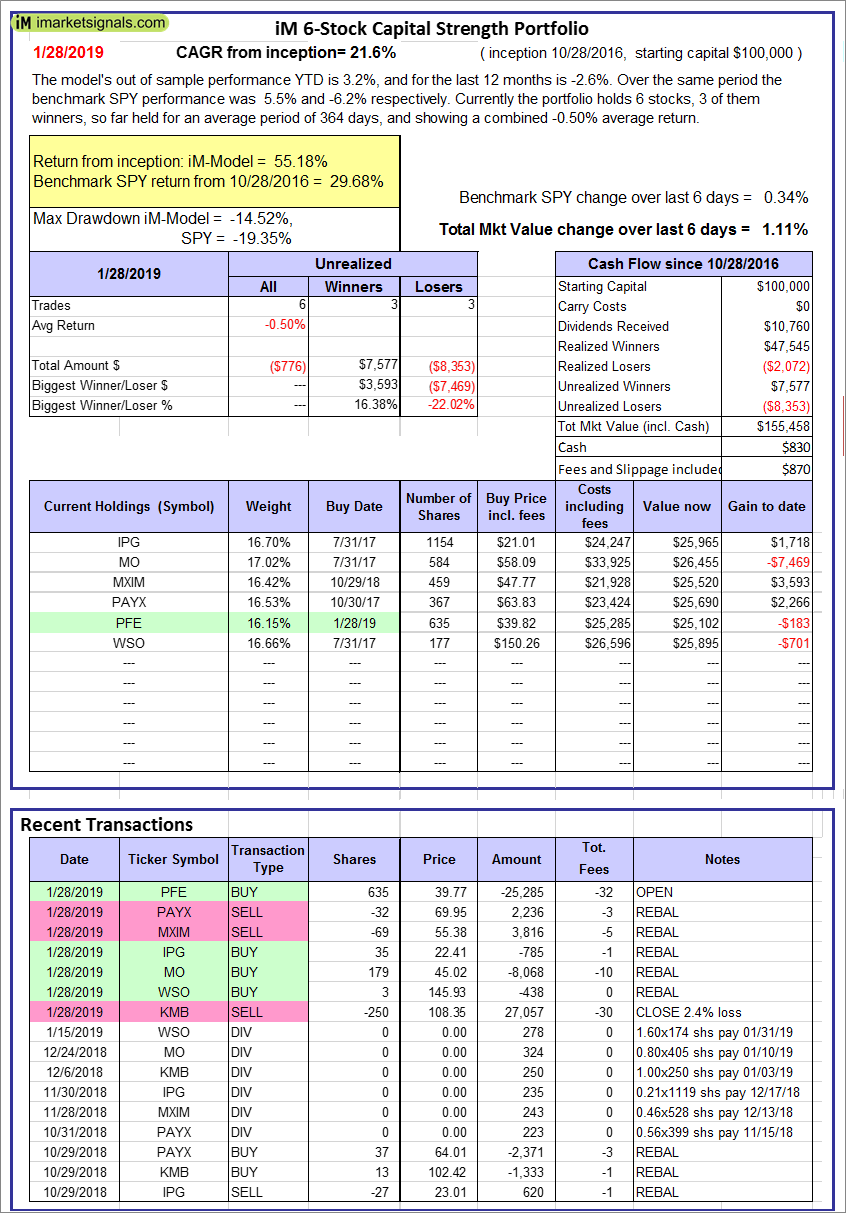 |
iM 6-Stock Capital Strength Portfolio: The model’s out of sample performance YTD is 3.2%, and for the last 12 months is -2.6%. Over the same period the benchmark SPY performance was 5.5% and -6.2% respectively. Over the previous week the market value of the iM 6-Stock Capital Strength Portfolio gained 1.11% at a time when SPY gained 0.34%. A starting capital of $100,000 at inception on 10/28/2016 would have grown to $155,458 which includes $830 cash and excludes $870 spent on fees and slippage. |
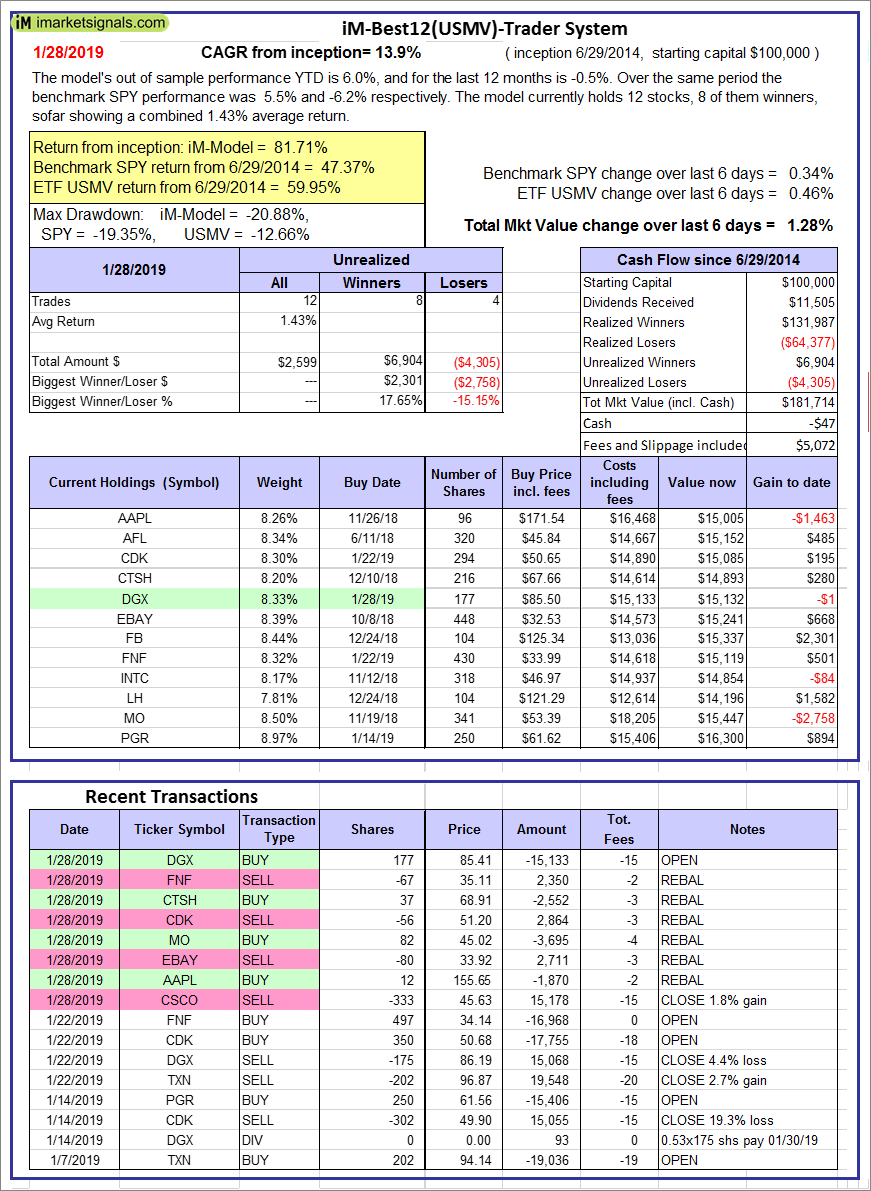 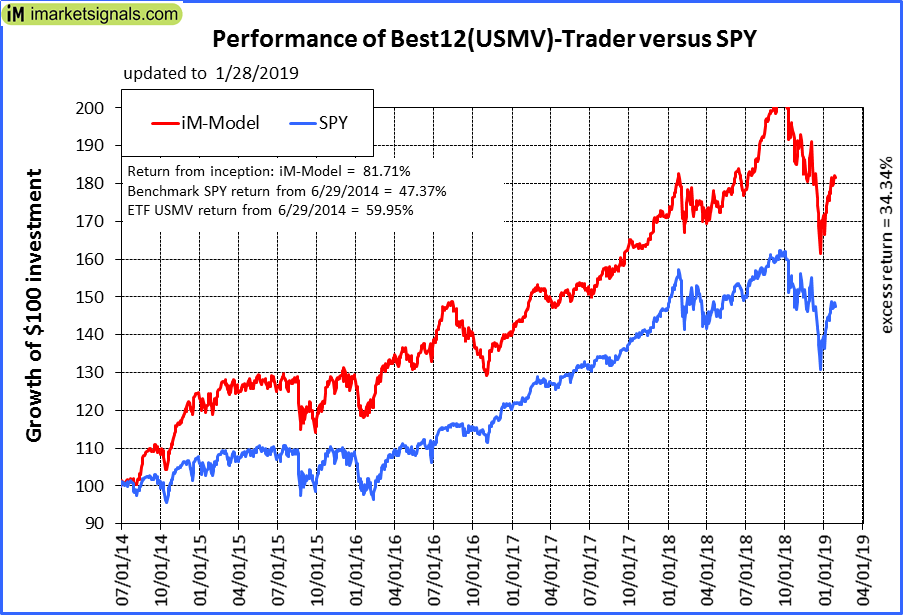 |
iM-Best12(USMV)-Trader: The model’s out of sample performance YTD is 6.0%, and for the last 12 months is -0.5%. Over the same period the benchmark SPY performance was 5.5% and -6.2% respectively. Since inception, on 6/30/2014, the model gained 81.71% while the benchmark SPY gained 47.37% and the ETF USMV gained 59.95% over the same period. Over the previous week the market value of iM-Best12(USMV)-Trader gained 1.28% at a time when SPY gained 0.34%. A starting capital of $100,000 at inception on 6/30/2014 would have grown to $181,714 which includes -$47 cash and excludes $5,072 spent on fees and slippage. |
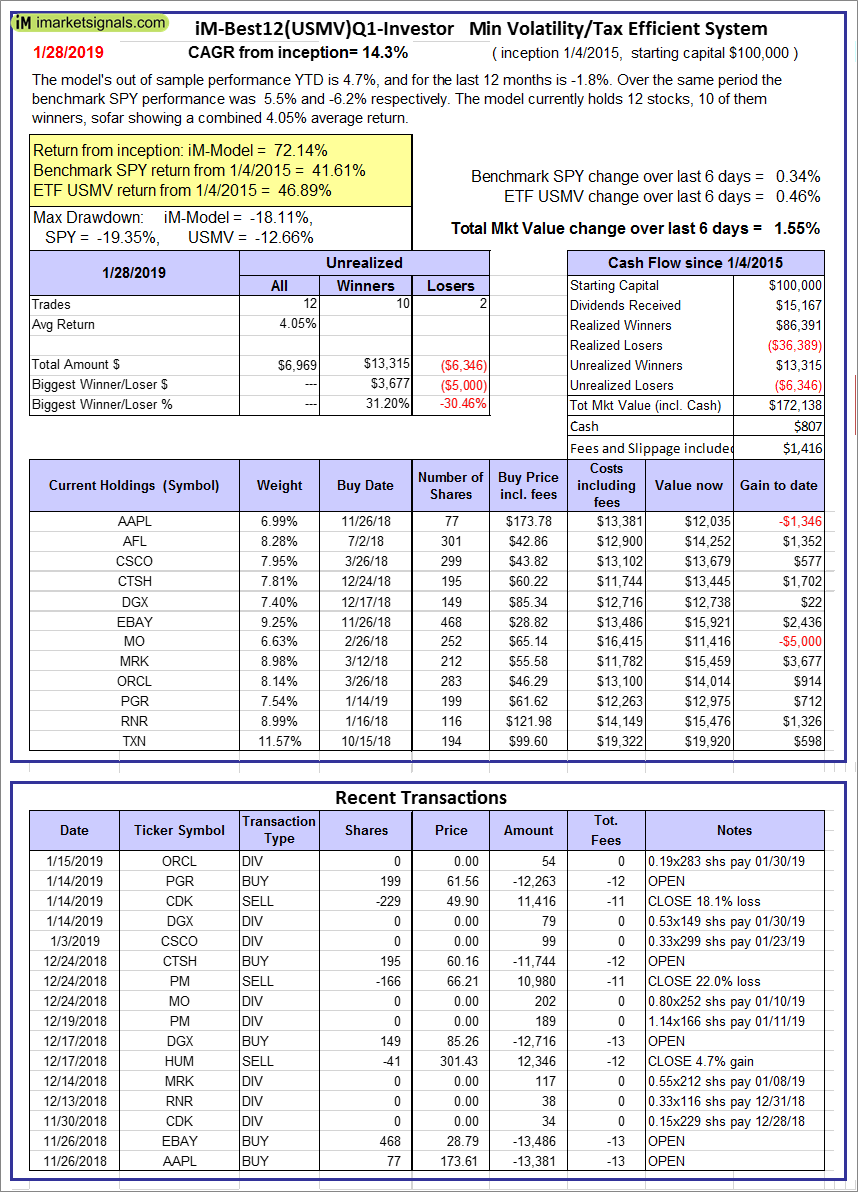 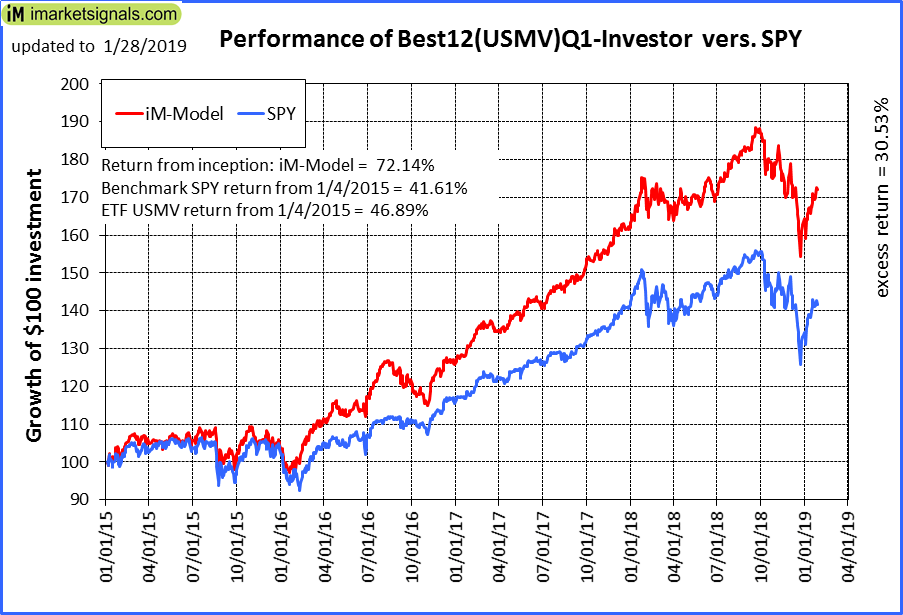 |
iM-Best12(USMV)Q1-Investor: The model’s out of sample performance YTD is 4.7%, and for the last 12 months is -1.8%. Over the same period the benchmark SPY performance was 5.5% and -6.2% respectively. Since inception, on 1/5/2015, the model gained 72.14% while the benchmark SPY gained 41.61% and the ETF USMV gained 46.89% over the same period. Over the previous week the market value of iM-Best12(USMV)Q1 gained 1.55% at a time when SPY gained 0.34%. A starting capital of $100,000 at inception on 1/5/2015 would have grown to $172,138 which includes $807 cash and excludes $1,416 spent on fees and slippage. |
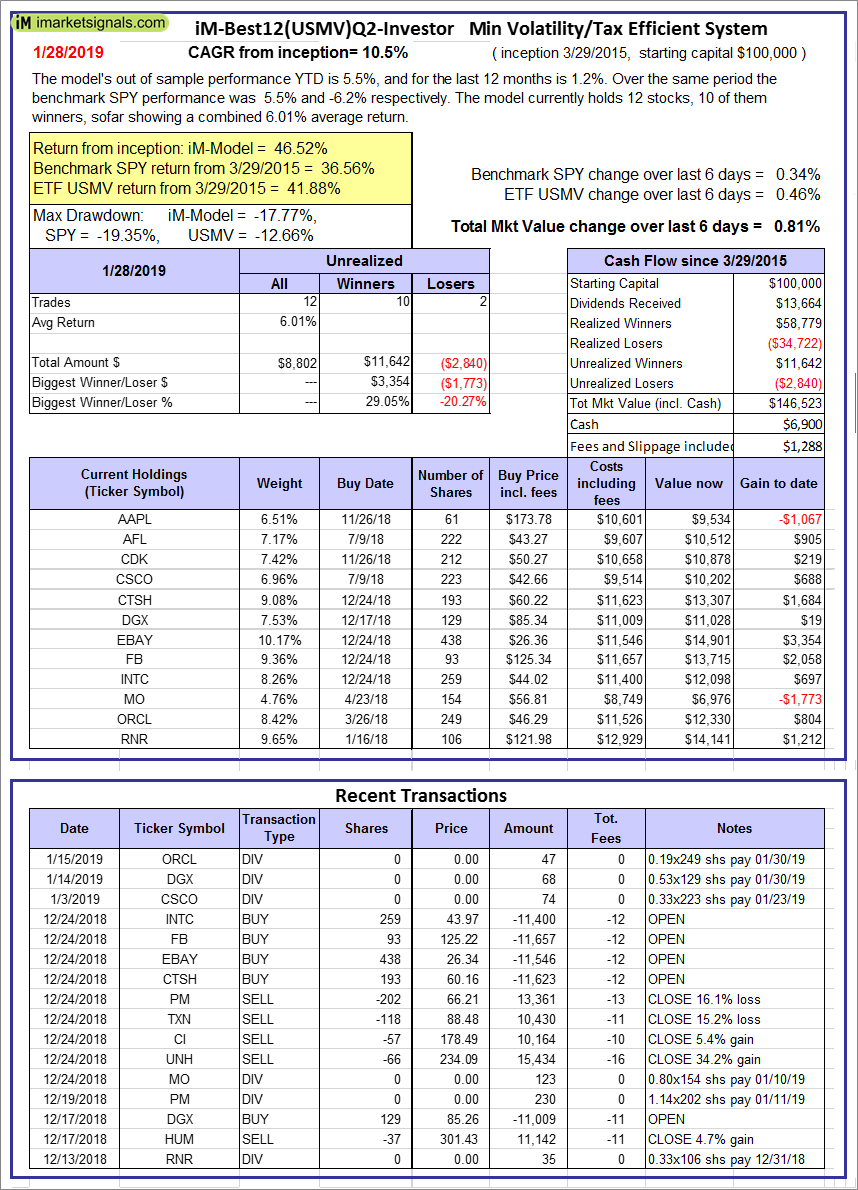 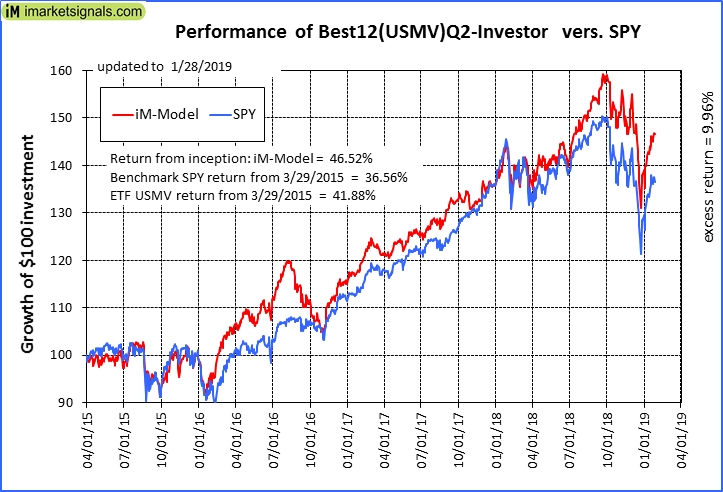 |
iM-Best12(USMV)Q2-Investor: The model’s out of sample performance YTD is 5.5%, and for the last 12 months is 1.2%. Over the same period the benchmark SPY performance was 5.5% and -6.2% respectively. Since inception, on 3/30/2015, the model gained 46.52% while the benchmark SPY gained 36.56% and the ETF USMV gained 41.88% over the same period. Over the previous week the market value of iM-Best12(USMV)Q2 gained 0.81% at a time when SPY gained 0.34%. A starting capital of $100,000 at inception on 3/30/2015 would have grown to $146,523 which includes $6,900 cash and excludes $1,288 spent on fees and slippage. |
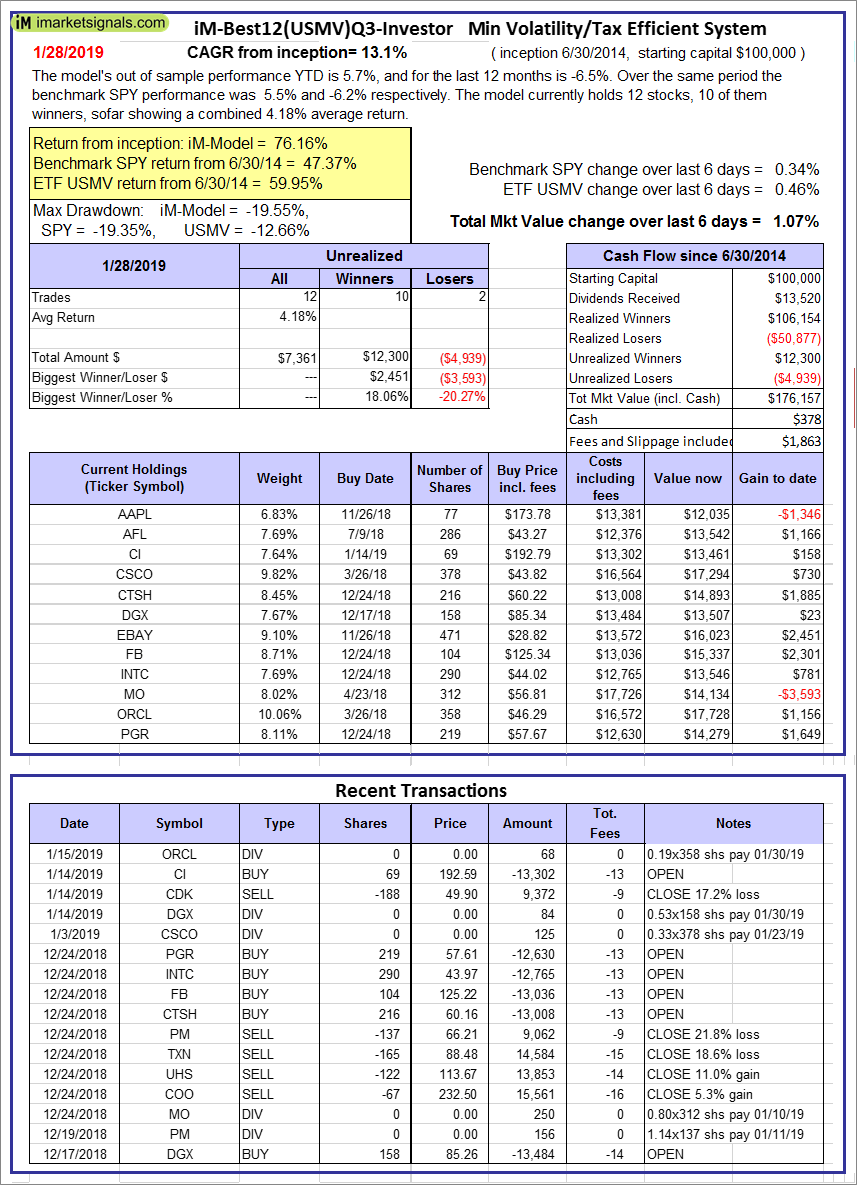 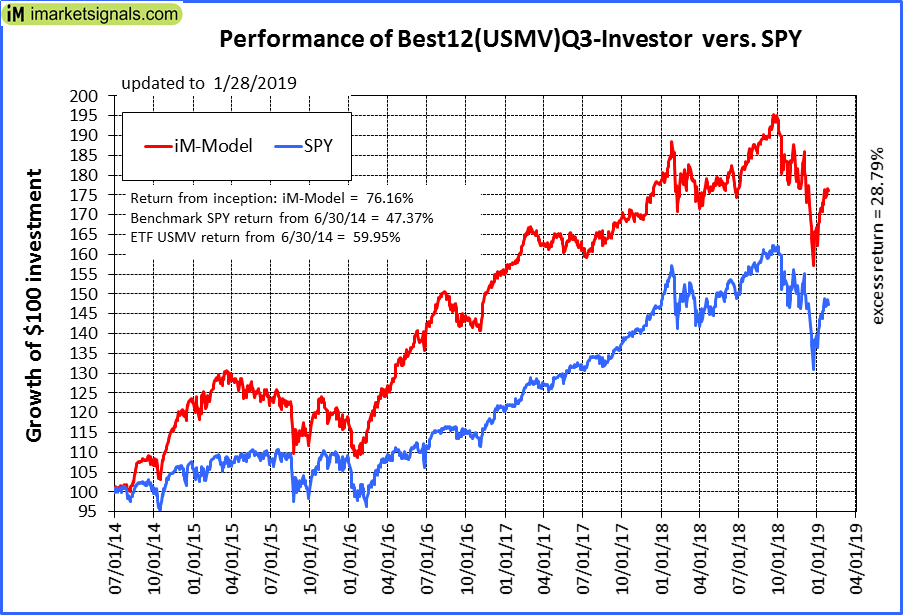 |
iM-Best12(USMV)Q3-Investor: The model’s out of sample performance YTD is 5.7%, and for the last 12 months is -6.5%. Over the same period the benchmark SPY performance was 5.5% and -6.2% respectively. Since inception, on 7/1/2014, the model gained 76.16% while the benchmark SPY gained 47.37% and the ETF USMV gained 59.95% over the same period. Over the previous week the market value of iM-Best12(USMV)Q3 gained 1.07% at a time when SPY gained 0.34%. A starting capital of $100,000 at inception on 7/1/2014 would have grown to $176,157 which includes $378 cash and excludes $1,863 spent on fees and slippage. |
 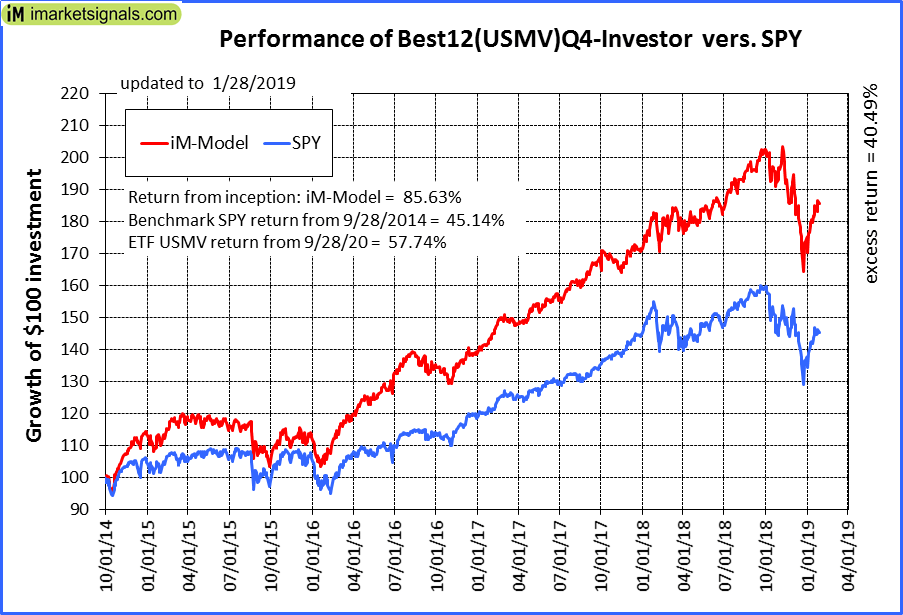 |
iM-Best12(USMV)Q4-Investor: Since inception, on 9/29/2014, the model gained 85.63% while the benchmark SPY gained 45.14% and the ETF USMV gained 57.74% over the same period. Over the previous week the market value of iM-Best12(USMV)Q4 gained 1.19% at a time when SPY gained 0.34%. A starting capital of $100,000 at inception on 9/29/2014 would have grown to $185,626 which includes -$1,727 cash and excludes $1,696 spent on fees and slippage. |
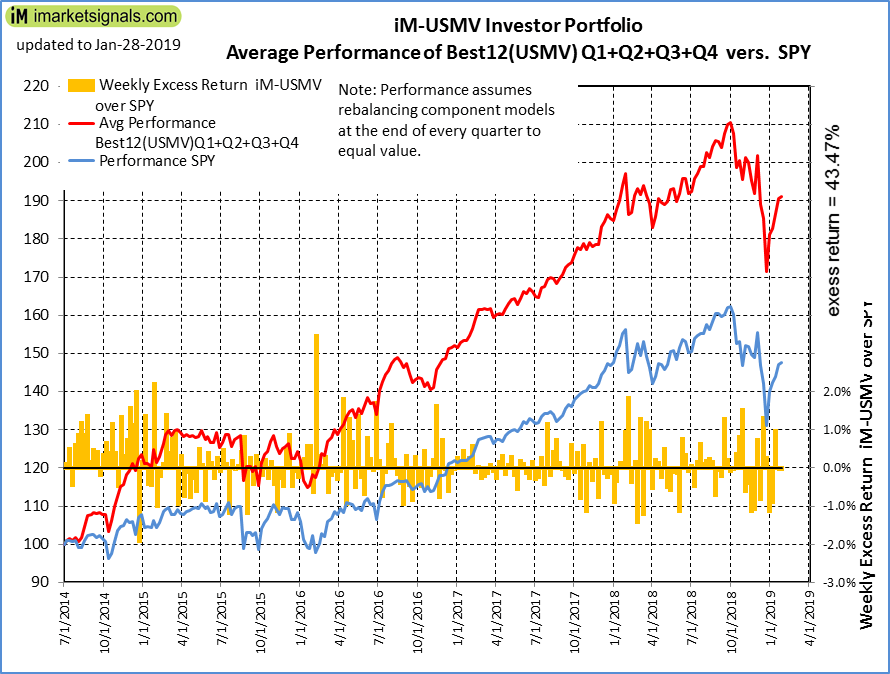 |
Average Performance of iM-Best12(USMV)Q1+Q2+Q3+Q4-Investor resulted in an excess return of 43.47% over SPY. (see iM-USMV Investor Portfolio) |
 |
iM-Best(Short): The model’s out of sample performance YTD is -9.2%, and for the last 12 months is -10.3%. Over the same period the benchmark SPY performance was 5.5% and -6.2% respectively. Over the previous week the market value of iM-Best(Short) gained -2.81% at a time when SPY gained 0.34%. Over the period 1/2/2009 to 1/28/2019 the starting capital of $100,000 would have grown to $80,836 which includes $80,836 cash and excludes $25,275 spent on fees and slippage. |
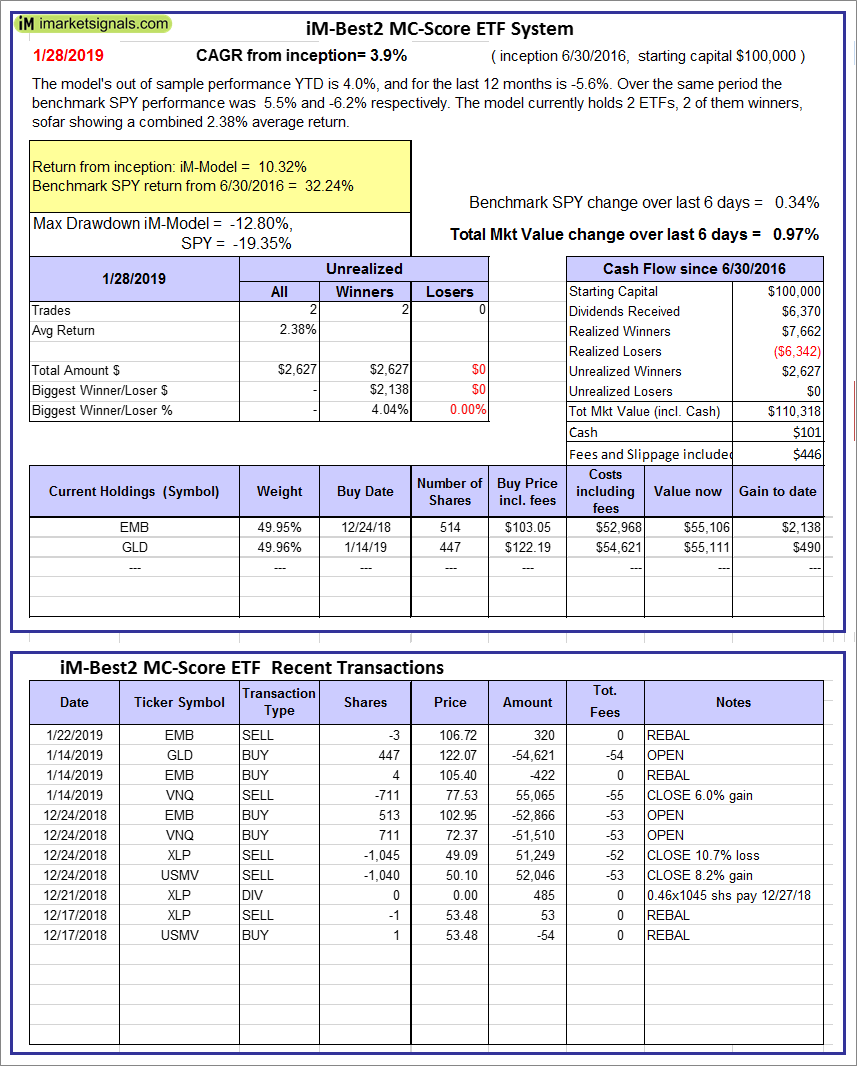 |
iM-Best2 MC-Score ETF System: The model’s out of sample performance YTD is 4.0%, and for the last 12 months is -5.6%. Over the same period the benchmark SPY performance was 5.5% and -6.2% respectively. Over the previous week the market value of the iM-Best2 MC-Score ETF System gained 0.97% at a time when SPY gained 0.34%. A starting capital of $100,000 at inception on 6/30/2016 would have grown to $110,318 which includes $101 cash and excludes $446 spent on fees and slippage. |
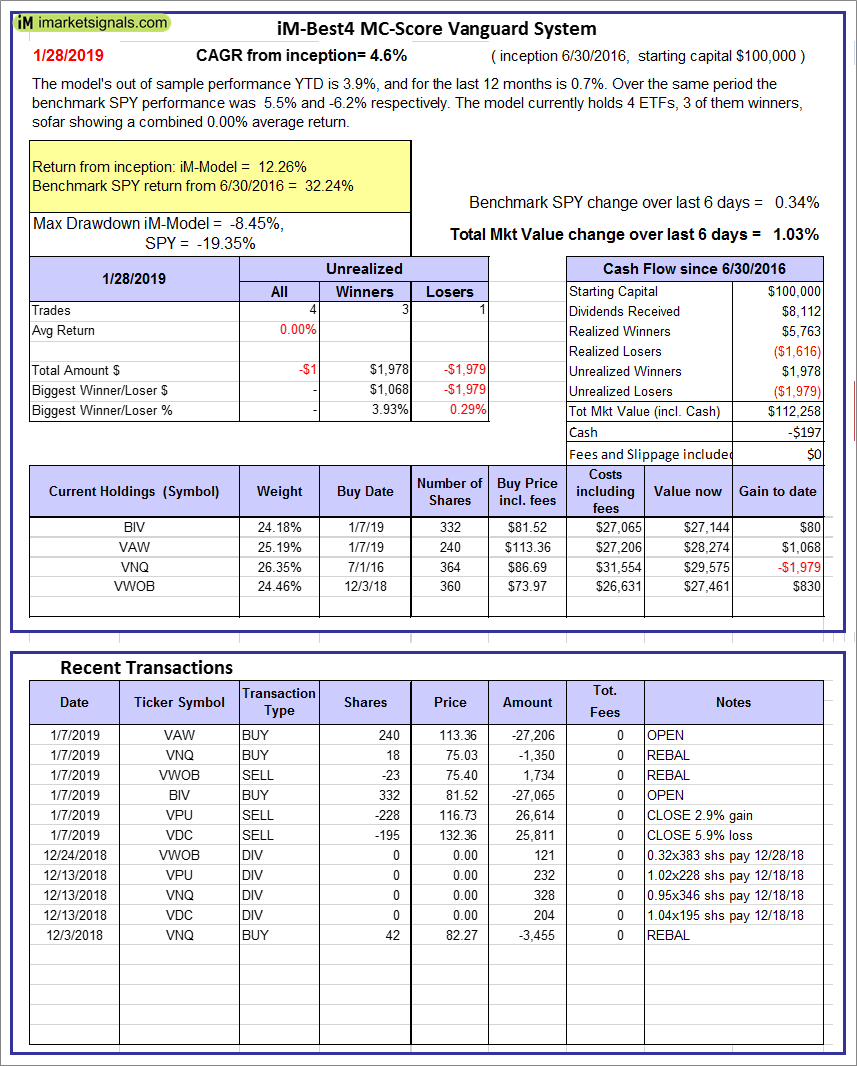 |
iM-Best4 MC-Score Vanguard System: The model’s out of sample performance YTD is 3.9%, and for the last 12 months is 0.7%. Over the same period the benchmark SPY performance was 5.5% and -6.2% respectively. Over the previous week the market value of the iM-Best4 MC-Score Vanguard System gained 1.03% at a time when SPY gained 0.34%. A starting capital of $100,000 at inception on 6/30/2016 would have grown to $112,258 which includes -$197 cash and excludes $00 spent on fees and slippage. |
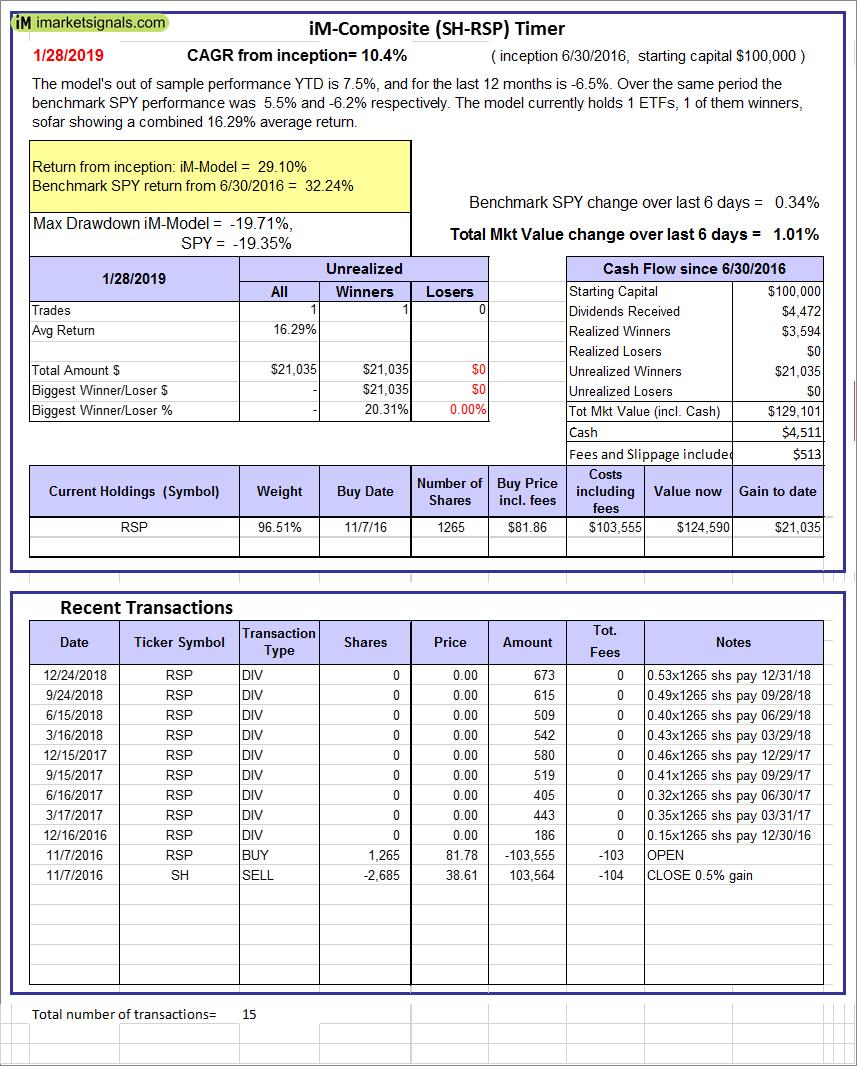 |
iM-Composite (SH-RSP) Timer: The model’s out of sample performance YTD is 7.5%, and for the last 12 months is -6.5%. Over the same period the benchmark SPY performance was 5.5% and -6.2% respectively. Over the previous week the market value of the iM-Composite (SH-RSP) Timer gained 1.01% at a time when SPY gained 0.34%. A starting capital of $100,000 at inception on 6/30/2016 would have grown to $129,101 which includes $4,511 cash and excludes $513 spent on fees and slippage. |
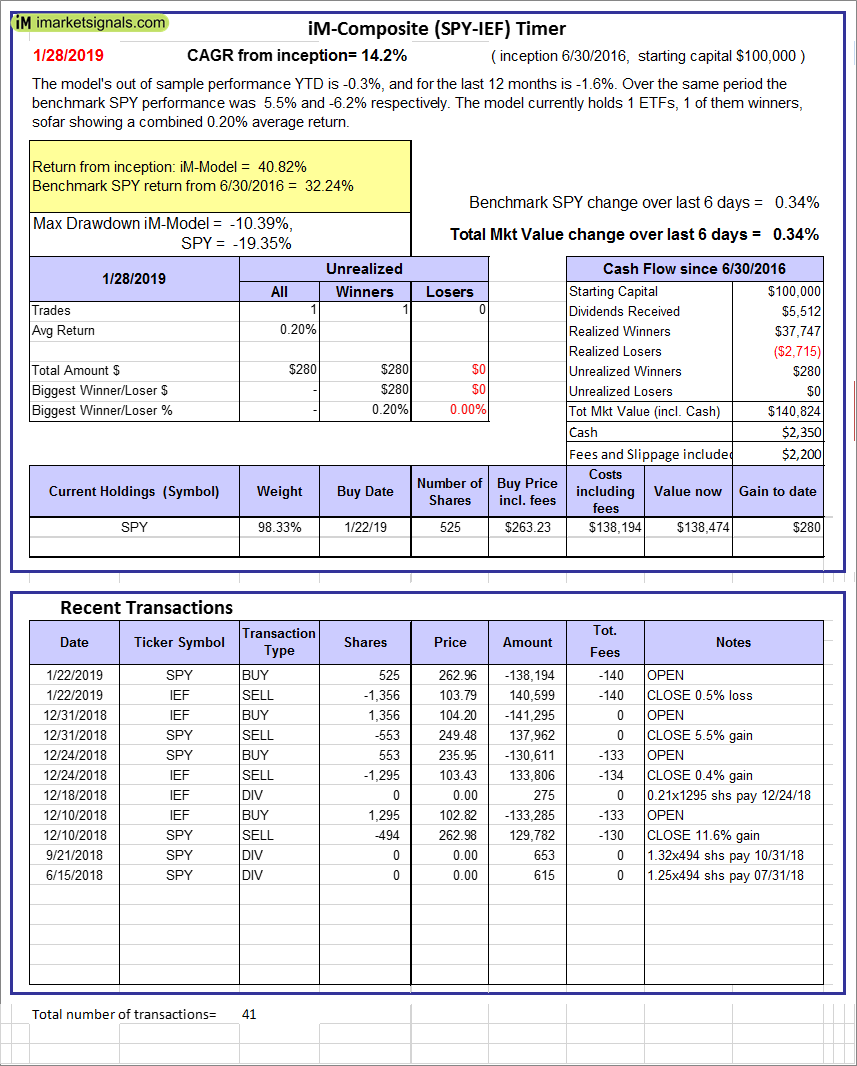 |
iM-Composite (SPY-IEF) Timer: The model’s out of sample performance YTD is -0.3%, and for the last 12 months is -1.6%. Over the same period the benchmark SPY performance was 5.5% and -6.2% respectively. Over the previous week the market value of the iM-Composite (SPY-IEF) Timer gained 0.34% at a time when SPY gained 0.34%. A starting capital of $100,000 at inception on 6/30/2016 would have grown to $140,824 which includes $2,350 cash and excludes $2,200 spent on fees and slippage. |
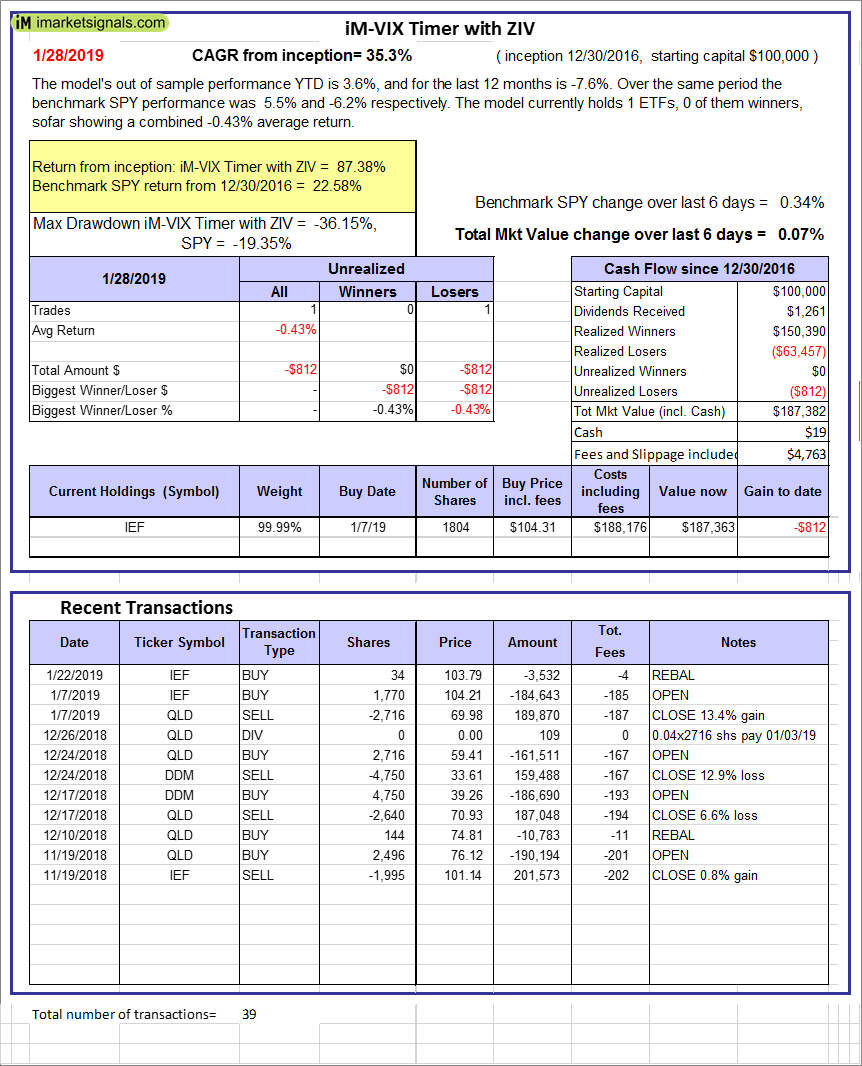 |
iM-VIX Timer with ZIV: The model’s out of sample performance YTD is 3.6%, and for the last 12 months is -7.6%. Over the same period the benchmark SPY performance was 5.5% and -6.2% respectively. Over the previous week the market value of the iM-VIX Timer with ZIV gained 0.07% at a time when SPY gained 0.34%. A starting capital of $100,000 at inception on 6/30/2016 would have grown to $187,382 which includes $19 cash and excludes $4,763 spent on fees and slippage. |
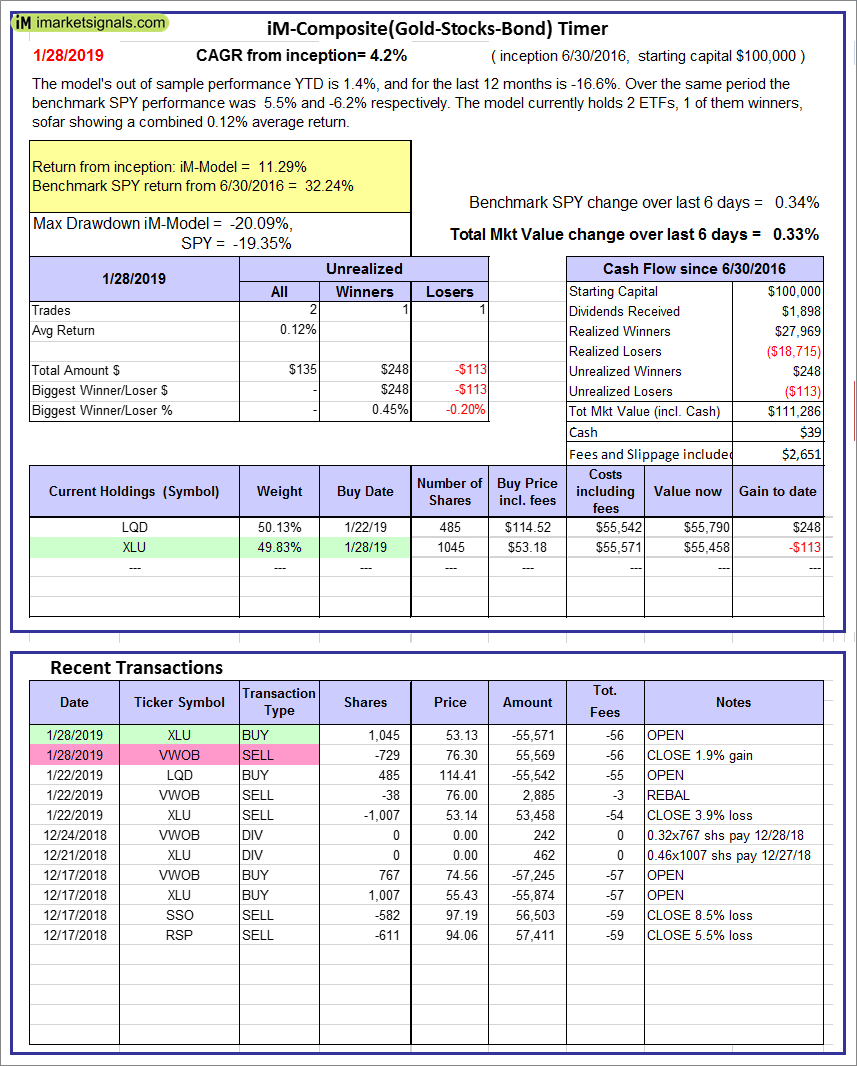 |
iM-Composite(Gold-Stocks-Bond) Timer: The model’s out of sample performance YTD is 1.4%, and for the last 12 months is -16.6%. Over the same period the benchmark SPY performance was 5.5% and -6.2% respectively. Over the previous week the market value of the iM-Composite(Gold-Stocks-Bond) Timer gained 0.33% at a time when SPY gained 0.34%. A starting capital of $100,000 at inception on 6/30/2016 would have grown to $111,286 which includes $39 cash and excludes $2,651 spent on fees and slippage. |
 |
iM-Low Turnover Composite Timer Combo: The model’s out of sample performance YTD is 2.3%, and for the last 12 months is -10.5%. Over the same period the benchmark SPY performance was 5.5% and -6.2% respectively. Over the previous week the market value of the iM-Low Turnover Composite Timer Combo gained 0.73% at a time when SPY gained 0.34%. A starting capital of $100,000 at inception on 3/24/27 would have grown to $98,562 which includes $777 cash and excludes $472 spent on fees and slippage. |
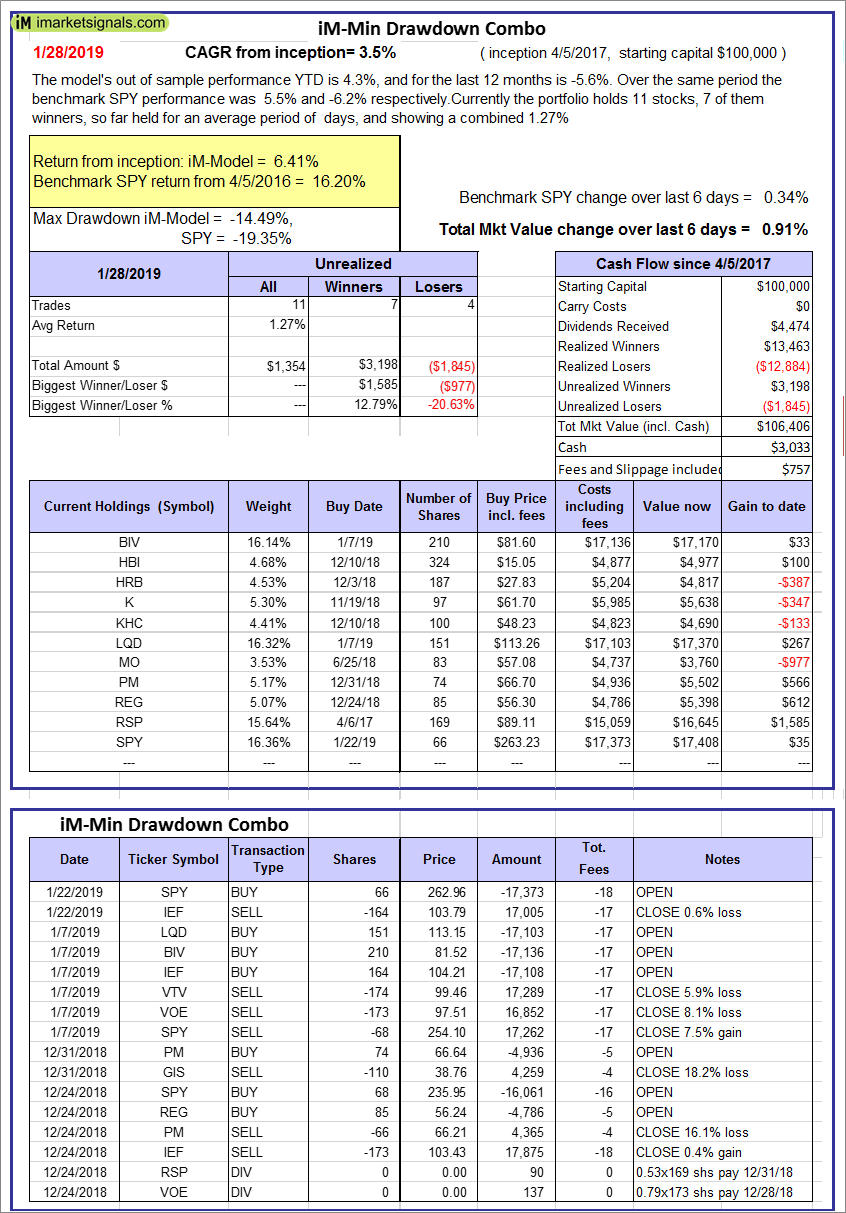 |
iM-Min Drawdown Combo: The model’s out of sample performance YTD is 4.3%, and for the last 12 months is -5.6%. Over the same period the benchmark SPY performance was 5.5% and -6.2% respectively. Over the previous week the market value of the iM-Min Drawdown Combo gained 0.91% at a time when SPY gained 0.34%. A starting capital of $100,000 at inception on 4/5/2017 would have grown to $106,406 which includes $3,033 cash and excludes $757 spent on fees and slippage. |
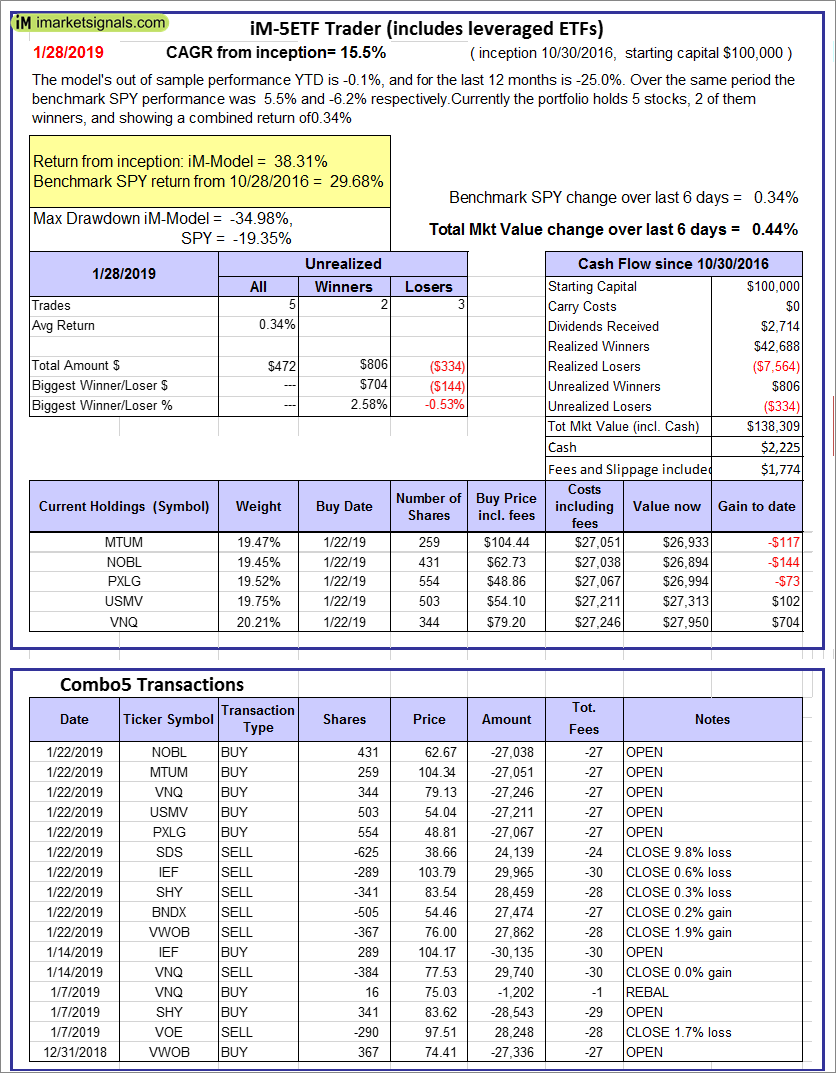 |
iM-5ETF Trader (includes leveraged ETFs): The model’s out of sample performance YTD is -0.1%, and for the last 12 months is -25.0%. Over the same period the benchmark SPY performance was 5.5% and -6.2% respectively. Over the previous week the market value of the iM-5ETF Trader (includes leveraged ETFs) gained 0.44% at a time when SPY gained 0.34%. A starting capital of $100,000 at inception on 10/30/2016 would have grown to $138,309 which includes $2,225 cash and excludes $1,774 spent on fees and slippage. |
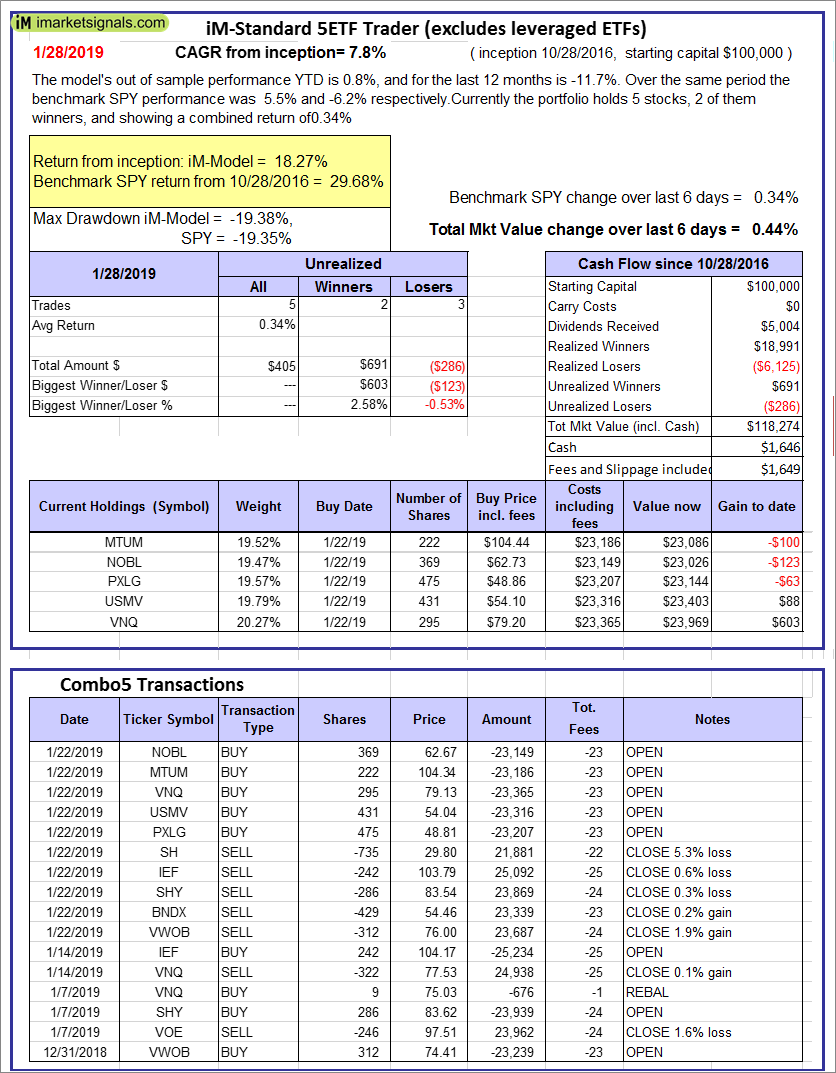 |
iM-Standard 5ETF Trader (excludes leveraged ETFs): The model’s out of sample performance YTD is 0.8%, and for the last 12 months is -11.7%. Over the same period the benchmark SPY performance was 5.5% and -6.2% respectively. Over the previous week the market value of the iM-Standard 5ETF Trader (excludes leveraged ETFs) gained 0.44% at a time when SPY gained 0.34%. A starting capital of $100,000 at inception on 10/30/2016 would have grown to $118,274 which includes $1,646 cash and excludes $1,649 spent on fees and slippage. |
iM-Best Reports – 1/28/2019
Posted in pmp SPY-SH
Leave a Reply
You must be logged in to post a comment.