
- The iM-Best10(VDIGX)-Trader periodically invests in the ten highest ranked stocks of VDIGX which currently holds 45 large-cap stocks.
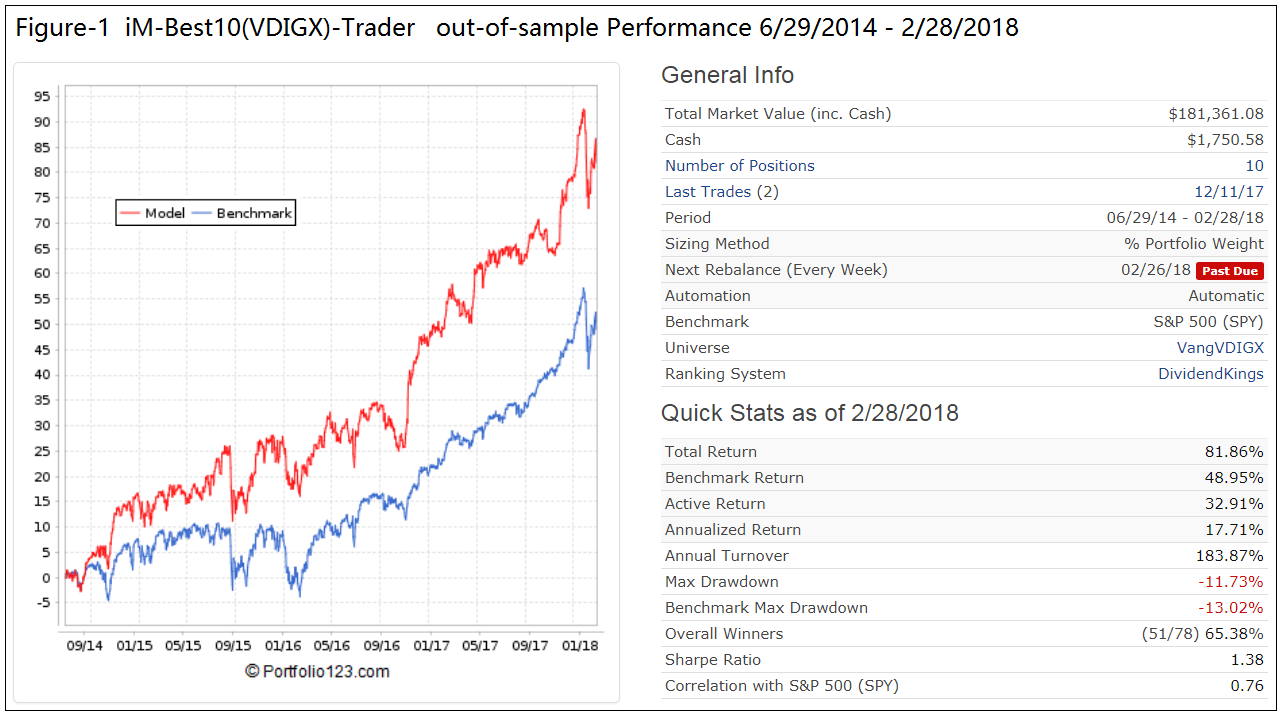
- This strategy, postulated in 2014, has produced from end of Jun-2014 to end of Feb-2018 an annualized return of 17.7% versus 9.9% for VDIGX, and 11.5% for SPY.
- We have now changed the trading rules and ranking system which we believe will provide improved returns with low turnover in the future.
According to Vanguard, the Dividend Growth Fund “focuses on high-quality companies that have both the ability and the commitment to grow their dividends over time and seeks above-average current income and long-term growth of capital and income. The advisor, Wellington Management Company, LLP, invests in a diversified array of stable, well-managed companies that have a history of or a potential for growing dividends over time. Valuation is key to security selection, with the advisor preferring stocks that trade at a discount to the market or that possess an attractive risk/reward profile.”
In this 2014 article we showed by backtesting that better returns than those from the fund could be obtained by applying a ranking system to the stock holding of VDIGX (the universe), and investing periodically only in the ten highest ranked stocks, bought and sold according to certain rules.
For the live model all rules remained the same as for the original simulation, except that the model’s universe was periodically updated with the stock holding of VDIGX which Vanguard publishes approximately every three months. Three years later in this 2017 update article we showed that our initial assumption was correct.
The model assumes an initial investment of $100,000 and runs on the on-line platform Portfolio 123. Trading costs, including slippage was taken as variable, which amounts to approximately 0.10% to 0.15% of trade amounts.
Performance
The iM-Best10(VDIGX)-Trader is now 3.75 years old, and since Dec-2014 we have published trade signals, holdings and performance on our website iMarketSignals.com. The most recent performance to Feb-28-2018 is shown in Figure-1.
In the figure the red graph represents the performance of the Trader and the blue graph shows the performance of the benchmark, the SPDR S&P 500 ETF (SPY).
| Value 6/29/2014 |
Value 2/28/2018 |
Annualized Return |
|
| VDIGX | 100.00 | 141.23 | 9.9% |
| SPY | 100.00 | 148.95 | 11.5% |
| iM-Best10(VDIGX)-Trader | 100.00 | 181.86 | 17.7% |
Simulated Performance with new Rules and Ranking System
At iMarketSignals we strive to improve our models, if possible.
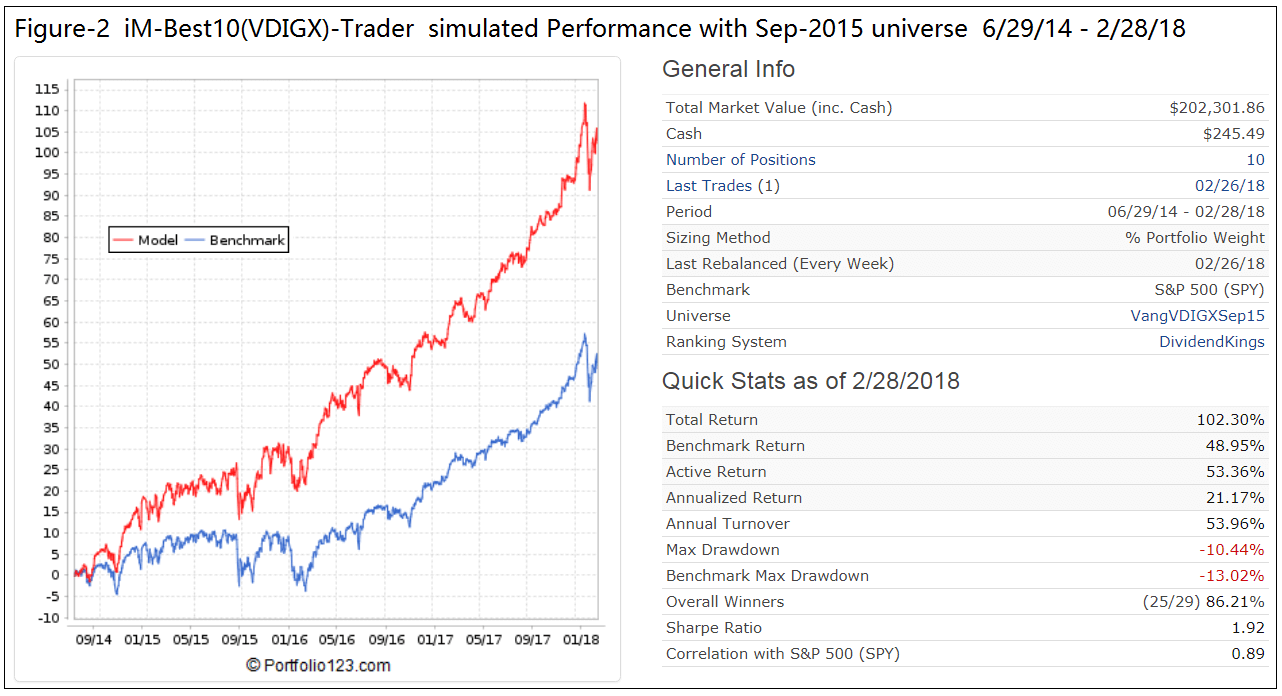
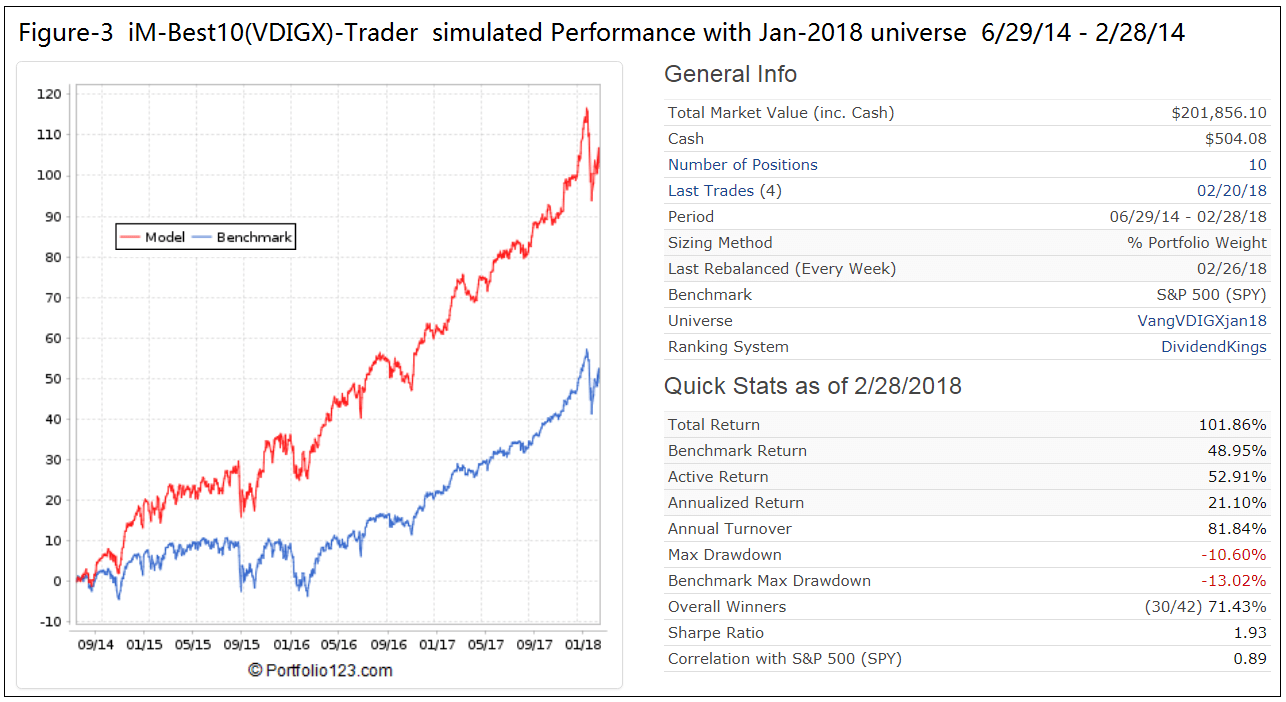
Figure-2 and Figure-3 are taken from Portfolio 123 and give simulated performance statistics from 6/29/2014 to 2/28/2018 using the VDIGX universes from Sep-2015 and Jan-2018, respectively. Both simulations show similar characteristics because the VDIGX holdings do not change much over time.
The improvements are:
- The simulated annualized return is 21.1%, a big improvement over the actual 17.7 % return achieved so far.
- The Annual Turnover is now about 50% versus 180% for the original model. Fewer trades provide better returns.
- The performance curve is a lot smoother, and Sharpe Ratio is about 1.9 versus 1.4 for the original model.
Conclusion
Only investing periodically in the ten highest ranked stocks of VDIGX has produced much better returns over the last 3.75 years than the fund itself. Using a new ranking system to rank the stock holdings of VDIGX and new trading rules should provide better returns in the future.
Following the Models
At our website iM imarketsignals.com one can follow the weekly performance update of the iM-Best10(VDIGX)-Trader.
Disclaimer
The performance data shown represent past performance, which is not a guarantee of future results. Investment returns and portfolio value will fluctuate, so stocks when sold may be worth more or less than their original cost. Future performance may be lower or higher than the performance data cited.
Hi there,
Glad you’re looking for improvements.
What is the Sortino ratio of the original vs revisions?
This isn’t a criticism but is there a risk that the new ranking system is some form of cherrypicking/luck? Just looking for your thoughts here.
Thanks.
Could you review the trading rules? Are you doing less turnover but still re-balance each time you sell/buy?
Re-balance to the 10% with New holdings?